29
TYPES OF STATISTICAL METHODS USED IN PSYCHOLOGY Statistics
| Date post: | 03-Jan-2016 |
| Category: |
Documents |
| Upload: | cassandra-walker |
| View: | 222 times |
| Download: | 4 times |

TYPES OF STATISTICAL METHODS USED IN
PSYCHOLOGY
Statistics

Definitions
Statistics is the use of mathematics to organize, summarize, and
interpret numerical data. It can be descriptive (organize and
summarize data) and inferential (interpret data and draw
conclusions)

Graphing Data:1. Frequency Distribution
An orderly arrangement of scoresindicating the frequency of each
score of a group of scores

2. Histogram
A bar graph that presents data from a frequency distribution

3. Frequency Polygon
A line figure used to represent data from a frequency distribution
a. Horizontal (X) axis- possible scoresb. Vertical (Y) axis- frequency of each
score

Scales of Measurement:
Nominal ScaleNominal Scale: a set of categories for classifying
objectsEx: Divide people in groups based on their
eye colorSince it only classifies and does not measure
anything, it is the least informative

Ordinal Scales
Scale indicating order of relative position of items according to some criteria (data rated first to last based on some criterion)Ex: Horse race- does not give details on how much faster the winning horse ran

Interval Scales
Scales with equal distances between the points or values but without a true zero

Ratio Scales
A scale that fits the number system
The scale has a true zero and equal intervals, just like the real number system
Examples: time, distance, number correct, weight, frequency of behavior
Produces score data

Measurements of Central Tendencies
When measuring the number of instances of any occurrences (Ex: height, weight, ratings of movies, etc), we get a distribution range.
The majority will usually cluster around the middle and the is the central tendency
They are measured by the mean or average, the mode and the median.
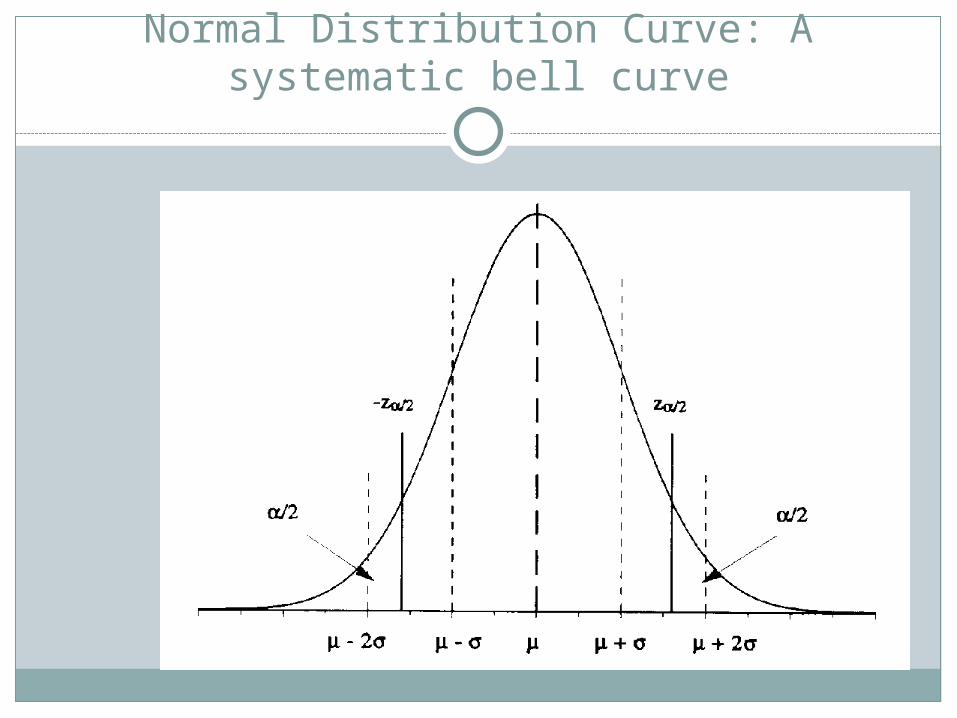
Normal Distribution Curve: A systematic bell curve

Normal Curve of Distribution
If you take enough measurements of almost everything we usually get a normal curve.
It will be ABSOLUTELY symmetrical with the left slope parallel to the right.
Mode, mean and median are the highest points on the curve

Skewed Distributions: Asymmetrical curve
Scores are gathered at either the high or low end—hump will sit to one side or the other& curve tail will be long.

Negative and Positive Skewed Distribution
Both types- a few extreme scores at one of the ends pull the mean and to a lesser extent the median away from the mode.
Mean can be misleadingWhich measure provides the BEST index for
scores?Where would the mean, mode and median
be located on a + or – distribution?

Bimodal Distributions: Two humps or clusters of data
Each hump indicates a mode; the mean and the median may be the same.
Ex: Survey of salaries- Might find most people checked the box for both $25,000-$35,000 AND $50,000-$60,000

Measures of VariationVariability: On a range of
scores (distance between the smallest and largest measurements in a distribution) how much do the scores tend to vary or depart from the mean scores
EX: golf scores of a mediocre, erratic golfer would be characterized by high variability while scores of a good consistent golfer would show less.

Standard Deviation: Statistical measure of variability in a group
It is a way to use a single number to indicate how the scores in a frequency distribution are dispersed around the mean.

Calculating the SD
Find the meanSubtract each score from the meanSquare the differenceAdd up the column of squared differencesDivide the sum of the squares by the
number of scores in the distribution (that number is the VARIANCE)
Find the square root of the number= SD

Results of the Standard Deviation
In a normal distribution, 68% of scores will fall between one deviation above & below the mean
Another 27% fall between one & two SD4% fall between two & three SDOverall, 99% of scores fall between 3 SD below
and above the meanEx: Appendix B B.7 (SAT scores) Mean is
arbitrarily at 500 and SD at 100. Same with IQ

Z SCORE
The number of SD you are from the deviation
Z = raw score- mean SDIf you are a bowling coach and you have to pick
one kid which one do you pick?Kid 1: 150 average SD 70Kid 2: 150 average SD 30 WHY?

Correlation: Two variable are related to each other with no causation
The strength of the correlation is defined with a statistic called the correlation coefficient (+1.00 to -1.00)
Positive- Indicates the two variables go in the same direction
EX: High school & GPA

Correlations
Negative correlations indicate two variable that go in the opposite directions
EX: Absences & Exam scores

Strength of the Correlation ( r)Numerical index of the degree of relationship
between two variable or the strength of the relationship.
Positive 0 to +1.00Negative 0 to -1.00Coefficient near zero indicates there is no
relationship between the variable ( one variable shows no consistent relationship to the other 50%)
Perfect correlation of +/- 1.00 rarely ever seenPositive or negative ONLY indicate the direction,
NOT the strength

Correlation and Prediction
As the correlation increases, so does the ability to predict one variable based on the other.
EX: SAT scores & college GPA are positive correlation

Measuring Correlation
Y= vertical on graphX= horizontal on graphIllusory correlation- a
perceived correlation that does not really exist
EX: When the moon is full, bizarre things happen
Scatter plots- should be linear

How to plot
Place your scores of the two variables on a graph called a scatter plot
Each number represents an X and YThe Pearson Product- Moment correlation-
formula to compute the correlation coefficient (See B. 10)

Coefficient of Determination-Index of correlation’s predictive power
Percentage of variation in one variable that can be predicted based on the other variable
To get this number, multiply the correlation coefficient by itself
EX: A correlation of .70 yields a coefficient of determination of .49 (.70 X .70= .49) indicating that variable X can account for 49% of the variation in variable Y
Coefficient of determination goes up as the strength of a correlation increases (B.11)

Applying Inferential Statistics to Correlations
Is the observed correlation large enough to support our hypothesis or might a correlation of the size have occurred by chance?
We need to test the Null Hypothesis or the assumption that there is no true relationship between the variables observed. Do our result REJECT the null hypothesis?
Type I ErrorType II ErrorRelate to medsWhich is worse?

Statistical Significance
It is said to exist when the probability that the observed findings are due to chance is very low, usually less than 5 chances in 100
When we reject our null hypothesis we conclude that our results were statistically significant.


