The designations employed and the presentation of material in this document do not imply the expression of any opinion whatsoever on the part of the Secretariat of the World Meteorological Organization concerning the legal status of any country, territory, city or area or of its authorities, or concerning the delimitation of its frontiers or boundaries.
i
2008 Edition
CONTENTS Page CHAPTER 1 - GENERAL 1 1.1 Introduction 1 1.2 Terminology used in the region 2 1.2.1 General 2 1.2.2 Classification of tropical cyclones 2 1.2.3 Tropical cyclone characteristics 2 1.2.4 Terms related to the warning and warning system 3 1.3 Meaning of terms used for regional exchange 3 1.4 Units used for regional exchange 5 1.5 Identification of tropical cyclones 6 1.6 Acronyms 6 CHAPTER 2 - OBSERVING SYSTEM AND OBSERVING PROGRAMME 7 2.1 Networks of synoptic land stations 7 2.1.1 Surface observations 7 2.1.2 Upper-air synoptic observations 7 2.2 Ship and buoy observations 8 2.3 Radar observations 8 2.4 Meteorological satellite observations 8 2.5 Aircraft observations 9 2.6 Tropical cyclone passage report 10 CHAPTER 3 - TROPICAL CYCLONE ANALYSIS AND FORECAST 11 3.1 Analysis at RSMC Tokyo - Typhoon Center 11 3.2 Forecast at RSMC Tokyo - Typhoon Center 16 3.3 Operational analysis and forecast at centres of Typhoon Committee Members 16 CHAPTER 4 - TROPICAL CYCLONE WARNINGS AND ADVISORIES 17 4.1 General 17 4.2 Classification of tropical cyclones 17 4.3 Tropical cyclone advisories 17 4.4 Tropical cyclone warnings for the high seas 18 4.5 Warnings and advisories for aviation 18 CHAPTER 5 - TELECOMMUNICATIONS 20 5.1 General 20 5.2 Dissemination of data and products 20 5.3 Schedule for exchange of cyclone advisories 20 5.4 Meteorological telecommunication network for the Typhoon Committee region 21 5.5 Addresses, telex/cable and telephone numbers of the
tropical cyclone warning centres 23 5.6 Abbreviated headings of tropical cyclone advisories and warnings 23 5.7 Exchange of information related to tropical cyclones 24
ii
2008 Edition
Page CHAPTER 6 - MONITORING AND QUALITY CONTROL OF DATA 25 6.1 Quality control of observational data 25 6.2 Monitoring of exchange of information 25 6.3 Verification 25 CHAPTER 7 - ARCHIVAL OF DATA 27 7.1 Data to be archived by Typhoon Committee Members 27 7.2 Data to be archived by RSMC Tokyo - Typhoon Center 27 7.3 Exchange of archived data 27
________________
iii
2008 Edition
APPENDICES 1-A Revised list of names for tropical cyclones adopted by the Typhoon Committee for
the western North Pacific Ocean and the South China Sea 1-B List of acronyms used in the Operational Manual - Meteorological Component - 2-A List of stations from which enhanced surface observations are available 2-B List of stations from which enhanced upper-air observations are available 2-C Distribution of the radar stations of Typhoon Committee Members 2-D Technical specifications of radars of Typhoon Committee Members 2-E Schedule of MTSAT observation and dissemination 2-F Satellite imagery receiving facilities at Typhoon Committee Members 2-G Tropical cyclone passage report form 3-A Outline of RSMC Tokyo - tropical cyclone prediction models 3-B Operational typhoon track forecast methods used by Typhoon Committee Members 3-C Samples of the operational procedures and methods for the tropical cyclone analysis and forecasting 3-D Outline of KMA - Typhoon Dynamic Models 3-E Outline of HKO - Operational Regional Spectral Model 4-A Examples of advisories issued from RSMC Tokyo - Typhoon Center 4-B Weather forecast areas 4-C Stations broadcasting cyclone warnings for ships on the high seas 5-A List of addresses, telex/cable and telephone numbers of the Tropical Cyclone
Warning Centers in the region 5-B Abbreviated headings for the tropical cyclone warnings 5-C Collection and distribution of information related to tropical cyclones 5-D Table of abbreviated headings (TTAAii CCCC) 6-A Examples of the message format for inquiry on doubtful and garbled reports 6-B Procedures of regular monitoring at RSMC Tokyo - Typhoon Center 6-C Example of best track report 6-D Standard procedures for the verification of typhoon analysis and forecast at national
Meteorological Centres
iv
2008 Edition
6-E Verification sheet for positioning of the centre, prediction of movement, and analysis
and forecast of intensity of tropical cyclones 7-A List of data archived by RSMC Tokyo - Typhoon Center 7-B Global tropical cyclone track and intensity data set - report format
1
2008 Edition
CHAPTER 1
GENERAL 1.1 Introduction
Typhoons have always been a major threat to the Typhoon Committee region. As a result, they are a common target for meteorological services in the region to monitor, analyse, forecast and warn against.
Under the spirit of international co-operation, a regional programme to mitigate the damage due to tropical cyclones was launched by the Typhoon Committee which was established in 1968. Since its establishment under the auspices of ESCAP in co-operation with WMO, the Typhoon Committee has developed its area of activities to consist of three components, i.e., meteorological, hydrological and disaster prevention and preparedness.
Of these components, the meteorological component aims at improving and upgrading the analysis and forecast used for the routine operation. For this purpose, the Typhoon Committee has arranged a variety of co-operation efforts. One of the epoch-making events in the history of the Committee was the Typhoon Operational Experiment (TOPEX), which was organized for all three components. (The third component was specifically organized as Warning Dissemination and Information Exchange Component).
The Meteorological Component of TOPEX had a co-operation programme where concerted efforts were exerted to analyze and forecast specified typhoons using common technical procedures. The procedures were described in the TOPEX Operational Manual which had been utilized in meteorological services in the Typhoon Committee region during the operational phase of TOPEX.
Activities of the Meteorological Component of the Typhoon Committee – including execution of the meteorological component of TOPEX for three years – had been planned and organized under the Tropical Cyclone Programme (TCP) of the World Meteorological Organization (WMO). The main long-term objective of the TCP is to assist Members in upgrading the capabilities of NMHSs to provide better tropical cyclone, related flood and storm surge forecasts and more effective warnings through regionally coordinated systems, and to encourage Members to establish national disaster prevention and preparedness measures. As a result of international cooperation and coordination, and with the aid of meteorology and modern technology, such as satellites, weather radars and computers, all tropical cyclones around the globe are now being monitored from their early stages of formation and throughout their lifetime. Six centres designated by WMO as Regional Specialized Meteorological Centres (RSMCs) located in Honolulu, La Reunion, Miami, Nadi (Fiji), New Delhi and Tokyo, as well as other centres of national Meteorological Services carry out these activities. These centres also provide forecasts on the behaviour of tropical cyclones, their movement and changes in intensity and on associated phenomena – principally storm surges and flash floods.
The responsibility of the RSMC Tokyo - Typhoon Center is the provision of information on tropical cyclones for Members of the Typhoon Committee. Information should include formation, movement and development of tropical cyclones and associated meteorological phenomena. In addition, synoptic scale atmospheric situation which affects the behaviour of tropical cyclones should also be prepared by the RSMC Tokyo - Typhoon Center and disseminated to NMCs in the appropriate format for operational processing. The RSMC Tokyo - Typhoon Center should be operational throughout the year and be manned
2008 Edition
2
round the clock when a tropical cyclone exists over the region concerned. The RSMC Tokyo - Typhoon Center should also carry out non-operational functions such as training.
In order to implement the RSMC Tokyo - Typhoon Center in the Typhoon Committee region, the Regional Co-operation Programme was discussed and adopted by the Typhoon Committee at its Extraordinary Session (Manila, March 1986). At the same time, the Committee approved a draft of the Typhoon Committee Operational Manual which specifies in more detail the extent and type of activity of the RSMC Tokyo - Typhoon Center and shows the direction of realizing the regional co-operation between Members.
The Operational Manual consists of the text and the appendices. Items included in the text relate to the Typhoon Committee agreement, in particular, basic information for executing meteorological operation, whilst the appendices contain national practices and procedures (it is felt that the Member concerned should have the right to be able to change without having to get prior formal agreement of the Typhoon Committee) together with detailed and technical information for meteorological operation. Information described in WMO official publications such as Manuals is only referred to and not included in this Manual.
Since March 1986, the draft of the Operational Manual has been revised and is still subject to further refinement and revision through experience gained in the use of the Operational Manual. It is also intended that the text of the Manual be updated or revised from time to time by the Typhoon Committee and that each item of information given in the appendices relating to the Manual be kept up to date by the Members concerned. 1.2 Terminology used in the region 1.2.1 General
Typhoon Committee Members
1.2.2 Classification of tropical cyclones*
(i) Low pressure area (L) (ii) Depression or tropical depression (TD) (iii) Tropical storm (TS) (iv) Severe tropical storm (STS) (v) Typhoon (TY)
1.2.3 Tropical cyclone characteristics
(i) position of centre (ii) confidence in the centre position (iii) size and shape of eye, if any (iv) central pressure (v) direction of movement (vi) speed of movement
* "Tropical cyclone" is a generic term that includes tropical depression, tropical storm, severe tropical storm and
typhoon.
2008 Edition
3
(vii) maximum sustained wind (viii) gusts (ix) storm radius (x) gale radius (xi) storm surge potential for a particular coastal location (xii) storm tide potential for a particular coastal location
1.2.4 Terms related to the warning and warning system (i) typhoon season (ii) tropical cyclone advisory (iii) tropical cyclone information bulletin (iv) gale warning (v) storm warning (vi) typhoon warning (vii) visual storm signals (viii) high sea bulletin (ix) coastal weather bulletin (x) bulletin or cyclone warning bulletin
1.3 Meaning of terms used for regional exchange Average wind speed: Speed of the wind averaged over the previous 10 minutes (mean surface wind) as read from the anemogram or the 3 minutes mean determined with the non-recording anemometer or wind averaged over the previous 1 minute (mean surface wind) at 10 meter height or estimated wind at sea by mariners using the Beaufort scale. Bulletin: Cyclone warning bulletin Central pressure of a tropical cyclone: Surface pressure at the centre of the tropical cyclone as measured or estimated. Centre fix of the tropical cyclone: The estimated location of the centre of a tropical cyclone. Centre of the tropical cyclone: The centre of the cloud eye, or if not discernible, of the wind/pressure centre. Confidence in the centre position: Degree of confidence in the centre position of a tropical cyclone expressed as the radius of the smallest circle within which the centre may be located by the analysis. "Position good" implies a radius of 30 nautical miles (55 kilometres) or less. "Position fair", a radius of 30 to 60 nautical miles (55 to 110 km) and "Position poor", a radius of greater than 60 nautical miles (110 km). Cyclone: Tropical cyclone Cyclone warning bulletin: A priority message for exchange of tropical cyclone information and advisories. Direction of movement of the tropical cyclone: The direction towards which the centre of the tropical cyclone is moving. Extra-tropical cyclone: Low-pressure system which develops in latitudes outside the tropics.
2008 Edition
4
Eye of the tropical cyclone: The relatively clear and calm area inside the circular wall of convective clouds, the geometric centre of which is the centre of the tropical cyclone. Gale force wind: Average surface wind speed of 34 to 47 knots. Gale warning: Meteorological message intended to warn those concerned of the occurrence or expected occurrence of average wind speed in the range of 34 to 47 knots, or wind force 8 or 9 in the Beaufort scale. Gust: Instantaneous peak value of surface wind speed. Low pressure area: Region of the atmosphere in which the pressures are lower than those of the surrounding region at the same level. (On the weather map, the low pressure area is denoted with the capital L within the innermost isobar without showing the centre position.) Maximum sustained wind: Maximum value of the average wind speed at the surface. Mean wind speed: Average wind speed. Reconnaissance aircraft centre fix of the tropical cyclone, vortex fix: The location of the centre of a tropical cyclone obtained by reconnaissance aircraft penetration. Severe tropical storm: A tropical cyclone with the maximum sustained winds of 48 knots (24.5 m/s, 89 km/h) to 63 knots (32.6 m/s, 117 km/h) near the centre. Speed of movement of the tropical cyclone: Speed of movement of the centre of the tropical cyclone. Storm force wind: Average surface wind speed of 48 to 63 knots. Storm surge: The difference between the actual water level under the influence of a meteorological disturbance (storm tide) and the level which would have been attained in the absence of the meteorological disturbance (i.e. astronomical tide). (Storm surge results mainly from the shoreward movement of water under the action of wind stress. A minor contribution is also made by the hydrostatic rise of water resulting from the lowered barometric pressure.) Storm tide: The actual sea level as influenced by a weather disturbance. The storm tide consists of the normal astronomical tide and the storm surge. Storm warning: Meteorological message intended to warn those concerned of the occurrence or expected occurrence of average wind speeds in the range of 48 to 63 knots or wind force 10 or 11 in the Beaufort scale. Sub-tropical cyclone: A low pressure system, developing over sub-tropical waters which initially contains few tropical characteristics. With time the sub-tropical cyclone can become tropical. Sustained wind speed: Average wind speed. Average period of one, three or ten minutes is depending upon the regional practices. Tropical cyclone: Generic term for a non-frontal synoptic scale cyclone originating over tropical or sub-tropical waters with organized convection and definite cyclonic surface wind circulation. (The term is also used for a storm in the South-West Indian Ocean in which the
2008 Edition
5
maximum of the sustained wind speed* is estimated to be in the range of 64 to 90 knots and in the South Pacific and South-East Indian Ocean with the maximum of the sustained over 33 knots.) Tropical cyclone advisory: A priority message for exchanging information, internationally, on tropical cyclones. Tropical depression: A tropical cyclone with the maximum sustained winds of 33 knots (17.1 m/s, 61 km/h) or less near the centre. Tropical disturbance: A non-frontal synoptic scale cyclone originating in the tropics or sub-tropics with enhanced convection and light surface winds. Tropical storm: A tropical cyclone with the maximum sustained winds of 34 knots (17.2 m/s, 62 km/h) to 47 knots (24.4 m/s, 88 km/h) near the centre. Tropical wave: A trough or cyclonic curvature maximum in the trade wind easterlies or equatorial westerlies. The wave may reach maximum amplitude in the lower middle troposphere, or may be the reflection of an upper-troposphere cold low or equatorial extension of a mid-latitude trough. Typhoon: A tropical cyclone with the maximum sustained winds of 64 knots (32.7 m/s, 118 km/h) or more near the centre. Typhoon force wind: Average surface wind speed of 64 knots or more. Typhoon warning: Meteorological message intended to warn those concerned of the occurrence or expected occurrence of the mean wind speed of 64 knots (32.7 m/s, 118 km/h) or higher, or wind force 12 in the Beaufort scale. Visual storm signals: Visual signals displayed at coastal points to warn ships of squally winds, gales and tropical cyclones. Weather warning: Meteorological message issued to provide appropriate warnings or hazardous weather conditions. Zone of disturbed weather: A zone in which the pressure is low relative to the surrounding region and there are convective cloud masses which are not organized. 1.4 Units used for regional exchange (a) The following units/indicators are used for marine purposes:
(i) Distance in nautical miles, the unit (nm) being stated;
(ii) Location (position) by degrees and where possible tenths of degrees of latitude and longitude preferably expressed by words;
(iii) Direction to the nearest sixteen points of the compass or in degree to the
nearest ten, given in words; (iv) Speed (wind speed and speed of movement of tropical cyclones) in knots,
the unit (kt) being stated;
2008 Edition
6
(v) Confidence in the centre position in nautical miles (nm) or in position good, fair or poor;
(b) The following units/indicators are used in non-coded segments of exchanges,
other than marine bulletins:
(i) Distance in kilometres (km) or nautical miles (nm);
(ii) Location (position) by degrees and tenths of degrees in figures of latitude and longitude and/or bearing on the sixteen point compass and distance from well-known fixed place(s);
(iii) Direction in sixteen points of compass given in figures;
(iv) Speed (wind speed and speed of movement of system) in knots (kt), metres per second (m/s) or kilometres per hour (km/h);
(v) Confidence in the centre position in kilometres (km), nautical miles (nm) or
in position good, fair or poor. 1.5 Identification of tropical cyclones
As soon as the wind speed in a tropical cyclone in the responsible area of the RSMC Tokyo - Typhoon Center (between 0°N and 60°N and between 100°E and 180°E) attains 34 knots, it will be given an identification name with a 4-digit number by the RSMC Tokyo - Typhoon Center. Each tropical cyclone should be identified by one of the names in Table 1 - A.1 (Appendix 1-A), followed by the 4-digit number in brackets, whose number will consist of a year identification and a serial number identification (in two digits each). For example, the first tropical cyclone attaining the 34 knots threshold value in 2000 in the responsible area of the RSMC Tokyo-Typhoon Center will be identified as Damrey (0001). If the life of a tropical cyclone spans two calendar years, it will be accounted for in the year in which it has intensified to the stage where the wind speed has attained the 34 knots threshold value. 1.6 Acronyms
A list of acronyms used in this Operational Manual is shown in Appendix 1-B.
_______________
2008 Edition
7
CHAPTER 2
OBSERVING SYSTEM AND OBSERVING PROGRAMME 2.1 Networks of synoptic land stations
The surface and upper-air stations in the regional basic synoptic network are those of the Typhoon Committee Members and are registered in Weather Reporting Volume A - Observing stations (WMO Publication No. 9).
The RSMC Tokyo - Typhoon Center and all Typhoon Committee Members should initiate enhanced observation programmes for their stations in the area within 300 km of the centre of a tropical cyclone of TS intensity or higher. All the observations should be made available to the RSMC Tokyo - Typhoon Center and all Members. Enhanced observations should include:
(i) surface observations - hourly;
(ii) buoy observations - hourly;
(iii) radar observations - hourly;
(iv) upper-air observations - 6-hourly.
2.1.1 Surface observations
All surface stations included in the regional basic synoptic network should make surface observations at the four main standard times of observation, i.e., 0000, 0600, 1200 and 1800 UTC, and at the four intermediate standard times of observation, i.e., 0300, 0900, 1500 and 2100 UTC. Any surface station that cannot carry out the full observational programme should give priority to carrying out the observations at the main standard times. Additional surface observations at hourly intervals may be requested by any Member, whenever a tropical cyclone becomes an imminent threat to the Member, from the stations shown in Appendix 2-A. 2.1.2 Upper-air synoptic observations
All the upper-air stations included in the regional basic synoptic network should carry out radiosonde and radiowind observations at 0000 and 1200 UTC, and radiowind observations at 0600 and 1800 UTC. The radiosonde/radiowind observations carried out at 0000 and 1200 UTC should reach the 30 hPa level for more than 50 per cent of the ascents. The carrying out of the radiosonde/radiowind observations at 0000 and 1200 UTC should receive priority over the radiowind observations at 0600 and 1800 UTC.
Upper-air stations in the areas affected by tropical cyclones of TS intensity or
higher should also make radiowind observations at 0600 and 1800 UTC which should aim at reaching the 70 hPa level.
Enhanced upper-air observations given in Appendix 2-B will be made as
appropriate whenever a tropical cyclone of TS intensity or higher is centred within 300 km of the station. The minimum required is two observations per day, but for a better understanding of the ambient windfield three or even four ascents per day on some days should be made when possible. All data of these enhanced upper-air observations will be distributed among the Members.
2008 Edition
8
In addition to the upper-air synoptic observations, newly developed observations such as wind profiler observations should be carried out when possible and the data should be made available to the Members.
2.2 Ship and buoy observations
Hourly marine meteorological observations are made by the JMA research vessels (call signs of them are: JPBN, JGQH, JDWX, JIVB and JCCX) in the seas adjacent to Japan and in the western North Pacific.
Upper-air observations are usually made twice a day (00, 12 UTC) on board the
JMA research vessels JGQH, JDWX, JIVB and JCCX. Enhanced upper-air observations are carried out six-hourly when these ships are in the vicinity of a tropical cyclone of TS intensity or higher.
Marine meteorological observations are made by the Voluntary Observing Ships
which are recruited by the Members in accordance with the WMO Voluntary Observing Ship's Scheme. These are generally carried out every six hours and transmitted over the GTS. Marine meteorological observations, namely air pressure, sea surface temperature, significant wave height and period, are also made by the JMA drifting ocean data buoys every 3 hours in the western North Pacific. When waves are higher than thresholds set beforehand, the buoy changes into the hourly observation mode automatically. All reports are coded in the BUOY code (FM18), and immediately put onto the GTS with the header “SSVB01-19 RJTD”. 2.3 Radar observations
It is essential that radar observations continue as long as a tropical cyclone of TS intensity or higher remains within the detection range of the radar. All meteorological centres should co-operate to ensure that the radar observations are transmitted through the GTS to the RSMC Tokyo - Typhoon Center and all Members. Reports will be coded in the RADOB code (FM 20-VIII).
In case the report is in plain language, the full range of information available at the radar station should be given. The message will therefore include, where available, the confirmation of the determination of the centre, the shape, definition, size and character tendency of the eye, the distance between the end of the outermost band and the centre of the cyclone and the direction and speed of movement with a statement of the interval of time over which the movement was calculated.
Distribution of the radar stations and detailed information on the radar equipment
of the Typhoon Committee Members are given in Appendices 2-C and 2-D.
2.4 Meteorological satellite observations The meteorological satellite information obtained by MTSAT and related products are operated as follows:
(i) the full disk data are obtained hourly; (ii) the half disk data in northern hemisphere are obtained hourly in addition to the
full disk data;
2008 Edition
9
(iii) three successive half disk data in northern/southern hemisphere are also observed six-hourly in order to derive Atmospheric Motion Vector(AMV).
Detailed information is given in Appendix 2-E.
A list of satellite imagery receiving facilities at meteorological centres of the Typhoon Committee Members is given in Appendix 2-F.
SAREP reports (Part A) are disseminated eight times a day in case (i) mentioned
below, or four times a day in case (ii) or (iii) from the RSMC Tokyo - Typhoon Center to Typhoon Committee Members through the GTS under the heading TCNA20 RJTD:
(i) when a tropical cyclone of TS intensity or higher is located in the responsible
area of the RSMC Tokyo - Typhoon Center; (ii) when a tropical depression existing in the responsible area is forecasted to
have an intensity of TS or higher within 24 hours; or (iii) when a tropical cyclone existing out of the responsible area is forecasted to
move into the responsible area and to have an intensity of TS or higher within 24 hours.
Information on the intensity of the tropical cyclone at 0000, 0600, 1200 and 1800 UTC is reported under the heading TCNA21 RJTD. Details of the SAREP code are to be found in the Manual on Codes, Volume 1, FM 85-IX (WMO Publication No. 306). Regarding a WMO plan for migration to table driven code forms, SAREP reports in BUFR FM-94 (IUCC10 RJTD) has been disseminated since November 2005 as transition measures for users. WMO codes and representaion forms, Guide to WMO driven code form FM-94 BUFR, and BUFR/CREX templates to transmit in table driven code forms are given in the WMO webpage (http://www.wmo.ch/web/www/WMOCodes.html). 2.5 Aircraft observations
Reports from aircraft in flight (AIREPs) in Asia and neighbouring areas are collected and exchanged according to the Regional OPMET Bulletin Exchange (ROBEX) scheme. AIREPs are collected by the centres in the Typhoon Committee Members areas and transmitted to the Main Collection Centres at Bangkok, Beijing, Hong Kong, Kuala Lumpur and Tokyo.
AIREPs in the north-east Pacific area are also collected by the centres at Honolulu, Washington, etc., and relayed to Tokyo.
AMDAR (Aircraft Meteorological Data Relay) reports are collected by the centre
at Tokyo via GMS. All reports will be disseminated in real-time to the RSMC Tokyo - Typhoon
Center and to other Members through GTS and AFTN circuits.
2008 Edition
10
2.6 Tropical cyclone passage report Each Member’s tropical cyclone forecast center should compile reliable passage, landfall, near-buoy passage and near-ship passage data, tabulate that data and send it to the Typhoon Committee Secretariat (TCS) within a week after cyclone passage for distribution to other Members. The task is assigned to the focal point for the meteorological component of each Member. A proposed tropical cyclone passage report form is shown in Appendix 2-G.
_______________
2008 Edition
11
CHAPTER 3
TROPICAL CYCLONE ANALYSIS AND FORECAST 3.1 Analysis at RSMC Tokyo - Typhoon Center
The RSMC Tokyo - Typhoon Center should produce analyses of various meteorological parameters in chart form and/or in grid point value depending on the facilities of NMCs to process these products. These analyses should include pressure distribution at the sea level and temperature, geo-potential height, humidity and wind at selected pressure levels.
The streamline analysis is indispensable over the tropical region for forecasting
tropical cyclones. The RSMC Tokyo - Typhoon Center should produce streamline analyses of the upper and lower atmospheric levels utilizing cloud motion wind, aircraft reports, as well as upper-air observations. Furthermore, the RSMC Tokyo - Typhoon Center should issue analyses of ocean wave and sea surface temperature for the western North Pacific. A list of output products of the RSMC Tokyo - Typhoon Center is given in Tables 3.1 to 3.3.
The RSMC Tokyo - Typhoon Center should produce additional analyses of the
tropical cyclone when it is in the responsible area, based on the enhanced observations. Such analyses should be disseminated in the form of additional bulletins consisting of information on:
(i) position of the tropical cyclone;
(ii) direction and speed of movement;
(iii) central pressure;
(iv) maximum wind and wind distribution.
Various analyses based on MTSAT data other than cloud imagery itself should be produced by the RSMC Tokyo - Typhoon Center. Analysis of sea-surface temperature combining satellite data and in-situ measurements should be prepared every five days. These analyses are useful for the better understanding of the tropical atmosphere and medium-range assessment of forecasting tropical cyclones.
2008 Edition
12
Table 3.1 Chart-form output products transmitted by RSMC Tokyo - Typhoon Center for regional purposes
Model Area Contents and Level Forecast hours Initial time Availability
100 hPa: Z, U, V, T 150 hPa: Z, U, V, T 200 hPa: Z, U, V, T 250 hPa: Z, U, V, T 300 hPa: Z, U, V, T 500 hPa: Z, U, V, T, D, ζ 700 hPa: Z, U, V, T, D, ω 850 hPa: Z, U, V, T, D, ω Surface: P, U, V, T, D, R
The prefixes µ and σ represent average and standard deviation of ensemble prediction results, respectively.
The symbols °, *, ¶, §, ‡ and † indicate limitations on forecast hours or initial time as shown in notes below.
2008 Edition
15
Table 3.3: List of other products and data by RSMC Tokyo - Typhoon Center
for regional purposes
Data Satellite wind data Typhoon Information Wave data Observational data
Contents/ Frequency (initial time)
High density atmospheric motion vectors (BUFR) (a) MTSAT-1R (VIS, IR, WV) VIS: 00 and 06 UTC IR, WV: 00, 06, 12 and
18 UTC (b) METEOSAT-7 (VIS, IR, WV) VIS: every 1.5hours
Between 01:30UTC and 15:00 UTC
IR, WV: every 1.5hours
Tropical cyclone Related information(BUFR) • tropical cyclone analysis data 00, 06, 12 and 18 UTC
Global Wave Model (GRIB) • significant
wave height • prevailing
wave period • wave direction Forecast hours: 0–84 every 6 hours (00, 06 and 18UTC) 0–84 every 6 hours and 96–192 every 12 hours (12 UTC)
(a) Surface data (SYNOP, SHIP,BUOY) Mostly 4 times a day (b) Upper-air data (TEMP, parts A-D) (PILOT, parts A-D) Mostly 2 times a day
(Naming rules of headings for global wave model products)
T1T2A1A2ii RJTD T1 Meaning H (Except for 78 hours forecast) Y (Only 78 hours forecast) T2 Meaning J Significant wave height M Prevailing wave period Z Wave direction A1 Meaning N Northern hemisphere 0.5 X 0.5 degs S Southern hemisphere 0.5 X 0.5 degs A2 Meaning (When T1=H except for 78 hours forecast) A initial time (00UTC) B 006 hours forecast C 012 hours forecast D 018 hours forecast E 024 hours forecast F 030 hours forecast G 036 hours forecast H 042 hours forecast I 048 hours forecast Y 054 hours forecast J 060 hours forecast Z 066 hours forecast K 072 hours forecast P 078 hours forecast (Only when T1=Y) L 084 hours forecast M 096 hours forecast N 108 hours forecast O 120 hours forecast P 132 hours forecast Q 144 hours forecast R 156 hours forecast S 168 hours forecast W 180 hours forecast X 192 hours forecast ii Meanings 88 Ground or water properties for the Earth's surface (Fixed)
2008 Edition
16
3.2 Forecast at RSMC Tokyo - Typhoon Center
The RSMC Tokyo - Typhoon Center should prepare the products for numerical weather prediction shown in Appendix 3-A. These products should be made available to Members in real-time, and should include the following:
(i) deterministic forecast products of a high resolution global model to predict the change in large-scale atmospheric circulation patterns as well as the tropical cyclone movement and intensity (ii) ensemble forecast products using a lower resolution version of the global model to enable estimation of uncertainties in tropical cyclone movement and intensity as well as to reduce forecast errors by using statistical methods such as ensemble mean (to be made available in early 2008). The RSMC Tokyo - Typhoon Center should also prepare several statistical
models for predicting the track of the tropical cyclone and apply the Dvorak method for the prediction of the intensity change of the tropical cyclone. Other relevant synoptic methods should also be applied for predicting the tropical cyclone.
The RSMC Tokyo - Typhoon Center should summarize in a consolidated form all available information and prepare the final forecasts of the tropical cyclone when it exists in the responsible area. These forecasts should include:
(i) 24, 48 and 72-hour forecast position;
(ii) forecast intensity and wind distribution;
(iii) prognostic reasoning;
(iv) tendency assessment if possible.
Furthermore, the RSMC Tokyo - Typhoon Center should prepare a 24-hour ocean wave forecast once a day for the western North Pacific. The forecast track is transmitted in alphanumeric form through GTS. A list of forecast products of the RSMC Tokyo - Typhoon Center, other than alphanumeric form, is shown in Tables 3.1, 3.2 and 3.3. 3.3 Operational analysis and forecast at centres of Typhoon Committee Members
The national meteorological services of Typhoon Committee Members are using various kinds of operational forecast methods for typhoon track. The ones currently used are shown in Appendix 3-B.
The final responsibility for analysis and forecasting development and movement
of tropical cyclones in the region will be with the national meteorological services of each of the Members. In order to promote uniformity in the adoption of proven techniques, a sample of such techniques currently used by Members is given in Appendix 3-C.
_______________
2008 Edition
17
CHAPTER 4
TROPICAL CYCLONE WARNINGS AND ADVISORIES 4.1 General
The responsibility for warning the human settlements on land which are threatened by a tropical cyclone rests in all cases with the National Meteorological Services (NMS). These national responsibilities are not subject to regional agreement. Therefore, only the cyclone warning systems intended for international users and exchanges among the Typhoon Committee Members are described in this chapter. 4.2 Classification of tropical cyclones*
Classifications of tropical cyclones for the exchange of messages among the Typhoon Committee Members are given below: 1. Low pressure area (L) Central position cannot be accurately assessed. 2. Tropical depression (TD) Central position can be identified, but the
maximum sustained wind is 33 kt or less. 3. Tropical storm (TS) Maximum sustained wind is between 34 and
47 kt. 4. Severe tropical (STS) Maximum sustained wind is between 48 and storm 63 kt. 5. Typhoon (TY) Maximum sustained wind is 64 kt or more. 4.3 Tropical cyclone advisories
The RSMC Tokyo - Typhoon Center should disseminate six to three-hourly analyses and forecasts of tropical cyclones in the form of bulletins (tropical cyclone advisories - see examples in Appendix 4-A):
(i) analysis of the central position, intensity and wind distribution;
(ii) 24, 48 and 72-hour forecasts of the central position;
(iii) forecasts of intensity and wind distribution;
(iv) prognostic reasoning;
(v) tendency assessment if possible.
* "Tropical cyclone" is a generic term that includes tropical depression, tropical storm, severe tropical storm and
typhoon.
2008 Edition
18
4.4 Tropical cyclone warnings for the high seas
The World Meteorological Organization (WMO) in its Manual on Marine Meteorological Services sets out the issue of weather and sea bulletins for the high seas in six parts. The first part relates to storm warnings in plain language. Areas of responsibility of each nation for issuing the storm warnings are pre-assigned. The pre-assigned forecast areas of Typhoon Committee Members were agreed upon by Regional Associations II and V (Res. 17 (IV-RA II) and Res.10 (IV-RA V)). Weather forecast areas fixed nationally by individual Typhoon Committee Members are shown in Appendix 4-B.
The radio stations broadcasting tropical cyclone forecasts and warnings for the
benefit of the ships on the high seas in the Typhoon Committee Members are listed in Appendix 4-C, where are shown the names of coastal radio stations with their call signs and the area covered by their bulletins. The details are shown in the Manual on Weather Reporting Volume D - Information for Shipping (WMO Publication No. 9). 4.5 Warnings and advisories for aviation In accordance with the International Civil Aviation Organization (ICAO) Annex 3 — Meteorological Service for International Air Navigation/ WMO Technical Regulations (C.3.1), tropical cyclone warnings, required for the international air navigation, are issued by designated meteorological watch offices (MWO) as SIGMET messages. SIGMET messages give a concise description in abbreviated plain language concerning the occurrence and/or expected occurrence of specified en-route weather phenomena, which may affect the safety of aircraft operations, and of the development of those phenomena in time and space. In the special case of SIGMET messages for tropical cyclones, an outlook should be included, giving information for up to 24 hours ahead concerning the expected positions of the centre of the tropical cyclone. Each MWO provides information for one or more specified flight information regions (FIRs) or upper information regions (UIRs). The boundaries of the FIRs/UIRs are defined in ICAO Air Navigation Plan — Asia and Pacific Region (Doc 9673). The content and order of elements in a SIGMET message for tropical cyclone shall be in accordance with ICAO Annex 3/WMO Technical Regulations (C.3.1). The data type designator to be used in the WMO abbreviated heading of such messages shall be T1T2 = WC (WMO - No. 386, Manual on GTS refers). The designated Tropical Cyclone Advisory Centre (TCAC) Tokyo shall monitor the development of tropical cyclones in its area of responsibility, as determined in the ICAO Air Navigation Plan — Asia and Pacific Region (Doc 9673) and issue advisory information concerning the position of the cyclone centre, its direction and speed of movement, central pressure and maximum surface wind near the centre. The tropical cyclone advisories shall be disseminated to the MWOs by TCAC Tokyo in its area of responsibility, to be used in the preparation of the outlook part of the SIGMET messages for tropical cyclones. In addition, the tropical cyclone advisories shall be disseminated to other TCACs, whose areas of responsibility may be affected, to the World Area Forecast Centres (WAFC) London and Washington, international OPMET data banks, and centres operating the ICAO satellite distribution systems (SADIS and ISCS). The format of the tropical cyclone advisories shall be in accordance with the ICAO Annex 3/WMO Technical Regulations (C.3.1). The data type designator to be used in the WMO abbreviated heading of such messages shall be T1T2 = FK (WMO-No. 386, Manual on GTS, refers).
2008 Edition
19
TCAC Tokyo shall issue updated advisory information for its area of responsibility, for each tropical cyclone, as necessary, but at least every six hours.
____________
20
2008 Edition
CHAPTER 5
TELECOMMUNICATIONS 5.1 General
The basic meteorological telecommunication network for the exchange of forecasts, warnings and observational data will be the Global Telecommunication System (GTS). 5.2 Dissemination of data and products
The RSMC Tokyo - Typhoon Center should have adequate telecommunication facilities for the real-time collection and dissemination of data and products. A large amount of grid point data produced at the RSMC Tokyo - Typhoon Center should be exchanged between the RSMC Tokyo - Typhoon Center and NMCs where adequate circuits for this purpose exist, such as GTS and Internet.
Conventional radio facsimile broadcasts are widely used in the region, though
they have some disadvantages, i.e., it takes a long time to transmit a number of charts and received charts are sometimes distorted due to noises. Nevertheless, facsimile broadcasts and reception facilities shall be retained in full operation until telecommunications via satellite is introduced to transmit products both in chart and grid point value form. 5.3 Schedule for exchange of cyclone advisories
Tropical cyclone advisories issued by the RSMC Tokyo - Typhoon Center shall be transmitted at intervals of six to three hours. These messages shall be given high priority.
21
2008 Edition
5.4 Meteorological telecommunication network for the Typhoon Committee region
The network is shown in Figure 5.1 and its present status is summarized in Table 5.1.
Seoul
Kuala Lumpur
Pyongyang
Hanoi
Washington Offenbach Beijing
Vientiane
Bangkok
Singapore
Manila
Macao
Hong Kong
Tokyo
Phnom Penh
Circuits of Main Telecommunication Network RTH Main regional circuits Regional circuits
NMC Inter-regional circuits
Figure 5.1 Meteorological telecommunication network for the Typhoon Committee
22
2008 Edition
Table 5.1: Present operational status of the meteorological telecommunication
network for the Typhoon Committee region 1. Main Telecommunication Present Operational Status Network Beijing - Tokyo Cable (MPLS), 1 Mbps TCP/II Beijing – Offenbach Cable (FR), 48 kbps (CIR) TCP/IP Washington - Tokyo Cable (FR), 32 kbps from Tokyo / 768 kbps from Washington (CIR) TCP/IP 2. Main regional circuit Tokyo - Bangkok Cable (FR), 16 kbps (CIR) TCP/IP 3. Regional circuits Bangkok - Beijing Cable, 9600 bps X.25 Bangkok - Hanoi Cable, 1200 bauds Bangkok - Phnom Penh Internet, IP VPN Bangkok - Vientiane DDN, 64 kbps, FTP Protocol Beijing - Hanoi Cable, 75 bauds PC VSAT (Satellite broadcast) Beijing - Hong Kong Cable, 64 kbps TCP/IP Beijing - Macao ISDN 64 kbps IP connection Beijing - Pyongyang Cable, 75 bauds; PC VSAT (Satellite broadcast) Beijing - Seoul Cable (FR), 32 kbps (CIR) TCP/IP Hong Kong – Macao ISDN, 128 kbps, TCP/IP Tokyo - Hong Kong Cable (FR), 16 kbps (CIR) TCP/IP Tokyo - Seoul Cable (FR), 16 kbps (CIR) TCP/IP
23
2008 Edition
4. Inter-regional circuits Bangkok - Kuala Lumpur Cable (FR), 64 kbps/CIR 16 Bangkok - Singapore Cable (FR), 16 kbps Tokyo - Manila Cable (FR), 16kbps (CIR) TCP/IP 5. RTH radio broadcast Bangkok 1 FAX Beijing 1 FAX (Shanghai) Tokyo 1 FAX 6. Satellite broadcast Operated by China: Asiasat-2 (100.5°E) Operational data, fax and image distribution Operated by Japan: GMS-5 (140°E) Operational satellite image distribution 5.5 Addresses, telex/cable and telephone numbers of the tropical cyclone warning
centres
A list of addresses of the tropical cyclone warning centres of the Typhoon Committee Members, together with their telex/cable and telephone numbers and e-mail addresses, is given in Appendix 5-A. 5.6 Abbreviated headings of tropical cyclone advisories and warnings
The abbreviated headings of meteorological messages containing tropical cyclone advisories issued by the RSMC Tokyo - Typhoon Center shall be:
(i) analysis and forecast - WTPQ20 RJTD through WTPQ25 RJTD;
(ii) prognostic reasoning - WTPQ30 RJTD through WTPQ35 RJTD;
(iii) numerical prediction - FXPQ20 RJTD through FXPQ25 RJTD.
The abbreviated headings of meteorological bulletins used for the exchange of tropical cyclone warnings by the Typhoon Committee Members are given in Appendix 5-B.
24
2008 Edition
5.7 Exchange of information related to tropical cyclones
Collection and dissemination of observational and processed data plus warnings related to tropical cyclones at Regional Telecommunication Hubs (RTHs) and National Meteorological Centres (NMCs) are summarized in Appendix 5-C.
The meanings of the symbols used in abbreviated headings in the meteorological messages transmitted to the GTS are listed in Appendix 5-D. The details are described in the Manual on the Global Telecommunication System (WMO Publication No. 386) and Weather Reporting Volume C - Transmissions, Chapter I Catalogue of Meteorological Bulletins (WMO Publication No. 9).
______________
25
2008 Edition
CHAPTER 6
MONITORING AND QUALITY CONTROL OF DATA 6.1 Quality control of observational data
National Meteorological Centres will make additional efforts to ensure that all observational data disseminated during periods of cyclone threat to the area are specifically free from errors. Wherever appropriate, verification of reports or of elements of reports will be requested of the observing station and communication channels will be kept open to facilitate this, particularly in cases where an enhanced observing programme is being carried out.
In the exchange of data during periods of cyclone threat, queries concerning
reports on which there is doubt should be addressed to the relevant National Meteorological Centre.
Examples of message format for inquiry on doubtful and garbled reports are
shown in Appendix 6-A.
6.2 Monitoring of exchange of information
Monitoring will be carried out by the RSMC Tokyo - Typhoon Center and all Typhoon Committee Members in accordance with their standard procedures. Special attention will be given to identification of deficiencies during the cyclone season in the flow of observational data and processed information relating to cyclone analysis and forecast with a view to appropriate remedial action.
The Members will inform the RSMC Tokyo - Typhoon Center of any shortcomings in the flow of data (raw and processed) and also indicate any requirements over and above those already agreed upon for tropical cyclone warning purposes.
Regular monitoring at the RSMC Tokyo - Typhoon Center should be made twice a year for appropriate periods when enhanced observations are carried out. Special monitoring may be made depending on the situation.
The procedure of regular monitoring is shown in Appendix 6-B. 6.3 Verification
Immediately after the dissipation of a tropical cyclone of TS grade or stronger, the RSMC Tokyo - Typhoon Center should disseminate a report on the tropical cyclone in the form of bulletins to provide Members with data needed for verification, such as position and intensity of the tropical cyclone (see the example in Appendix 6-C):
After the end of each typhoon season, each Member will conduct the verification
for its analyses and forecasts and send the report to the RSMC Tokyo - Typhoon Center in accordance with the standard procedure as shown in Appendix 6-D. Verification sheets for positioning of the centre, prediction of movement, and analysis and forecast of intensity of a tropical cyclone are shown in Appendix 6-E.
26
2008 Edition
The RSMC Tokyo - Typhoon Center should summarize the reports issued in a year and the results of verification conducted by Members. It should publish an annual report with respect to tropical cyclones and activities of the RSMC Tokyo - Typhoon Center and Members. The report should also identify specific areas where further co-operative research needs to be carried out by Members.
_______________
27
2008 Edition
CHAPTER 7
ARCHIVAL OF DATA
7.1 Data to be archived by Typhoon Committee Members
Members should establish tropical cyclone data files and information services nationally, archiving all appropriate available data. 7.2 Data to be archived by RSMC Tokyo - Typhoon Center
The RSMC Tokyo - Typhoon Center should archive as far as possible tropical cyclone related data received at the centre. The data set should be produced during the period when tropical cyclone(s) is(are) in the range of 1,000 km around Typhoon Committee Members. Except for satellite cloud pictures, all data should be recorded by the RSMC Tokyo - Typhoon Center preferably on magnetic tape. A proposed list of data to be archived by the RSMC Tokyo - Typhoon Center is shown in Appendix 7-A. 7.3 Exchange of archived data
Whenever possible Members should supply the RSMC Tokyo - Typhoon Center with all additional data requested by the RSMC Tokyo - Typhoon Center. The RSMC Tokyo - Typhoon Center should make available the archived data to Members on request for use in research, studies, investigations and training. As to distribution, similar arrangements should be made as for the TOPEX data sets which were provided by the Japan Meteorological Agency to Typhoon Committee Members (one set each) with financial assistance from UNDP. The detailed arrangements for exchange of data should be agreed upon bilaterally. Request for data sets by non-Typhoon Committee Members should be made through the WMO Secretariat upon payment of net cost (for magnetic tapes, copying, handling, postal fees, etc.) by the requesting WMO Members.
In accordance with the directive of the WMO Executive Council (EC-XLV), (Geneva, June
1993) an international format for the archiving of tropical cyclone data is to be used by all RSMCs with activity specialization in tropical cyclones.
Complete historical data using the international format given in Appendix 7-B will be made
available for research applications. RSMC Tokyo - Typhoon Center will provide such data to the Director of the National Climatic Data Center (NCDC), USA.
The Tropical Cyclone Programme (TCP) Division of the WMO Secretariat has the
responsibility for the maintenance of the format, including assignment of the source codes to appropriate organizations, and authorizing additions and changes.
_______________
2008 Edition
APPENDIX 1-A
LIST OF NAMES FOR TROPICAL CYCLONES ADOPTED BY THE TYPHOON COMMITTEE FOR THE WESTERN NORTH
PACIFIC OCEAN AND THE SOUTH CHINA SEA
(Valid as of 2008)
Contributed by
I II III IV V
Name Name Name Name Name
Cambodia Damrey Kong-rey Nakri Krovanh Sarika China Haikui Yutu Fengshen Dujuan Haima DPR Korea Kirogi Toraji Kalmaegi Mujigae Meari Hong Kong, China Kai-tak Man-yi Fung-wong Choi-wan Ma-on Japan Tembin Usagi Kammuri Koppu Tokage Lao PDR Bolaven Pabuk Phanfone Ketsana Nock-ten Macao, China Sanba Wutip Vongfong Parma Muifa Malaysia Jelawat Sepat Nuri Melor Merbok Micronesia Ewiniar Fitow Sinlaku Nepartak Nanmadol Philippines Maliksi Danas Hagupit Lupit Talas RO Korea Gaemi Nari Jangmi Mirinae Noru Thailand Prapiroon Wipha Mekkhala Nida Kulap U.S.A. Maria Francisco Higos Omais Roke Viet Nam Son Tinh Lekima Bavi Conson Sonca Cambodia Bopha Krosa Maysak Chanthu Nesat China Wukong Haiyan Haishen Dianmu Haitang DPR Korea Sonamu Podul Noul Mindulle Nalgae Hong Kong, China Shanshan Lingling Dolphin Lionrock Banyan Japan Yagi Kajiki Kujira Kompasu Washi Lao PDR Leepi Faxai Chan-hom Namtheun Pakhar Macao, China Bebinca Peipah Linfa Malou Sanvu Malaysia Rumbia Tapah Nangka Meranti Mawar Micronesia Soulik Mitag Soudelor Fanapi Guchol Philippines Cimaron Hagibis Molave Malakas Talim RO Korea Jebi Neoguri Goni Megi Doksuri Thailand Mangkhut Rammasun Morakot Chaba Khanun U.S.A. Utor Matmo Etau Aere Vicente Viet Nam Trami Halong Vamco Songda Saola
Replaced names Corrected spelling Aere for Kodo (2002) Maliksi for Bilis (2008) Megkhla to Mekkhala (2002) Morakot for Hanuman (2002) Son Tinh for Saomai (2008) Kularb to Kulap (2002) Matmo for Chataan (2004) Leepi for Xangsane (2008) Ramasoon to Rammasun (2002) Nuri for Rusa (2004) Mangkhut for Durian (2008) Vipa to Wipha (2002) Peipah for Vamei (2004) Kaemi to Gaemi (2008) Molave for Imbudo (2004) Chebi to Jebi (2008) Noul for Pongsona (2006) Noguri to Neoguri (2008) Dolphin for Yanyan (2006) Changmi to Jangmi (2008) Mujigae for Maemi (2006) Koni to Goni (2008) Mirinae for Sudal (2006) Lionrock for Tingting (2006) Fanapi for Rananim (2006) Pakhar for Matsa (2007) Doksuri for Nabi (2007) Haikui for Longwang (2007) Sanba for Chanchu (2008)
2008 Edition
APPENDIX 1-A, p. 2
OPERATIONAL PROCEDURES FOR THE ASSIGNMENT
OF NAMES OF TROPICAL CYCLONES
(a) RSMC Tokyo – Typhoon Center will assign a name each time a 4-digit identification number is to be assigned. That is, names on the Typhoon Committee list will only be given to tropical cyclones of tropical storm strength or above. Each tropical cyclone should be identified by its name followed by the 4-digit number in brackets. The same names and numbers should also be used in bulletins issued by the Tokyo Tropical Cyclone Advisory Centre under the umbrella of the International Civil Aviation Organization (ICAO) as well as in bulletins for Meteorological Area (METAREA)-XI of the Global Maritime Distress and Safety System (GMDSS) issued by both China and Japan. This would contribute to the standardization of the usage of names of tropical cyclones as was desired by the Typhoon Committee.
(b) The exchange of observational data should be promoted as much as possible in addition to what
is already exchanged among the warning centres and the meteorological services in the region, to ensure that RSMC Tokyo – Typhoon Center would benefit from the best possible data and information needed for it to carry out its work.
(c) On the operation of the name list, the names will be assigned following the pre-determined order.
The name would remain unchanged throughout the life history of the tropical cyclone. To avoid confusion, tropical cyclones given a name before crossing the Date Line and entering the western North Pacific should be assigned a number by RSMC Tokyo – Typhoon Center but should not be assigned a new name in the Typhoon Committee list. RSMC Honolulu Hurricane Center will continue the use of the tropical cyclone names assigned by RSMC Tokyo – Typhoon Center when tropical cyclones cross the Date Line from west to east.
(d) The names and numbers assigned by RSMC Tokyo – Typhoon Center will be used by all
Typhoon Committee Members when issuing warning bulletins intended for the international community including the press, aviation and shipping.
(e) The Typhoon Committee, as the authority to maintain the list, shall review the list of names and
its operation regularly at its annual sessions as the need arises. (f) Members may request the retirement of a name from the list particularly in case of tropical
cyclones causing extensive destruction or for other reasons. Such notification shall be made preferably within a year of the event. The decision to retire names should be made at the regular review at annual sessions of the Typhoon Committee.
2008 Edition
APPENDIX 1-B
LIST OF ACRONYMS USED IN THE OPERATIONAL MANUAL - METEOROLOGICAL COMPONENT -
AFTN Aeronautical Fixed Telecommunication Network AIREP Aircraft En-route Report APT Automatic Picture Transmission ASDAR Aircraft to Satellite Data Relay DPSK Differential Phase-Shift Keying EIR Enhanced Infrared ESCAP Economic and Social Commission for Asia and the Pacific FAX Facsimile GMS Geostationary Meteorological Satellite GOES Geostationary Operational Environmental Satellite GTS Global Telecommunication System HRPT High Resolution Picture Transmission IR Infrared JMA Japan Meteorological Agency JTWC Joint Typhoon Warning Centre LTP Long Term Plan MANAM Manual Amendment MDUS Medium Scale Data Utilization Station MOS Model Output Statistics MSL Mean Sea Level MTI Moving Target Indicator MTSAT Multi-functional Transport Satellite NESDIS National Environmental Satellite, Data and Information Service NMC National Meteorological Centre NMS National Meteorological Service NOAA National Oceanic and Atmospheric Administration NWP Numerical Weather Prediction OPMET Operational Meteorological Data RADOB Report of ground radar weather observation RMC Regional Meteorological Centre ROBEX Regional OPMET Bulletin Exchange RSMC Regional/Specialized Meteorological Centre RTH Regional Telecommunication Hub SDUS Small Scale Data Utilization Station S.VISSR Stretched VISSR SAREP Report of synoptic interpretation of cloud data obtained by a meteorological satellite SST Sea Surface Temperature TC Typhoon Committee TCP Tropical Cyclone Programme TEMP Upper-level pressure, temperature, humidity and wind report from a land station TOPEX Typhoon Operational Experiment UNDP United Nations Development Programme UTC Universal Time Coordinated VIS Visible VISSR Visible and Infrared Spin Scan Radiometer WMC World Meteorological Centre WMO World Meteorological Organization WWW World Weather Watch
2008 Edition
APPENDIX 2-A
LIST OF STATIONS FROM WHICH ENHANCED SURFACE OBSERVATIONS ARE AVAILABLE
The following stations will make hourly surface observations when they are within 300 km of the centre of a tropical cyclone of TS intensity or higher: Cambodia China (54): 662, 753, 776, 836, 843, 857, 863, 929, 945 (58): 040, 150, 238, 251, 265, 345, 362, 457, 472, 477 543, 556, 569, 646, 659, 660, 666, 754, 834, 847, 911, 921, 927, 944 (59): 096, 117, 134, 278, 287, 293, 316, 431, 456, 493, 501, 632, 644, 658, 663, 673, 758, 838, 845, 855, 948, 981 Democratic People's Republic of Korea (47): 003, 005, 008, 014, 016, 020, 022, 025, 028, 031, 035, 037, 039, 041, 045, 050, 052, 055, 058, 060, 061, 065, 067, 068, 069 Hong Kong, China (45): 007 Japan (47): 401, 407, 409, 412, 417, 418, 420, 421, 423, 426, 430, 570, 575, 582, 584, 585, 588, 590, 595, 598, 600, 602, 604, 605, 607, 610, 615, 616, 618, 624, 626, 629, 632, 636, 638, 648, 651, 655, 656, 662, 663, 670, 672, 675, 678, 740, 741, 746, 747, 750, 755, 759, 761, 762, 765, 768, 770, 772, 777, 778, 780, 800, 807, 813, 815, 817, 819, 827, 830, 837, 843, 887, 891, 893, 895, 898, 899, 909, 912, 918, 927, 936, 945, 971, 991 Lao People's Democratic Republic Macao, China (45): 011 Malaysia (48): 601, 615, 620, 647, 650, 657, 665 (96): 413, 421, 441, 449, 465, 471, 481, 491
LIST OF STATIONS FROM WHICH ENHANCED UPPER-AIR OBSERVATIONS ARE AVAILABLE
The following stations will make 6-hourly upper-air observations when they are within 300 km of the centre of a tropical cyclone of TS intensity or higher: Cambodia China (54): 857 (57): 083, 494, 972 (58): 150, 457, 847 (59): 316, 758, 981 Democratic People's Republic of Korea (47): 041, 058 Hong Kong, China (45): 004 Japan (47): 401, 412, 420, 582, 590, 600, 646, 678, 744, 778, 807, 827, 909, 918, 936, 945, 971*, 991* * except 18 UTC Lao People's Democratic Republic Macao, China Malaysia (48): 601, 615, 650, 657 (96): 413, 441, 471, 481 Philippines (98): 223, 433, 444, 618, 646, 573 Republic of Korea (47): 090, 102, 122, 138, 158, 169, 185 Thailand (48): 327, 407, 455, 480, 500, 551, 565, 568
2008 Edition
APPENDIX 2-B, p. 2 USA (91): 212, 334, 348, 366, 376, 408, 413 Viet Nam (48): 820, 855, 900 Note: Name, latitude, longitude and elevation of these stations are included in Weather Reporting, Volume A - Observing
Stations (WMO Publication No. 9).
2008 Edition
APPENDIX 2-C
DISTRIBUTION OF THE RADAR STATIONS OF TYPHOON COMMITTEE MEMBERS
2008 Edition
APPENDIX 2-D, p.1
TECHNICAL SPECIFICATIONS OF RADARS OF TYPHOON COMMITTEE MEMBERS
Name of the Member China
NAME OF STATION Shanghai Wenzhou Fuzhou Shantou Xishadao
SPECIFICATIONS Unit
Index number 58367 58659 58941 59316 59981
Location of station 31° 02´ N 27° 51´ N 25° 59´ N 23° 17´ N 16° 50´ N 121° 57´ E 120° 49´ E 119° 32´ E 116° 44´E 112° 20´ E
Antenna elevation m 68 294 652.5 196.7 8.5
Wave length cm 10.6 10.6 10.4 10.4 10.6
Peak power of transmitter kW 500 500 500 500 500
Pulse length µ s 1 3.0 1.0 1 3
Sensitivity minimum of receiver dBm -110 -110 -109 -109 -110
Beam width (Width of over -3dB deg 2.0 2.0 2.0 1.2 2.0 antenna gain of maximum)
PRESENT STATUS 1.Operational 1 1 1 1 1 2.Not operational(for research etc.)
2008 Edition
APPENDIX 2-D, p.6
Name of the Member Japan - 3
NAME OF STATION
Nagoya
Osaka /Takayasuyama
Matsue /Misakayama
Hiroshima /Haigamine
Murotomisaki
SPECIFICATIONS Unit
Index number 47636 47773 47791 47792 47899
Location of station
35° 10´ N 34° 37´ N 35° 33´ N 34° 16´ N 33° 15´ N
136° 58´ E 135° 39´ E 133° 06´ E 132° 36´ E 134° 11´E
Antenna elevation m 72.2 497.6 554.7 746.9 198.8
Wave length cm 5.66 5.66 5.69 5.66 5.66
Peak power of transmitter kW 250 250 250 250 250
Pulse length µ s 2.5 2.8 2.8 2.8 2.6
Sensitivity minimum of receiver
-109 -113 -112 -112 -112
dBm
Beam width (Width of over -3dB antenna gain of maximum)
1.5(H)
1.3(V)
1.0(H)
1.0(V)
1.0(H)
1.0(V)
1.0(H)
1.0(V)
1.1(H)
1.1(V) deg
Detection range km 300 300 300 300 300
Scan mode in observation
2 2 2 2 2 1.Fixed elevation
2.CAPPI
3.Manually controlled
DATA PROCESSING
MTI processing 1 1 1 1 1
1.Yes, 2.No
Doppler processing 2 2 2 2 2
1.Yes, 2.No
Display 1 1 1 1 1
1.Digital, 2.Analog
OPERATION MODE (When tropical
1 1 1 1 1
cyclone is within range of detection)
1.Hourly
2.3-hourly
3.Others
PRESENT STATUS
1 1 1 1 1 1.Operational
2.Not operational(for research etc.)
2008 Edition
APPENDIX 2-D, p.7
Name of the Member Japan - 4
NAME OF STATION
Fukuoka /Sefurisan
Tanegashima/Nakatane
Naze /Funchatoge
Naha /Itokazu
Ishigakijima /Omotodake
SPECIFICATIONS Unit
Index number 47806 47869 47909 47937 47920
Location of station
33° 26´ N 30° 38´ N 28° 24´ N 26° 09´ N 24° 26´ N
130° 21´ E 130° 59´ E 129° 33´ E 127° 46´ E 124° 11´E
Antenna elevation m 982.7 290.5 315.7 209.7 535.5
Wave length cm 5.66 5.66 5.66 5.66 5.70
Peak power of transmitter kW 250 250 250 250 250
Pulse length µ s 2.6 2.5 2.6 2.5 2.7
Sensitivity minimum of receiver
-111 -113 -113 -112 -113
dBm
Beam width (Width of over -3dB antenna gain of maximum)
1.1(H)
1.0(V)
1.1(H)
1.0(V)
1.1(H)
1.0(V)
1.3(H)
1.4(V)
1.1(H)
1.1(V) deg
Detection range km 300 300 300 300 300
Scan mode in observation
2 2 2 2 2 1.Fixed elevation
2.CAPPI
3.Manually controlled
DATA PROCESSING
MTI processing 1 1 1 1 1
1.Yes, 2.No
Doppler processing 2 2 2 2 2
1.Yes, 2.No
Display 1 1 1 1 1
1.Digital, 2.Analog
OPERATION MODE (When tropical
1 1 1 1 1
cyclone is within range of detection)
1.Hourly
2.3-hourly
3.Others
PRESENT STATUS
1 1 1 1 1 1.Operational
2.Not operational(for research etc.)
2008 Edition
APPENDIX 2-D, p.8
Name of the Member Macao, China
NAME OF STATION TAIPA GRANDE
SPECIFICATIONS Unit
Index number 45011
Location of station 22.1599N 113.5624E
Antenna elevation m 185
Wave length cm 10.9
Peak power of transmitter kW 800
SP 0.83
LP 2.0
Sensitivity minimum of
receiver dBm -110 or -111
Beam width
(Width of over -3dB deg 1.3
antenna gain of maximum)
SP 100
LP 300(Dual PRF)
LP 400
Scan mode in observation 1.Fixed elevation 2.CAPPI Others 3.Manually controlled
DATA PROCESSING
MTI processing 1 1.Yes, 2.No
Doppler processing 1 1.Yes, 2.No
Display 1 1.Digital, 2.Analog
OPERATION MODE (When tropical
cyclone is within range of detection)
1.Hourly Every 2.3-hourly 12 minutes 3.Others
PRESENT STATUS 1.Operational 1 2.Not operational(for research etc.)
Pulse length ƒÊ s
Detection range km
2008 Edition
APPENDIX 2-D, p.9
Name of the Member Malaysia - 1
NAME OF STATION
Alor Star Kota BharuKuala
Lumpur (Sepang)
Kuala Lumpur
(Subang) Kluang
SPECIFICATIONS
Index number 48603 48615 48650 48647 48672
Location of station
6° 11´ N 6° 10´ N 2° 51´ N 3° 07´ N 2° 01´ N
100° 24´ E 102° 17´ E 101° 40´ E 103° 13´ E 103° 19´E
Antenna elevation m 24 33 25 32 113
Wave length cm 10 10 10 10 10
Peak power of transmitter kW 650 650 750 650 650
Pulse length µ s 0.8 and 2 2 1 and 3 2 0.8 and 2
Sensitivity minimum of receiver
-110 (.8 μs)-113 (2 μs) -113 -110 (.8 μs)
-115 (3 μs) -113 -110 (.8 μs)-113 (2 μs) dBm
Beam width (Width of over -3dB antenna gain of maximum)
2 2 1 2 2 deg
Detection range km 400 400 400 400 400
Scan mode in observation
2 2 2 2 2 1.Fixed elevation
2.CAPPI
3.Manually controlled
DATA PROCESSING
MTI processing 2 2 2 2 2
1.Yes, 2.No
Doppler processing 2 2 1 2 2
1.Yes, 2.No
Display 1 1 1 1 1
1.Digital, 2.Analog
OPERATION MODE (When tropical
3 (every 10
mins)
3 (every 10
mins)
3 (every 5 mins)
3 (every 10
mins)
3 (every 10
mins)
cyclone is within range of detection)
1.Hourly
2.3-hourly
3.Others
PRESENT STATUS 1
(from May 2005)
1 1 1 1
(from Apr 2005)
1.Operational
2.Not operational(for research etc.)
2008 Edition
APPENDIX 2-D, p.10
Name of the Member Malaysia - 2
NAME OF STATION
Kuantan Butterworth Kuching Bintulu Kota Kinabalu
SPECIFICATIONS
Index number 48657 48602 96413 96441 96471
Location of station
3° 47´ N 5° 28´ N 1° 29´ N 3° 13´ N 5° 56´ N
103° 13´ E 100° 23´ E 110° 20´ E 113° 04´ E 116° 03´E
Antenna elevation m 32 20 57 151 27
Wave length cm 10 10 5 5 5
Peak power of transmitter kW 650 650 250 250 250
Pulse length µ s 2 2 2 2 2
Sensitivity minimum of receiver
-113 -113 -113 -113 -113
dBm
Beam width (Width of over -3dB antenna gain of maximum)
2 2 1.6 1.6 1.6 deg
Detection range km 400 400 250 250 250
Scan mode in observation
2 2 2 2 2 1.Fixed elevation
2.CAPPI
3.Manually controlled
DATA PROCESSING
MTI processing 2 2 2 2 2
1.Yes, 2.No
Doppler processing 2 2 2 2 2
1.Yes, 2.No
Display 1 1 1 1 1
1.Digital, 2.Analog
OPERATION MODE (When tropical
3 (every 10
mins)
3 (every 10
mins)
3 (every 10
mins)
3 (every 10
mins)
3 (every 10
mins)
cyclone is within range of detection)
1.Hourly
2.3-hourly
3.Others
PRESENT STATUS
1 1 1 1 1 1.Operational
2.Not operational(for research etc.)
2008 Edition
APPENDIX 2-D, p.11
Name of the Member Malaysia - 3
NAME OF STATION
Sandakan
SPECIFICATIONS
Index number 96491
Location of station
5° 54´ N
118° 04´ E
Antenna elevation m 28
Wave length cm 5
Peak power of transmitter kW 250
Pulse length µ s 2
Sensitivity minimum of receiver
-113
dBm
Beam width (Width of over -3dB antenna gain of maximum)
1.6 deg
Detection range km 250
Scan mode in observation
2 1.Fixed elevation
2.CAPPI
3.Manually controlled
DATA PROCESSING
MTI processing 2
1.Yes, 2.No
Doppler processing 2
1.Yes, 2.No
Display 1
1.Digital, 2.Analog
OPERATION MODE (When tropical
3 (every 10
mins)
cyclone is within range of detection)
1.Hourly
2.3-hourly
3.Others
PRESENT STATUS
1 1.Operational
2.Not operational(for research etc.)
2008 Edition
APPENDIX 2-D, p.12
Name of the Member Philippines - 1
NAME OF STATION Aparri Baguio Virac Tanay Daet
SPECIFICATIONS Unit
Index number 98231 98321 98447 98433 98440
Location of station 18° 22´ N 16° 20´ N 13° 38´ N 14° 34´ N 14° 08´ N 121° 37´ E 120° 34´ E 124° 19´ E 121° 21´ E 122° 59´ E
Antenna elevation m 16 2256 248 650.36 12.5
Wave length cm 5.65 10.5 10.5 10.5 10.5
Peak power of transmitter kW 250 500 500 500 500
Pulse length µ s 2 4/ 0.5 3 3 3
Sensitivity minimum of
receiver dBm
Beam width
(Width of over -3dB deg 1.5 2.2 2.2 2.2 2.2
antenna gain of maximum)
Detection range km 400 400 400 400 400
Scan mode in observation Automatic Automatic Automatic Automatic Automatic 1.Fixed elevation Azimuth scan Azimuth scan Azimuth scan Azimuth scan Azimuth scan 2.CAPPI and and and and and 3.Manually controlled mode 3 elv mode 3 elv mode 3 elv mode 3 elv mode 3 elv
DATA PROCESSING
MTI processing 2 2 2 2 2 1.Yes, 2.No
Doppler processing 2 2 2 2 2 1.Yes, 2.No
Display 1 1 1 1 1 1.Digital, 2.Analog
OPERATION MODE (When tropical
cyclone is within range of detection) 1 1 1 1 1 1.Hourly occasionally occasionally occasionally occasionally occasionally 2.3-hourly every every every every every 3.Others 30 minutes 30 minutes 30 minutes 30 minutes 30 minutes
PRESENT STATUS 1.Operational 1 1 1 1 1 2.Not operational(for research etc.)
2008 Edition
APPENDIX 2-D, p.13
Name of the Member Philippines - 2
NAME OF STATION Mactan Guiuan
SPECIFICATIONS Unit
Index number 98646 98558
Location of station 10° 18´ N 11° 02´ N 123° 58´ E 128° 44´ E
Antenna elevation m 33 66
Wave length cm 10.5 10.5
Peak power of transmitter kW 500 500
Pulse length µ s 3 3
Sensitivity minimum of
receiver dBm
Beam width
(Width of over -3dB deg 2.2 2.2
antenna gain of maximum)
Detection range km 400 400
Scan mode in observation Automatic Automatic 1.Fixed elevation Azimuth scan Azimuth scan 2.CAPPI and and 3.Manually controlled mode 3 elv mode 3 elv
DATA PROCESSING
MTI processing 2 2 1.Yes, 2.No
Doppler processing 2 2 1.Yes, 2.No
Display 1 1 1.Digital, 2.Analog
OPERATION MODE (When tropical
cyclone is within range of detection) 1 1 1.Hourly occasionally occasionally 2.3-hourly every every 3.Others 30 minutes 30 minutes
PRESENT STATUS 1.Operational 1 1 2.Not operational(for research etc.)
2008 Edition
APPENDIX 2-D, p.14
Name of the Member Republic of Korea - 1
NAME OF STATION
Gosan Seongsan Donghae Osungsan Baengnyeong-do
SPECIFICATIONS Unit
Index number 47185 47189 47106 47144 47102
Location of station
33° 17´ N 33° 23´ N 37° 30´ N 36° 01´ N 37° 56´ N
126° 10´ E 126° 53´ E 129° 07´ E 126° 47´ E 124° 40´ E
PRESENT STATUS 1.Operational 1 1 2.Not operational(for research etc.)
2008 Edition
APPENDIX 2-D, p.22
Name of the Member Viet Nam – 1
NAME OF STATION
Phu Lien Viet Tri Vinh Tam Ky Nha Trang
SPECIFICATIONS Unit
Index number 48826 48813 48845 48833 48877
Location of station
20.48 °N 21.18 °N 18.40 °N 15.34 °N 12.13 °N
106.38 °E 105.25 °E 105.41 °E 108.28 °E 109.12 °E
Antenna elevation m 140 56 27 40 52
Wave length cm 5.3 5.3 5.3 5.6 5.6
Peak power of transmitter kW 250 250 250 250 250
Pulse length µ s 2 2 2 0.8;2.0 0.8;2.0
Sensitivity minimum of receiver
-110
-110
-110
-113
-113 dBm
Beam width (Width of over -3dB antenna gain of maximum)
1.1
1.1
1.1
1
1 deg
Detection range km 384 384 384 480 480
Scan mode in observation
1,3
1,3
1,3
1,2,3
1,2,3
1.Fixed elevation
2.CAPPI
3.Manually controlled
DATA PROCESSING
MTI processing 1 1 1 1 1
1.Yes, 2.No
Doppler processing 2 2 2 1 1
1.Yes, 2.No
Display 1 1 1 1 1
1.Digital, 2.Analog
OPERATION MODE (When tropical
1, 3 1, 3 1, 3 1, 3 1, 3
cyclone is within range of detection)
1.Hourly
2.3-hourly
3.Others
PRESENT STATUS
1 1 1 1 1 1.Operational
2.Not operational(for research etc.)
2008 Edition
APPENDIX 2-D, p.23
Name of the Member Vietnam - 2
NAME OF STATION
Nha Be
SPECIFICATIONS Unit
Index number
Location of station
10° 49´ N
106° 43´ E
Antenna elevation m 25
Wave length cm 5.6
Peak power of transmitter kW 250
Pulse length µ s 0.4; 0.8; 2.0
Sensitivity minimum of receiver
-122
dBm
Beam width (Width of over -3dB antenna gain of maximum)
1 deg
Detection range km 480
Scan mode in observation
1, 2, 3 1.Fixed elevation
2.CAPPI
3.Manually controlled
DATA PROCESSING
MTI processing 1
1.Yes, 2.No
Doppler processing 1
1.Yes, 2.No
Display 1
1.Digital, 2.Analog
OPERATION MODE (When tropical
1, 3
cyclone is within range of detection)
1.Hourly
2.3-hourly
3.Others
PRESENT STATUS
1 1.Operational
2.Not operational(for research etc.)
2008 Edition
APPENDIX 2-E, p. 1
SCHEDULE OF MTSAT OBSERVATIONS AND DISSEMINATIONS
1. IMAGER observations
IMAGER observations are as follows:
(a) full-disk observations are made hourly; (b) half-disk observations of northern hemisphere are made hourly in addition to the full-
disk observations; (c) successive observations for Atmospheric Motion Vector (AMV) extraction are made
six-hourly. 2. Dissemination Services for Medium-scale Data Utilization Station (MDUS) Users
High Rate Information Transmission (HRIT) is available as dissemination service for MDUS users. High Resolution Imager Data (HiRID) service will be continued until the end of 2007.
Technical specifications of HRIT and HiRID are given in
3. Dissemination Services for Small-scale Data Utilization Stations (SDUS) Users
Low Rate Information Transmission (LRIT) is available as dissemination service for SDUS users. Weather Facsimile (WEFAX) service will be continued until the end of 2007.
Technical specification of LRIT is given in JMA LRIT Mission Specification Implementation (Issue 6, 1 Jan. 2003).
(http://www.jma.go.jp/jma/jma-eng/satellite/mtsat1r/4.3LRIT_1.pdf) (a) WEFAX - Four-sectionalized full disk
* Macao, China receives FY-2C. * Republic of Korea receives AQUA (MODIS, AIRS, AMSU, AMSR-E), FY-1 (CHRPT) and TERRA (MODIS). * Singapore receives AQUA (MODIS), FY2B (S-VISSR), FY-1 (CHRPT) and TERRA (MODIS).
2008 Edition
APPENDIX 2-G
TROPICAL CYCLONE PASSAGE REPORT FORM
Time Observed(10 min. ave.)Time Observed Time Observed Amount DatehPa (UTC) mps (UTC) mps (UTC) mm Observed
Minimum Sea Level Pressure Maximum Sutained Wind Peak Gust RainfallStation/buoy/shipNumber
TC Number (RSMC No.)
2008 Edition
APPENDIX 3-A, p1
OUTLINE OF RSMC TOKYO – TROPICAL CYCLONE PREDICTION MODELS (a) Global Spectral Model (GSM-0711) Data Assimilation: - 4-D variational calculus (4D-VAR) with its own 3 to 9-hours prediction used as a first guess back ground (6-hours assimilation window) - Data cut-off at 2.3 hours from synoptic time for prediction model
at 5.2 ~ 11.2 hours from synoptic time for assimilation cycle - Dynamic quality control considering temporal and spatial variabilities
- 0.1875° x 0.1875° Gaussian grid (1920 x 960) - Model p-sigma hybrid levels (60) + surface (1)
(bogusing of tropical cyclones) - Axis-symmetric structure based on Frank’s (1977) empirical formula with parameters
prescribed on forecasters’ analysis mainly applying the Dvorak method to MTSAT imagery
- Asymmetric structure derived from first-guess field (prediction using GSM) - Bogus structure is given as pseudo-observation data to the analysis for the prediction
model Initialization: Incremental initialization by Ballish et al. (1992) and vertical mode initialization by Bourke and McGregor (1983) Operation: (schedule) Four times a day (0000, 0600, 1200 and 1800UTC) (integration time) 84 hours from 0000, 0600 and 1800UTC, and 216 hours from 1200UTC Prediction model: (dynamics) - Hydrostatic, primitive, semi-Lagrangian-form equations - Semi-implicit time integration - TL959 (~20km grid) spectral discretization in the horizontal direction - Finite differencing on 60 p-sigma hybrid levels in the vertical direction (physics) - Horizontal diffusion by linear second-order Laplacian - Arakawa-Schubert (1974) cumulus parameterization with modifications by Moorthi and
Suarez (1992), Randall and Pan (1993) and Kuma and Cho (1994) - Prognostic cloud water scheme by Smith (1990) - Bulk formulae for surface fluxes with similarity functions by Louis (1982) - Vertical diffusion with the level-2 closure model by Mellor and Yamada (1974) with moist
effect included - Gravity wave drag by Palmer et al. (1986) and Iwasaki et al. (1989) - Simple Biospheric Model (SiB) by Sellers et al. (1986) and Sato et al. (1989a,b) Boundary conditions: (SST) 0.25° x 0.25° daily analysis with climatic seasonal trend
APPENDIX 3-A, p2
2008 Edition
(b) Typhoon Ensemble Prediction System Initial condition: Interpolation of the initial condition for GSM plus ensemble perturbations Methods to make ensemble perturbations: - Singular vector method - Linearized model and its adjoint version based on those adopted in 4-D variational
calculus, which consist of full dynamics of Eulerian integrations and full physical processes containing representations of vertical diffusion, gravity wave drag, large-scale condensation, long-wave radiation and deep cumulus convection
- T63 (~180 km grid) spectral discretization in the horizontal direction - Finite differencing on 40 p-sigma hybrid levels in the vertical direction Ensemble size: 11 Operation: (schedule) Four times a day (0000, 0600, 1200 and 1800 UTC) (to be determined) (tropical cyclone conditions that can trigger model prediction) - a tropical cyclone of TS intensity or higher exists in the area of responsibility (0°N - 60°N,
100°E - 180°E) - a tropical cyclone is expected to reach TS intensity or higher in the area within the next
24 hours - a tropical cyclone of TS intensity or higher is expected to move into the area within the
next 24 hours (maximum number of predictions) Three for each synoptic time (0000, 0600, 1200 and 1800 UTC) (integration time) 132 hours (to be determined) (domain) globe (Prediction model) - Lower-resolution version of the GSM - TL319 (~55 km grid) spectral discretization in the horizontal direction - Finite differencing on 60 p-sigma hybrid levels in the vertical direction Initialization: Non-linear normal mode initialization based on Machenhauer (1977)
2008 Edition
APPENDIX 3-B, p.1
OPERATIONAL TYPHOON TRACK FORECAST METHODS USED BY TYPHOON COMMITTEE MEMBERS
Name of the Member China Item Method Type of output Name of the method
Global Numerical Model of Typhoon Track Prediction (GMTTP)
Track position up to 120h, interval is 6h
Description of the method
a) Forecast domain of GMTTP: Global b) Vertical resolution: 31L c) Horizontal resolution: T213 d) Time integration: Semi-Langilanri e) Physical processes:
Short wave radiation: morcrette,1991 Long wave radiation: Fouquart and Bonnel,1988 Turbulence diffusion: Louis et al.,1982 cumulus convection: mass flux scheme(tiedtke,1989) cloud physics: prognostic cloud scheme (Tiedtke;1993) Surface physical processes: 4 level model (Viterbo and Beljaars, 1995)
2008 Edition
APPENDIX 3-B, p.2
Name of the Member China Item Method Type of output Name of the method
Statistical dynamic method (SD-90)
12,24,36,48,60 and 72-hr forecast positions Description
of the method
a. Basic equations:
1Ffvdtdu =−
2Ffu = dtdv +
3212
Where u and v are velocity components of typhoon center; F1,F2 represent the mean effects of the pressure gradient and some other forces in the vortex area, given out by:
2)1()1()1( tbtbbF +++ 32112)2()2()2( tbtbbF +++
,
, Here bi
(j) (i=1,2,3; j=1,2) represents 6 random variables, which are statistically obtained from samples over 30-year period (1961-1990). The 24-hr numerical forecast height values at 500 hPa are used as predictors. b. Domain:
West of the Northwest Pacific area from 15°N-40°N, 115°E-140°E
c. Frequency of forecast: Twice a day 06Z, 18Z up to 72-hr
2008 Edition
APPENDIX 3-B, p.3
Name of the Member China Item Method Type of output Name of the method
Consensus forecast method using the canonical correlation
12,24,36,48,60 and 72-hr forecast positions Description of
the method
a. Basic equations:
∑+= ii xaaX 0
∑+= ii ybbY 0 Where X and Y are longitude and latitude of forecast typhoon position, respectively. xi and yi (i=1,2,3,4) are forecast longitude and latitude obtained by four sub-models: Japanese numerical model, SD-85 method, CLIPER method and Shanghai Composite Statistical method. ai and bi (i=1,2,3,4) are regression coefficients obtained by canonical correlation method. b. Domain:
West of the Northwest Pacific area from 15°N-40°N, 115°E-140°E
c. Frequency of forecast: Twice a day 06Z, 18Z up to 72-hr
2008 Edition
APPENDIX 3-B, p.4
Name of the Member Democratic People’s Republic of Korea Item Method Type of output Name of the method
Northern Hemisphere Model of Typhoon Track Prediction (NHMTTP)
Every 3 hours up to 168 hours
Description of the method
Governing equation: primitive equations Forecast domain of NHMTTP: Northern Hemisphere Resolution: T63L14 Time integration scheme: Semi-implicit Integration method: nudging of ECMWF prediction data 24 hourly. Physical processes:
- radiation considering short and long wave - Kuo-type cumulus convection - Large scale condensation - Surface physical processes - PBL by K model - Fourth order diffusion
Frequency of forecast: twice a day (00 and 12 UTC) Objective analysis: 3DVAR Initialization: digital filter
2008 Edition
APPENDIX 3-B, p.5
Name of the Member Hong Kong, China
Item Method Type of output
Name of the method Description of the method Name of the method Description of the method Name of the method Description of the method
Regression method The mean 24-hr movement of each tropical cyclone centered in each 5-degrees square is correlated with that 24 hours ago to derive regression equations for forecasting. Independent variables: Present and past 24-hour positions Domain : 5° - 25°N, 105° - 145°E Frequency of forecast: 4 times a day The space mean method The space mean technique is based on the concept of steering. Space mean charts are prepared by the computer to depict the smoothed basic flows at various upper levels with the circulation of the tropical cyclone and other small-scale eddies removed. Input : Surface, 700, 500 and 300 hPa data covering the area
0° - 65°N, 65° - 165°E The Multi-Model Ensemble Technique An equally weighted average of the tropical cyclone forecast tracks given by the global models of the UKMO (EGRR), Japan Meteorological Agency (JMA), National Centers for Environmental Prediction (NCEP) and European Centre for Medium-Range Weather Forecasts (ECMWF). Frequency of forecast: 2 times a day Reference: James S. Goerss, 2000: Tropical Cyclone Track Forecasts Using an Ensemble of Dynamical Models, Monthly Weather Review, Vol. 128, p.1187-1193.
24, 48, 72 and 96-hr movement forecasts Space mean charts and 24-hour movement forecast 24, 48, and 72-hr forecast positions
2008 Edition
APPENDIX 3-B, p.6
Name of the Member Hong Kong, China Item Method Type of output Name of the method
Operational Regional Spectral Model (ORSM)
Tropical cyclone position forecasts, surface and upper level prognoses up to 72 hours from 60-km ORSM and up to 42 hours from 20-km ORSM. Tropical cyclone forecast guidance bulletins based on the 60-km ORSM will be disseminated through the GTS when a tropical cyclone is within 10N to 30N and 105E to 125E.
Description of the method
See Appendix 3-E
2008 Edition
APPENDIX 3-B, p.7
Name of the Member Hong Kong, China
2008 Edition
APPENDIX 3-B, p.8
Name of the Member Japan
2008 Edition
APPENDIX 3-B, p.9
Name of the Member Japan
Item Method Type of output Name of the method
The global spectral model (GSM)
Description of the method Name of the method Description of the method
See Appendix 3-A (a) Typhoon Ensemble Prediction System (TEPS) See Appendix 3-A (b)
2008 Edition
APPENDIX 3-B, p.10
Name of the Member Philippines
2008 Edition
APPENDIX 3-B, p.11
Name of the Member Philippines
2008 Edition
APPENDIX 3-B, p.12
Name of the Member Philippines
2008 Edition
APPENDIX 3-B, p.13
Name of the Member Philippines
2008 Edition
APPENDIX 3-B, p.14
Name of the Member Philippines
2008 Edition
APPENDIX 3-B, p.15
Name of the Member Philippines
2008 Edition
APPENDIX 3-B, p.16
Name of the Member Republic of Korea
Item Method Type of output
Name of the method Description of the method Name of the method Description of the method Name of the method Description of the method
Global Data Assimilation and Prediction System (GDAPS) Governing equations : Primitive equation Vertical resolution : 30 levels in hybrid coordinate Horizontal representation : Spectral, with triangular truncation at wave number 213, ~0.5625° x 0.5625° Gaussian Grid (640 x 320) Initial field : Global analysis by 3DVAR (3 Dimensional
VARiational method) ( See Appendix 3-D (1). ) Regional Data Assimilation and Prediction System (RDAPS) Governing equations : Primitive equation Vertical resolution : 33 levels in sigma coordinate Horizontal resolution : 30 km on Lambert conformal projection Boundary condition: 12-hr interval prediction data by GDAPS ( See Appendix 3-D (2). ) Double Fourier-series BARotropic typhoon model (DBAR)
Governing equation: Shallow water equations Domain: Global Resolution: ~0.3515° x 0.3515° Grid (1024x512) Initial field: global analysis from GDAPS 3DVAR ( See Appendix 3-D (2). )
6 hourly TC position up to 84 hours at 00/12UTC 6 hourly TC position up to 48 hours at 00/12UTC 6 hourly TC position up to 72 hours at 00/06/12/18UTC
2008 Edition
APPENDIX 3-B, p.17
Name of the Member USA
2008 Edition
APPENDIX 3-B, p.18
Name of the Member USA
2008 Edition
APPENDIX 3-B, p.19
Name of the Member USA
2008 Edition
APPENDIX 3-B, p.20
Name of the Member USA
2008 Edition
APPENDIX 3-B, p.21
Name of the Member USA
2008 Edition
APPENDIX 3-B, p.22
Name of the Member USA
2008 Edition
APPENDIX 3-B, p.23
Name of the Member Viet Nam
Item Method Type of output
Name of the method Description of the method
Barotropic Model Governing equations : Three primitive equations formulated on a discrete grid in geographical coordinates. Dependent variables : geopotential height H (m), zonal U (m/s) and meridional V (m/s) components of wind. Domain : Two nested domains. The outermost forecasting domain is fixed and extends from 20 °S to 60°N, 60 °E to 180 °E with horizontal resolution 1.25° (121 x 81 grid points). The inner domain is vortex - centered, movable consisting of 20 x 20 grid points with resolution of 0.25 degrees. Approximation schemes: centered finite difference for spatial approximation, Adams-Bashforth for time integration. Boundary conditions are fixed. Initial global fields H, U, V are obtained from global analysis of Japan Meteorological Agency (JMA). Vortex initialisation scheme: bogus vortex is constructed based on the assumption that the storm motion is equal to the vector sum of the large scale environmental flow plus the vortex asymmetry (Smith and Ulrich, 1990; Smith, 1991; Smith and Weber, 1993; Weber and Smith, 1995; Davidson and Weber, 2000). A number of modifications had been done to this scheme for better representing characteristics of tropical cyclone motion near Viet Nam. Frequency of forecast : twice a day (for base times 00 UTC and 12 UTC) when a tropical storm is acting in the South China Sea.
Tropical cyclone positions (latitude, longitude) for +12h, +24h, +36h and +48h ahead
2008 Edition
APPENDIX 3-B, p.24
Name of the Member Viet Nam
Item Method Type of Output
Name of the method Description of the method
Barotropic model (referred to as WBAR model) with vortex initialization scheme Governing Equations: a set of shallow water equations that formulated in a geographical coordinate system Data Domain: Area of 161 x 101 grid points from 600E to 1800E and from -50S to 550N with spatial resolution of 0.750 x 0.750 in lat-long Initial Conditions: predifined 850-200mb DLM wind and height operational objective analyses and forecasts of Global Spectral Model (GSM) of Japan. Geopotential height is provided in the form of deviation from a mean distribution. Boundary Conditions: time-dependent boundary Integration Scheme: An Euler forward step and a third-order Adams-Bashforth step are used for the first two time steps, while all other time steps are Adams-Bashforth steps of third-order. Integration Step: the model time steps are variable and determined automatically by evaluation of the Courant-Friedrich-Levy criterion using the current wind and height fields. Integration Domain: is storm-relative circular domain and movable . Vortex initialization scheme: consists of a postanalysis of the predifined 850-200mb DLM wind components of the operational objective analyses and forecasts of GSM model and the construction of synthetic vortex using the information provided that by the operational TC advisories. The analysis procedure is based on the methodology of Weber and Smith (1995) and is similar to the operational vortex enhancement scheme used in TC-LAPS model. Frequency of forecast: Twice times a day when existing any tropical cyclone over the East Sea
12h, 24h, 36h and 48h forecast position of tropical cyclone
2008 Edition
APPENDIX 3-C, p.1
SAMPLES OF THE OPERATIONAL PROCEDURES AND METHODDS FOR THE TROPICAL CYCLONE ANALYSIS AND FORECASTING
1. The methods of tropical cyclone analysis and forecasting 1.1 Judgement on tropical cyclone formation 1.1.1 Satellite analysis See Appendix 3-C, p.16 (Sec. 2.2) 1.1.2 Radar analysis See Appendix 3-C, p.14 (Sec. 2.1) 1.1.3 Upper air analysis The following conditions may be assessed on an operational basis by means of upper air and streamline analyses (at the 850, 500 and/or 300 hPa levels). If the replies to the following questions are “yes” in at least one of the following cases, formation of a storm is expected.
1. Does the synoptic scale upper divergence exist over the tropical disturbance? The upper divergence favours the development of disturbance into storm. 2. Are the high level anticyclone and the warm core starting to be established or have they
developed over the disturbance? These indications show a storm formation empirically. 3 Are the convergence of the moist air and the definite organized circulation observed
(say, at the 850 hPa level) over the disturbance? These features show a storm formation empirically. 1.1.4 Synoptic surface analysis The following conditions may be assessed on an operational basis in the vicinity of the disturbance by means of the surface analysis.
1. Existence of a region of the surface pressure less than 1,000 hPa? 2. Existence of a region of the surface pressure fall more than 5 hPa per 24 hours. 3. Existence of a region of the surface mean wind more than 10 m/sec. Any existence of the region mentioned above may favour a storm formation.
1.1.5 Sea surface temperature (SST) analysis A large area of SST greater than or equal to 26°C in the vicinity of the disturbance is necessary for the formation and development of the typhoon.
2008 Edition
APPENDIX 3-C, p.2
1.2 Identification of tropical cyclone / typhoon position 1.2.1 Determination of typhoon position by means of extrapolation Central position of the typhoon can be estimated by extrapolation. This extrapolation is based on the persistence of typhoon movement in the past. 1.2.2 Radar data analysis See Appendix 3-C, p.14 (Sec.2.1) 1.2.3 Satellite analysis See Appendix 3-C, p.16 (Sec. 2.2) 1.2.4 Surface map analysis (1) The distance intersection method (with pressure profile) We assume that the strength, scale and pressure profile of the typhoon remains unchanged. Procedure
Step 1. Read the surface pressure at point A and measure the distance from point A to the typhoon center in the pressure profile chart (Fig. 3-C.1) prepared at the previous map time. Draw the arc with the distance obtained (Fig.3-C.4). Step 2. Same work for several points. Step 3. The arcs do not always intersect at one point. The typhoon center must be obtained as the average of the intersecting points.
Remarks: a. This method is not used in case of rapid development or weakening of the typhoon, or when the typhoon has come near to land because the pressure profile will change. b. When the isobar of the typhoon is not circular, this method will produce some error.
2008 Edition
APPENDIX 3-C, p.3
2008 Edition
APPENDIX 3-C, p.4
2008 Edition
APPENDIX 3-C, p.5
2008 Edition
APPENDIX 3-C, p.6
2008 Edition
APPENDIX 3-C, p.7
2008 Edition
APPENDIX 3-C, p.8
2008 Edition
APPENDIX 3-C, p.9
2008 Edition
APPENDIX 3-C, p.10
2008 Edition
APPENDIX 3-C, p.11
2008 Edition
APPENDIX 3-C, p.12
1.6.6 Very-short range prediction of rainfall by satellite observation Qualitative analysis of rainfall area can be done using satellite picture. For the quantitative analysis techniques of rainfall area and amount, digital image data must be used. The guides for detection of rainfall area is summarized as follows:
1. Identification of convective cloud area and the thickest and/or coldest “point” area of deep convective clouds
a. Draw the outlines of convective clouds.
Try to discriminate cirrus anvil from convective cloud. Cirrus anvils of deep convective clouds are seen at the 200 hPa downwind areas of the clouds.
b. Detect the “point” maximum rainfall area by examining the highest and/or coldest area in IR picture and shadows of overshooting Cb tops in VIS picture. In the case of Cb with cirrus anvil, the “point” area is usually near the upwind sharp end of the Cb cloud.
2. Analysis of movement and evolution of convective cloud and Cb cluster
Life times of Cb’s with size of 50 – 100 km including anvil are 3 – 6 hours and those of Cb clusters are about 12 hours.
Note that convective clouds in IR picture tend to continue to appear cold (white) even a few hours after convective activity and rainfall reached the peak. 3. Comparison of satellite analysis with radar analysis
Analyze rainfall area out of radar detection range by referring to the relation between satellite and radar analyses within the radar detection range.
1.7 Prediction of wind
1.7.1 Synoptic method 1. The distribution of wind within the typhoon area is resultant of gradient wind and isallobaric wind in the first approximation. However, calculation of the isallobaric wind is not easy in operational basis, therefore it is obtained approximately by adding the velocity of typhoon movement to the gradient wind. 2. The maximum wind near the moving typhoon center is usually observed in the right hand side of the direction of movement. The distribution of wind speed accompanying the typhoon may be expressed as follows:
Vmax in the right semicircle = Vmax in the left semicircle x K, where K is 1.2 to 1.4.
2008 Edition
APPENDIX 3-C, p.13
2008 Edition
APPENDIX 3-C, p.14
2008 Edition
APPENDIX 3-C, p.15
2008 Edition
2008 Edition
APPENDIX 3-C, p.16 APPENDIX 3-C, p.16
2008 Edition
APPENDIX 3-C, Annex, p.1
THE TROPICAL CYCLONE ANALYSIS AND FORECASTING TECHNIQUE USING SATELLITE DATA
This is extracted from NOAA Technical Report NESDIS 11 described by Vernon F. Dvorak in September 1984. Figure 1-4 shows diagrams outlining the steps used for analyzing both EIR pictures (Figures 1 and 2) and VIS pictures (Figures 3 and 4). Figure 5 is a worksheet to be used for the analysis. The figures are followed by detailed instructions for each step of the technique. These instructions include the techniques for the analysis of the formation, central position and intensity of the tropical cyclone as well as for the prediction of its intensity.
(1) < Global Data Assimilation and Prediction System (GDAPS) > Initial field : (analysis) 3DVAR (0.5625° horizontal resolution) (bogusing) symmetric vortex generated by empirical formulas + asymmetric structure derived from first guess field (initialization) NNMI (Non-linear Normal Mode Initialization) Operation : (schedule) two times (00UTC, 12UTC) a day (integration time) 84 hr from 00UTC, 12UTC Prediction model : (dynamics) primitive equations (vertical resolution) 30 levels in hybrid coordinate (horizontal resolution) spectral, with triangular truncation at wave number 213 grids : 320 x 640 Gaussian latitudes and longitudes Time integration : semi-implicit with time filter Physics : (diffusion) horizontal : linear Laplacian vertical : Non-local PBL scheme (surface flux) similarity function proposed by Louis Ocean : SST (unchanged from the initial field) Land : Soil temperature predicted, Simple Biosphere scheme (cumulus convection) Kuo’s scheme (radiation) long-wave cooling and solar heating with effects of diurnal cycle and cloud variation considered Products : location (lat./lon.), central pressure, maximum tangential winds, every 6 hr up to 72 hr in advance
2008 Edition
APPENDIX 3-D, p. 2 (2) < Regional Data Assimilation and Prediction System (RDAPS) > Data assimilation : (objective analysis) 3DOI (bogusing of tropical cyclones) same as GDAPS bogusing method (analysis nudging for four-dimensional data assimilation) upper level : 12-hr interval, surface : 3-hr interval Dynamics : (basic equations) primitive equations in terrain following coordinate horizontal resolution : 30 km on Lambert conformal projection (domain) Far-East region with 191 x 171 grids (vertical levels) 33 levels in sigma coordinate Physics : (diffusion) fourth order horizontal diffusion nonlocal PBL scheme (Kain-Frish scheme for cumulus parameterization) (cloud microphysical parameterization including ice effect)
(radiation scheme for long wave and short wave interactions with explicit cloud and clear-air
Initial conditions : 12hr FDDA Boundary conditions : (12-hr interval prediction data by GDAPS from initial time at T-00 hr) (daily SST analysis data produced by KMA with GOES data) Frequency of forecast : twice a day (00UTC, 12UTC) Products : location (lat./lon.), central pressure, and maximum tangential winds every 6 hr
up to 48 hr in advance
2008 Edition
APPENDIX 3-D, p. 3 (3) < Double Fourier-series BARotropic typhoon model (DBAR) > Initial field: Environmental field from a GDAPS global analysis (3DVAR) vortex Specified based on GFDL-Type Initialization scheme Height field obtained by solving the balance equation Operation: (schedule) Four times (00, 06, 12, and 18 UTC) a day (Integration time) 72 hours from 00, 06, 12, and 18 UTC Prediction model : (dynamics)
shallow water equations (horizontal resolution) grid (lat*lon): 512*1024, ~0.3515° x 0.3515° spacing (vertical level)
1 level (spectral transform method)
double Fourier series Products : 6-hourly TC location (lat./lon.) in the western North Pacific up to 72 hours
2008 Edition
APPENDIX 3-E, p.1
Outline OF HKO – Operational Regional Spectral Model
Name of the method: Operational Regional Spectral Model Description of the method: Meteorological data assimilated by the analysis scheme of the ORSM are as follows: (A) From GTS SYNOP, SHIP surface data and ship data TEMP, PILOT radiosonde and pilot data AIREP, AMDAR aircraft data SATEM satellite thickness data TOVS, ATOVS virtual temperature profiles SATOB satellite wind data (B) From FY-2C meteorological satellite of CMA FY-2C IR1 brightness temperature data (C) From NCEP data server Daily sea surface temperature analysis at 1-degree resolution (D) Through regional data exchange Data from automatic weather stations over the south China coastal region (E) Local data Tropical cyclone bogus data during tropical cyclone situations Automatic weather station data Wind profiler data Doppler weather radar data Three-dimensional multivariate optimal interpolation is performed four times a day based on 00, 06, 12 and 18UTC data for the 60-km outer domain. For the inner domain, the same objective analysis scheme is performed 8 times a day based on 00, 03, 06, 09, 12, 15, 18, and 21UTC. All analyses are applied to 36 vertical levels. The horizontal domains of both inner and outer models compose of 151 x 145 model grids in Mercator projection. The first guess fields of the model analyses are provided by their respective latest forecasts.
2008 Edition
APPENDIX 3-E, p.2 Hourly rainfall information derived from real-time calibration of radar reflectivity with rain gauge data as well as from FY-2C IR1 brightness temperature data, are incorporated into the model through a physical initialization process. In this process, the moisture of the initial field (between the lifting condensation level and the cloud top inferred from the cloud top temperature) at the point where rain is observed is adjusted to allow precipitation process to be switched on. The heating rate of the precipitation process is also adjusted to correspond to the rainfall amount observed. The rainfall information in the hour preceding analysis time is used in the outer model. For the inner model, pre-runs for 3 hours preceding analysis time are performed to incorporate the rainfall information. Non-linear normal mode initialization is performed before the forecast model is run. Basic equations Primitive hydrostatic equations Vertical Sigma-P hybrid coordinate, model top at 10hPa Forecast parameters In (surface pressure), horizontal wind components, virtual
temperature, specific humidity Initialization Non-linear normal mode initialization Physical processes Radiation scheme Sugi et al. (1990) Short wave Calculated ever hour Long wave Calculated ever hour Moisture processes Cumulus convection Arakawa-Schubert (1974) Mid-level convection Moist convection adjustment proposed by Benwell and Bushby
(1970) and Gadd and Keers (1970) Large-scale condensation Included Grid-scale evaporation and Condensation Included Planetary boundary layer Scheme proposed by Troen and Mahrt (1986) in which non-
local specification of turbulent diffusion and counter-gradient in unstable boundary layer are considered.
Surface 4-layer soil model Daily sea-surface temperature analysis (fixed in forecast) Climatological snow and sea ice distribution Climatological evaporation rate, roughness length and albedo
Numerical methods Horizontal Double Fourier Vertical Finite difference Time Euler semi-implicit time integration Topography Envelope topography, derived from 30-second
latitude/longitude resolution grid point topography data Horizontal diffusion Linear, second-order Laplacian Boundary conditions For the outer model, 6-hourly boundary data including mean
sea level pressure, wind components, temperature and dew point depression at 16 pressure levels (1000, 925, 850, 700, 500, 400, 300, 250, 200, 150, 100, 70, 50, 30, 20, 10hPa) and the surface, are provided by JMA’s GSM. For the inner model, hourly boundary data are provided by the outer 60km model.
2008 Edition
APPENDIX 4-A
EXAMPLES OF ADVISORIES ISSUED FROM RSMC TOKYO - TYPHOON CENTER
WTPQ31 RJTD 250000 RSMC TROPICAL CYCLONE PROGNOSTIC REASONING REASONING NO.11 FOR TY 0122 PODUL (0122) 1.GENERAL COMMENTS REASONING OF PROGNOSIS THIS TIME IS SIMILAR TO PREVIOUS ONE. POSITION FORECAST IS MAINLY BASED ON NWP AND PERSISTENCY. 2.SYNOPTIC SITUATION NOTHING PARTICULAR TO EXPLAIN. 3.MOTION FORECAST POSITION ACCURACY AT 250000 UTC IS GOOD. TY WILL DECELERATE FOR THE NEXT 24 HOURS THEN ACCELERATE. TY WILL RECURVE WITHIN 36 HOURS FROM 250000 UTC. 4.INTENSITY FORECAST TY WILL KEEP PRESENT INTENSITY FOR NEXT 24 HOURS. CI-NUMBER WILL BE 6.5 AFTER 24 HOURS.=
2008 Edition
APPENDIX 4-B, p.1
WEATHER FORECAST AREAS
CHINA
2008 Edition
APPENDIX 4-B, p.2
CHINA
WEATER FORECAST AREAS (DALIAN)
2008 Edition
APPENDIX 4-B, p.3
CHINA
WEATER FORECAST AREAS (GUANGZHOU)
2008 Edition
APPENDIX 4-B, p.4
CHINA
WEATER FORECAST AREAS (SHANGHAI)
2008 Edition
APPENDIX 4-B, p.5
HONG KONG, CHINA
WEATHER FORECAST AREAS
NOTE: The pecked line enclose the area for which the Hong Kong Observatory issues warnings of tropical cyclones.
2008 Edition
APPENDIX 4-B, p.6
JAPAN
WEATER FORCAST AEREAS
2008 Edition
APPENDIX 4-B, p.7
PHILIPPINES
WEATHER FORECAST AREAS
NOTE: INLAND area includes Sibuyan, Samar, Visayan and Camotes Seas. Boundary of area covered by storm warnings issued by the Philippines Weather Bureau.
2008 Edition
APPENDIX 4-B, p.8
REPUBLIC OF KOREA
WEATHER FORECAST AREAS
2008 Edition
APPENDIX 4-B, p.9
THAILAND
WEATHER FORECAST AREAS
Note : Division of forecasting areas: Area 1 : Gulf of Thailand East coast to latitude 5°N and longitude 107°E Area 2 : Gulf of Thailand West coast to latitude 5°N Area 3 : West coast of Southern Burma below latitude 14°N and West coast of Southern Thailand to latitude 5°N Area 4 : East coast of the Malay Peninsula from latitude 5°N to the Equator Area 5 : The Strait of Malacca
2008 Edition
APPENDIX 4-B, p.10
NATIONAL WEATHER SERVICE OFFICE, GUAM, USA
AREA OF RESPONSIBILITY
Note: Within this Area of Responsibility tropical cyclone watch and warning products, based on tropical cyclone forecasts issued by the Joint Typhoon Warning Center, are provided by
National Weather Service Office, Guam.
2008 Edition
APPENDIX 4-B, p.11
VIET NAM
WEATHER FORECAST AREAS
2008 Edition
APPENDIX 4-C
STATIONS BROADCASTING CYCLONE WARNINGS FOR SHIPS ON THE HIGH SEAS
Station Call sign of coastal
radio station Area covered Member Station
China Shanghai XSG Bohai Sea, Huanghai Sea, Donghai Sea, Shanghai Port, Taiwan Straits and sea around Taiwan province
Dalian XSZ North and Central Huanghai Sea and Bohai Sea
Guangzhou XSQ Taiwan Straits, Bashi Channel, Nanhai Sea and Beibu Wan Gulf
Hong Kong, China
Hong Kong Broadcast via NAVTEX on 518 kHz*
Waters inside the boundary line: 30N 105E to 30N 125E to 10N 125E, to 10N 105E, to 30N 105E
Japan Otaru JNL Sapporo and Hakodate area Kushiro JNX Hakodate area Shiogama JNN Sendai area Yokohama JGC Tokyo area Nagoya JNT Nagoya area Kobe JGD Kobe area Niigata JNV Niigata area Maizuru JNC Maizuru area Moji JNR Fukuoka area Saseho JNK Nagasaki area Kagoshima JNJ Kagoshima area Naha JNB Okinawa area Malaysia Port Penang
Labuan Miri
LY 3010 OA 3010 OE 3010
Strait of Malacca* South China Sea* South China Sea* *within 300nm from station
Pacific waters inside the boundary line: 25N 120E to 25N 135E, to 5N 135E, to 5N 115E, to 15N 115E, to 21N 120E, to 20N 120E
San Miguel NPO North Pacific waters east of 160E; Philippine Sea, Japan Sea, Yellow Sea, East China Sea, South China Sea
Republic of Korea
Seoul HLL East Sea, Yellow Sea, Jeju, Chusan, Nagasaki, and Kagoshima areas
Thailand Bangkok HSA, HSJ Gulf of Thailand, West coast of Southern Thailand, Strait of Malacca and South China Sea
U.S.A. Honolulu, Hawaii KMV-99 Pacific Ocean Viet Nam Dannang XVT 1-2 Basco Gulf, Blendong Sea and Gulf of Thailand Halphong XVG 5, 9 ditto Ho Chi Minh Ville XVS 1, 3, 8 ditto Nha Trang XVN 1, 2 ditto *Coast station VRX closed on 1 October 2006.
2008 Edition
APPENDIX 5-A, p.1
LIST OF ADDRESSES, TELEX/CABLE AND TELEPHONE NUMBERS OF THE TROPICAL CYCLONE WARNING CENTERS IN THE REGION
Centre Mailing address Telex/cable, Telephone, fax numbers Cambodia Attn. Mr Ly Chana Deputy Director Norodom Boulevard Tel.: (+855) 15 913081 Department of Agricultural Fax: (+855) 23 26345 Hydraulics and Hydrometeorology Attn. Mr Hun Kim Hak Pochentong Tel/Fax: (+855) 23 66193 Chief of Cambodian National 66192 NMC 66191 Airport China National Meteorological Center No. 46 Zhongguancun Tel.: (+86) (10) 6840 6169 China Meteorological Adm. Nandajie, Beijing 100081 Cable: 2894 (Director: Jiao Meiyan) Fax: (+86) (10) 6217 5928 E-mail: [email protected] Democratic People's Republic of Korea Mr Ko Sang Bok Oesong-dong Telex: 38022 TCT KP Director Central District Tel.: (+850) (2) 321 4539 Central Forecast Research Insitute Fax: (+850) (2) 381 4410 State Hydrometeorological Adm. Hong Kong, China Central Forecasting Office 134A Nathan Road Telex: 54777 GEOPH HX Hong Kong Observatory Tsim Sha Tsui Tel.: (+852) 2926 8371 (Attn. Mrs. Hilda Lam) Kowloon (Office hours) Hong Kong, China (+852) 2368 1944 China (24 hours) Fax: (+852) 2721 5034 (24 hours) E-mail: [email protected] Japan Forecast Division 1-3-4 Otemachi Telex: 2228080 METTOKJ Forecast Department Chiyoda-ku (24 hours) Japan Meteorological Agency Tokyo 100-8122 Tel.: (+81) (3)3211 8303 (Director:Y. Makihara) (00 - 09 UTC on weekdays) (+81) (3) 3211 7617 (24 hours) Fax: (+81) (3) 3211 8303
2008 Edition
APPENDIX 5-A, p.2 Lao People's Democratic Republic Ministry of Agriculture P.O. Box 811 Telex: 4306 ONU VTELS and Forestry, Department of Vientiane Cable: UNDEVPRO VIENTIANE Meteorology and Hydrology Macao, China Meteorological and P.O. Box 93 Tel.: (+853) 8986273 Geophysical Bureau Macao, China Fax: (+853) 28850773 (Director: Fong Soi Kun) E-mail: [email protected] Malaysia Malaysian Meteorological Dep. Jalan Sultan Tel.: (+60) (3) 7957 8116 (Central Forecast Office, 46667 Petaling Jaya (Office hours)
Director: Mr. Low Kong Chiew) Selangor Fax: (+60) (3) 7955 0964 Malaysia E-mail: [email protected] Philippines Weather Branch Asia TrustBank Bldg. Telex: 66682 WXMLA PN PAGASA 1424 Quezon Avenue Tel.: (+63) (2) 922 1996 (Weather Services Chief: Quezon City 3008 Cable: 66682 WX MLA Ellaquim A. Adug) Fax: (+63) (2) 922 5287 (24 hours) T C S Secretary: Olavo Rasquinho Avenida de 5 de Outubro Tel: (853) 8 8010531 Coloane, Macau Fax: (853) 8 8010530 E-mail: [email protected] Republic of Korea Typhoon Forecasters Officer Korea Meteorological Adm. (Chief Executive: Hee-Dong Yoo) 460-18, Sindaebang-2dong, Dongjak-gu, Seoul Tel.: (+82) (2) 2181 0672 156-720 Fax: (+82) (2) 2181 0689
2008 Edition
APPENDIX 5-A, p.3
Thailand Thai Meteorological Department 4353 Sukhumvit Road Telex: 72004 DEPMETE TH Bangkok 10260 Tel.: (+66) (2) 399 1425 (Director-General: Mr. Suparerk Tansriratanawong) Tel.: (+66) (2) 399 1426 E-mail: [email protected] Weather Forecast Bureau 4353 Sukhumvit Road Telex: 72004 DEPMETE TH Thai Meteorological Department Bangkok 10260 Tel.: (+66)(2) 398 9801 (Director: Mr. Somchai Baimoung) Fax: (+66)(2) 398 9836 Tel&Fax: (+66)(2) 399 4012-4 E-mail: [email protected] Meteorological Telecommunication 4353 Sukhumvit Road Tel.: (+66)(2) 399 4555 and Information Division Bangkok 10260 Fax: (+66)(2) 398 9861 Thai Meteorological Department (+66)(2) 399 4597 (Director: Kumpol Luengpetngam) (+66)(2) 399 4598 E-mail: [email protected] USA National Weather Service 3232 Hueneme Road Tel.: (+1-671) 472 0944 (Genevieve Miller, Meteorologist Barrigada Fax: (+1-671) 472 7405 in charge) Guam 96913 RSMC Honolulu 2525 Correa Road Suite Tel.: (+1-808) 973-5272 (Director: Jim Weyman) 250 Honolulu, HI 96822 Fax: (+1-808) 973-5271 Viet Nam Forecast Division 4 Dan Thai Than Tel.: (+84) (4) 264020 Forecast Department Hanoi Fax: (+84) (4) 254278 Hydro-Meteorological Service (Director: Nguyan Cong Thanh)
2008 Edition
APPENDIX 5-B
ABBREAVIATED HEADINGS FOR THE TROPICAL CYCLONE WARNINGS
Member Abbreviated WMO Communication Headings Cambodia China WTPQ20 BABJ Democratic People's Republic of Korea Hong Kong, China WTPQ20 VHHH, WTSS20 VHHH Japan WTPQ20 RJTD, WTPQ21 RJTD, WTPQ22 RJTD, WTPQ23 RJTD,
WTPQ24 RJTD, WTPQ25 RJTD Lao People's Democratic Republic Macao, China For domestic dissemination only and WTMU40 VMMC Malaysia For domestic dissemination only Philippines WTPH20 RPMM, WTPH21 RPMM Republic of Korea WTKO20 RKSL Singapore WTSR20 WSSS Thailand WTTH20 VTBB USA WTPQ31 - 35 PGUM Viet Nam WTVS20 VNNN
2008 Edition
APPENDIX 5-C, p.1
COLLECTION AND DISTRIIBUTION OF INFORMATION RELATED TO TROPICAL CYCLONES
Receiving station Type of Data Heading TD BJ BB HH MM SL NN KK IV PP MC
Others Best track AXPQ20 RJTD O TD TD TD TD TD BB BB BB BB
2008 Edition
APPENDIX 5-C, p.4
Note : Meaning of abbreviation O : Data originating centre TD : Data transmitting centre – Tokyo BJ : - Beijing BB : - Bangkok HH : - Hong Kong MM : - Manila SL : - Seoul NN : - Hanoi KK : - Kuala Lumpur IV : - Vientiane PP : - Phnom Penh MC : - Macao * : - Places other than described above
2008 Edition
APPENDIX 5-D
TABLE OF Abbreviated headings (TTAAii CCCC)
Macao
Macao
2008 Edition
APPENDIX 6-A
EXAMPLE OF THE MESSAGE FORMAT FOR INQUIRY ON DOUBTFUL AND GARBLED REPORTS
Example 1. Inquiry on a doubtful report BMBB01 VTBB 220245 RJTD PLEASE CHECK THE FOLLOWING REPORT BULLETIN SNTH20 VTBB DATE AND TIME 210200 LOCATION 48300 CONTENT SECTION 1, 2ND GROUP: 80540 REGARDS RSMC TOKYO = Example 2. Inquiry on a garbled report BMRR01 RPMM 210425 RJTD AHD SNPH20 RPMM 210400 =
2008 Edition
APPENDIX 6-B, p.1
PROCEDURES OF REGULAR MONITORING AT RSMC TOKYO – TYPHOON CENTER
1. Monitoring period The two appropriate periods are selected from the one year starting on 1st November and ending on 31st October of the subsequent year. Each period will be up to five consecutive days. 2. Items of monitoring The reception time of reports at RSMC Tokyo should be monitored. The types of reports to be monitored are: (i) hourly surface observations (SYNOP code), (ii) hourly ship and buoy observations (SHIP and BUOY codes), (iii) 6-hourly upper-air observations (TEMP and PILOT codes), (iv) hourly radar observations (RADOB code). 3. Format of monitoring results Samples of format of monitoring results are shown in Fig. 6-B.1 to Fig 6-B.4. 4. Distribution of monitoring results The monitoring results should be distributed once a year by RSMC Tokyo – Typhoon Center to Typhoon Committee Secretariat and its Members by the end of every year. A copy will be forwarded to WMO Secretariat. Members can also retrieve the data from the Internet server of JMA (ddb.kishou.go.jp) by using FTP. A password to connect the FTP server by using anonymous FTP is issued to Members in consultation with JMA.
STANDARD PROCEDURES FOR THE VERIFICATION OF TYPHOON ANALYSIS AND FORECAST
AT NATIONAL METEOROLOGICAL CENTRES 1. General Each Member will verify each typhoon which affects it and summarize the verification made in a year 2. Basis for verification The best initial typhoon position, central pressure and maximum sustained wind as determined from a post-analysis conducted by the RSMC. 3. Points for verification (1) Error statistics in each method (bias and standard deviation) by using common work sheets as shown in Appendix 6-E. Statistical computations involve positioning of the centre, prediction of movement, and analysis and forecast of intensity of a tropical cyclone. (2) Discussion of following points; (i) relative merits of each technique, (ii) effects of inaccuracies on the forecast, (iii) effects of meagreness of available relevant real-time observations, (iv) variation from one geographical area to another, (v) climatological factors in climatological and/or statistical method, (vi) large-scale circulation pattern for giving rise to extremely poor prediction performance.
2008 Edition
APPENDIX 6-E, p.1
Verification sheet for positioning of the centre, prediction of movement, and analysis and forecast of intensity of tropical cyclones
2008 Edition
APPENDIX 6-E, p.2
Verification sheet for positioning of the centre, prediction of movement, and analysis and forecast of intensity of tropical cyclones
2008 Edition
APPENDIX 6-E, p.3
Verification sheet for positioning of the centre, prediction of movement, and analysis and forecast of intensity of tropical cyclones
2008 Edition
APPENDIX 7-A
LIST OF DATA ARCHIVED BY RSMC TOKYO - TYPHOON CENTER (a) Level II-b Kinds of data: Surface, ship, buoy, upper-air, RADOB, aircraft, ASDAR, advisory
warning, SAREP, SATEM, SATOB, TBB grid value and cloud amount (GMS);
Area coverage: SATEM : 90°E ~ 180°E and 0° ~ 45°N; SATOB, TBB grid value and cloud amount : area covered by MTSAT.
Other data : within the area of 80°E ~ 160°W and 20°S ~ 60°N (hereafter A-area).
(b) MTSAT cloud pictures Kinds of data: Imagery and tabular form data (Monthly Report);
Imagery (for DVD-RAM data). Data form: Monthly Report (T.B.D); DVD-RAM (specification is given in Appendix 7-A, Annex). (c) Level III-a Kinds of data: Grid point data of the objective analysis obtained by the global objective
analysis system in RSMC. Area coverage: Global area covered by 1.25 X 1.25 latitude-longitude grid system. Time of analysis: 00, 06, 12 and 18 UTC Element and layer: Surface: Sea surface pressure (Ps), Temperature (Ts), dew point depression (Ts -
Tds), wind (Us, Vs); Specific pressure levels (1000 - 10 hPa): Geopotential height (Z), temperature (T), wind (U, V); Specific pressure levels (1000 - 300 hPa): Dew point depression (T-Td).
2008 Edition
APPENDIX 7-A, Annex
SPECIFICATION OF MTSAT IMAGER DATA ON DVD-RAM (DRAFT)
IMAGER data of MTSAT-1R are archived on DVD-RAM in a digital form. IMAGER Infrared Dataset contains the data of the infrared (IR1, IR2, IR3, IR4) channels, and IMAGER Visible Dataset contains the data of the visible (VIS) channel. The recording codes and file formats are selected taking into account of the convenience for use in personal computers and workstations. The specifications of the dataset volume are as follows:
Specifications of Dataset Volume Item Specification
Archive Medium DVD-RAM, 4.7GB Recording format Universal Disk Format 1.5 (UDF1.5)
Code ASCII code for character data IEEE754-1985 for float data
File type Multi-file Compression Gzip
1) IMAGER Infrared Dataset
The IMAGER Infrared Dataset contains the HiRID data of IR1, IR2, IR3 and IR4 for all of the IMAGER observations.
Specifications of IMAGER Infrared Dataset Item Specification
Channel IR1, IR2, IR3, IR4 Resolution The spatial resolution of images at nadir is 5km. Observations 56 (observations/day) Image files 56*4 (files/day) File size T.B.D
2) IMAGER Visible Dataset
The IMAGER Visible Dataset contains the HiRID data of 30 images a day for the IMAGER Observations.
Specifications of IMAGER Visible Dataset Item Specification
Channel VIS Resolution The spatial resolution of images at nadir is 1.5km. Observations 30(observations/day) Observation time F00,F01,F02,F03,F04,F05,F06,F07,F08,F09,F21,F22,F23,


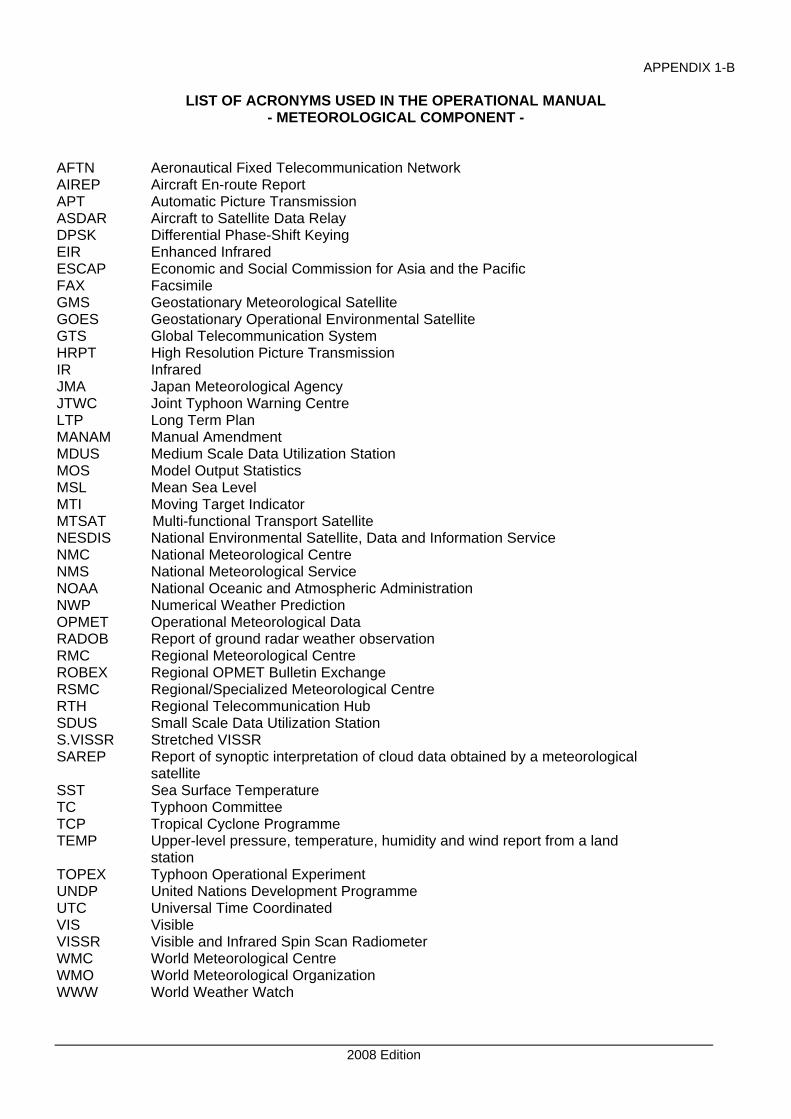


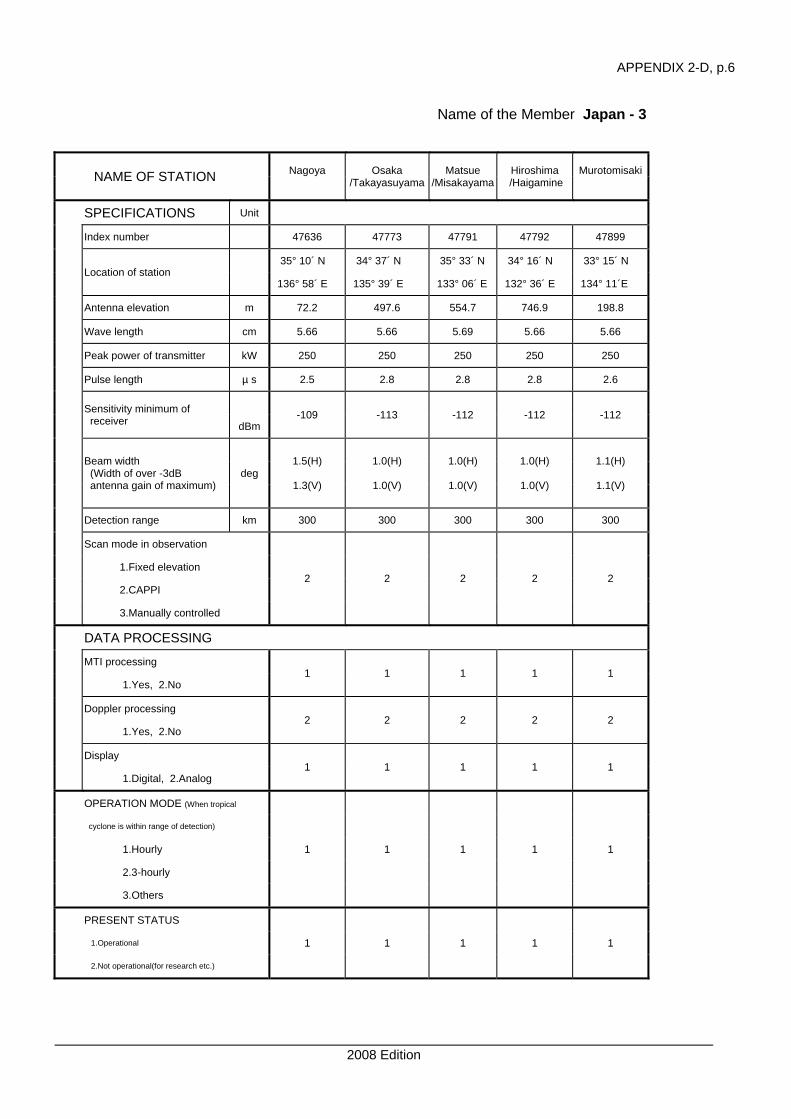


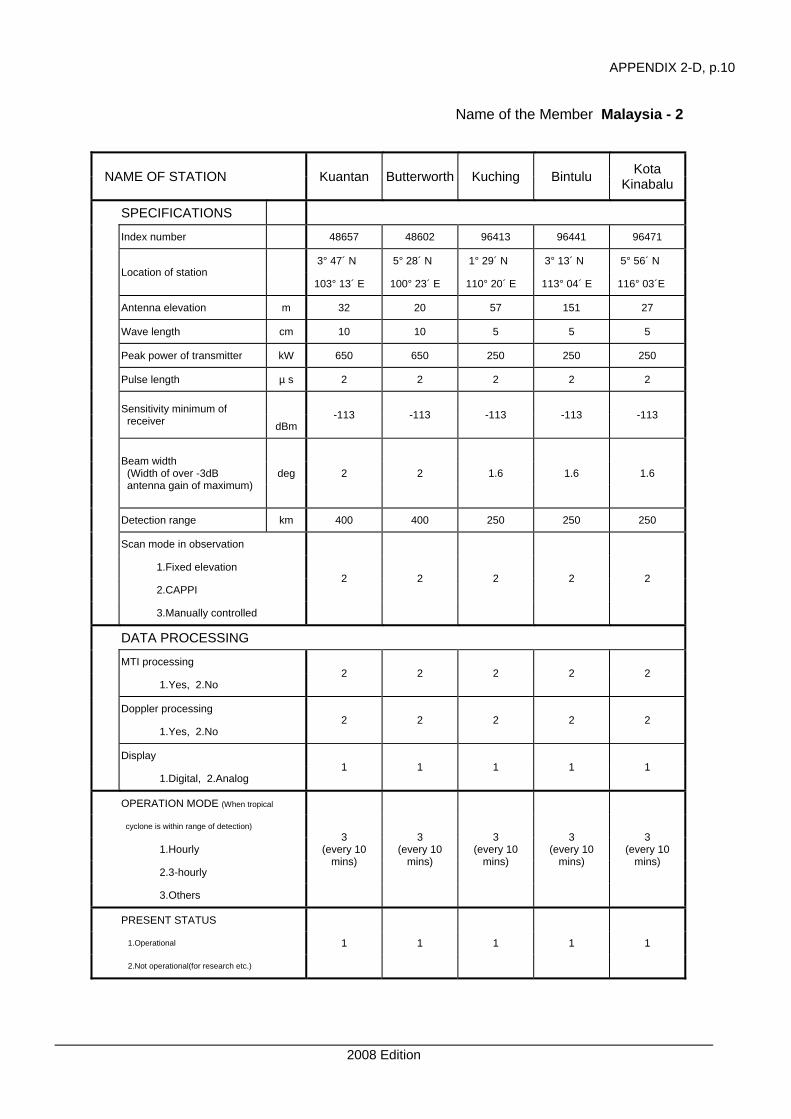


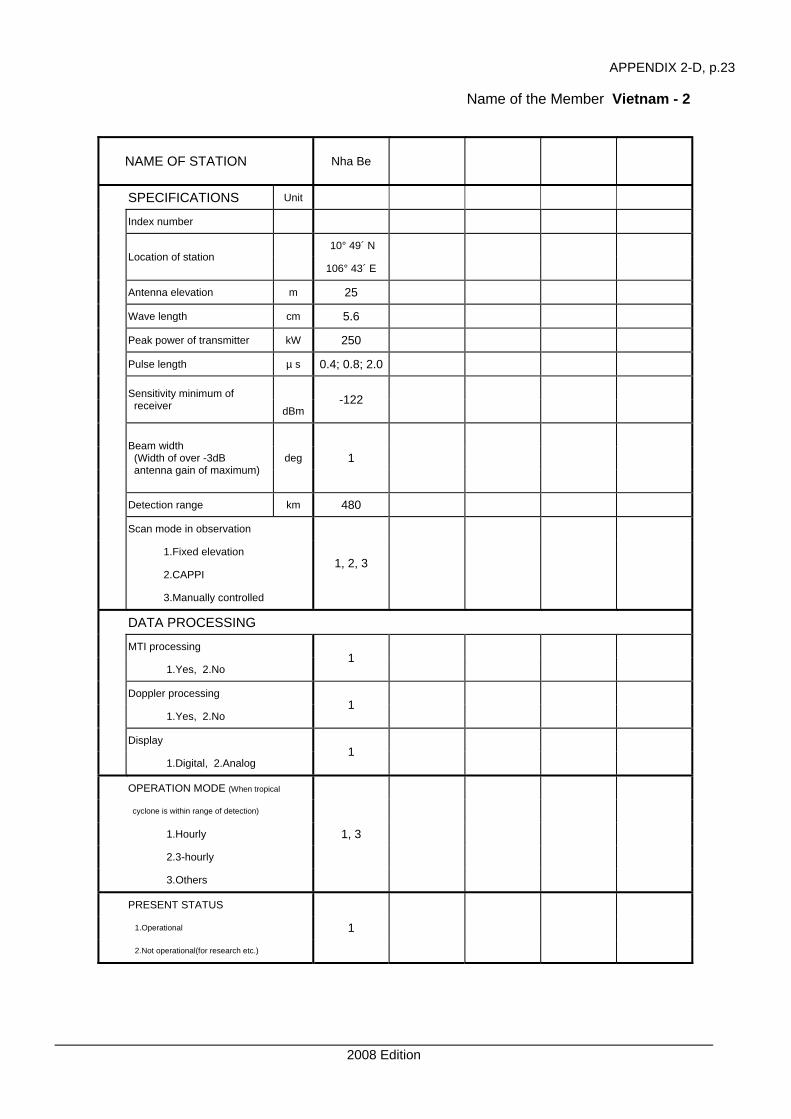
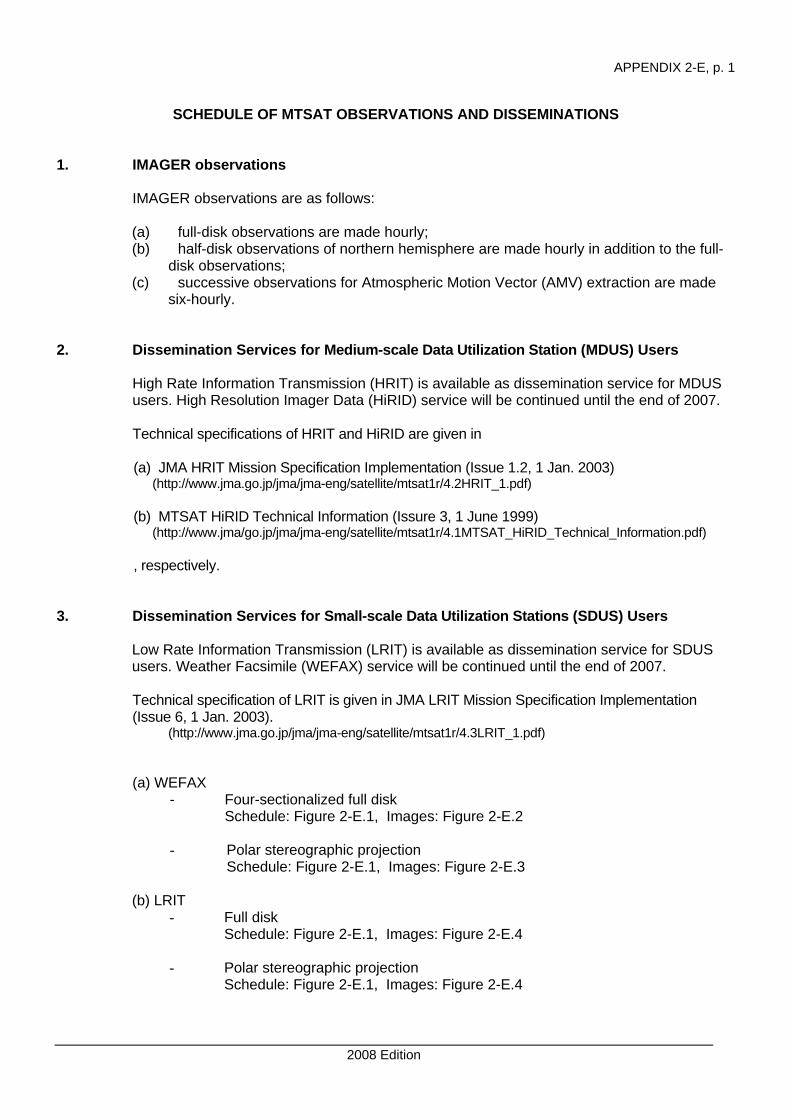


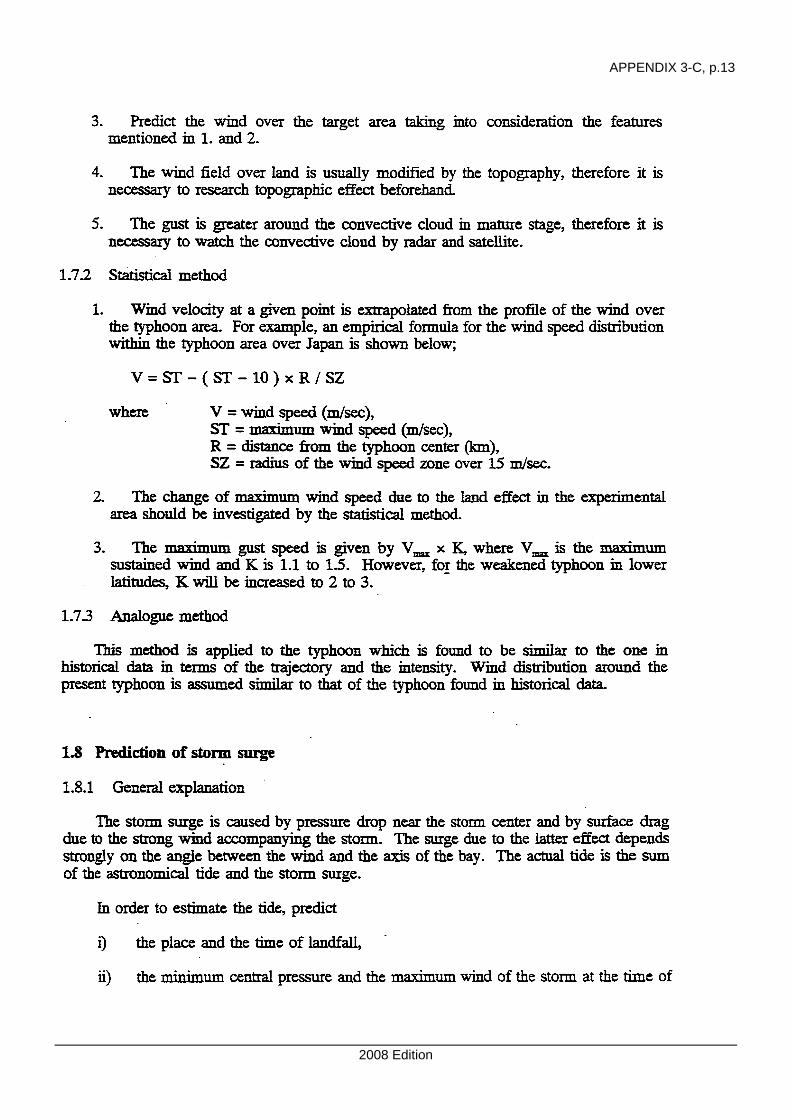


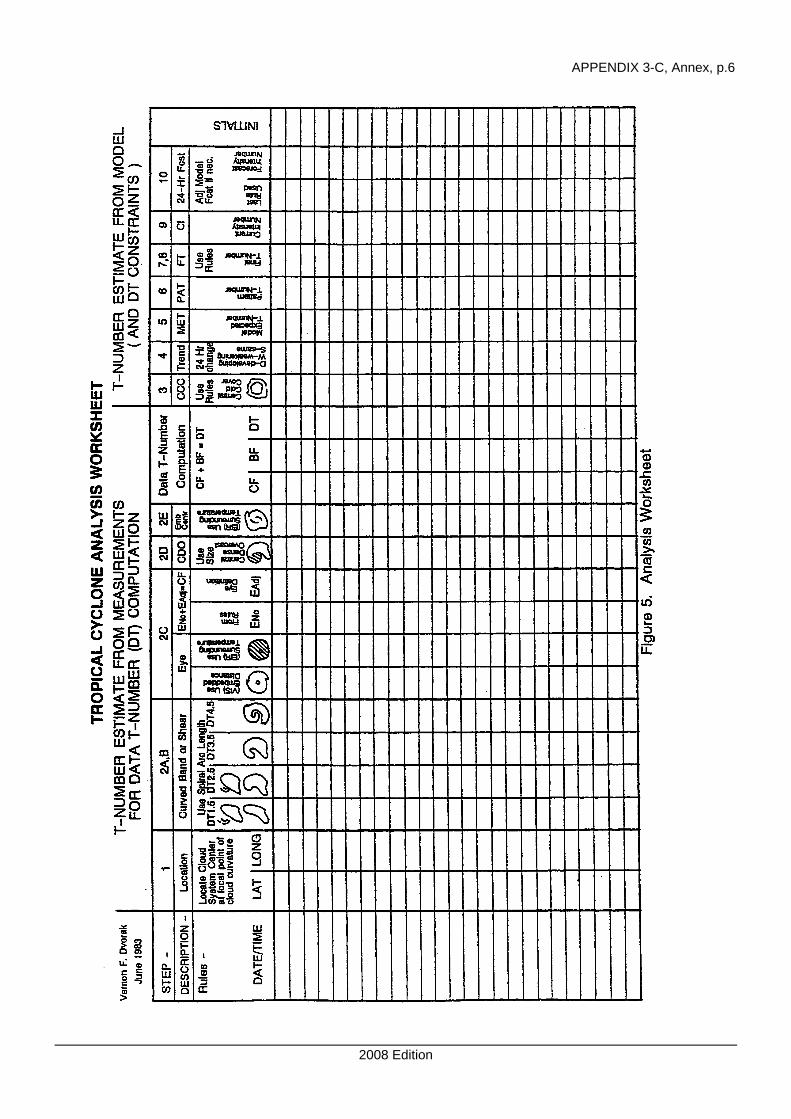


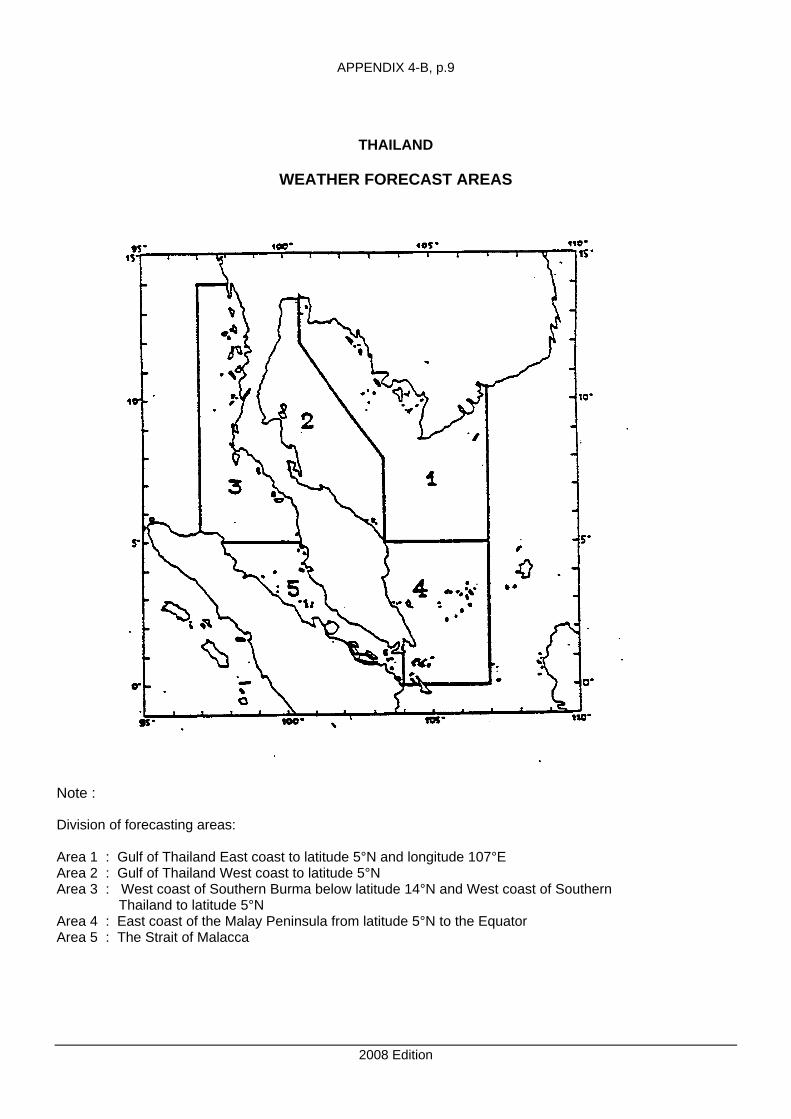

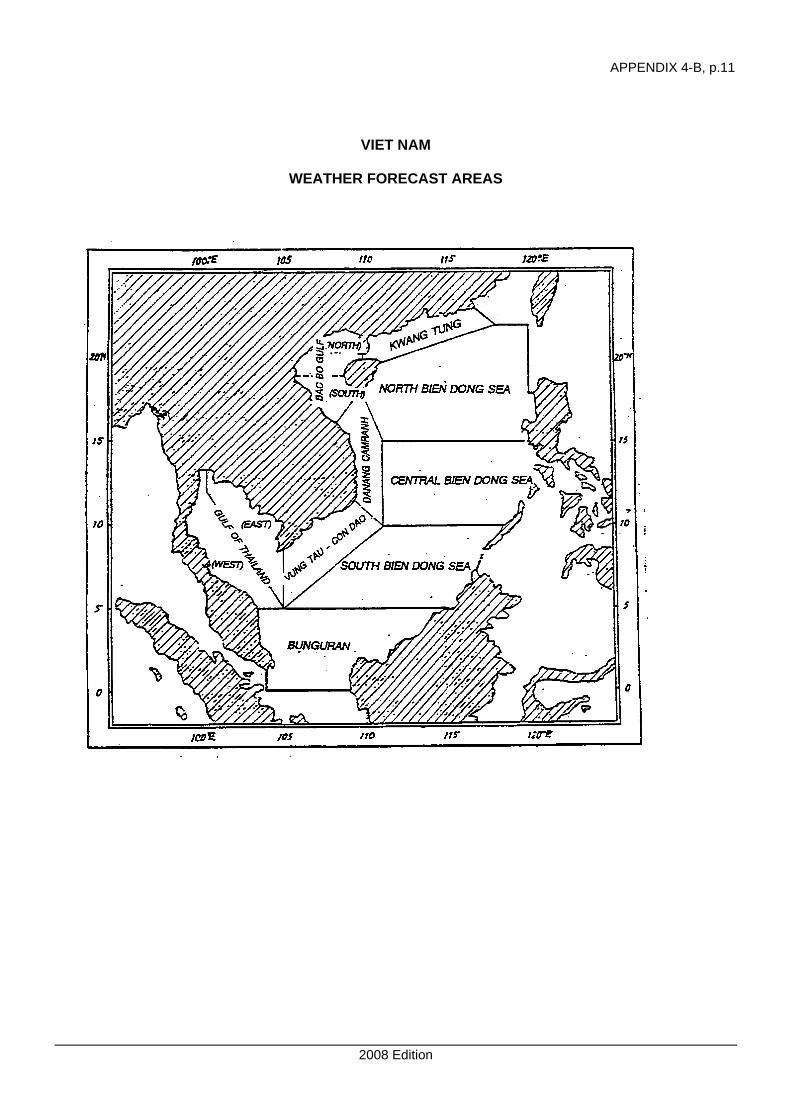


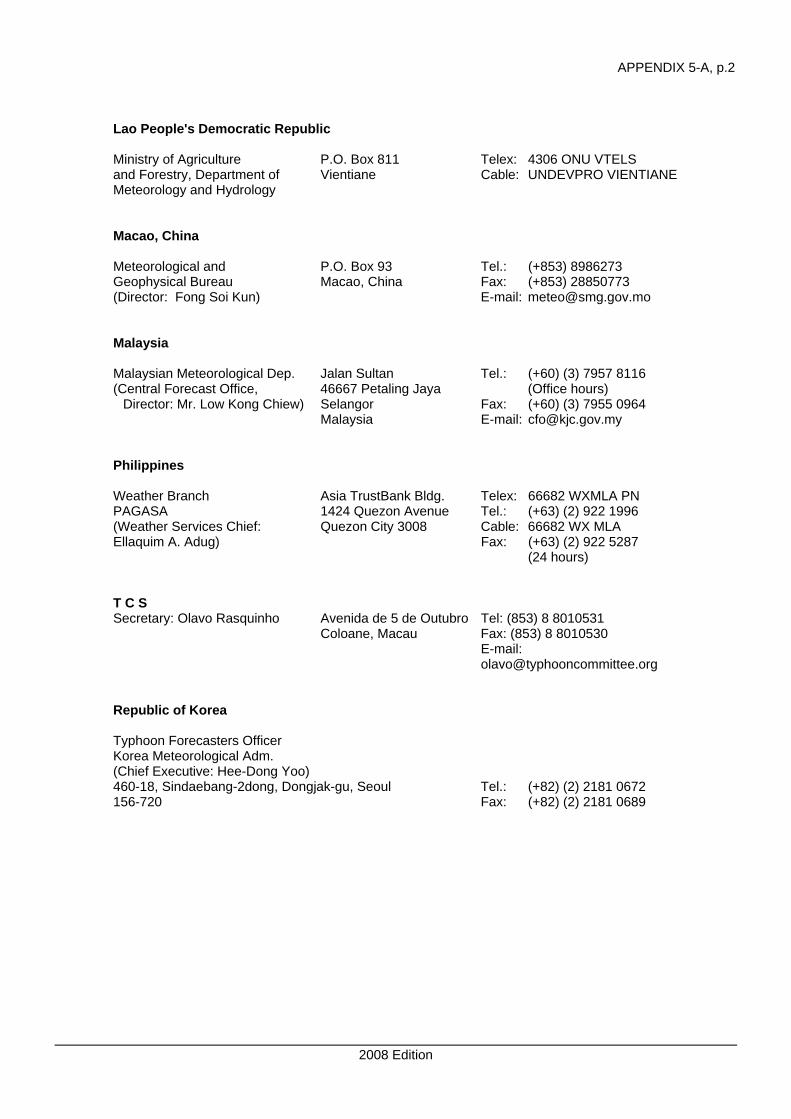


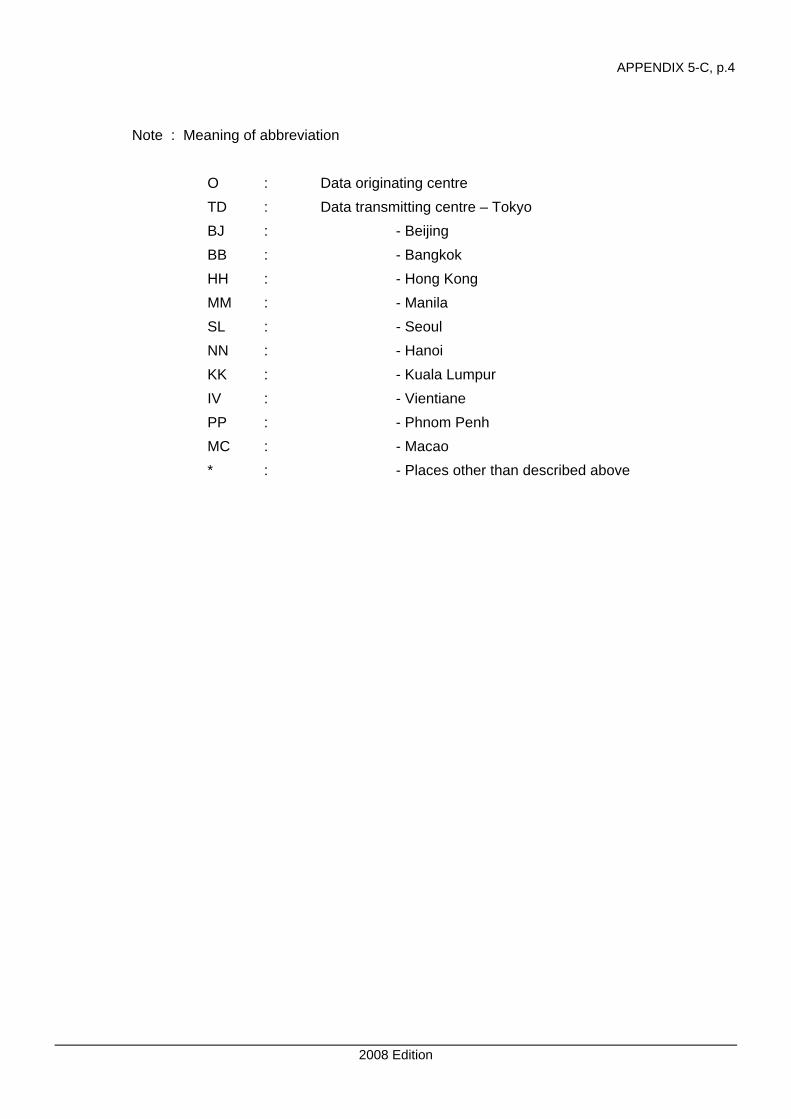


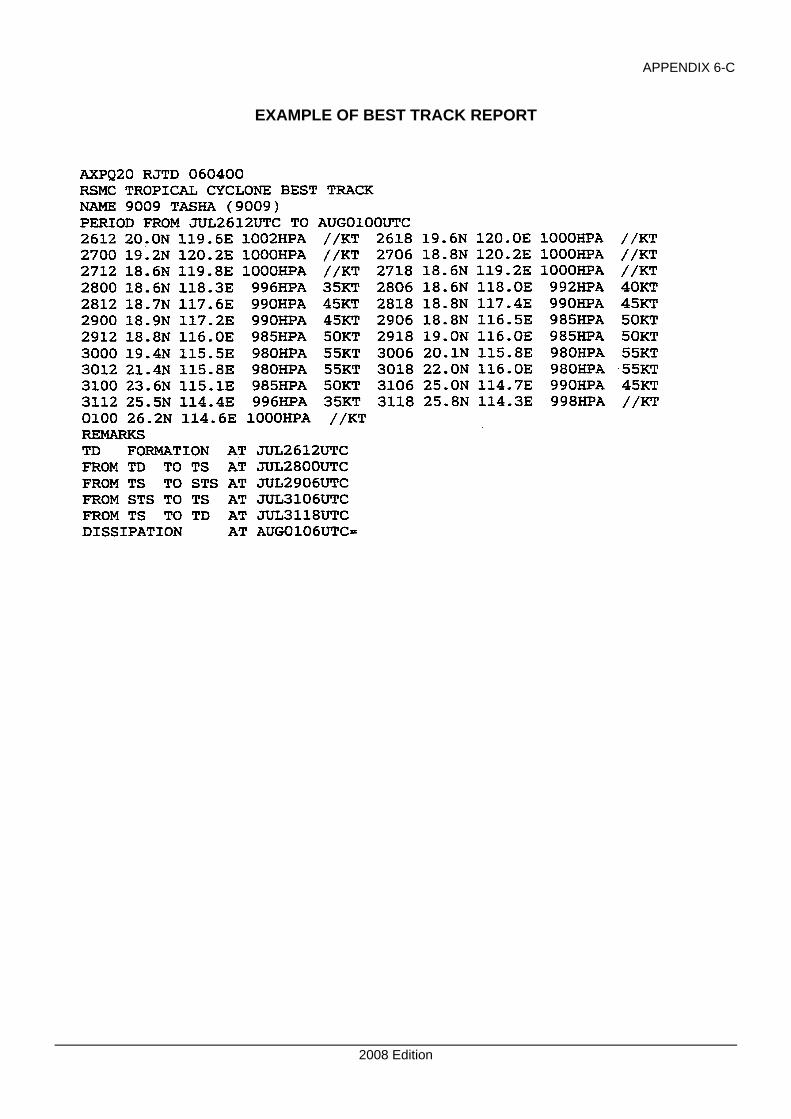


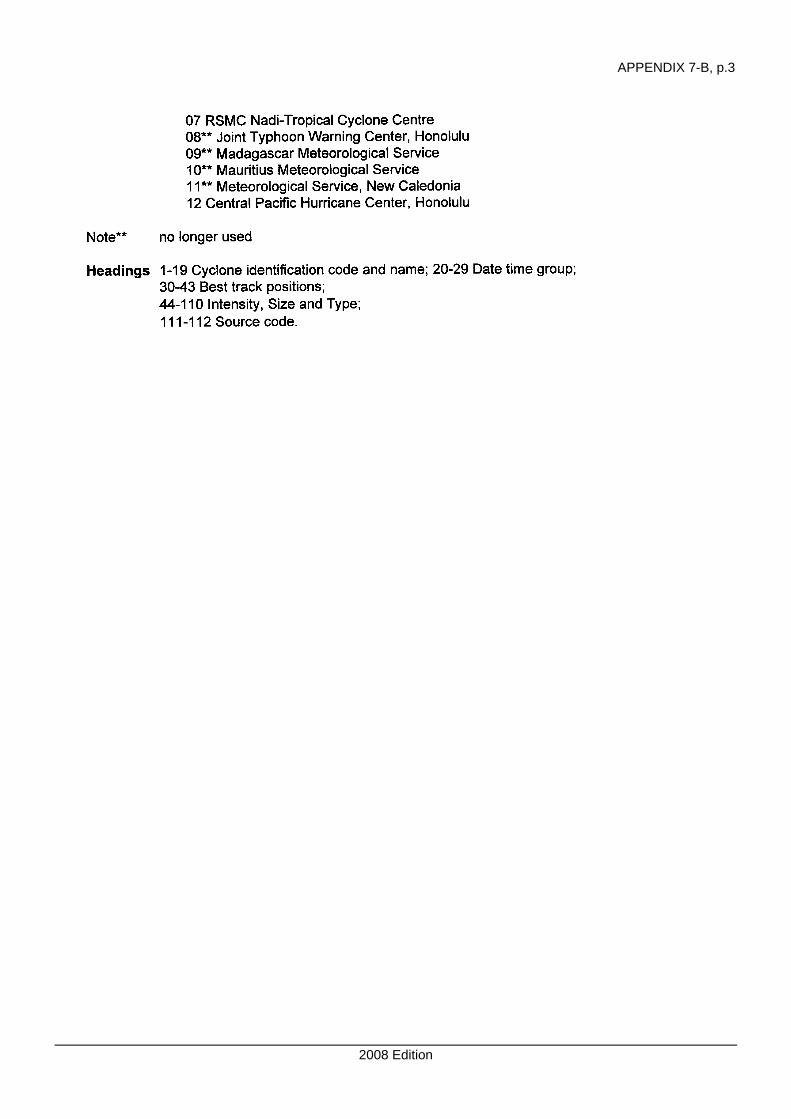


![MEMBER REPORT [China] - Typhoon Committee REport/CHina/Me… · MEMBER REPORT [China] ESCAP/WMO Typhoon Committee 13th Integrated Workshop Chiang Mai, Thailand 5-9 November 2018 .](https://static.documents.pub/doc/80x56/5f0e10ab7e708231d43d719c/member-report-china-typhoon-reportchiname-member-report-china-escapwmo.jpg)


