Cao & Xiao 1 TYPICAL PRE-CRASH SCENARIOS RECONSTRUCTION FOR TWO-WHEELERS AND PASSENGER VEHICLES AND ITS APPLICATION IN PARAMETER OPTIMIZATION OF AEB SYSTEM BASED ON NAIS DATABASE Yi Cao School of Transportation & Automotive, Xihua University China Lingyun Xiao Corresponding author: [email protected]SAMR Defective Product Administrative Center China Honglei Dong, Yan Wang SAMR Defective Product Administrative Center China Xiaobo Wu China National Institute of Standardization China Pingfei Li School of Transportation & Automotive, Xihua University China Yuanchao Qiu Shanghai University of Engineering Science China Paper Number 19-0272 ABSTRACT The crash between two-wheelers and passenger vehicle causes a higher fatality rate and many casualties for the two- wheelers riders. Both two-wheelers and pedestrians are considered as VRU. Compared to pedestrians, two-wheelers are featured with fast moving speed and uncertain driving route, which poses a challenge to the optimal control for the autonomous emergency braking (AEB) system. This paper firstly screened 216 cases of frontal collision accidents between passenger vehicles and two-wheelers from the database of National Automobile Accident In- depth Investigation System (NAIS) in China, extracted the static and dynamic variables related to the pre-crash scenarios reconstruction in each case. This paper extracted four typical pre-crash scenarios between two-wheelers and passenger vehicles from 216 accident scenarios through clustering analysis and chi-square test, reconstructed and simulated typical pre-crash scenarios by using PreScan software and completed matching, optimization and analysis on the field of view (FoV), braking trigger width (w), time to collision (TTC) of AEB system to obtain the boundary parameter conditions of the AEB system to avoid crash or greatly reduce the collision speed, providing a reference for the development of AEB systems applicable to China's road traffic scenarios. The research method used in this paper is applicable to the reconstruction and simulation analysis of pre-crash scenarios for passenger vehicles and pedestrians as well as the parameter optimization of other ADAS. In addition, the research method used in this paper also provide a technical solution for the design, test and evaluation of the automatic driving function based on typical scenarios. Key Words: two-wheelers; pre-crash scenario; accident in-depth investigation; clustering analysis; autonomous emergency braking system; advanced driving assistance system
Transcript
Cao & Xiao 1
TYPICAL PRE-CRASH SCENARIOS RECONSTRUCTION FOR TWO-WHEELERS AND PASSENGER VEHICLES AND ITS APPLICATION IN PARAMETER OPTIMIZATION OF AEB SYSTEM BASED ON NAIS DATABASE
Yi Cao School of Transportation & Automotive, Xihua University China
Lingyun Xiao Corresponding author: [email protected] SAMR Defective Product Administrative Center China
Honglei Dong, Yan Wang SAMR Defective Product Administrative Center China
Xiaobo Wu China National Institute of Standardization China
Pingfei Li School of Transportation & Automotive, Xihua University China
Yuanchao Qiu Shanghai University of Engineering Science China
Paper Number 19-0272
ABSTRACT
The crash between two-wheelers and passenger vehicle causes a higher fatality rate and many casualties for the two-wheelers riders. Both two-wheelers and pedestrians are considered as VRU. Compared to pedestrians, two-wheelers are featured with fast moving speed and uncertain driving route, which poses a challenge to the optimal control for the autonomous emergency braking (AEB) system. This paper firstly screened 216 cases of frontal collision accidents between passenger vehicles and two-wheelers from the database of National Automobile Accident In-depth Investigation System (NAIS) in China, extracted the static and dynamic variables related to the pre-crash scenarios reconstruction in each case. This paper extracted four typical pre-crash scenarios between two-wheelers and passenger vehicles from 216 accident scenarios through clustering analysis and chi-square test, reconstructed and simulated typical pre-crash scenarios by using PreScan software and completed matching, optimization and analysis on the field of view (FoV), braking trigger width (w), time to collision (TTC) of AEB system to obtain the boundary parameter conditions of the AEB system to avoid crash or greatly reduce the collision speed, providing a reference for the development of AEB systems applicable to China's road traffic scenarios. The research method used in this paper is applicable to the reconstruction and simulation analysis of pre-crash scenarios for passenger vehicles and pedestrians as well as the parameter optimization of other ADAS. In addition, the research method used in this paper also provide a technical solution for the design, test and evaluation of the automatic driving function based on typical scenarios.
The vision for development of autonomous vehicle is to achieve “zero casualty, zero accident”. Advanced driving assistance systems (ADAS) have been put into the market as an important part of autonomous vehicles. However, in complex and diverse traffic scenarios, ADAS is still facing major challenges in the accuracy of scenario recognition and rationality of decision algorithms. At present, the test and evaluation on ADAS is mainly based on limited field operational test (FOT). But in real traffic scenarios, ADAS faces more complex and special traffic scenario elements, especially in different countries and regions with the particularity of traffic scenarios. Therefore, the evaluation method based on the limited field operational test has certain limitations and the test methods based on natural driving scenarios and dangerous scenarios gradually attracting great attention in the industry [1].
Both two-wheelers and pedestrians are vulnerable road users (VRU) in traffic scenarios. Two-wheelers riders and pedestrians are often vulnerable groups in road traffic accidents. Compared with pedestrians, two-wheelers are featured with fast moving speed and uncertain driving route, so the two-wheelers are more likely to cause casualties. According to the 2015 statistical report of the World Health Organization (WHO), cyclists and motorcyclists of powered two or three wheelers accounting for 27% of fatality rate in road traffic [2]. The number of two-wheelers is huge in China, in recent years, especially after the promotion of green travel and shared bicycle travel in large and medium-sized cities in China, the number of riders and passengers of two-wheelers has increased significantly. At the same time, the number of fatality and injury of riders and passengers of two-wheelers in traffic accidents are also increasing. According to statistics, from 2004 to 2010 the number of fatality in road traffic accidents decreased from 107,077 to 65,225, but the number of fatality from powered two-wheelers (PTW) in road traffic accidents increased from 589 to 4,029 in China [3] [4]. In the Advanced Driving Assistance System (ADAS), the AEB system is the most popular type and has a great effect on improving the safety of vehicle in collisions. According to the research data providing by the Insurance Institute for Highway Safety (IIHS), AEB can reduce 27 % of traffic accidents [5]. The Federal Highway Research Institute (BASt) study shows that 70% of serious traffic accidents can be avoided by ADAS [6]. However, AEB still needs further research and evaluation on the accurate identification and reasonable decision-making of VRU, especially two-wheelers. With the gradual increase in the fatality rate of two-wheelers in recent years, global attention has been paid to the two-wheelers collision accidents. Some institutions have added or are ready for adding the collision avoidance assessment indicators for the two-wheelers in the relevant collision evaluation procedures. At present, Europe New Car Assessment Program (Euro-NCAP) [7] has added the AEB safety test for the protection of users of two-wheelers in the protection of VRU in 2018 and will add the AEB safety test for PTW in 2020. But now China New Car Assessment Program [8] (C-NCAP 2018 version) have not included the safety requirements for the AEB system aiming at two-wheelers.
At present, the AEB system as a key ADAS, has been installed and used in some vehicles and has been gradually launched in the market. However, the AEB system has caused a defective car recall case due to its false identification and mis-operation in complex road traffic scenarios. Therefore, the accuracy of the AEB system for scenario identification still requires in-depth research and test, especially the accuracy of identifying VRU. But currently, there are limited research literature about the safety tests of the AEB for VRU and the research literature mainly focuses on the safety tests of the AEB for pedestrians, so there are fewer literature about the safety tests of the AEB for two-wheelers. Based on the typical pedestrian dangerous condition on the roads in Shanghai, Liu Ying et al. [9] obtained five typical hazard scenarios by using clustering analysis and simulation analysis of AEB-pedestrian, but this study did not analyze the matching and optimization of AEB parameters. Su Jiangping et al. [10] made the analysis based on the pedestrian dangerous condition stored in the natural driving data of five cities in China and obtained four typical pedestrian traffic conflict scenarios. Chen Qiang et al. [11] analyzed three typical pedestrian use scenarios based on accident data and obtained the result that AEB system can reduce by 20% of pedestrian collision accidents, but this study also did not analyze the matching between pedestrian dangerous scenarios and AEB parameters. James Lenard et al. [12] conducted an analysis on pedestrian risk scenarios based on the UK OTS and STATS19 accident databases and constructed an AEB test scenario based on parameter deduction. Huang and Yang et al. [13] analyzed the typical pedestrian use scenarios based on the STRADA database and expertise, established a mathematical model and analyzed the field of view (FoV) parameter selected of the AEB sensor, but this study did not involve other parameters of the AEB system. Erik Rosen et al. [14] analyzed the correlation between the selection of FoV parameters of the AEB system and reduction of pedestrian collision
Cao & Xiao 3
accidents based on German GIDAS data. David Good et al. [15] analyzed the collision speed distribution between pedestrians and vehicles based on the US GES and FARS accident data and designed the pre-crash system test scenario.
The extraction of pedestrian risk scenarios and the analysis on the parameters of AEB system based on natural driving data and accident data provide reference for the extraction of two-wheelers risk scenarios with optimization and design of corresponding parameter of AEB system. Liers [16] analyzed the accident pattern of PTW and the typical accident scenarios based on the German GIDAS data, concluded that the proportion of collisions of PTW crossing the road and intersection is high and analyzed the main cause of PTW accident, but this study did not consider the design of the AEB two-wheelers test scenario. Based on the typical risk use cases of two-wheelers on the roads in Shanghai, Li Lin et al. [17] obtained seven typical risk scenarios by using clustering analysis and chi-square test and conducted simulation analysis by using simulation software, but the matching and optimization of the AEB parameters were not studied here. Sui and Zhou et al. [18] analyzed the basic situation of crush accident between two-wheelers and automobiles based on Chinese road traffic accident data and concluded that the main scenarios of crush between two-wheelers and automobiles is that the car going straight at the speed of 60km/h or above has a vertical collision with the PTW going straight at an intersection in the day and recommended as a typical scenario for the AEB two-wheelers test, but this study did not perform scenario reconstruction and simulation analysis. Based on traffic accident data, Hu Lin et al. [19] extracted 11 typical car and two-wheelers collision accident scenarios by using clustering analysis and respectively obtained the AEB test scenarios of cars-electric powered two wheelers, cars-motorcycles and cars-bikes collision, but this study did not perform scene reconstruction and parameter optimization analysis. Compared with pedestrians, two-wheelers, especially PTW, have the characteristics of fast driving speed and uncertain driving route. They pose great challenge to sensor selection, parameter optimization and performance evaluation of AEB system and they need to be solved urgently.
In view of two-wheelers safety test by the AEB system, this paper firstly screened the frontal collision accident between passenger cars and two-wheelers based on the NAIS accident in-depth survey data, extracted the static and dynamic variables of the accident cases, extracted the typical pre-crash scenarios of two-wheelers and passenger cars by clustering analysis and chi-square test and performed reconstruction and simulation of typical pre-crash scenarios by using PreScan software. Then, the main control parameters of the AEB system were matched and optimized to obtain the boundary parameter conditions for the AEB system to avoid collision or greatly reduce the collision speed.
DATA SOURCES
The basic data studied in this paper is derived from the vehicle accident in-depth data collected by the National Automobile Accident In-depth Investigation System (NAIS). NAIS mainly collects the data about serious road traffic accidents in China. In such accident case, one or more fatality exists or accident participant injury value is
AIS≥3. Each accident case includes about 2,200 parameters, including people, vehicles, roads and environmental
information. NAIS was established by the State Administration for Market Regulation Defective Product Administrative Center together with universities and research institutions, as shown in Figure 1. The purpose of establishing NAIS is to collect in-depth data with the characteristics of road traffic accidents in China and establish a basic database for active and passive safety research of vehicles. The accident areas include plain areas, mountainous areas, plateau areas and coastal areas etc. In addition, the data about urban road accidents, highway accidents and rural road accidents are also collected. The accident data is representative. The NAIS database includes coded data, accident photos, police data, accident scene videos (if available), PC-Crash accident reconstruction files, CAD accident scene maps and accident analysis reports.
Cao & Xiao 4
Figure 1. Map of NAIS sites
This paper selected and analyzed 2,203 motor vehicle collision accident cases (by the end of 2017) from the NAIS accident database. There were 406 accidents involving motor vehicles and two/three-wheelers, accounting for 18% of all accidents, as shown in Figure 2. According to the number of accidents, it can be seen that the proportion of collisions between motor vehicles and two/three-wheelers is high in China and the proportion of such accident will continue to increase with the increasing number of Chinese two-wheelers, especially bicycles. At present, two-wheelers are widely used in China, they are popular in large and medium cities and rural areas. And there are many violations of traffic regulations by two-wheelers riders. Meanwhile, the routes and rules of two-wheelers in the traffic scene are more complicated. Therefore, it is more difficult for ADAS especially the AEB system to identify. And it is necessary to carry out in-depth research and analysis.
Figure 2. Classification of NAIS accident data (by accident pattern)
In the analysis of NAIS data about 2203 accidents, it is found that the number of fatality in the collision accident between motor vehicles and two or three wheelers is 362 people, where the most fatality occurred. Meanwhile, it is also found that its accident fatality rate is second only to the collision accident between motor vehicle and pedestrian, up to 33%, as shown in Figure 3. Therefore, both the riders of two or three wheelers and pedestrians are VRU, which should be given more attention to study during the development of ADAS and automated driving functions. Because the AEB system is mainly used to reduce vehicle frontal collision accidents and it is considered that three-wheelers are seldom used in other parts of the world, this paper selected 216 frontal collision accidents between passenger car and two-wheelers to explore and extract the static and dynamic information about pre-crash scenarios.
Cao & Xiao 5
Figure 3. Classification of NAIS accident data (by casualty)
EXTRACTION OF TYPICAL SCENARIOS BASED ON CLUSTERING ANALYSIS AND CHI-SQUARE TEST
Variables Selection and Definition The main purpose of this paper is to extract the typical scenarios from the in-depth accident data to conduct simulation analysis on the parameters of the AEB system. It is necessary to select the parameter variables that are highly compatible with the AEB system function and sensor environment and are easy to reproduce in the field operational test for clustering analysis. The parameter variables include environment variables, road variables, traffic participants variables and dynamic variables. The in-depth accident data involves more than 2,200 parameter variables. After analysis and screening, seven parameter variables are selected and defined as follows:
(1)Section: It refers to the type of road and it is divided into straight road and intersection;
(2)Light: It means whether the light is good when the accident occurs. It is divided into daytime, light at night and no light at night.
(3)Motion of passenger vehicle: It refers to the motion pattern of passenger vehicle. It is divided into “go straight, turn left and turn right”, as shown in Figure 4.
(4)Motion of two-wheelers: It refers to the motion pattern of two-wheelers. It is divided into “go straight, turn left and turn right”, as shown in Figure 4.
(5)Relative motion zones: It is determined by the angle α formed by the speed direction of passenger vehicle and
two-wheelers . If both passenger vehicle and two-wheelers have a turn, the speed direction before the turn is taken
as the direction, the direction is 0° and the counterclockwise direction is positive. Based on the different range of α value, it is divided into Zone 1, Zone 2, Zone 3 and Zone 4, as shown in Figure 5. The relative motion relationship between passenger vehicle and two-wheelers can be uniquely determined by the relative motion zones and the motion pattern of both passenger vehicle and two-wheelers.
(6)Type of two-wheelers: It includes bicycles, electric two-wheelers and motorcycles. Because electric two-wheelers and motorcycles are faster than bicycles, they are deemed as PTW in this paper. That is to say, two-wheelers are divided into bicycles and PTW.
(7)Speed of passenger vehicle: It refers to the vehicle speed during collision, which can be accessed through accident site trace calculation, accident reconstruction simulation analysis and accident calculation by video.
Cao & Xiao 6
Figure 4. Motion of passenger vehicle and two-wheelers Figure 5. Relative motion zones
The selected variables are shown in Table 1.
Table 1. Type and Value of Variables
Name Type Value Numeric
Representation
Section Nominal Intersection Straight road
1 2
Light Nominal Daytime
Light at night No light at night
1 2 3
Motion of passenger vehicle Nominal Go straight Turn left
Turn right
1 2 3
Motion of two-wheelers Nominal Go straight Turn left
Turn right
1 2 3
Relative motion zones Nominal
Zone 1 Zone 2 Zone 3 Zone 4
1 2 3 4
Type of two-wheelers Nominal Bicycle PTW
1 2
Speed of passenger vehicle (km/h) Scale 2 (Minimum speed)
102 (Maximum speed) 0 1
Clustering analysis and chi-square test The clustering analysis is used to collect the data with similar features. Then the chi-square test is used to extract the parameters with significant features, so as to obtain typical pre-crash scenarios. This method can reduce the influence on subjective scenario classification by human factors and is repeatable [17, 19].
The variables should be pre-processed before clustering. Variables are divided into interval scale variables (such as speed of passenger vehicle) and nominal scale variables (such as light, type of two-wheelers etc.). For interval scale variables, the distance between variables takes the absolute value of the difference between the values of the variable, which should be subject to normalization. For example, for the variable "speed of passenger vehicle" after normalization, the maximum value of the distance is 1 and the minimum value of the distance is 0. The calculation
formula is v = , where: v is the speed value after normalization, v is the speed value of the sample, v and v are the maximum and minimum values of the sample. For nominal scale variables, the distance is 0 when the values of the variable are same, while the distance is 1 when the values of the variable are different. However, when the nominal scale variable is greater than or equal to 3, such as the variable "motion of passenger vehicle" includes "go straight", "turn left" and "turn right", the distance between any two of the three variable values is 1. However, based on the values of the variables showed in Table 1, "go straight" and "turn left" are represented
Cao & Xiao 7
by "1" and "3" and the absolute value of the difference is 2, which is logically inconsistent with the distance 1 between the two variables. Therefore, in order to ensure that the distance between the two variables is 1, the variable value is represented by three values, as shown in Table 2. Similarly, when the variable value is represented by four values, it can also be processed by this method.
Table 2. Conversion of Variable Parameter Values
Motion of passenger vehicle
Before conversion
After conversion
Go straight 1 0 0.5 0.5 Turn left 2 0.5 0 0.5
Turn right 3 0.5 0.5 0 Take 216 accident cases as 216 samples, calculate the distance between different samples, merge the two nearest samples into a new group, then calculate the distance between the new group and other groups, continue to merge two groups in the nearest distance. In this way, cut a group each time, until the number of groups ultimately required is obtained. The distance between samples are calculated by using the City Block, while the distance between groups are calculated by using the Average Linkage Method. After clustering analysis, multiple samples with higher similarity are clustered into one group.
Obtain significant results by using chi-square test, identify the typical eigenvalues of each type of scenario and construct a typical scenario. The degree of confidence is 90% and the chi-square value χ2 obtained by comparison with the standard. If the chi-square value χ2 is greater than the standard value, it indicates that the variable value is significant and it can be used as a parameter of the typical scenario.
Analysis and extraction of typical scenario Firstly, the "inconsistent" formula in MATLAB is used to calculate the inconsistency coefficient. Found the inconsistency coefficient is greatly improved after 208 clusters and the first four groups account for 88.4% of the total samples. Therefore, all samples are clustered into nine groups [12].
Secondly, the nominal variables in nine groups of scenarios and their sample size, variable value ratio and calculated chi-square value are listed in Table 3.The first four groups with most sample size are taken as the research object. For the variables with significance, the typical values are selected by the proportional value of the variable values; for the variables without significance, the value of variable with the largest number of absolute values is selected as the typical value. Therefore, a typical scenario in the four classes of clustered samples is extracted. During the analysis, it is found that the variable “motion of two-wheelers” in the fourth group of sample is significant, but the scenario composed of the value “turn right” and the remaining variable values does not belong to the logical category of the motion pattern of the accident sample. So, the variable value selected based on the absolute number. In addition, the interval scale variable (speed of passenger vehicle) is represented by a box diagram, as shown in Figure 6.
Figure 6 . Box diagram of different groups in speed
Finally, the variable values with outstanding features in the four groups of scenarios are extracted and integrated. The speed of passenger vehicle uses the 25th to 75th percentile of each group as the upper and lower bounds. PTW is extracted from the variable “type of two-wheelers” as a typical value, indicating the typicality of PTW among two-wheelers under Chinese road traffic conditions - PTW speed is generally higher than the bicycle. The typical pre-crash scenarios for four types of collision between two-wheelers and passenger vehicle are formed, as shown in Table 4. Typical scenarios 1 and 2 are similar with the test scenarios of E-NCAP, but they do not involve relatively complex conditions such as turning; typical scenarios 3 and 4 involve turning, which accounts a high proportion in real accidents, so these scenarios are the focus of the analysis. The extraction of typical risk scenarios can provide a reference for the design of simulation test scenarios and field test scenarios.
PARAMETER MATCHING AND OPTIMIZATION OF THE AEB SYSTEM BASED ON RECONSTRUCTED SCENARIOS
Reconstruction and simulation analysis of typical scenarios Based on the above four typical pre-crash scenarios, the simulation test scenarios for collision between two-wheelers and passenger vehicle are constructed through the given key parameters such as road environment, participants and sensors. The road selected is two-way four-lane road, where bicycle lanes are set on both sides and street lamps are installed to adjust the lighting conditions. The velocity of passenger vehicle is set with reference to the upper and lower limits of the velocity in each type of scenario, rounding to the times of 10. The velocity gradient is 10km/h. The PTW velocity is set to 10km/h, 20km/h and 30km/h. When AEB is not triggered, the collision point is the front center point of passenger vehicle and the front/rear wheel center points of PTW. PreScan and MATLAB/Simulink software are used for simulation analysis. The selected sensor in the simulation is medium and short range millimeter-wave radar and the AEB control strategy used is full brake. The trigger distance w refers to the maximum lateral distance between two-wheelers and the side of the passenger vehicle when the two-wheelers is recognized as a dangerous obstacle and the AEB system is triggered. TTC refers to the maximum predicted time to collision, for an unbraked passenger vehicle, when the brake decision is triggered. Referring to the research [20,21], the main parameters used in the construction of simulation test scenarios are shown in Table 5.
Cao & Xiao 10
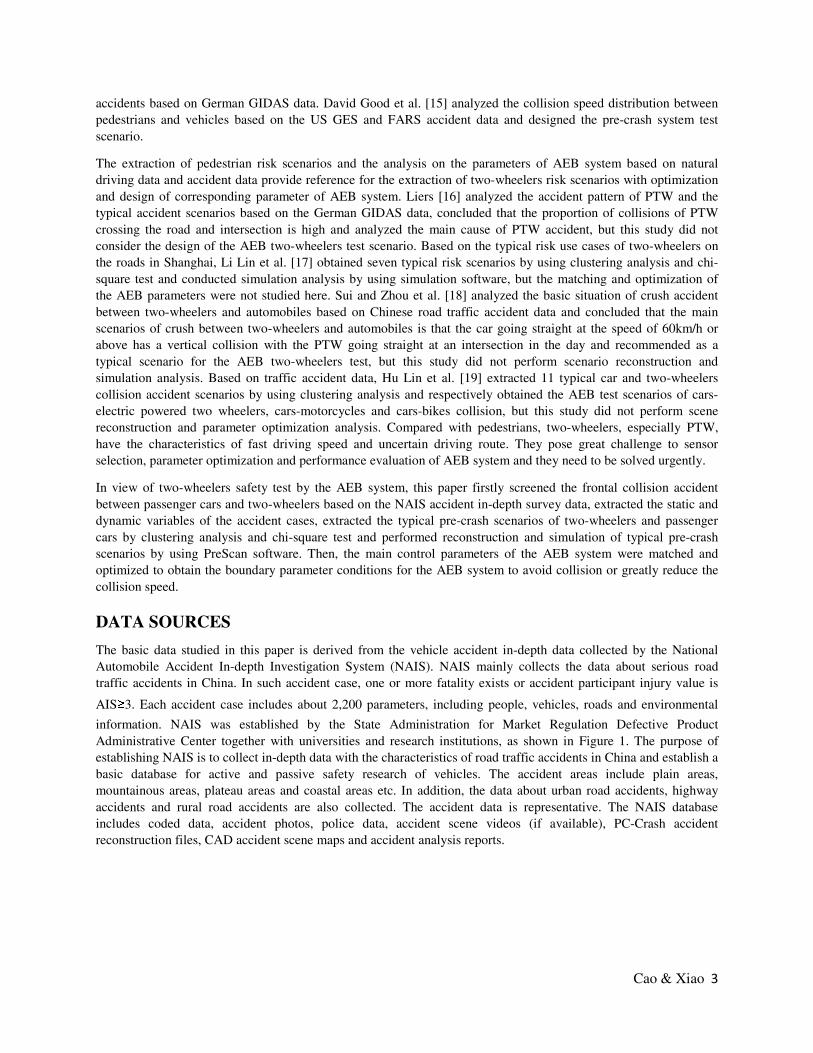
Table 5. Main parameters used in the construction of the simulation test scenarios
Category Parameter Value
Environment Number of driveways (pcs) 4
Width of driveway (m) 3.5 Width of bicycle lane (m) 2
Participant
Velocity of passenger vehicle (km/h)
40/50/60 (Scenario 1 & Scenario 2)
50/60 (Scenario 3) 20/30/40 (Scenario 4)
PTW velocity (km/h) 10/20/30 Maximum braking deceleration
(g) 0.9
Sensor
FoV (°) 60 Trigger width w (m) 0.75 Detection range (m) 40 TTC (s) 0.9
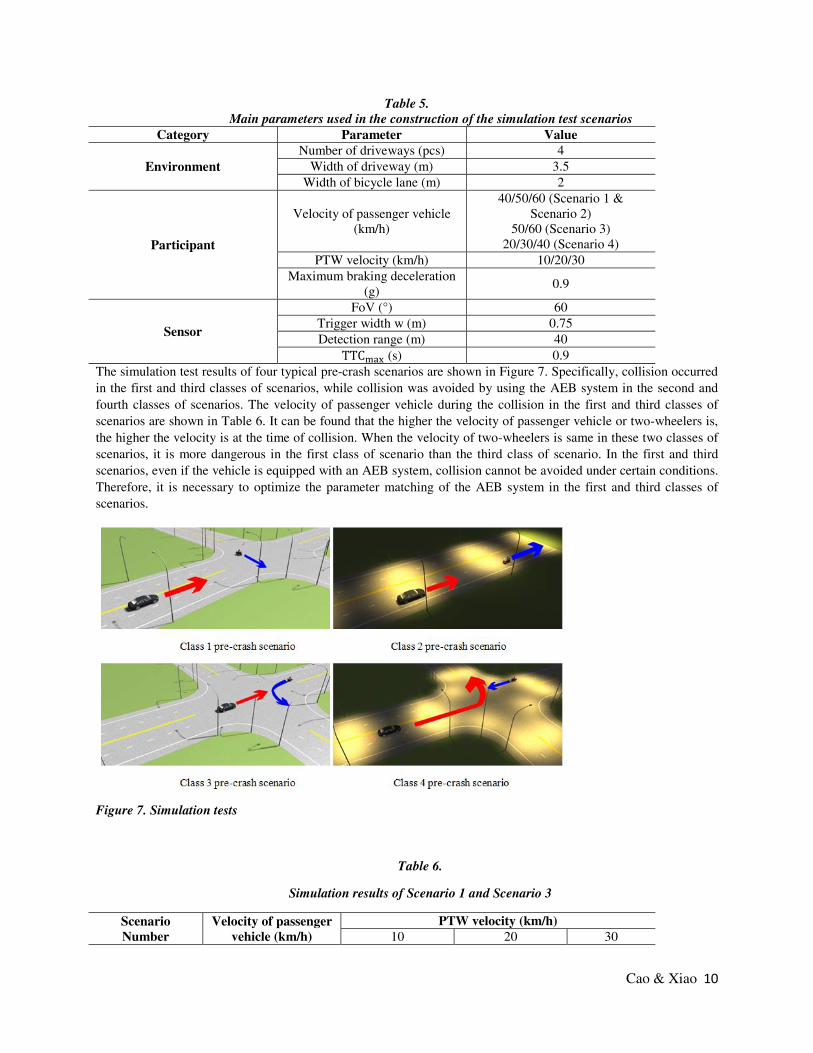
The simulation test results of four typical pre-crash scenarios are shown in Figure 7. Specifically, collision occurred in the first and third classes of scenarios, while collision was avoided by using the AEB system in the second and fourth classes of scenarios. The velocity of passenger vehicle during the collision in the first and third classes of scenarios are shown in Table 6. It can be found that the higher the velocity of passenger vehicle or two-wheelers is, the higher the velocity is at the time of collision. When the velocity of two-wheelers is same in these two classes of scenarios, it is more dangerous in the first class of scenario than the third class of scenario. In the first and third scenarios, even if the vehicle is equipped with an AEB system, collision cannot be avoided under certain conditions. Therefore, it is necessary to optimize the parameter matching of the AEB system in the first and third classes of scenarios.
Figure 7. Simulation tests
Table 6.
Simulation results of Scenario 1 and Scenario 3
Scenario Number
Velocity of passenger vehicle (km/h)
PTW velocity (km/h) 10 20 30
Cao & Xiao 11
Velocity of passenger vehicle during collision (km/h)
1 40 18 30 40 50 31 40 50 60 44 49 54
3 50 10 38 44 60 25 47 54
Parameter matching and optimization of the AEB system Take the front sensor of the passenger vehicle as the origin, build a coordinate system, mark the target position points of the object sensed by the sensor at different times before collision on the coordinate system, connect all position points in a line and obtain the approximate motion trail of the two-wheelers on the coordinate system. As time goes on, the two-wheelers continues to approach the passenger vehicle along the motion trail. When there is no AEB function and the velocity of the passenger vehicle is set as 50km/h, the motion trail of the two-wheelers at
three different speeds in the motion coordinate system is shown in Figure 8. a = where: v and v respectively
represent the velocity of passenger vehicle and the two-wheelers.
Figure 8. Motion trail of two-wheelers on the motion coordinate system
Figure 9 . AEB-based collision avoidance mode on the motion coordinate system
It is found from the above figure that the motion trail of the two-wheelers on the coordinate system is almost straight. If the two-wheelers is regarded as a mass point, its motion can be regarded as being continuously approached to the passenger vehicle along a straight line y = ax, as shown in Figure 9. Two conditions are required
for the two-wheelers to trigger the AEB system: one is the lateral distance d ≤ (w + ), where L is the width of the
vehicle (its value is 2m in the simulation model); another one is TTC≤TTC . To trigger AEB, the longitudinal distance between vehicle and two-wheelers must below the maximum longitudinal distances. And s = v × TTC .
Therefore, when the motion trail of the two-wheelers is in the Zone ②, the AEB system is triggered to take full-
force braking. The AEB system trigger area can be extended to Zone ① by increasing the FoV.
As shown in Figure 9, the critical point of the two-wheelers triggering the AEB system is the boundary point
between the straight line y = ax and Zone ②. Assumed that the intersection of the straight line y = ax and the
straight line x = w + is A, the longitudinal distance between Point A and the passenger vehicle is y = a × ( +w). If s > y , i.e. TTC > ( + ), the triggering boundary is on a straight line x = (w + ). It means that TTC is large enough now and there is no influence on improving collision avoidance of the AEB system by increasing TTC . In this case, it is required to continue to adjust w value to improve collision avoidance.
Cao & Xiao 12
Similarly, in case of w > , the increase in w value has no effect on improving collision avoidance. As
shown in Figure 6, when the velocity of passenger vehicle is 50km/h, it is closest to the 50th percentile of the velocity in the first scenario. Therefore, 50km/h is used as the object for analysis in the subsequent simulation analysis.
(1) Optimization of FoV
Assumed that the FoV value is a, if a < cot , it indicates that the target two-wheelers is beyond the sensor detection
range. The AEB system is useful only under the premise that the target object is within the detectable range. When
FoV is 60°, cot =1.73, if a is less than 1.73, the sensor will fail to detect and the simulation showed that the
collision velocity was equal to the initial velocity. In most cases, v is greater than v , thus the FoV of the sensor increases to 90° from 60°. The optimized results are shown in Figure 10. Increase in FoV value may improve collision avoidance when the PTW velocity is high, while it has no significant effect when the PTW velocity is low.
Figure10. Result of FoV parameter matching and optimization
(2) Optimization of TTC The sensor FoV is fixed at 90°. TTC is optimized on this basis. The simulation results under different values are shown in Figure 11. With the increase in TTC , in the same v , the collision velocity is gradually reduced until it is stable. Combined with the above analysis, when w is 0.75m and v is 10km/h, 20km/h and 30km/h, the critical value TTC respectively is 0.45s, 0.225s and 0.15s. TTC corresponding to the inflection point of the collision velocity obtained by simulation is close to the critical value of TTC calculated theoretically, which proves that the theoretical reasoning is reasonable. Therefore, during the parameter optimization process, it is not better when TTC is larger. When other parameters are unchanged, if TTC exceeds its threshold value, there is no improvement in collision avoidance.
Figure 11. TTC optimization result
Cao & Xiao 13
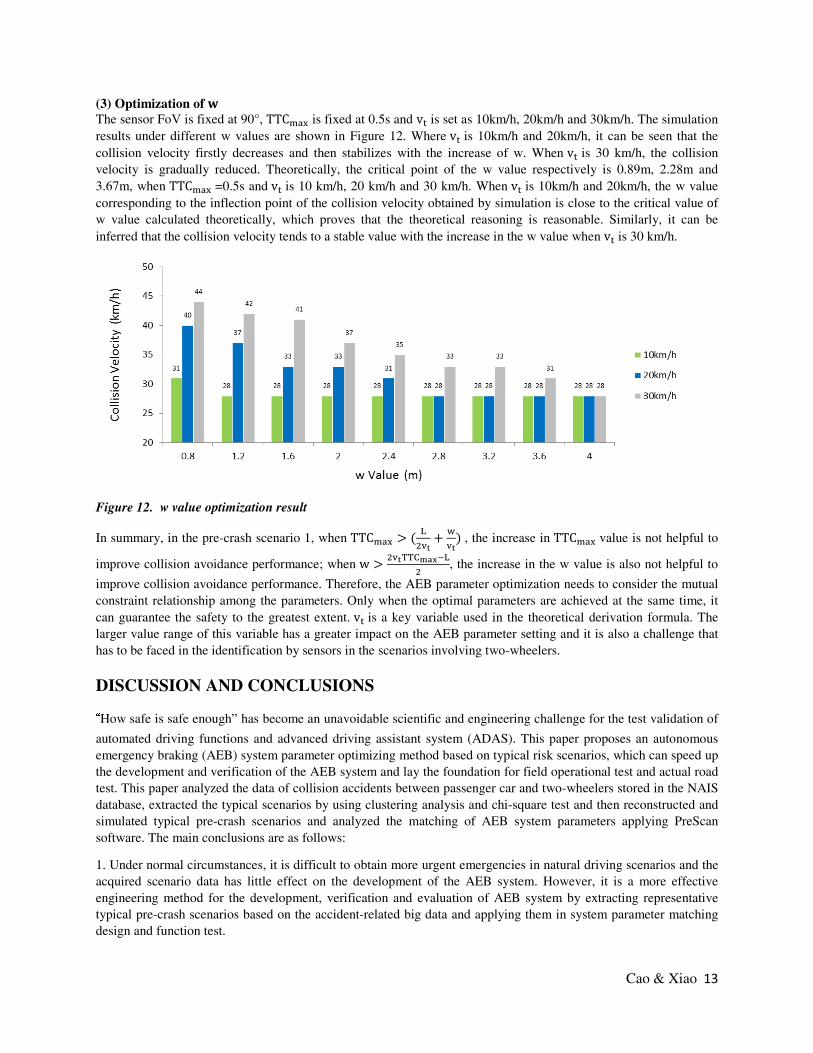
(3) Optimization of The sensor FoV is fixed at 90°, TTC is fixed at 0.5s and v is set as 10km/h, 20km/h and 30km/h. The simulation results under different w values are shown in Figure 12. Where v is 10km/h and 20km/h, it can be seen that the collision velocity firstly decreases and then stabilizes with the increase of w. When v is 30 km/h, the collision velocity is gradually reduced. Theoretically, the critical point of the w value respectively is 0.89m, 2.28m and 3.67m, when TTC =0.5s and v is 10 km/h, 20 km/h and 30 km/h. When v is 10km/h and 20km/h, the w value corresponding to the inflection point of the collision velocity obtained by simulation is close to the critical value of w value calculated theoretically, which proves that the theoretical reasoning is reasonable. Similarly, it can be inferred that the collision velocity tends to a stable value with the increase in the w value when v is 30 km/h.
Figure 12. w value optimization result
In summary, in the pre-crash scenario 1, when TTC > ( + ) , the increase in TTC value is not helpful to
improve collision avoidance performance; when w > , the increase in the w value is also not helpful to
improve collision avoidance performance. Therefore, the AEB parameter optimization needs to consider the mutual constraint relationship among the parameters. Only when the optimal parameters are achieved at the same time, it can guarantee the safety to the greatest extent. v is a key variable used in the theoretical derivation formula. The larger value range of this variable has a greater impact on the AEB parameter setting and it is also a challenge that has to be faced in the identification by sensors in the scenarios involving two-wheelers.
DISCUSSION AND CONCLUSIONS
“How safe is safe enough” has become an unavoidable scientific and engineering challenge for the test validation of
automated driving functions and advanced driving assistant system (ADAS). This paper proposes an autonomous emergency braking (AEB) system parameter optimizing method based on typical risk scenarios, which can speed up the development and verification of the AEB system and lay the foundation for field operational test and actual road test. This paper analyzed the data of collision accidents between passenger car and two-wheelers stored in the NAIS database, extracted the typical scenarios by using clustering analysis and chi-square test and then reconstructed and simulated typical pre-crash scenarios and analyzed the matching of AEB system parameters applying PreScan software. The main conclusions are as follows:
1. Under normal circumstances, it is difficult to obtain more urgent emergencies in natural driving scenarios and the acquired scenario data has little effect on the development of the AEB system. However, it is a more effective engineering method for the development, verification and evaluation of AEB system by extracting representative typical pre-crash scenarios based on the accident-related big data and applying them in system parameter matching design and function test.
Cao & Xiao 14
2. This paper extracted four typical pre-crash scenarios between passenger car and two-wheelers, which cover 88.4% of the sample and are representative. Especially, the first and second scenarios in the four typical scenarios are similar to the AEB test scenarios of cyclist crossing and cyclist along the roadside introduced by Euro-NCAP 2018, but the first and second scenarios in this paper are more complicated. In addition, the third and fourth scenarios extracted in this paper occur at the intersection, indicating that the AEB system needs to focus on the identification and collision avoidance of the two-wheelers at the intersection in the process of development, test and evaluation.
3. Since the speed of two-wheelers is higher than that of pedestrian and the route is more complicated, the AEB system is facing great challenges to detecting two-wheelers riders in both hardware and software. The simulation analysis reveals the larger the sensor FoV is, the larger the identification field of two-wheelers is and the better the performance of the AEB system in avoiding collision or mitigating collision speed. This shows that the AEB system should select a sensor with a larger detection angle to effectively identify the fast-moving two-wheelers and make correct decision.
4. During the simulation, it is found that the collision avoidance problem cannot be completely solved by merely increasing the angle of FoV. It is necessary to comprehensively adjust the braking trigger width, brake trigger time to avoid vehicle collision. In the simulation analysis of the first scenarios, the AEB can avoid the occurrence of collision accidents or greatly mitigate the speed of the collision by comprehensively adjusting the above key parameters.
The research of this paper still has certain limitations. At present, the number of collision accidents used for scenario clustering analysis is limited and the pre-crash scenarios that may be extracted cannot completely represent the typical collision scenarios between passenger car and two-wheelers in China. But, the method studied in this paper is a good reference for the development of the AEB system. And AEB system can be improved with more accident data of NAIS in the future. In addition, the simulation specified in this paper does not consider the specific shape parameters and the variability in the movement of two-wheelers. In the subsequent research, it is considered to establish a unified bicycle and PTW model for the simulation, test and evaluation of the AEB system.
ACKNOWLEDGMENT
This work was financially support by National Fund for Fundamental Research: Research on Key Technologies for Construction of Automatic Driving Critical Scenarios Based on NAIS Accident In-depth Investigation Data.
REFERENCES
[1] Ding Zhao, et al. 2017. “Accelerated evaluation of automated vehicles safety in lane-change scenarios based on importance sampling techniques.” IEEE Trans. Intell. Transp. Syst., vol. 18, no. 3, pp. 595–607, Mar. 2017.
[2] World Health Organization. 2016 “Global status report on road safety”.
[3] The Ministry of Public Security of the People's Republic of China. 2004. “The People's Republic of China Road Traffic Accident Annual Statistic Report (2004)”.
[4] The Ministry of Public Security of the People's Republic of China. 2010. “The People's Republic of China Road Traffic Accident Annual Statistic Report (2010)”.
[6] Vollrath M, Briest S, Schieβl C, et al. 2006 “Ableitung von Anforderungen an fahrerassistenzsysteme aus Sicht der Verkehrssicherheit.” Bergisch Gladbach:BAST.
[9] Ying Liu, Jinpeng He, Weiguo Liu, et al. 2014. “Research on Test Scenarios for AEB Pedestrian System.” Automobile Technology, 2014(03):35-39.
[10] Jiangping Su, Junyi Chen, Hongyan Wang, et al. 2017. “Establishment and Analysis on Typical Road Traffic Near-Crash Scenarios Related to Pedestrian in China.” Traffic & Transportation, 2017(01):209-214.
[11] Chen Qiang, Lin Miao, Bai Bing, et al.2015. “Typical pedestrian accident scenarios in China and crash severity mitigation by autonomous emergency braking systems.” SAE Technical Papers, 2015-01-1464.
[12] Lenard J., Badea-Romero A., Danton R.. 2014. “Typical pedestrian accident scenarios for the development of autonomous emergency braking test protocols.” Accid Anal Prev, 2014, 73(73):73-80.
[13] Huang S., Yang J. 2006. “Analysis of Car-Pedestrian Impact Scenarios for the Evaluation of a Pedestrian Sensor System Based on Accident Data from Sweden.” Expert Symposium on Accident Research, 2006: 136-143.
[14] Erik Rosén, Källhammer J E , Eriksson D , et al. 2010. “Pedestrian injury mitigation by autonomous braking.” Accident Analysis & Prevention, 2010, 42(6):1949-1957.
[15] David Good and Rachel Abrahams. 2014. “Vehicle Speeds for Pedestrian Pre-Crash System Test Scenarios Based on US Data.” IEEE International Conference on Intelligent Transportation Systems. 2014: 1632-1637.
[16] Liers, H.. 2013. “Analysis of the accident scenario of powered two-wheelers on the basis of real-world accidents.” Proceedings of Expert Symposium on Accident Research, 2013.
[17] Li Lin, Zhu Xichan, et al. 2014 “Typical Traffic Risk Scenarios Related to Pedal Cyclists.” Journal of Tongji University (Natural Science), 2014,42(07):1082-1087.
[18] Bo Sui, Shengqi Zhou, Xiaohua Zhao, Nils Lubbe. 2017. “An Overview of Car-To-Two-Wheeler Accidents in China: Guidance for AEB Assessment.” International Technical Conference on the Enhanced Safety of Vehicles. Paper No.:17-0204.
[19] Hu Lin, Yi Ping, et al. 2018. “A Research on Test Scenes of Two-wheeled Vehicles for Automatic Emergency Braking System Based on Real Accident Cases” Automotive Engineering, 2018, 40(12):1435-1446.
[20] Erik Rosén. 2013. “Autonomous Emergency Braking for Vulnerable Road Users.” IRCOBI Conference. 2013: 618-627.
[21] Liu Jianping, Zheng Wangxiao, et al. 2018. “Research on Relevance of AEB System Performance and TTC.” Automobile Technology. 2018, 515(08):54-56.