14
Tyranny of the Old Colin Masterson
| Date post: | 06-Aug-2015 |
| Category: |
Documents |
| Upload: | colinmasterson |
| View: | 128 times |
| Download: | 2 times |

Tyranny of the Old
Colin Masterson

• Unprecedented Demographic Changes
• Power of the few over the many
• Generational strife
• The promises
• How we got here
• What may happen?

Demographics 101
• Basic population growth – Birth Rate – Death Rate = Population Growth
• Fertility– Replacement Rate ~ 2.1
• Age of women at first child
• Life expectancy

Life Expectancy

Fertility


United States
Year 2000 2010 2030Under 18 Number 72,293,812 74,431,511 85,707,297
Under 18 Percent of total population 25.7 24.1 23.6
65 and older Number 34,991,753 40,243,713 71,453,471 65 and older Percent of
total population 12.4 13.0 19.718-65 61.88 62.88 56.77
Total Population 281,421,906 308,935,581 363,584,435

Voter Participation
Reported Voted in 2008 Election
10%
32%
38%
11%
9%
..18 to 24 years
..25 to 44 years
..45 to 64 years
..65 to 74 years
..75 years and over
Citizens age 65 and older had the highest registration rate (79 percent) while those age 18 to 24 had the lowest (58 percent). The youngest group also had the lowest voting rate (47 percent), while those age 45 and older had the highest turnout (about 70 percent).

Where the Electorate Power Lies
• Historical Trends in Elections
• Maximum Participation occurs at Retirement age
• Young are disenfranchised by choice

Benefits
• Largest is OASDI (Social Security)
• Medicare
• Disability
• Supplemental Medical Insurance
• Prescription Drug Benefit
The Supreme Court has established that no one has any legal right to Social Security benefits. The Court decided, in Flemming v. Nestor (1960), that "entitlement to Social Security benefits is not a contractual right".

Social SecuritySocial Security Trust Fund
0
500000
1000000
1500000
2000000
2500000
Year
1938
1940
1950
1960
1966
1968
1970
1972
1974
1976
1978
1980
1982
1984
1986
1988
1990
1992
1994
1996
1998
2000
2002
2004
2006
Year
Mill
ion
s $$ Receipts
Expenditures
Assets

Where Social Security is nowHealth of the OASDI Trust Fund
0.00%
2.00%
4.00%
6.00%
8.00%
10.00%
12.00%
14.00%
16.00%
18.00%
Year
1938
1940
1950
1960
1966
1968
1970
1972
1974
1976
1978
1980
1982
1984
1986
1988
1990
1992
1994
1996
1998
2000
2002
2004
2006
Year
% o
f G
DP receipt % of GDP
Expenses % of GDP
Assest % of GDP

Where it is GoingFunding levels of the Federal Trust Funds
0%
50%
100%
150%
200%
250%
300%
350%
400%
450%
Calen
dar y
ear
1971
1973
1975
1977
1979
1981
1983
1985
1987
1989
1991
1993
1995
1997
1999
2001
2003
2005
2007
2009
2011
2013
2015
Year
Per
cen
tag
e F
un
ded
OASI
DI
HI
Conclusions
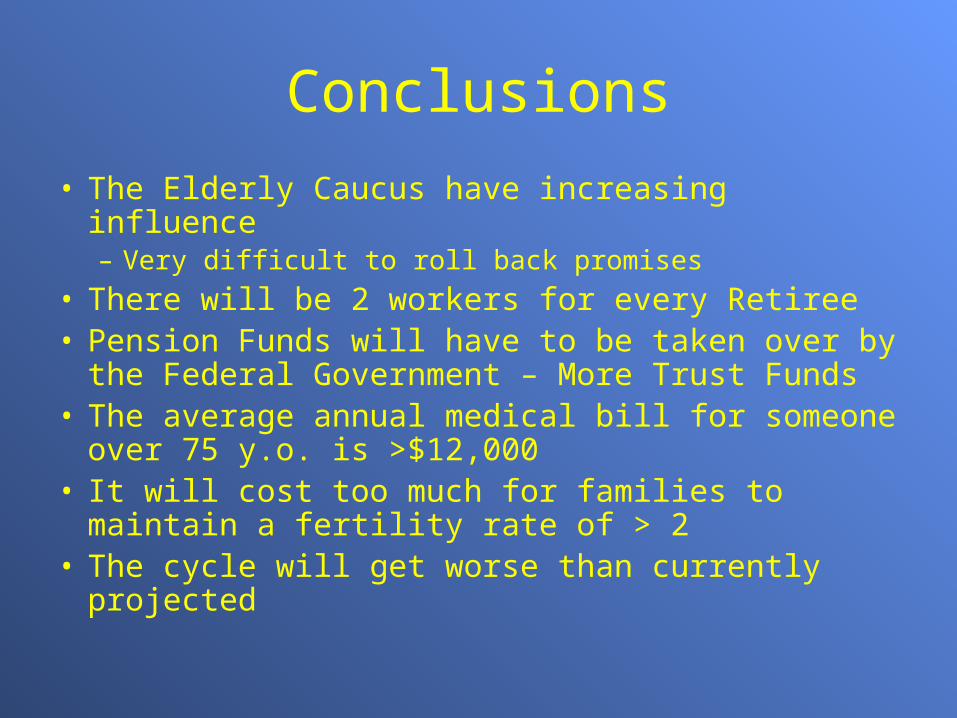
• The Elderly Caucus have increasing influence– Very difficult to roll back promises
• There will be 2 workers for every Retiree• Pension Funds will have to be taken over by the
Federal Government – More Trust Funds• The average annual medical bill for someone
over 75 y.o. is >$12,000• It will cost too much for families to maintain a
fertility rate of > 2• The cycle will get worse than currently projected


