Daniel José Rossa Gralheira Bachelor in Biochemistry Tyrosinase-Based Phenol Remediation Dissertation for the obtention of the Master Degree in Biotechnology Supervisor: Doctor João Marques Cortez, Auxiliary Researcher, REQUIMTE Co-supervisor: Doctor Marco Silva, Auxiliary Professor, FCT/ UNL Jury: President: Doctor Pedro Miguel Ribeiro Viana Batista, Aggregate Auxiliary Professor , FCT/ UNL Examiner(s): Doctor Maria Gabriela Machado, Auxiliary Researcher, FCT/ UNL Dezembro de 2012
Transcript
Daniel José Rossa Gralheira Bachelor in Biochemistry
Tyrosinase-Based Phenol Remediation
Dissertation for the obtention of the Master Degree in Biotechnology
Supervisor: Doctor João Marques Cortez, Auxiliary Researcher, REQUIMTE
Co-supervisor: Doctor Marco Silva, Auxiliary Professor, FCT/ UNL
Jury:
President: Doctor Pedro Miguel Ribeiro Viana Batista, Aggregate Auxiliary Professor , FCT/ UNL Examiner(s): Doctor Maria Gabriela Machado, Auxiliary Researcher, FCT/ UNL
The Faculdade de Ciências e Tecnologia and the Universidade Nova de Lisboa have the right, perpetual and without geographic limits, to file and publish this dissertation by mean of printed copies reproduced in paper or by a digital form, or by any other known or to be invented mean,
and to divulge through scientific repositories and to admit its coping and distribution with educational and research purposes, non commercial, as long credit is given to the author and
the editor. A Faculdade de Ciências e Tecnologia e a Universidade Nova de Lisboa têm o direito, perpétuo
e sem limites geográficos, de arquivar e publicar esta dissertação através de exemplares impressos reproduzidos em papel ou de forma digital, ou por qualquer outro meio conhecido ou que venha a ser inventado, e de a divulgar através de repositórios científicos e de admitir a sua
cópia e distribuição com objectivos educacionais ou de investigação, não comerciais, desde que seja dado crédito ao autor e editor.
v
Acknowledgements This dissertation is the product of innumerous contributions that cannot be resumed to
the author name on the cover.
I would like to start by emphasizing my deepest appreciation for the indisputable
scientific correctness (that will surely guide me beyond this project), vision for this dissertation
and the vast support of my supervisor, Dr. João Cortez.
The kind acceptance of Dr. Marco Silva to be my supervisor enhanced the significance
of the undertaken task and brought an inestimable know-how on analytical methods. To this
respect it is not possible to forget the guidance of Dr. Eduardo Mateus on the initial approach to
gas chromatography and the kind treatment by the members of the analytical group.
The companionship of all my laboratory colleagues was of most importance to get
through the most difficult days and, in special, the practical advices from Master João Luz were
a valuable asset.
I also need to acknowledge Dr. José Gomes and Dr. Fábio Chalub, from Mathematics
Department, for their eagerness to help solving the protein/nanoparticle ratio problem.
I am thankful for all my family, particularly to Hélder, my father; Cremilde, my mother
and Ricardo, my brother. They gave me the necessary support to study in this fantastic
university and, not helping in the work, they were crucial by not causing me much trouble.
T. Pernes, V. Correia, I. Camacho; you were laugh and suffering friends all the way and
one could not wish for more.
Finally, I dedicated this dissertation to those who had lack of confidence in me making
me push my limits forward, and, specially, to those who inspired me by enjoying all the creative
process in this dissertation.
vii
Abstract
Nanobiotechnology is an emerging area full of potentialities to explore and reshape
instituted knowledge. In this work, the main goal was to design and test biological remediation
systems (a total of three) taking advantage of nanotechnology features, as a step towards future
progress of sense-and-shoot combined systems. This task involved the development of active
bionanoconjugates (BNC) with two different tyrosinases (Agaricus bisporus - AbT, and
Tricoderma reesei - TrT) to be implemented in three suggested phenol remediation systems.
A nanotecnologia é uma área emergente cheia de potencialidades a explorar e capaz
de redefinir o conhecimento instituído. Neste trabalho, o principal objetivo consistiu em
desenhar e testar sistemas biológicos de remediação (um total de três) tirando proveito das
capacidades nanotecnológicas, sendo um passo em direção ao futuro progresso de sistemas
de deteção-e-eliminação. Esta tarefa envolveu o desenvolvimento de bionanoconjugados
(BNC) activos com duas tirosinases diferentes (Agaricus bisporus- AbT, e Tricoderma reesei-
TrT) a serem implementados nos três sistemas de remediação de fenóis sugeridos.
O coloide AuNP-MUA (nanopartículas de ouro revestidas com ácido 11-mercapto-1-
undecanóico) 1:5000 foi demonstrado ser estável até 100 mM de força iónica (cloreto de sódio)
e apto a formar BNCs activos com AbT. O rácio TrT:AuNP para formação de BNC é
recomendado como 100, de acordo com dados experimentais de potencial zeta e mobilidade
em gel de agarose, os quais, por sua vez, corroboram a estimativa teórica proposta.
Métodos analíticos para avaliar a eficiência dos sistemas foram também investigados:
espectrofotometria ultravioleta-visível (UV-Vis) utilizando-se o método da adição padrão; e
microextracção de fase-sólida - cromatografia gasosa (SPME-GC). A incubação de 100 ppm de
fenol com BNC-MUA-AbT durante 60 minutos alcançou 50% de conversão de substrato.
Palavras-chave: bionanoconjugados, nanopartícula de ouro, remediação, tirosinase, fenol
xi
Table of Contents Abstract ........................................................................................................................................ vii
Resumo .......................................................................................................................................... ix
Table of Contents .......................................................................................................................... xi
Table of Figures ........................................................................................................................... xiii
Table of Tables ........................................................................................................................... xvii
Symbols and notations ................................................................................................................ xix
1- Introduction, ambit and objectives ........................................................................................... 1
In the early 1980s two key developments; the birth of cluster science and the invention of the
scanning tunneling microscope (STM) enabled nanoscience the first major steps. Soon, in
1986, fullerenes were discovered, in 1991 the carbon nanotubes, in 1992 the atomic force
microscope was invented and in 1993 the synthesis of semiconductor nanocrystals (Quantum
Dots) was started. In the present, the market outcome of nanotechnology is expressed in
improved products benefiting from a new material or in manufacturing processes. Moreover, the
top down approach to create smaller components has gained more tools with this science and
in the other hand, the bottom up approach is getting firm soil in self-assembly processes owing
to nanotecnhological phenomena comprehension.2
The possibility of rebuilding existing products (not mentioning the new ones) either with
better performances, smaller parts and lower cost is very attractive to companies and
“evolutionary nanotechonology” is predicted to run across many industries reshaping them (Fig
5)2. In spite of being a young field, the expectations are great and public awareness is rising due
to marketing and popular culture references.2
Figure 5- Nanotechnology spawn is expected to drive the next industrial growth cycle.
1.1.1- Nanobiotechnology and Bionanotechnology
Classifying a work in a field of science is not critical to its integrity and do not mine its
achievements but it is an important way to analyze them in the state-of-art perspective and
therefore assess its impact.
Both “nanobiotechnology” and “bionanotechnology” are very recent terms crossing the
same areas of expertise and many times undifferentiated. If differences can be pinpointed, the
areas to which they refer to are themselves no more than fifteen years old and still in deep
reshaping. On behalf of some common ground while communicating, nanobiotechnology is
considered as the application of nanotechnology techniques for the development of
biotechnological processes and products or, in other terms, to obtain functional nanostructures
4
(inorganic composites or not) from biological systems (e.g. nucleic acids, proteins and cell) and
to study and develop biological processes using techniques originally designed to manipulate
nanostructured materials.(Fig. 6)9
Figure 6- Nanobiotechnology example: magnetic resonance contrast effects of magnetic nanoparticles. Under an external field (B0), magnetic NPs are magnetized with a magnetic moment of µ and generate an induced magnetic field which perturbs the nuclear spin relaxation processes of the water protons. This perturbation leads to magnetic resonance contrast enhancement.
This goes from the use of matrixes with nanoscale order for the controlled release of
bioactive molecules or tissue engineering, to the use of nanoscale fabrication and manipulation
techniques to create more sensitive and far reaching diagnosis methods which by turn can
enable concepts as the “lab-on-chip” and real time nanosensors.10
Bionanotechnology aims to impart new properties to materials from unique
characteristics present in biomolecules. This includes the use of DNA oligomers, peptide
nanotubes (Fig. 7)11, or protein fibrils for the fabrication of nanowires, interconnects and other
physical elements that can be used in molecular electronics or instead metal parts for their
mechanical proprieties.10
According to these terminologies, this dissertation can be framed as nanobiotechnology
because tyrosinase enzymes (biological systems) are being conjugated with gold nanoparticles
creating functional nanostructures in which the biocatalyst´s activity and specificity are being
exploited.
5
Figure 7- Proposed model for the formation of aligned peptide nanotube arrays. Images of the vertically aligned peptide nanotubes: (a) Scanning electron micrograph; (b) Cold field-emission gun high-resolution scanning electron micrograph; (c) High-magnification micrograph of (b).
1.1.2- Bottom-up and bottom-down approaches
It has been demonstrated that multi-dimensional superlattices of nanoparticles (NPs)
exhibit different proprieties from their individual elements.12 For example, it was reported that Ag
NPs organized in a two-dimensional hexagonal network, have their plasmon peak shifted
towards higher wavelengths and an increase in the bandwidth is observed because the
dielectric constant of the surrounding NPs is increased.12a Bearing this framework in mind and
the intention to any successful application, it becomes essential to find ways to secure the
gathering of nanoparticles with controlled morphology in highly ordered nanostructures.
The “top-down” approaches (such as lithography and patterning) consist in eroding
materials to obtain smaller ones at the cost of large material waste. The bottleneck of the “top-
down” approaches is the miniaturization because operating equipment are forthcoming their
scale limits and overcoming them is becoming harder and extremely expensive. To some
extent, “top-down” enables nano-featuring but it is “bottom-up” that appears as the leading
edge. “Bottom-up” comprises structures building from molecular components, with high yield
usage of the starting materials and exploiting their natural features as possible to reduce
equipment usage. “Bottom-up” approaches include scanning probe-based microscopes (e.g.
Atomic Force Microscopy- AFM) and chemical synthesis (e.g. colloidal chemistry,
supramolecular chemistry) but the focus of this dissertation goes to those based on self-
assembly. Self-assembly can be achieved by simple methods such as evaporation-based
assembly and chemical conjugation or by more advanced methods of patterned self-assembly
6
using lithography and microcontact printing where only the patterned areas with chemical
functionalities create organized NP networks on substrates.12a
The term “self-assembly” has been overused as if any natural process or form of
organization fits it, ranging from the non-covalent association of organic molecules in solution to
the growth of semiconductor quantum-dots on solid substrate. In this dissertation the term self-
assembly is considered as the autonomous organization of components into patterns or
structures without human intervention being limited to processes that involve pre-existing
components, being reversible, and able to control by proper design of the components.(Fig. 8)13
Figure 8- Self-assembly examples. A- peptide-amphiphile nanofibers. B- Micrometer-sized metallic polyhedral folded from planar substrates. C- Aggregate of three millimeter size, rotating, magnetized disks interacting with one another.
Self-assembly at molecular level involves weak interactions (van der Waals, electrostatic,
hydrophobic interactions and hydrogen bonds)14(Fig. 9)12a, but for meso- or macroscopic
elements, interactions can include gravitational attraction, external electromagnetic fields,
capillary and entropic interactions which are not relevant in the case of molecules. Non-covalent
binding enables favorable free-energy changes as components equilibrate between aggregated
and non-aggregated states or adjust their positions relative to one another once in an aggregate
so the chosen substituents of the building components are a matter of concern.12a, 13
Figure 9- Example methods for NPs assembly on surfaces and interfaces: A- Cadmium sulfide NPs arranged as well defined rings in chemical lithography. B- DNA-templated 1D AuNPs. C- Shape- controlled assembly of truncated octahedral magnetite NPs. D- A colloidosome: NP assembly on the interface of an emulsion droplet. E- Cross-linked cadmium selenide NP membranes at fluid/ fluid interfaces (confocal microscope image).
7
The environment is crucial to the self-assembly since it can modify the interaction
between the components and they need fluid phases or smooth surfaces to be mobile.
Moreover, templates can reduce defects13 and facilitate the creation of a core or scaffold that
can start oriented chain reactions of the components.14
Putting self-assembly apart, scanning probe microscopy (SPM) methods are also very
effective for particle organization at nanoscale and, therefore, suitable for “bottom-up”
manufacture but they are: not suitable for large-scale assembly, very time consuming and
involve a costly equipment investment. In the present, research is focussed on generating
simple nanostructures and exploring surface chemistry possibilities. Self-assembled monolayers
(SAMs) (Fig. 10)12a are fairly studied (on gold and silicon oxide surfaces) but the goal is to reach
flexible and easy approaches able to create asymmetric and complex architectures from one or
more types of nanostructures.
Figure 10- Self-assembled monolayer of thiols on a silica substrate, suitable for AuNP assembly.
1.2- Metallic nanoparticles
1.2.1- General mechanism for metallic nanoparticles formation
Finding new technologies recurring to NPs is highly dependent on the availability of
synthetic methods capable of generating nearly monodisperse NPs in order to distinguish truly
novel proprieties inherent to nanoscale structures from those associated with heterogeneities
and polydispersity. Strictly, monodisperse particles are those indistinguishable from one another
but in a more practical sense it can be used to refer do samples with standard deviations σ ≤5%
in diameter.3
In spite of the application demands, key parameters usually also include adequate
morphology, surface functionalization, size dispersion and high solubility in water.
La Mer and Dinegar (1950) showed that the production of monodisperse colloids
requires a discrete nucleation event followed by a slower controlled growth on the formed nuclei
8
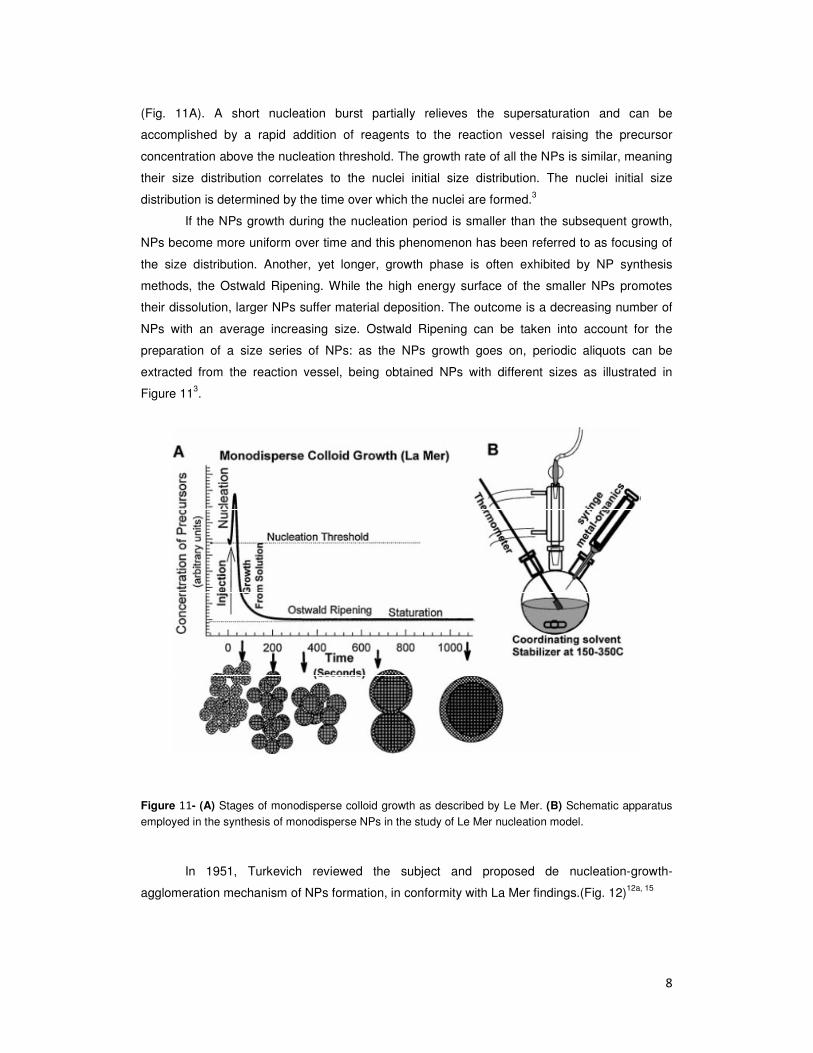
(Fig. 11A). A short nucleation burst partially relieves the supersaturation and can be
accomplished by a rapid addition of reagents to the reaction vessel raising the precursor
concentration above the nucleation threshold. The growth rate of all the NPs is similar, meaning
their size distribution correlates to the nuclei initial size distribution. The nuclei initial size
distribution is determined by the time over which the nuclei are formed.3
If the NPs growth during the nucleation period is smaller than the subsequent growth,
NPs become more uniform over time and this phenomenon has been referred to as focusing of
the size distribution. Another, yet longer, growth phase is often exhibited by NP synthesis
methods, the Ostwald Ripening. While the high energy surface of the smaller NPs promotes
their dissolution, larger NPs suffer material deposition. The outcome is a decreasing number of
NPs with an average increasing size. Ostwald Ripening can be taken into account for the
preparation of a size series of NPs: as the NPs growth goes on, periodic aliquots can be
extracted from the reaction vessel, being obtained NPs with different sizes as illustrated in
Figure 113.
Figure 11- (A) Stages of monodisperse colloid growth as described by Le Mer. (B) Schematic apparatus employed in the synthesis of monodisperse NPs in the study of Le Mer nucleation model.
In 1951, Turkevich reviewed the subject and proposed de nucleation-growth-
agglomeration mechanism of NPs formation, in conformity with La Mer findings.(Fig. 12)12a, 15
9
Figure 12- Turkevich´s nucleation-growth-agglomeration mechanism of metallic nanoparticles formation.
1.2.2- Metallic nanoparticles synthesis
Starting with M. Faraday´s (1857) chemical reduction of transition metal salts, the
number of synthetics methods for the preparation of size series of monodisperse metallic
colloids is surprisingly small in spite of having been studied for over a century3, 12a. Most of them
involve the aqueous reduction of metal salts (mainly Au or Ag) in the presence of citrate anions.
According to Kimling et al., a size dispersion of just σ < 13-16% in diameter can be achieved
when AuNP´s (gold nanoparticles) diameter is inferior to 40 nm16 but in general metallic
nanoparticles (MNPs) can be obtained with distributions of 10 < σ < 15% in diameter (even so
they are usually presented as monodisperse) and then narrowed to 5% through size-selective
processing.17 Other methods include the pioneering two-phase liquid-liquid reduction as
described by Brust et al.17 enabling the generation of stable AuNP self-assembled
monolayers18; the inverse micelle method19 and higher temperature reduction of metal salts in
the presence of stabilizing agents to generate monodisperse transition metal NPs (e.g. Co and
Ni).3, 20 Monodisperse bimetallic NPs synthetic methods have achieved some progress and for
that matter the work of Bradley and co-workers is a relevant example.3
AuNPs synthesis described methods are mostly based on a chemical or
electrochemical reduction of a gold precursor compound in the presence of a capping agent. In
the case of a chemical reduction, the reduction and the capping functions can be assured by the
same agent. A capping agent is a broad term used to describe a compound that covers a
nanoparticle´s surface.
Among the several described methods for the preparation of AuNPs, a frequent
reducing agent arises which is citrate.3 This is due to:
1- Citrate has a strong affinity for gold17 leading to lower size dispersion colloids.12a
2- Working pH enables citrate to be negatively charged (-3 at pH 7, pka3= 6,3921)
conferring an ionic double layer on a NP surface which ensures strong repulsive Coulombic
(electrostatic) forces to counteract the inherent Van der Waals attraction between each NP and
so contributing to the colloid solution stability.12a
10
3- Negatively charged, can work as a linker by providing binding through electrostatic
interactions.
4- Capping agents enabling solubility only in organic solvents, prevent interaction
between the NPs and most biological targets presents in aqueous media.19
In general terms, the preparation of spherical size defined AuNPs is accomplished by:
gold (III) salt reduction by citrate at 100 ºC; preparation in citrate at 25 ºC after UV irradiation,
and particles prepared in an ascorbate solution at 25 ºC.22
Besides the reduction agent used, other parameters that must be considerate to ensure
the size and mprphology outcome, including the reaction time and the medium temperature.
The first method, used to produce the nanoparticles utilized in this work, is known by the
name of the researcher who described it, Turkevich15, and has been modified and optimized
over time.22 This is a simple, well characterized, reproducible, size tunable and very common
method for the aqueous synthesis of spherical fairly monodisperse nanoparticles with high yield
(Fig. 13)16. Starting from a gold salt, usually HAuCl4 (chloroauric acid), its oxidation from Au3+
(auric) to Au0 (atomic gold) in aqueous solution is accomplished in the presence of sodium
citrate (detailed protocol described in the Materials and methods chapter).16, 22
The proposed chemical reaction is a multi-step process15:
1- citrate oxidation C6H6O7 C5H4O5 + CO2 + 2H+ + 2e
-
2- auric salt reduction AuCl3 + 2e- AuCl + 2Cl
-
3- gold species 3AuCl 2Auo + AuCl3
dismutation and atomic gold production
Which is represented by the global reaction:
2 HAuCl4 + 3C6H6O7 2Auo + 3C5H4O5 + 6Cl- + 8H
+ + 3CO2
Figure 13- Colour changes during HAuCl4 reduction by citrate at boiling temperature.
11
1.2.3- Capping agents
The most promising technological applications for MNPs appear to concern
bioanalytical and biomedical problems thereby promoting stability, solubility in aqueous media
and controllable surface chemical reactivity to key features.23 An easy strategy to accomplish
these, is by using thiol ligands with hydrophilic end groups.
As mentioned before, a capping agent is a compound that binds to a nanoparticle
covering its surface. This compound is critical to avoid the NP growth beyond the nanometer
range, to stabilize the colloid in the solvent and can additionally bestow a functional group
useful to bind some molecule of interest later.3 If the capping agent binds the molecule of
interest to the NP, it is adding up the linker function, thus dismissing the use of another
compound to play the task.
The surface derivatization of an arbitrary NP, featured by the synthesis capping agent,
can be modified by ligand exchange. This may be accomplished by the exposure of the NPs to
an excess of a competing capping agent. The previous capping group can them be
sequestrated or the partially exchanged NPs isolated by precipitation and re-exposed to the
new ligand again in successive cycles to maximize the exchange.3, 24 This is the principle
followed in this dissertation´s experimental work to generate AuNPs with MUA (11-mercapto-1-
undecanoic acid) capping (Fig. 14), starting from the synthetic citrate capped AuNPs.
Figure 14- Representation of a MUA capped NP. Not at scale: MUA´s length is at least 4 times smaller than the smallest NPs prepared by common methods.
The sulphur atom from the MUA molecule competes with the citrate, establishing a
stronger bond with gold (almost covalent) than the ionic one promoted by citrate. In other works,
the molar stoichiometric amount of MUA to cover a 12 nm AuNP was accepted as 120 25, but
due to new data (yet to be published by our group, Luz, J. et. al) the ratio had to be corrected to
5000 in the course of this dissertation. Other suitable linkers are worth mentioning such as
antibodies and small peptides (CALNN- Cys-Ala-Leu-Asn-Asn23, 25, CALKK- Cys-Ala-Leu-Lys-
Lys23).
12
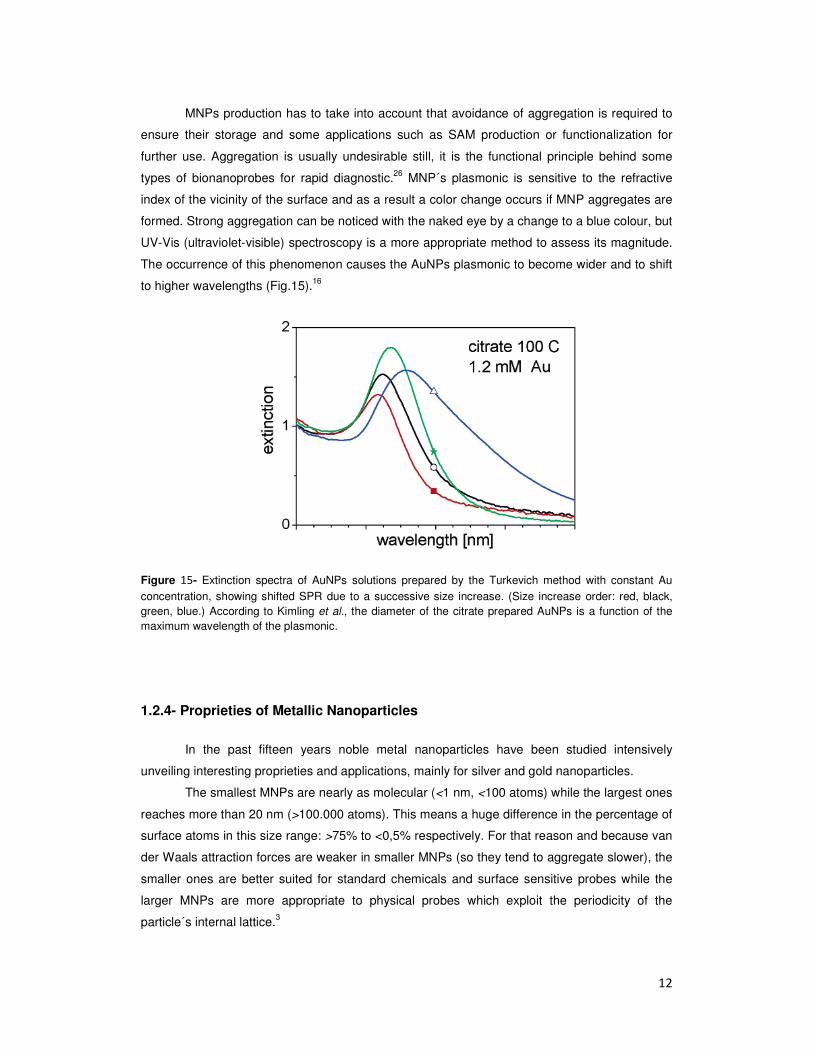
MNPs production has to take into account that avoidance of aggregation is required to
ensure their storage and some applications such as SAM production or functionalization for
further use. Aggregation is usually undesirable still, it is the functional principle behind some
types of bionanoprobes for rapid diagnostic.26 MNP´s plasmonic is sensitive to the refractive
index of the vicinity of the surface and as a result a color change occurs if MNP aggregates are
formed. Strong aggregation can be noticed with the naked eye by a change to a blue colour, but
UV-Vis (ultraviolet-visible) spectroscopy is a more appropriate method to assess its magnitude.
The occurrence of this phenomenon causes the AuNPs plasmonic to become wider and to shift
to higher wavelengths (Fig.15).16
Figure 15- Extinction spectra of AuNPs solutions prepared by the Turkevich method with constant Au concentration, showing shifted SPR due to a successive size increase. (Size increase order: red, black, green, blue.) According to Kimling et al., the diameter of the citrate prepared AuNPs is a function of the maximum wavelength of the plasmonic.
1.2.4- Proprieties of Metallic Nanoparticles
In the past fifteen years noble metal nanoparticles have been studied intensively
unveiling interesting proprieties and applications, mainly for silver and gold nanoparticles.
The smallest MNPs are nearly as molecular (<1 nm, <100 atoms) while the largest ones
reaches more than 20 nm (>100.000 atoms). This means a huge difference in the percentage of
surface atoms in this size range: >75% to <0,5% respectively. For that reason and because van
der Waals attraction forces are weaker in smaller MNPs (so they tend to aggregate slower), the
smaller ones are better suited for standard chemicals and surface sensitive probes while the
larger MNPs are more appropriate to physical probes which exploit the periodicity of the
particle´s internal lattice.3
13
Entering the nanoscale domain, the optical proprieties of the metallic nanoparticles are
remarkably different for two reasons: the energy levels gap´s become wider and superficial
plasmonic resonance (or surface plasmonic resonance) become a significant phenomenon.22, 27
The mass, and therefore the size, enables the wider energy levels that the electrons
can undergo which explains the intense red colour of the AuNPs solutions and its deviations in
the UV-Vis spectrum according to diameter: the smaller the particle, the bigger the energy
oscillation implying a shift of the plasmonic to smaller wavelengths.16
The surface plasmonic resonance (SPR) occurs when the size of the metallic
nanocrystal is inferior to the incident radiation wavelength. SPR is often referred as LSPR
(localized surface plasmonic resonance) as it is a localized phenomenon. SPR is originated as
follows (Fig.16)27. The electric field of an incident electromagnetic wave induces the polarization
of the free electrons relative to the ionic nuclei with much higher mass. The difference in global
charge is much more intense at the crystal surface and produces the oscillation of the electrons
at a certain frequency. To sum up, the free electrons in the conduction band suffer an in phase
oscillation with the incident electric field.27 This electronic collective movement excitation is
called plasmon.
Figure 16- Surface plasmonic effect in a spherical nanoparticle.
SPR depends on the nearby dielectric surroundings and on the free electron density of
the particle. The plasmon frequency depends on the metal dielectric function and on the shape
of the nanoparticle (NP) and is responsible for the creation of an adimensional electric field with
equal frequency at the particle´s surface.27 Furthermore, small changes in the plasmonic can
occur due to refraction index of the solvent.
In fact, the most prominent propriety of metallic nanoparticles is their intense and well
defined Ultraviolet-Visible (UV-Vis) spectrum which reflects the size, nature and shape of the
nanoparticles in solution.22
Besides their optical proprieties, nanoparticles are robust and have a high surface/
volume ratio which implies an elevated functionalizable area with capping agents and/ or
biomolecules.28 Moreover, for small spherical gold nanoparticles there is no experimental
14
evidence of associated toxicity.29 Depending on the capping/ functionalization, applications in
bioreactors30, biosensors12a, 30, bionanoprobes for quantification and clinic diagnostic12a,
nanoelectronics12a, materials for affinity chromatography separation, and controlled
pharmaceutics deliver can be met22.
1.3- Bionanoconjugates
This dissertation aims to study and apply the advantages of bionanoconjugates (BNCs)
in a phenol remediation system. Therefore, BNCs must be obtained, compared to the non-
conjugated enzyme and, at last, incorporated in a remediation system.
Having monodisperse NPs with the desired capping will usually mean they are stable
and therefore reaction controlled and limited. Their usage is thus closely linked to other
molecules that can be “added” to the NP for the application sought (such as tyrosinases in this
work). Besides the linkage capability, the capping agent specifies the type of interaction that will
be set with the intended molecules (e.g. proteins, antibodies): it can be chosen to enable the
adequate conjugation to a compound that will bestow its function to the assembly. This whole
assembly of a nanoparticle linked to specified molecules is referred as nanoconjugate and as
bionanoconjugate if the linked molecules are biological.
Covalent interactions (in opposition to electrostatic interactions for instance) enable
greater stability of the BNCs, but that can also imply more tension and less stereoliberty of the
BNC and the active biomolecule. Namely, in the case of linked proteins, conformational
changes can occur deriving in denaturation, loss/ gain of substrate specificity, increase/
decrease of activity.31 In some situations stronger binding may be desirable which tends to
ensure longer lifetime of the BNC and higher specificity to a certain substrate, but in general
non-covalent binding is preferable, as it interferes less with the native structure of proteins.
In this dissertation it is studied the system composed for AuNP-MUA bound to two
different tyrosinases (functional molecules).12a, 31
1.4- Tyrosinases
1.4.1- Tyrosinases- General considerations
Tyrosinases are part of the polyphenol oxidases (PPOs) enzymatic family, and are
classified as monophenol, o-diphenol:oxygen oxidoreductase EC 1.14.18.1.32 These enzymes
are widely distributed in nature (mammals, plants, bacteria, fungi) and play an essential role in
melanin biosynthesis.(Fig.17)33 In fact, they catalyze both the o-hydroxylation of monophenols
(cresolase activity) and the subsequent oxidation of o-diphenols to o-quinones (catecholase
15
activity).34 In aqueous solution, o-quinones are unstable and deteriorate over a period of
minutes to hours by a combination of nucleophilic reactions and further oxygen mediated
oxidations, not all of which are understood.35
Melanin pigments are polyphenolic polymers ubiquitous in living organisms: in
mammals they are responsible for skin, eye and hair pigmentation conferring protection by
absorbing UV radiation33a, 36; in invertebrates tyrosinase interfaces with defense reactions and
sclerotization37; in microorganisms it has been proposed that melanin has a role in the formation
of reproductive organs, spore formation, the virulence of pathogenic, and the tissue protection
after damage34a; in plants tyrosinases assist the regulation of the oxidation-reduction potential
and the wound healing system.32b
Figure 17- Melanin biosynthesis starting from the natural substrate, tyrosine. Dopaquinone is converted by the TYR to L-DOPA (which can also be the starting substrate) and dopachrome through auto-oxidation. TYR- tyrosine IQ- indole-5,6-quinone; L-DOPA (L-3,4-dihydroxyphenylalanine); DHI- dihydroxyindole; DHICA- dihydroxyindole-2-carboxylic acid; ICAQ- indole-2-carboxylic acid-5,6-quinone; HBTA- 5-hydroxy-1,4-benzothiazinylalanine
The browning phenomenon in fruit and fungi that occurs after tissues injuries or harvest
is also usually related to oxidative polymerization, similar to melanogenesis.33a This is an
undesirable phenomenon in fresh fruits, beverages, vegetables and mushrooms which
decreases the commercial value of the products and compels research to comprehend the role
of tyrosinases in biological metabolism.32b, 33a
Traditionally tyrosinases have been exploited in plant-derived food products (e.g. tea,
coffee, raisins and cocoa) to enhance organoleptic properties, but due to their ability to catalyze
crosslinking between peptides and carbohydrates; methods for stabilizing structure in low-salt
16
and low-fat food and tailoring polymers in material science (grafting of silk proteins onto
chitosan38) have been reported.32b, 33b
Besides PPOs, also peroxidases (EC 1.11.7.1) are known for oxidize polyphenols,
however they are highly dependent on the use of hydrogen peroxide as oxygen donor and are
unable to function in the presence of catalase.32a
Tyrosinases are cytosolic enzymes that are often partially bound to organelles or
membranar structures such as: thylakoids of the chloroplasts mainly in higher plants and
melanosome in mammalians.39 Gross tyrosinase extracts such as those used in this dissertation
have a fair amount of issues that should be mentioned. They contain endogenous phenolic
substrates already oxidized which can inhibit protein activity or lead to enzymatic artifacts, and
raise the initial absorbance when colourimetrics assays are performed. The removal of these
phenols by ion exchange resins usually result in an accentuated activity decline as result of the
loss of some isoforms and co-factors. Another issue is the reproducibility of the activity of PPOs
extracts due to variations in the development phase in which the mushroom is harvested and
due to which tissue was used.32a
1.4.2- Structure of Tyrosinases
From both structural and functional point of view, the most studied tyrosinases are those
from Streptomyces glausescens33a, Neurospora crassa
34b and from Agaricus bisporus.32a
Agaricus bisporus is a champignon mushroom and the tyrosinase extracted from this source is
commercially available (the lyophilized extract can be used without further treatment) and is
highly homologous with the mammalian ones. As a result, this tyrosinase has been used in
almost all studies on tyrosinase inhibition and is well suited for studies on melanogenesis.33a
Astonishingly, considering the numerous studies based on it, only recently (2011) became
available the crystallography structure for this protein (Fig.18).40
Sequence comparison of tyrosinases has demonstrated that exists a high heterogeneity
concerning length and identity, but also that all tyrosinases have highly conserved regions at the
active site.32b Tyrosinases are characterized by Type III copper centres (T3Cu) which consist of
a pair cooper ions (Fig. 19)39, 41 within a domain containing strictly conserved aminoacid
residues33a, 42 (each copper is coordinated by three histidine residues).32b
These centres are common in oxidases and oxygen-transporting proteins, such as
hemocyanin and due to strong antiferromagnetic coupling (spin pairing between the two Spin
=1/2 ions) these proteins exhibit no EPR (Electron Paramagnetic Resonance) signal.32b, 43
17
Figure 18- Top (A) and side (B) views of the Agaricus bisporus tyrosinase structure. The H2L2 tetramer structure was obtained by x-ray crystallography (2,6 Å resolution). H-L dimer interactions are between H1 (green) and L1 (cyan), and H2 (red) and L2 (magenta). Brown spheres- cooper ions; exogenous compounds: Black spheres- holmium ions; Yellow sticks- tropolone molecule in the active site Comparative and complementary information can be obtained through the Streptomyces
castaneoglobisporus tyrosinase structure obtained by Motoba et al.
The tyrosinase from Agaricus bisporus (AbT) usually presents as a tetrameric globular
protein with a molecular mass of 120 kDa composed of two subunits of ~43 kDa (H subunit) and
two subunits of ~14 kDa (L subunit).32a, 40 This is atypical among other PPOs that only present a
monomeric subunit similar to the H subunit mentioned. The monomeric tyrosinase (43 kDa)
isolated from mushroom fruit bodies is active,40 and the T3Cu centres solely appearance in the
H-alike subunits regard this as the functional part, which define a tyrosinase. The function and
origin of the L subunit is yet unknown.40
Figure 19- Type III Copper centre representation. Dioxygen (white circles) in the peroxide form bounds to both copper ions (black circles) which are in turn coordinated by nitrogen atoms (striped circles) from histidine residues. In the oxi form, Cu(I) become Cu(II).
18
Agaricus bisporus copper mass represents 0.2% of its total mass, present in the H
subunits. Copper is strongly bound and only dialysis against strong complexing agents (such as
HCN) can remove it.
Besides the AbT a recently produced and promising32b tyrosinase was also studied in
this dissertation. The tyrosinase from Trichoderma reesei (TrT), was recently (2006)
overexpressed under a strong promoter in the native host and it is secreted into the culture
supernatant. Until now, all plant, animal and fungal tyrosinases studied had intracellular origin,
so the reported TrT expression is a new achievement within this enzyme class.44 TrT was
obtained much purer than AbT (close to 100% purity)45, available in Tris-HCl buffer pH 7.5
concentrated solutions from VTT, Finland. Its molecular mass is 43.2 kDa, but no structure is
yet available and it revealed to have more activity and stability within a neutral and alkaline pH
range, being greater at pH 944 (Fig. 2045).
Figure 20- TrT activity on 15 mM L-dopa 300 - 400 nkat/mg (depending on the enzyme formula and preparation), Tris-HCl buffer pH 7.5.
TrT has stable activity (1h, 25ºC) at pH 7-9 and an optimum activity temperature of 30-
40 ºC, so it can be easily attempted do use in any application suited for AbT. It offers the
advantages of higher purity; higher activity (Fig. 21) and heterogeneous expression under a
strong promoter, opposed to the disadvantages of a higher production price (the process scale-
up is limited so far) and a low activity at acidic pH. The instability even at slightly acidic pH is an
important operational problem considering the substrate conversion pushes the pH of the
reaction system towards bellow neutral values as the reaction proceeds.
19
Figure 21- Reaction rate at different tyrosine concentrations for AbT (black squares) and TrT (white circles).
1.4.3- Activity of Tyrosinases
The cresolase activity is the rate-limiting reaction (can be until 40 times slower than
catecholase32a) in melanin synthesis (Fig. 22)46 and this makes biological sense because the
outcome of the reaction can proceed the pathway spontaneously at physiological pH value.33a
In both cresolase and catecholase activities an oxygen atom from a dioxygen molecule
is incorporated in the substrate while the other atom is reduced to water by a co-substrate
(monophenol or similar molecule).32b There are also broad substrate specificities for both
activities, but the enzyme has more affinity for L-isomers than for the corresponding D–
isomers.33a The main endogenous substrates are L-tyrosine, γ-glutaminyl-4-hydroxybenzen
(GHB), and aminephenol39. In the case of phenol as substrate it can be converted directly to o-
quinones by an undetermined process or can be processed trough cresolase and catecholase
activities.47
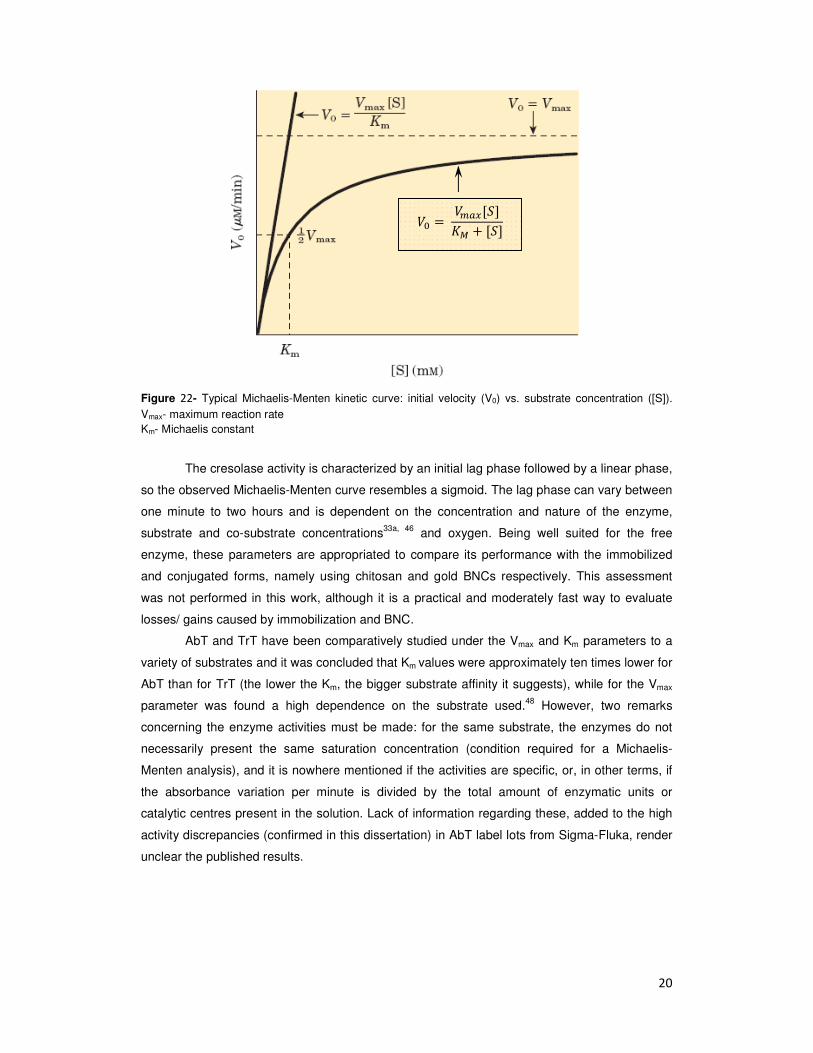
The study of tyrosinase kinetics is usually assessed by Michaelis-Menten parameters
(Fig. 22). Mainly because, experimental points have shown to fit Michaelis-Menten kinetics and
its parameters have proven to be very sensitive to the nature of the substituents present on the
aromatic rings.35 When cresolase activity is much slower than catecholase (as in the tyrosinases
studied in this dissertation), the first reaction has a major weight in the kinetic parameters (Vmax
e KM) and, all together, tyrosinase´s global activity can be considered a classic two-substrates
reaction, with each activity following an ordered Bi Bi sequential mechanism (two substrates
generating two products) according to studies in plants and bacteria.
20
Figure 22- Typical Michaelis-Menten kinetic curve: initial velocity (V0) vs. substrate concentration ([S]). Vmax- maximum reaction rate Km- Michaelis constant
The cresolase activity is characterized by an initial lag phase followed by a linear phase,
so the observed Michaelis-Menten curve resembles a sigmoid. The lag phase can vary between
one minute to two hours and is dependent on the concentration and nature of the enzyme,
substrate and co-substrate concentrations33a, 46 and oxygen. Being well suited for the free
enzyme, these parameters are appropriated to compare its performance with the immobilized
and conjugated forms, namely using chitosan and gold BNCs respectively. This assessment
was not performed in this work, although it is a practical and moderately fast way to evaluate
losses/ gains caused by immobilization and BNC.
AbT and TrT have been comparatively studied under the Vmax and Km parameters to a
variety of substrates and it was concluded that Km values were approximately ten times lower for
AbT than for TrT (the lower the Km, the bigger substrate affinity it suggests), while for the Vmax
parameter was found a high dependence on the substrate used.48 However, two remarks
concerning the enzyme activities must be made: for the same substrate, the enzymes do not
necessarily present the same saturation concentration (condition required for a Michaelis-
Menten analysis), and it is nowhere mentioned if the activities are specific, or, in other terms, if
the absorbance variation per minute is divided by the total amount of enzymatic units or
catalytic centres present in the solution. Lack of information regarding these, added to the high
activity discrepancies (confirmed in this dissertation) in AbT label lots from Sigma-Fluka, render
unclear the published results.
21
1.5- Bioremediation
1.5.1- Bioremediation concept
According to the United States EPA (Environmental Protection Agency), bioremediation
consists in the use of living organisms to clean up oil spills or remove other pollutants from soil,
water or wastewater; use of organisms such as non-harmful insects to remove agricultural pests
or counteract diseases of trees, plants and garden soil.49 This definition can be expanded
beyond whole living organisms and resumed as being the application of biological processes for
the treatment of hazardous chemicals present in the environment.50 The treatment aims to
transforms the hazardous compounds to an innocuous form or to degrade them to below the
established concentration limit.
Bioremediation can be complemented with physical, chemical or mechanical methods
but, alone, it presents the advantage of not generating toxic side products. Enzymatic
bioremediation also enables enzyme in situ digestion by indigenous microorganisms after the
treatment; enzymes can be produced at a higher scale than whole microorganisms, with
enhanced stability and/or activity and at a lower cost by using recombinant-DNA technology, but
it has some drawbacks such as the exposure to high stress and lack of cofactors outside a cell.
Enzymatic bioremediation can be explored simply by searching for a microorganism
capable of feeding on a particular pollutant, identifying the enzyme responsible for the
transformation and then improving it to sustain operating conditions.51
1.5.2- Phenol remediation
Aromatic compounds, including phenols and aromatic amines, are a major class of
pollutants worldwide and many are classified as priority pollutants by the United States EPA52
and the European Union53 and subject to specific legislation. They are found in wastewaters of
a large number of industries such as coal conversion, petroleum refining, resins and plastics,
wood preservation, dyes, metal coating, chemicals, synthetic fibers, mining and paper pulp.54
Aromatic compounds are persistent and associated with toxic effects55 and, as result,
wastewaters must be treated to decrease these compounds to a level suitable for discharging.
Another, sometimes unsuspected, source of these compounds is the introduction of xenobiotics
through agriculture promoting the contamination of underground water and household
medication which end up in the sewers. To accomplish the legislation of each country, the
methods synthesized below have received the most attention.
1- Peroxidases can treat a large variety of phenolic compounds over a wide range of pH
and temperature. Peroxidades (mainly from horseradish) in the presence of hydrogen peroxide
originate free radicals that spontaneously react to form polymeric products of reduced solubility,
22
which can be removed by sedimentation after a coagulation step.56 This approach has the
prohibitive cost of the enzyme and the hydrogen peroxide as downside.57
2- Tyrosinases catalyze the oxidation of phenols to o-quinones using molecular oxygen
as electron acceptor. This enzyme is widely available in nature and has a cost comparable to
the peroxidases. It has been reported to have more than 50% of optimum activity at pH 5-8 with
a maximum at pH 7, and instability under acidic conditions at elevated temperatures.57
3- Photocatalytic degradation of phenol in the presence of semiconductor oxide
catalysts (ZnO and TiO2 for instance) using high potency UV irradiation.58 This process
mineralizes organic compounds into CO2 but it is very time consuming, lacks selectivity for
aromatic compounds (much less for phenol) and many variables (e.g. scale-up and degradation
yield vs. light-wavelength/potency) are yet to be studied.
4- Activated charcoal has affinity for non or weekly polar compounds and can be
regenerated by heat. Its high porosity confers a wide internal surface, also meaning high
absorption capacity. It is considered a cheap and undemanding method.
Lately, enzymatic methods have received most attention because they require low
retention times comparing to others. Conventional methods fall short of achieving the required
degree of removal of these pollutants while enzymes can target specific pollutants even if
diluted are becoming cheaper and customizable (by genetic engineering), and they are less
likely to be inhibited by substances toxic to living organisms performing the same
remediation.54b A promising feature of enzymatic systems is the possibility to combine pollutant
quantification with pollutant degradation. This approach is called sense-and-shoot and
nanotechnology plays an essential role in it.59 AuNPs particularly, provide a stable surface for
enzymatic immobilization and can act as nanoscale electrodes interchanging electrons between
the enzymes and the electrode material (Fig. 23)60. This is expected to increase the detection
limit (especially important for endocrine disruptors61) owing to a bigger responsive area in the
sensor; and, by modulating the current in the electrode, to improve the enzymatic activity
without the need of external electron-transfer mediators.60, 62
Nevertheless, the use of the mentioned enzymes in a remediation system is critically
unappealing due to the enzyme production costs. In this dissertation, this approach is
reconsidered because the newly available TrT is produced under a strong promoter and
secreted to the culture supernatant. This method, being recent, has yet an elevated scale-up
potential, associated with obvious costs reduction. If a commercial application is found, scale-up
studies become justifiable and phenol remediation via enzymes may become competitive. In
this work some steps were taken towards the adequacy of using TrT in phenol remediation.
Some remediation setups were conceived and tested using AbT, and, in a later phase of the
study, it was aimed to implement TrT in the most promising ones.
Accurate and highly sensitive detection of phenols is important to assess the quality of
the available water sources and to ensure trustworthy investigation towards them.
Complex matrixes limit the analytical methods prone to be applied in practical situations.
The elements of a matrix have very specific proprieties by their own but they are not necessarily
known nor quantified by the operator, therefore the convenience of calling it “complex” in the
situations where this happens. Not knowing sufficiently the composition of a matrix adds up the
problem of the interaction within its elements because mutual inertness cannot be ensured.
Assuming a global equilibrium is met; the physic-chemical processes can potentially be
translated in a change of density and viscosity, and origin phases, emulsions and solid
suspensions, in fluids. These factors are important for the selection of the analytical method/
necessity of a pre-treatment but, more importantly, the matrix elements themselves may mask
the analytes detection.
Phenol contaminated wastewaters are complex matrixes rich in solvents and industrial
sub-products and so, quantification analysis must attend to it. A simple way to contemplate the
matrix influence in an analytical process is to complete it with the standard addition method.
Considering now the simplest reaction mixtures obtained from TYR (tyrosinase) activity, they
generate a panoply of unstable (short aqueous life-times) aromatic compounds (mainly
quinones) that enter in a mutual equilibrium41 (in Fig. 13 only the most representative and stable
species are represented). If the TYR used is the impure AbT extract, the reaction mixture can
24
also be expected to already contain peptides, inactive proteins, cellular residues and various
phenolic compounds.32a Because products are not stable and because an unique product
cannot be singled out, the reaction rate assessment is more accurate by detecting the latent
substrate.
Most available methods (gas/liquid chromatography, spectrophotometry) required
demanding sample treatments and their operation is very time-consuming.59 Advances in the
technology of amperometric tyrosinase-based biosensors proved them to be very simple, highly
sensitive and effective for phenol assay. Regardless of all these potential advantages, many of
them still are at the “proof-of-concept” phase and it can be pointed out that the measured signal
is greatly susceptible to the matrix complexity and the molecular targeting is a major concern.60 63
To predict the efficiency of any remediation system using tyrosinases, it is important to
study their kinetic proprieties. These proprieties are commonly evaluated by four methods:
colorimetry; oxygen electrode; oxygen manometer and radiochemical liberation of 3H from a L-
[2,6-3H]monophenol used as substrate.32a Oxygen measurements lack precision because
products are easily oxidized and recycled multiple times using molecular oxygen cost.
Colorimetry is the simplest method and it is very effective if the enzymatic extract is free from
other oxidizing enzymes. The TYR´s activity can be measured at 280 nm (ε280= 1440 M-1cm-1)35
because the oxidation to L-DOPA contributes the most to absorption variations in this
wavelength, however many other aromatic compounds absorb in this region and so a better
alternative is to follow the formation of the final reaction product (o-quinones). To accomplish it,
an indirect way is used consisting in reading the formation of the main product of the side
reactions, the dopachrome, at 475 nm (ε475= 3600 M-1cm-1).41 For environmental legislation
purposes, there are standard procedures described to quantify trace (<100 ppm)64 and
ultratrace (<1 ppb)64b levels of phenol that often occur.65 They typically comprehend a sample
extraction step by liquid-liquid extraction or evaporation of the extract to isolate and concentrate
the analyte followed by GC/MS (Gas chromatography/mass spectrometry), GC (Gas
chromatography) with electron capture detection in a dual-column set-up, or HPLC-UV
analysis55, 66 The analysis using GC with sample detector is amenable as well.67
To favor the rate measurement exactitude, o-quinones can be recycled back to o-
diphenol by an UV-absorbing reducing agent (ascorbate or NADH for instance) and the
consumption of this agent monitored. Another process involves the formation of stable adducts
which appearance can also be followed by colorimetry.32a Either way, none of these reactants
could be used in this dissertation work because they would have an aggregation effect over the
AuNPs/BNCs.
Another problem is the suicide inactivation of TYR by its own products, meaning activity
rate measurements have to be promptly performed and that TYR cannot catalyze for long
periods. To prevent this, besides the adduct formation, an alternative has gained much attention
lately. Chitosan is reported to induce precipitation of reaction products arising from phenol
transformation without affecting the rate of the catalyzis.57 This is especially important for
25
remediation because chitosan (Fig. 24) is a natural polymer derived from chitin (via
deacetylation with alkalis) know for its nontoxicity and biocompability68 but more work needs to
be done concerning its inhibition preventing role.
Figure 24- Molecular structure of chitosan.
Sample preparation- SPME
Brute matrixes analysis often generates interferences and incompatibilities in the
analytical equipments. To avoid these problems and to seek analyte isolation and
concentration, sample preparation methods are chosen according to the analytic technique to
be used.
Solid-phase microextraction (SPME) is a technique developed in 1990 that suits well
gas chromatography demands, mainly because it has a high concentration potential adequate
for GC detectors sensitivity, facilitates the transportation of the extracted material to the
chromatographer and avoids the introduction of non-soluble particles from the matrix in the GC
column.54b, 69 It is a rapid and solvent free extraction alternative technique used in
environmental, food and drug abuse fields nowadays.54b SPME equipment is based on a silica
baton with a 10 mm ending covered with a thin polymer film [e.g. polydimethilsyloxane (PDMS),
polyacrylate (PA) or Carbowax (Cwx)] or with an adsorbent solid (e.g. activated charcoal).69(Fig.
25) The sample preparation by SPME is simple, reproducible as long as the adsorbent is
consistently treated the same way, and fits general purpose analysis with few adjustments. Due
to all the above mentioned, SPME is appropriated for this dissertation objectives.
The baton ending is immersed in the sample and extracts, according to the partition
coefficients, the compounds present. Headspace extraction is also possible depending on the
fibre characteristics. After saturated, the fibre is introduced in the injector port of a GC where
the analytes are thermally desorbed under a gas flow that carries them to the chromatographic
column.69
26
Figure 25- SPME typical sampler, extraction (1-3) and injection (4-6) stances. At 2nd and 4th frames, the extracting fiber is exposed from the needle to the sample and to the injector respectively.
In SPME the molecules in the matrix of the sample have to migrate and penetrate the
coating adsorbent material which means that mass transfer and kinetic resistivity are important
factors to the time required until partition equilibrium is achieved between the sample matrix and
the solid-phase coating.67, 69 To reduce migration time and promote effective adsorption
impacts, matrix agitation is crucial.(Fig. 26)
Figure 26- Aqueous benzene (1 ppm) extraction outlines under different magnetic agitation intensities. A- Theoretical behavior; B- 2500 rpm ; C- 1800 rpm ; D- 400 rpm ; E- no agitation
29
2- Material and methods
2.1- Reagents
2.1.1- General considerations
All weighting was performed using a AS220/c/2 (Radwag) scale.
All buffers and solutions involving AuNPs were prepared using ultrapure milliQ water
(purity=1 at >10 MΩ/cm) obtained from Watermax W2 (Diwer).
All absorbance measurements were acquired bellow the unitary value. When the
sample had higher absorbance, it was diluted and then measured, which means the
Absorbance values higher than one, presented in this dissertation, are corrected ones.
The pH of all buffers was corrected with the corresponding weak acid or base of the
buffer and measured using a pH-Meter BASIC20+ (Crison).
L-tyrosine and L-DOPA oxidize quickly in solution so fresh solutions were always used.
All controlled stirring and heating were done by an Agimatic-N (P-Selecta) plate.
Activity rate assays were only performed using bubbled oxygen 99,9% to confirm the
labels information. All the others were performed at atmosphere conditions.
TrT is a novel and expensive enzyme, produced at VVT, Finland, and consequently our
laboratory supply was limited to 900 uL. Due to this limited amount, generally, TrT assays were
performed with no duplicates.
GC prepared standards were all filtered using Acrodisc Syringe Filter with 0.45 µm pore
Nylon membrane (PALL).
2.2- Bionanoconjugates preparation
It was stated in the Introduction that reproducibility is a major concern regarding
tyrosinase investigation. Not only for being a recommended investigation practice, but also to
have comparable data and more precise conclusions, all enzyme lots used during this work
were tested for protein concentration and activity.
2.2.1- Protein concentration – BCA Assays
Total protein concentration was assessed by the Bicinchoninic Acid assay (BCA).
Units of 30 kDa cut-off. Maximum velocity was used to rapidly concentrate BNC/free enzyme at
the bottom of the tubes and 18 minutes were required to filter enough volume to use in GC.
2.6- Bioremediation systems
At the beginning of this dissertation three remediation systems were idealized: batch
remediation followed by ultracentrifugation to isolate the catalyte from the remediated effluent,
an immobilized petri dish batch system, and “plug-flow” using and adapted regular syringe.
Because of its simplicity, the ultrafiltration system was the one in which efforts were
concentrated.
2.6.1- Ultracentrifugation recovery batch system
This system was evaluated by testing the effects of centrifugation upon BNC-MUA-AbT
incubated with tyrosine and phenol. BNC were subject to different cycles of centrifugation (Fig.
27; Amicon Ultra-4 centrifugal unit 100 kDa cut-off(Millipore)], and between each one they
were incubated with phenol for an hour or just left resting (for assays identified as “tyrosine”).
After centrifugation (1699 G for 4 minutes), activity rate was measured by the Sigma protocol.
Figure 27- After 1 hour reaction, the BNC were ultracentrifuge, and recovered in the filter to be ressuspended and reused.
35
2.6.2- Immobilized petri dish batch system
Optical microscope slides existing in the laboratory were cut in approximately 26
mmx26 mm squares. 0.2 mL of chitosan (6 mg/mL in 0.5% acetic acid) were laid in the centre of
each square. Given the high viscosity and the volume used, no overflow occurs. The slide was
then rinsed with phosphate buffer pH 7 50 mM and milliQ water. To each square, 100 uL of free
enzyme 1x and BNC-cit/MUA-AbT 1 nM in phosphate buffer pH 7 10 mM were deposited. Two
other squares had no deposition and were left blank. All squares were then covered with 400 uL
of chitosan equal to the previews one. Less than this volume is not enough to ensure full
coverage, and therefore, entrapment. Rising with phosphate buffer pH 7 10 mM was repeated.
All slides were stored at 4 ºC so that the hydrogel could gain consistency and fuse the bottom
and top gels. A petri dish for each slide (Fig. 28) was set with 12 mL (volume needed for full
submersion of the gel) of equivalent reaction mix purposed by Sigma in their activity protocol
assay (phosphate buffer pH 7 18 mM, 0.3 mM tyrosine). The activity reaction started by
depositing each square in the tyrosine solution. One of the black squares was left as a chitosan
control and the other was used in a batch in which free enzyme was pipetted directly into the
reaction solution. Stirring was effective at 500 rpm using a 2.5 cm long magnet centered in the
dish. At regular time between 0 and 30 minutes, an aliquot from the reaction volume was taken
and absorbance at 280 nm measured. After the reading it would be replaced in the reaction.
Duplicates were made.
Figure 28- Petri dish containing a glass square with immobilized BNC/TYR immersed in a tyrosine solution, under agitation.
2.6.3- Plug-flow syringe
An operative module was designed using 25 mL syringe (Braun Injekt) parts. No
needles take part in this setup. The emboli was retrieved from a syringe and cut according to
Figure 29 (B). The cross section was cut to facilitate the confluence of the fluxes from each of
the four paths and the concave plate was filled with holes. This part was inserted in another
syringe as seen in Figure 29 (A).
36
In spite of not being tested, we propose this setup as an alternative that could be put to
work by laying a tyrosinase containing gel (chitosan and/ or agarose) and them to push the
substrate through, recovering the product in a vessel at the ending.
Figure 29- A- Assembled plug-flow module and its three different parts. B- Shaped emboli with perfurations on top.
38
3- Results and discussion
3.1- Bionanoconjugates preparation
Bioconjugation ratio is highly dependent on the nature and total amount of proteins in
the solution. Previous work solely based on the expected activity25, lack to acknowledge that
impure extracts such as AbT have many variable impurities and that even when inactive TYR
can be occupying AuNPs surface. Because of this, conjugation ratios already reported have to
be questioned. Since that is not the main subject of this work, but it depends on an effective
bionanoconjugation, a serious detour had to be made, by using a theoretical estimation model,
zeta potential and electrophoresis to assess BNC proper conjugation ratio.
3.1.1- Protein concentration – BCA Assays
Three AbT commercial lots used during this dissertation were tested (Appendix II). The
results are shown in Table 1. The three lots are consistent between each other and it can be
concluded that, on average, only 62% of the solid extract sold commercially is proteic. This
means that 62% of the weight consists in peptides and unspecified proteins from which an
undetermined part was actually active AbT. Therefore, for this commercial extract, conjugation
studies should be based on the total amount of protein.
Table 1- Protein content (wt/wt) in 3 commercial AbT (Sigma-Aldrich) lots.
Lot number [Prot] (mg/mg extract)
1 0.621
2 0.576
3 0.661
Total 0.619±0.043 62%
The BCA assay was also used to test the commercial TrT solution (VVT, Finland). (Appendix II)
BCA assays performed on TrT often resulted in high standard deviations among replicates. This
can indicate low homogeneity of the TrT aliquots or the occurrence of a precipitation process.
According to Table 2, the lot has very high protein content and due to its production process
(INTRODUCTION: 1.4.2- Structure of Tyrosinases), it can be expected a great TrT purity.
Table 2- Protein content (µg /mL) in the commercial TrT (VVT) lot. Lot number [Prot] µg/mL
1 553 92%
39
For both tyrosinases, BCA assays could be also complemented with ICP- AES (Inductively
Coupled Plasma Atomic Emission Spectroscopy) for copper atoms. Quantification of cooper
would be valuable information for the precise quantification because each catalytic unit contains
2 cooper atoms.
3.1.2- Protein concentration – Activity determination
Sigma provided a total of three protocols to study AbT activity. All three were
considered, but two of them were dependent on ascorbic acid (incompatible with AuNP testing)
and presented less precision, so they were excluded for this work. In the remaining of the three,
it was noted that the definition of catalytic unit in Sigma Activity protocol (Appendix I) was
different from the recommended by the Nomenclature Committee of the International Union of
Biochemistry.70 Due to this and high variability in the activity results being obtained
experimentally (face to the expected ones), all TYR lots were tested when purchased (Appendix
III) according to the method declared by Sigma to acquire the lots labeled data (Appendix I).
The variations found between lots (Table 3) argue against the approach of developing AuNP
conjugation according to enzyme activity: not only it appears as a highly variable parameter
(function of lot and time), but, it is easily understandable that inactive TYR and unspecified
proteins (see BCA assays data) can still bind to the AuNPs. These simple tests point out how
misleading investigation can be when based on manufacture´s information, especially
considering many reports on this area that take suppliers data for certain.
Table 3- Commercial AbT activity (U /mL). Total represents the results comparatively to labeled data.
Lot number Act (U/mL) TOTAL
1 10033 234%
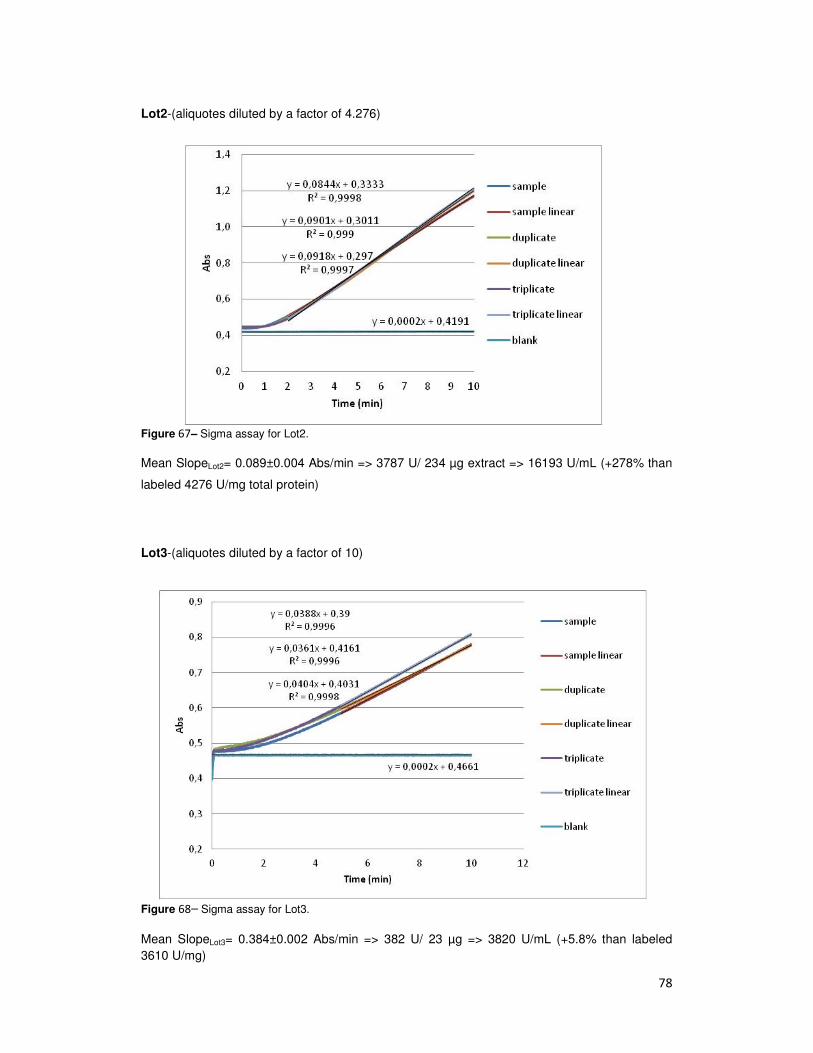
2 16193 378%
3 3820 106%
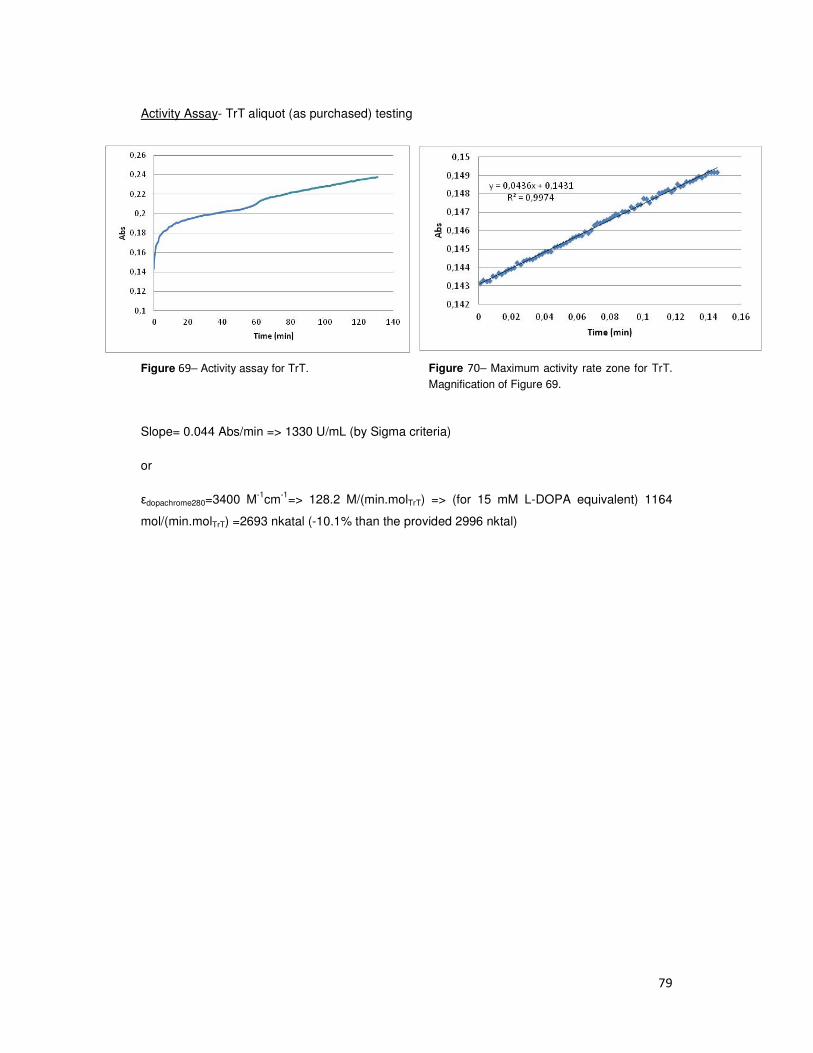
TrT activity was also tested (Appendix III) using testing information from the supplier
(VVT, Finland). Due to some changes undertaken to perform the testing conditions of the
supplier (described in Matherial and methods), the activity variation found cannot be considered
significant. (Table 4)
AbT activity intensity relative to the substrate L-Tyrosinase typically achieved with 200
µg of solid extract can be attained with less that 2 µL of the purchased TrT aliquot. This
suggests that TrT was extremely pure and concentrated besides the intrinsic higher activity than
AbT. (Fig. 21)
40
Table 4- Commercial TrT activity (nkatal). Total represents the results comparatively to labeled data.
3.1.3- Capping agent- MUA
The reported MUA ratio for a complete Turkevich AuNP (as described) capping was 1
AuNP : 120 MUA (in molar).25 During this work, the ratio was found to be incorrect and a new
one was proposed by a colleague- 1:5000. The viability of this dissertation depended on the use
of AuNP-MUA prepared adequately and, therefore, reproducible synthesis had to be ensured.
Moreover, the first activity tests using bionanoconjugates obtained from these 1:5000
AuNP:MUA were unsuccessful. Since bionanoconjugates activities with MUA capping had been
reported25, no suspicion has fallen upon the new ratio of 1:5000. However, since thiols are
known to be tyrosinase inhibitors, a way to ensure the coverage while dismissing the leftover
MUA in solution had to be found. The way was achieved by ultracentrifugation of the AuNP-
MUA 1:5000. The pellet was isolated and then resuspended in milliQ water. UV-Vis spectra
were made to search for AuNP aggregation evidence or method variation between batches, but
no aggregation was found.(Fig. 30)
Figure 30- AuNP MUA 1:5000 produced by the new proposed method. Diluted 1:101 from the recovered
pellets. NP concentration estimated between 130-137±4 nM; diameter: 11,74±0,04 nm.
Lot number Act (nkatal)
1 5530 90%
41
The MUA conjugation with the AuNPs was also performed in a saline solution. MUA
was dissolved in PBS solution prior to the AuNP addition enabling a visual comparison between
the capping kinetics competing against the aggregation kinetics. (Fig. 31)
Figure 31– AuNP-MUA 1:5000 3 nM non ultracentrifuged. In order: non-centrifuged NP in water, and
phosphate buffer saline.
This data suggests that MUA capping kinetics is faster than aggregation kinetics of
AuNPs while in ionic strengths corresponding up to 139 mM.
The aggregation study with sodium chloride, showed a typical plasmonic behavior for
AuNP. (Fig. 32)
Figure 32–UV-Vis spectra for ultracentrifuged AuNP-MUA 1:5000.
42
Aggregation status can be evaluated by the Abs600nm/Abs 520nm ratio. (Fig. 33)
Figure 33– Abs600 nm/Abs 520 nm ratio for ultracentrifuged AuNP-MUA 1:5000.
A ratio of near 0.35 was maintained up to 100 mM of NaCl whereas an inflection starts
indicating that aggregation was initiating for NaCl concentration. Regarding this data,
ultracentrifudge AuNP-MUA 1:5000 samples showed stability seems to be stable until an ionic
strength corresponding to 100 mM NaCl.
3.1.5- Enzyme conjugation ratio
After preparing suitable AuNP-MUA the next step was their conjugation with TYR.
Surprisingly, no theoretical model was found in the literature to estimate the number of
(bio)molecules a NP can contain around it in a monolayer. Since a tool like this was missing in
our investigation group and validation criterion was needed to criticize experimental data
acquired in this work, a method is thereby proposed as follows.
Knowing the diameter of the spherical AuNP with the capping, the surface area can be
calculated. If the conjugated protein is globular, the problem can be resumed to the following:
how many spheres (approximate) can fit around a single spherical NP?
Firstly the diameter of the covering spheres must be known. AbT structure was
published only very recently, while for TrT none is yet available. Considering this as a recurring
difficulty, it is needed a way to estimate the diameter of unfamiliar proteins is necessary.
Considering globular proteins32a, the problem is fairly easy to solve. From the literature it was
possible to collect and correlate diameter and molecular weight of a known protein. Applying a
tenth base logarithm, a good correlation was found.(Fig. 34)
43
Figure 34– Correlation between experimental globular protein diameters and molecular weight. Data from
(from least to most heavy): cytochrome C; myoglobin; insulin hexamer; hemoglobin; catalase.
Using this correlation a diameter of 7.6 nm was estimated for AbT and 5.1 nm for TrT.
Meanwhile, an online tool (http://www.calctool.org/CALC/prof/bio/protein_size) was found which
accomplished this same purpose using the same principle used by us: correlation between
empirical results of several model proteins and enzymes. Now the estimated diameter was
6.9nm for AbT and 4.9 nm for TrT. Since the online tool must be based on a more extensive
database it was decided to use its estimates.
Our propose uses the Thomson´s Model. It has long been applied to describe electrons
arrangement and energy states around atoms. It is based on the principle that the electrons on
the surface of an atom rearrange according to the most stable configuration. That implies
electron maximum mutual distance because they all are negatively charged. Proteins have a
characteristic isoelectric point and that determines if their global charge is positive or negative.
Either way, since all are equally charged they tend to repulse each other.
For the bionanoconjugation purpose, the optimal coverage can be considered achieved
when a NP has a single compact monolayer, meaning they are so close that they are in touch
and the angle between two proteins is minimum.
Solutions to the Thomson´s Problem are presented in form of tables presenting the
configurations of smallest known energy for N electrons. Given a N number of electrons, the
symmetry was predicted so that the angle between them is maximized. Taking a protein in
consideration, the process can be though in reverse: given the smallest angle separating each
enzyme, what is the corresponding N number of proteins. The smallest angle is exactly the one
made by two protein centres and the core of the NP, and it can be estimated using the circular
arc (Fig. 35).
Figure 35– Thomson´s Model approach to estimate AuNP maximum protein cover
angle (red frame) is calculated and then tables for Thomson´s problem are used to find the maximum N (number of surface elements)
Using the described process, we estimate that each 12
71 AbT or 121 TrT to form a full monolayer
more agreement using TrT because it is more pure and AbT has other forms in solution than
just the native tetrameric form.
Agarose gel electrophoresis
The electroforetic mobility of
particle. The less conjugated is a particle, the more negative charge it will be exposed and more
extensive will be the migration from the negative (starting point) to the positive pole. When the
NP is completely covered, it is achieved the maximum neutralization of the NP negative charge
and superior TrT concentrations should not cause the BNC to migrate even slower.
The observed smearing is due to the photo just being taken one day later. Since the
was left in the running buffer to prevent hydra
Thomson´s Model approach to estimate AuNP maximum protein coverage. The minimum
angle (red frame) is calculated and then tables for Thomson´s problem are used to find the maximum N
Using the described process, we estimate that each 12 nm AuNP can be covered with
a full monolayer. From a practical point o view, it was expected much
more agreement using TrT because it is more pure and AbT has other forms in solution than
gel electrophoresis
The electroforetic mobility of the BNC depends on the size and charge of the complexed
particle. The less conjugated is a particle, the more negative charge it will be exposed and more
extensive will be the migration from the negative (starting point) to the positive pole. When the
is completely covered, it is achieved the maximum neutralization of the NP negative charge
and superior TrT concentrations should not cause the BNC to migrate even slower.
The observed smearing is due to the photo just being taken one day later. Since the
unning buffer to prevent hydration, the bands lost resolution.(Fig. 36)
44
age. The minimum
angle (red frame) is calculated and then tables for Thomson´s problem are used to find the maximum N
nm AuNP can be covered with
expected much
more agreement using TrT because it is more pure and AbT has other forms in solution than
the BNC depends on the size and charge of the complexed
particle. The less conjugated is a particle, the more negative charge it will be exposed and more
extensive will be the migration from the negative (starting point) to the positive pole. When the
is completely covered, it is achieved the maximum neutralization of the NP negative charge
The observed smearing is due to the photo just being taken one day later. Since the gel
0,3
0,4
0,5
0,6
0,7
0,8
0,9
1
1,1
1,2
0 100
Rf
Figure 36– Agarose gel electrophoresis of AuNP
concentrations. Values indicated are in
To better perceive the results from this gel, a graphic of relative mobility was made as
follows. (Fig. 37) Mobility has a linear behavior until about 100
that the tyrosinase monolayer is being formed. To higher enzyme concentrations, the surface is
apparently full and the shielding effect upon the AuNPs is at
no more reductions.
Figure 37– Relative mobility (Rf) for each BNC (TrT) band in the agarose electrophoresis gel.
100 200 300 400 500 600
[Trt]:1 [AuNP] (nM)
gel electrophoresis of AuNP-MUA incubated with progressively higher TrT
concentrations. Values indicated are in nanomolar. Third sample was deposited without glycine.
the results from this gel, a graphic of relative mobility was made as
Mobility has a linear behavior until about 100 nM Trt: 1 nM AuNP indicating
inase monolayer is being formed. To higher enzyme concentrations, the surface is
apparently full and the shielding effect upon the AuNPs is at his maximum and mobility suffers
for each BNC (TrT) band in the agarose electrophoresis gel.
45
600
MUA incubated with progressively higher TrT
nanomolar. Third sample was deposited without glycine.
the results from this gel, a graphic of relative mobility was made as
nM AuNP indicating
inase monolayer is being formed. To higher enzyme concentrations, the surface is
is maximum and mobility suffers
46
Zeta potential
Zeta potential measurements were also made to study the BNC solution population and
to find a correlation between zeta potential and conjugation ratio. A correspondence between
agarose mobility and zeta potential results were expected since both methods are a result of the
electroforetic mobility of the species in the solution (study showing the correlation between both
methods is yet to be published by our group).
Zeta potential readings can the acquired through General or Mononodal modes.
Mononodal only delivers one mean value to the whole solution. During the readings in General
mode, samples are subject to a higher current for a fair amount of time and there is the
possibility of the enzyme to unbind, nevertheless, the Mononodal mode revealed to be
insufficient to follow the BNC zeta potential population peak. Hydrogen potential for the samples
was in the range 9.10-9.14 and 8.91-8.96, respectively before and after the zeta potential
measurements, indicating the solution remained stable during testing.
There are three main populations expected to exist in a BNC solution: unconjugated
AuNPs; free enzyme and BCNs. Figure 38, complemented by Table 5, illustrate the three
expected peaks: (from more to less negative) AuNP (-43 mV), BNC (-27 mV), free enzyme (-0.8
mV).
Table 5- Zeta potential data (General Purpose method) for a BNC sample with suboptimal TrT concentration (1:50).
Figure 38– Zeta Potential profile (General Purpose method) for a BNC sample with suboptimal TrT concentration (1:50).
47
0,00
5,00
10,00
15,00
20,00
25,00
0 100 200 300 400 500 600
Δ P
Z (
mV
)
[Trt]/[AuNP]
Δ PZ
Δ PZ teo
AuNPs are characterized by a negative zeta potential, which is the superficial charge at the
hydration sphere. Increasing TrT concentration, more enzymes will be shielding the AuNP
charge and it is expected a shift of the BNC peak to more positive zeta potential values, while
the surrounding peaks disappear. Figure 39 expresses the results obtained for the BNC peak.
Figure 39– Zeta Potencial variation for TrT conjugation with AuNP. Conjugation at pH 7 followed by a change to pH 9. The red line corresponds to the theoretical adjustment of the data.
A good fit for a Langmuir like curve [∆ζ = (∆ζMax . KL . R) / (1 + KL . R)] was obtained and the
parameters KL-Constant for the ligation of the protein (0.0223) and ∆ζMax- Zeta potential
maximum variation (22.12) were extracted. R is the variable [TrT].
The above graphic shows the formation of a plateau starting close to the experimental
point [Trt]=110 nM. To achieve a more objective conclusion in pinpointing the maximum surface
coverage, two criteria can be enounced, both by admitting the existence of two distinct regions:
the first region attributed to the BNC population increase and the second attributed to a plateau
where few or none BNC is being formed. The transition between both regions is progressive
and can be interpreted as the change of the order of the reaction as new equilibriums are
created by the use of different concentration of reagents. Considering the limits, the first region
is described in the form of ∆ζ = mx (first order reaction) and the second by ∆ζ = ∆ζMax (blue
lines in Fig. 40). This kind of conceptualization can be used to avoid taking conclusions from the
intermediate curved zone. In this work, it was chosen to intersect two lines extrapolated from
the experimental points in each region (green lines in Fig. 40). From this criterion, 120 nM of TrT
is indicated to be the maximum coverage, but there is a clear need for more points to define the
lines. Nevertheless, this result is in accordance with the predicted by the Thomson´s Model and
agarose migration assay.
48
Figure 40– Zeta Potential variation for TrT conjugation with AuNP. Blue lines: ∆ζ = mx; ∆ζ = ∆ζMax. Green lines: extrapolated lines from plateau and BNC growing zone.
The conjugation time was a doubt also present in this work since in the conjugation of
AuNP with other proteins overnight was found to be insufficient. For AbT, overnight is an
adequate conjugation time (not published by the group). For TrT, the potential zeta results are
not sufficient to discredit the use of the overnight period because, the BNC peak is stable for
several days. After that the BNCs might have started to precipitate or the enzyme floculating
approaching the BNC peak behavior to the enzymatic one.(Fig. 41)
Figure 41– Zeta Potential peak shift for BNC peak as function of passing days since conjugation with 100 nM TrT was started.
Previous work in the laboratory group, indicated the ideal conjugation ratio for TrT has
100 nM/ 1 nM AuNP. The evidence collected here thought the electrophoresis and potential
zeta support it. In conclusion, this was the optimal rate found to apply TrT BNC. A greater TrT
0
5
10
15
20
25
30
35
40
45
0 5 10 15
Δ P
Z (
mV
)
Incubation days
BNC cit 1:100
Trt 100nM
49
60,00
70,00
80,00
90,00
100,00
110,00
120,00
130,00
0 20 40 60 80 100
Act
ivit
y (
%)
Phosphate buffer Conc. (mM)
AbT
BNC-cit
BNC-MUA
concentration would leave more free enzyme in solution that could be lost in the application (TrT
is expensive), mask the BNC performance or even start the formation of a second covering
layer which would block the enzyme beneath; so, for that matter, even a suboptimal ratio is
advisable.
As for AbT conjugation ratio, results yet to be published from a laboratory colleague,
suggest that the optimal coverage ratio AuNP- AbT is 9 mg : 1 mM AuNP. This results are
concordant (surprisingly due to the impurity of the AbT extract) with the theoretical estimation
described in this dissertation (8.52 mg:1 mM AuNP) so it was the ratio used to follow the work.
3.2- TYR activity as ionic strength function
While working with BNCs it is extremely important to bear in mind that they are very
sensitive to aggregation factors. Ionic strength is one of the most problematic and since it has to
be controlled, it was essential to know if it would have any effect on the enzyme activity.
Obtained results are resumed in figure 42.
Figure 42– AbT and TrT activity rates at different ionic strengths. (100%= max act)
Sigma activity assay is performed at 18 mM phosphate buffer, equivalent to 78 mM
ionic strength. In the tested range, for free enzyme, this parameter seems not to influence AbT
activity significantly. A design fault occurred with this assay: all BNC were prepared in the
respective buffers resulting in visible aggregation starting from 25 mM buffer samples. All BNC
should have been prepared at 10 mM buffer concentration and just the added a stronger buffer,
by this way avoiding aggregation effects.
50
Nevertheless, some conclusions can be stated: aggregation at the tested range does
not cause an abrupt decay of the activity; BNC (citrate capping) behave similarly to the free
enzyme and no correlation to the buffer concentration could be instated; BNC (MUA capping)
also have an activity level comparable to the free enzyme but the general slight increase
verified should not be dismissed.
This experience together with AuNP-MUA greater stability makes BNC-MUA the better
choice to explore in a remediation system. Moreover, even if the effluents being treated cause
some aggregation, it is now proved that catalysis will not be especially affected.
3.3- Chitosan preparation
Two of the three remediation systems proposed in this dissertation were dependent on
the use of a support permeable material to hold the enzyme. Chitosan and agarose are
hydrogels commonly used in laboratory, extensively studied and their low price encouraged
their use, however chitosan hydrogels/dry films preparation presented as a much more difficult
task than predicted. The main conclusions are now described.
Chitosan concentrations were tested within the 2-10 mg/mL range. The higher
concentrations of 8 and 10 mg/mL are too viscous to be pipetable: 2 mg/mL solutions took
much time to dry and generated fragile hydrogels. Intermediate concentrations of 4 and 6
mg/mL were viscous enough to generate resistant hydrogels and thick dry films. The 6 mg/mL
was preferred in this study because its drying times were shorter.
To produce a dry film (Fig. 43) by evaporation of the solvent (acetic acid) the required
time was superior to a full week even at a hotte. Besides time consuming, dry films cannot be
used to trap enzymes and difficult mass transfers in the enzyme vicinity. Due to these, dry films
approach was considered to be only viable to be applied in a remediation batch system in which
the physical limits are covered by the films or in which the undergoing treatment solution is
being circulated through those kinds of films to retain o-quinones as described in the literature.71
Rinsing with phosphate buffer stronger than 10 mM and especially with NaOH solutions
originated white crystals in the produced dry films. Realizing this implies that all rinsing in gels-
to-be-dried should be made with distilled water or phosphate buffer as strong as 10 mM. If
enzyme entrapment is possible this becomes even more important.
Drying of the beads obtained by Method II (described in Material and methods) resulted
in beads fusion to a unique paste, while the storage of them in humid state enabled one week
storage at 4 ºC and successful consecutive resuspensions. AuNP-MUA added to the liquid
agitated chitosan solution equally originated beads soft pink coloured indicating that none or
little aggregation occurred (Fig. 44). Efforts to enclose BNCs were unsuccessful because even
with only 0.5% acetic acid the solution pH was bellow to 1.
51
Chitosan-agarose composite hydrogels were unable to be produced in spite all trying to
reproduce described conditions in the literature.72 Changes to cooling conditions, in acid acetic
concentration, and rinsing agent were carried out but none of them was successful.
Chitosan beads entrapped in agarose by Method III (Fig. 45) resulted in well defined
and dispersed beads, close to the agarose matrix surface. This means that the method should
only be applied to thin matrixes.
In spite all this effort, chitosan application in phenol remediation was not possible in this
dissertation due to lack of time.
Figure 43– Chitosan (6 mg/mL) dry films. (Brown residue is a contamination)
Figure 44– AuNP-MUA 1 nM entrapped within chitosan beads (6 mg/mL in acetic acid).
Figure 45 – Chitosan (6 mg/mL) beads entrapped in an agarose matrix (0.5%).
52
3.4- Phenol detection
3.4.1- UV-Vis phenol spectra
A preliminary analyses of the remediation system was simply made by incubating the
AbT with phenol 60 ppm for 10 minutes.(Fig. 46)
Figure 46– UV-Vis spectra of 60 ppm at pH 7 (phosphate buffer 50 mM), before (dark blue) and after (light blue) incubation with AbT for 10 minutes.
The system spectra show high absorbance in the 250-300 nm region. Either way, the
phenol quantification method (intensively employed in most phenol bioremediation papers) uses
an absorbance calibration line has shown in Figure 47.
Calibration lines are a good way to evaluate samples free of contaminants and phenol
offers two wavelengths to perform it, from which 275 nm enables more sensitivity.
The application of the same calibration lines to reaction mixtures with the same phenol
concentration range as used in figure 47 did not prove to be so accurate.(Fig.48)
Figure 48– Phenol absorbance at characteristic peak wavelengths after AbT addition (10 minutes of reaction). (1 mg/L ≈ 1 ppm phenol)
Comparing figures 47 and 48 (Abs 270 overlaid in Fig. 49), data correlation has
decreased and it can be conclude that the method provides no more than a roughly estimate for
phenol concentration and tends to increase its estimation error as the reaction goes on, mainly
because tyrosinase activity generates many aromatic compounds with high absorbance near
280 nm (dopachrome to name one).
Figure 49– Calibration line for phenol standards (0minutes reaction) and the same concentrations after 10 minutes incubation with AbT.
54
y = 0,0155x + 0,1006
R² = 0,9983
0
0,2
0,4
0,6
0,8
1
1,2
1,4
1,6
0 20 40 60 80 100
Ab
s 2
70
nm
Added phenol conc. (ppm)
3.4.2- Standard addition – UV-Vis
This method was used to verify its viability when using TYR treated samples. Only a
simple test was carried out but it showed that the reaction occurred and the remaining substrate
could be measured even under 10 ppm amounts. The estimated phenol concentration present
in the aliquots used in the standard addition method, if no reaction had taken place, should be 9
ppm. However, the intersection of the linear regression (Fig. 50) with the ordinate axis
estimated the present phenol as 6.4 ppm, indicating that it was consumed by AbT.
Replicate samples should be tested in parallel using both this method and GC to cross
results and better access each method performance. Nevertheless, this is a proved solid
method for samples with complex matrixes, as long as the reaction is effectively stopped
because its takes some time to analyze. The centrifugation period is very significant considering
the reaction time period which can induce a significant error, still, centrifugation is a clean and
efficient method for reaction halting. Sigma activity tests regarding the filtrate revealed no
activity, indicating no active enzyme was being released to the filtrate.
Figure 50– Standard addition method applied for a 20 ppm phenol solution incubated with AbT 1x.
2.4.3- Gas Chromatography
Before initiate GC phenol quantification, a study to determine the optimum fiber
exposition time period to the sample was performed. A curve was obtained, where for the same
phenol concentrations, different exposition time periods were assayed (Fig. 51). (Appendix V)
55
y = 0,1208x + 0,3923
R² = 0,980
0
0,5
1
1,5
2
2,5
3
3,5
4
0 5 10 15 20 25 30
Ap
he
no
l/ A
pin
tern
Cphenol/ Cpintern
Figure 51– Phenol adsorption curve obtained after representing the exposition time vs phenol area.
The results suggest that phenol maximum absorption by the PDMS fiber reaches
equilibrium close to 40 minutes of immersion and, therefore, samples and concentration
calibration standards were all injected in the column after 40 minutes immersion of the fiber. A
calibration curve was obtained using 40 minutes of immersion (Fig. 52).
Figure 52– Calibration line for phenol concentration using hexan-1-ol as internal standard.
For a matter of availability in the laboratory, hexan-1-ol was used has internal standard
(hexan-1-ol GC peak in Appendix V). An internal standard is a compound that is inert to the
analyte, mixed with the samples before adsorption, with known concentration and that suffers all
treatments along with the sample to analyze. This way, operational errors are discarded.
56
0
20
40
60
80
100
120
140
0 50 100 150
Re
ma
inin
g p
he
no
l (p
pm
)
Time (min)
1
2
While testing real samples with dispersed enzyme in the solution (9 mg AbT:1 mmol
AuNP-MUA), the reaction has to be stopped before the exposition of the sample to the fiber
during 40 minutes for adsorption.
Two incubation experiences were made and the results are as follow. (Fig. 53) In the
first data set, the 20 minutes incubation period point has an undetermined error because the
starting, and therefore maximum, phenol concentration is 100 ppm. Few conclusions can be
made from these sets of data because replicates are needed and a wider time range should be
tested to understand the reaction rate profile. The data suggests that, after 60 minutes of
incubation, at least 50% of phenol conversion is achieved. Then again, the disparity between
sets indicates the already mentioned high variability in AbT activity.
Figure 53– Phenol remaining in two sets of experiments, after incubation of 100 ppm phenol pH 7 solutions with AbT.
3.5- Remediation systems
3.5.1- Ultracentrifugation recovery batch system
This remediation system was intended to enable the reuse of the enzyme with
reasonable activity retained for, at, least, 3 cycles long. In this dissertation we proposed and
tested a simple design but much more room for improvement remains.
The major obstacle to the viability of this system is the recuperation of the enzyme by
centrifugation. As can be observed in the Figure 54, it is notorious the accentuate decrease in
activity caused by centrifugation. Since it happened also when no incubation with phenol
existed, then the effect can be credited to the centrifugation process.
57
Figure 54– Ultracentrifugation recovery batch system activity performance.
Using 1699 G/ 4 min to test the system proved to be too much for the BNC-MUA to
withstand occurring washing-out of the AbT. This issue was addressed by trying to optimize the
rotation velocity in function of the filtered volume and retained activity (Appendix IV- Fig. 71, 72).
Preliminary results indicate that a reduced centrifugation force could lead to lower loss of
activity with additional cycles. Unfortunately, this could not be applied to this system due to lack
of time.
Another factor that casted its attention was the duration of the phase lag by the Sigma
activity protocol. As can be seen in Figure 55, initial incubation with phenol seems to have the
effect of promoting the activation of the enzyme. Lag phase time is a subjective parameter but
in this study it was calculated by intercepting a line that defines the plateau at the beginning of
the reaction with the line that can be drawn from the maximum velocity region of the reaction.
Figure 55– Lag phase time calculated for centrifuged samples at 1699 G.
58
0,3
0,4
0,5
0,6
0,7
0,8
0,9
0 2 4 6 8 10 12
Ab
s 2
80
nm
Time (min)
1cent
2cent
3cent
Then again, replicates to atone these findings are required. It can be added that the
same study should be completed by usind different centrifugation forces and the effects over
catecholase activity also tested by using, for instance, L-DOPA. In this way (confirmed the
existence of the activation effect) it could be atributed to the cresolase and/ or to the
catecholase activities.
The filtered volume from the tyrosine set of points was also tested fo the activity rate.
(Fig. 56)
Figure 56– Reaction profile of filtered BNC-MUA at 1699 G.
Comparing the filtered and non-filtered activities at the first centrifugation, the reaction
rate of the filtered was twice (202%) as the other, which implyes that most conjugated enzyme
was lost in the first centrifugation. The sum of the activities from both fration (filetered and non-
filtered) was 88% of the BNC-MUA activity recorded before a centrifugation step.
3.5.2- Immobilized petri dish batch system
Absorbance readings from the petri dish system revealed reduced activity for the
immobilized enzyme when comparing to the free enzyme form. (Fig. 57)
Despite the significant differences, it must be considered that little enzyme quantity was
employed when accounting for the 12 mL of reaction used: all reactions in this dissertation were
performed with the same amount of enzyme usually in 1mL of total reaction volume.
59
0,4
0,6
0,8
1
1,2
1,4
1,6
0 5 10 15 20 25 30
Ab
s 2
80
nm
Time (min)
Free AbT
AbT chitosan
BNC-cit-AbT
BNC-MUA-AbT
Chitosan blank
Figure 57 – Chitosan immobilized petri dish batch system reaction progress.
Visually, it was noticeable the colour change of the tyrosine solution from colourless to
red-brown, except for the chitosan blank. Even so, it can be seen some increase in Abs280nm
(Fig. 58) and that can be attributed to the already reported chitosan oxidation capacity for mono
and di-phenols. BNC-cit-AbT demonstrates an activity rate superior to BNC-MUA-AbT and AbT
immobilized but the overall conclusion is that conjugation with AuNP seems not to interfere with
the enzyme in an entrapment scenario. Testing of this system with phenol substrate in the
future should consider a previous optimization of the protocol here proposed.
Figure 58– Chitosan immobilized petri dish batch system reaction progress. (magnification)
62
4- Conclusion
At the beginning of this dissertation´s work it was recognized the ambition in it and large
quantity of work that needed to be executed. Right at the initial steps, it suffered major detours
from the initial outline, which caused a dispersion of the investigation focus and lack of
duplicates and triplicates to support the final results.
The BNC-TYR conjugates that were supposed to be an acquired knowledge needed a
critical review right at the beginning as the viability of this dissertation depended on the use of
AuNP-MUA prepared adequately. Otherwise, any advance made using faulty BNC would
translate into findings with little meaning. For this matter, this work demonstrated that AuNP-
MUA 1:5000 ultracentrifuged colloid was stable up to 100 mM ionic strength (NaCl) and able to
form active BNC with AbT. It also shed some light upon the BNC-cit-TrT coverage, which we
recommend as 100 mM per nanomolar of AuNP, supported by experimental data and also by
the proposed theoretical methodology based on the Thomson´s Model. In spite of some
guidelines being acquired, much more work need to be done to characterize the new AuNP-
MUA 1:5000 and BNC-TrT conjugates.
Another difficulty in this work was the sudden loss of activity from TrT which caused the
interruption of its study. The systems developed with AbT could be tested in TrT and so an
important goal was missed. It was verified that the reaction solutions incubated with both TYRs
tend to pH 7 and so keeping TrT at its optimal pH 9 would be a matter of the greatest
importance.
The variability activity and fairly fixed amount of total protein found in AbT lot samples
was very relevant to justify the use of mass to calculate AuNP´s enzyme coverage instead of an
amount ruled by activity. Furthermore, activity of 200 µg AbT extract provided an equivalent
activity to less than 2 uL of pure TrT. Considering that the price of 1 mL of TrT (500 activity
equivalent assays) was enough to buy close to 80 mg of AbT (only 400 activity equivalent
assays) TrT turned out to not be so expensive as seemed at first glance.
The analytical methods constituted also a concern right from the start. Much literature in
phenol remediation supports its facts solely in UV-Vis spectra as quantification method.
Knowing that many aromatic compounds are being formed and that they are unstable, these
data has to be considered unreliable and so an effort has to be done concerning phenol
quantification in complex matrixes. SPME-GC appear as alternative methods and should be
directly compared and counterproof with the classical UV-vis method. Nevertheless, by SPME-
GC, it was found that 100 ppm phenol incubated with BNC-MUA-AbT for 60 minutes, achieve,
at least, 50% substrate conversion.
63
All 3 remediation methods designs conceived were of great simplicity, cheap and
prompt to be applied in distinct situations. They could be combined with the agarose/ chitosan
hydrogels to enhance their longevity, contaminant loading, and enzyme saving. Some promising
results (despite few optimizations) were achieved and nothing seemed to invalidate them as
viable approaches to use in other remediation systems, especially incorporating sense-and-
shoot capabilities. The plug-flow syringing system has only received some design attention
because a continuous method is only worth pursuing when the remediation agent (tyrosinase in
this case) has proven stability and efficiency. Moreover, the increased difficulty to guarantee
constant conditions was an extra and undesirable complexity while the reaction elements were
still in a characterization phase.
As a more personally remark, seeing the initial ambition reduced to many, little
conclusive and disperse results is disappointing. Dealing with this is also an important part of
scientific investigation (if not the most important) and I am decided to include that as an
unwanted achieved goal.
66
5-Bibliography
1. Feynman, R., There's plenty of room at the bottom. Engineering and Science: 1958; Vol. 23, p 22-36. 2. History and Future of Nanotechnology. http://www.nanotechnologyresearchfoundation.org/nanohistory.html (accessed May 5, 2012). 3. Murray, C. B.; Kagan, C. R.; Bawendi, M. G., Synthesis and characterization of monodisperse nanocrystals and close-packed nanocrystal assemblies. Annu Rev Mater Sci 2000, 30, 545-610. 4. Richard Booker, E. B., Nanotechnology for Dummies. Wiley Publishing, Inc.: Indianapolis, 2005; p 11, 222-241. 5. Holland, S., 2005 Nanotechnologies. ISO TC 229. 6. Decker, M., Definitions of Nanotechnology – Who needs them? 2003. 7. Destinations, S. http://www.sacred-destinations.com (accessed July 20, 2012). 8. Initiative, N. N. Nanotechnology Timeline. http://nano.gov/timeline (accessed May 5, 2012). 9. Jun, Y.-W.; Lee, J.-H.; Cheon, J., Chemical design of nanoparticle probes for high-performance magnetic resonance imaging. Angew Chem Int Edit 2008, 47 (28), 5122-5135. 10. Plenty of Room for Biology At The Bottom- An Introduction to Bionanotechnology. Imperial College Press (1), 1-2. 11. Shane Scanlon, A. A., Self-assembling peptide nanotubes. Nanotoday 2008, 3 (34). 12. (a) Kinge, S.; Crego-Calama, M.; Reinhoudt, D. N., Self-Assembling Nanoparticles at Surfaces and Interfaces. Chemphyschem 2008, 9 (1), 20-42; (b) Petit, C.; Taleb, A.; Pileni, M. P., Cobalt nanosized particles organized in a 2D superlattice: Synthesis, characterization, and magnetic properties. J Phys Chem B 1999, 103 (11), 1805-1810. 13. George M. Whitesides, B. G., Self-Assembly at All Scales. Science 2002, 295 (2418). 14. Sahu, S.; Majee, S. K.; Pal, A. J., Layer-by-layer assembly of capped CdSe nanoparticles: Electrical bistability and memory phenomenon. Appl Phys Lett 2007, 91 (14). 15. Turkevich J., S. P., Hillier J., A study of the nucleation and growth process in the synthesis of colloidal gold. 1951. 16. Kurniawan, F. New Analytical Applications of Gold Nanoparticles. Regensburg, 2008. 17. Brust M, W. M., Bethell D, Schiffrin DJ, Whyman R., Synthesis of thiol-derivatised gold nanoparticles in a two-phase liquid-liquid system. J Chem Soc Chem Commun 1994, (2), 801-802. 18. Floriana Vitale, I. F., Chiara Battocchio, Emanuela Piscopiello, Leander Tapfer, Maria V Russo, Giovanni Polzonetti and Cinzia Giannini Mono- and bi-functional arenethiols as surfactants for gold nanoparticles: synthesis and characterization. Nanoscale Research Letters 2011, 6 (103). 19. Aashok K Ganguli, S. V. V., Tokeer Ahmad, Synthesis of nanocrystalline materials through reverse micelles: A versatile methodology for synthesis of complex metal oxides. Bull. Mater. Sci. 2008, 31 (3), 415-419. 20. Sun, S. H.; Murray, C. B., Synthesis of monodisperse cobalt nanocrystals and their assembly into magnetic superlattices (invited). J Appl Phys 1999, 85 (8), 4325-4330. 21. ZirChrom Separations, I. Data for Biochemical Research. (accessed January 11, 2012). 22. Kimling, J.; Maier, M.; Okenve, B.; Kotaidis, V.; Ballot, H.; Plech, A., Turkevich Method for Gold Nanoparticle Synthesis Revisited. The Journal of Physical Chemistry B 2006, 110 (32), 15700-15707. 23. Levy, R.; Thanh, N. T. K.; Doty, R. C.; Hussain, I.; Nichols, R. J.; Schiffrin, D. J.; Brust, M.; Fernig, D. G., Rational and combinatorial design of peptide capping Ligands for gold nanoparticles. J Am Chem Soc 2004, 126 (32), 10076-10084. 24. Murray, C. B.; Kagan, C. R.; Bawendi, M. G., Self-Organization of CdSE Nanocrystallites Into 3-Dimensional Quantum-Dot Superlatices. Science 1995, 270 (5240), 1335-1338. 25. Cortez, J.; Vorobieva, E.; Gralheira, D.; Osorio, I.; Soares, L.; Vale, N.; Pereira, E.; Gomes, P.; Franco, R., Bionanoconjugates of tyrosinase and peptide-derivatised gold nanoparticles for biosensing of phenolic compounds. Journal of Nanoparticle Research 2011, 13 (3), 1101-1113.
67
26. P. Baptista, G. D., D. Henriques, E. Pereira, R. Franco, Journal of Biotechnology 2005, 119 (2), 111-117. 27. Lobo, R. F. M., Nanotecnologia e Nanofísica (Conceitos de Nanociência Moderna). Escolar Editora: Lisboa, 2009; p 122-123. 28. Kumaresh S. Soppimatha, T. M. A., Anandrao R. Kulkarnia,; Rudzinski, b. W. E., Biodegradable polymeric nanoparticles as drug delivery devices. J Control Release 2001, (70), 1-20. 29. Levy, R., Shaheen, U., Cesbron, Y., Sée, V., Gold nanoparticles delivery in mammalian live cells: a critical review. Nano Reviews 2010. 30. Hedenmo, M.; Narvaez, A.; Dominguez, E.; Katakis, I., Improved mediated tyrosinase amperometric enzyme electrodes. J Electroanal Chem 1997, 425 (1-2), 1-11. 31. C. A. Mirkin, R. L. L., R. C. Mucic, J. J. Storhoff, Nat Biotechnol 1996, 382 (607). 32. (a) Jolivet, S.; Arpin, N.; Wichers, H. J.; Pellon, G., Agaricus bisporus browning: a review. Mycol Res 1998, 102, 1459-1483; (b) Selinheimo, E.; NiEidhin, D.; Steffensen, C.; Nielsen, J.; Lomascolo, A.; Halaouli, S.; Record, E.; O'Beirne, D.; Buchert, J.; Kruus, K., Comparison of the characteristics of fungal and plant tyrosinases. Journal of Biotechnology 2007, 130 (4), 471-480. 33. (a) Chang, T. S., An Updated Review of Tyrosinase Inhibitors. Int J Mol Sci 2009, 10 (6), 2440-2475; (b) Mattinen, M. L.; Lantto, R.; Selinheimo, E.; Kruus, K.; Buchert, J., Oxidation of peptides and proteins by Trichoderma reesei and Agaricus bisporus tyrosinases. Journal of Biotechnology 2008, 133 (3), 395-402. 34. (a) Lerch, K., Neurospora Tyrosinase - Structural, Spectroscopic and Catalytic Properties. Mol Cell Biochem 1983, 52 (2), 125-138; (b) Lerch, K., Amino-Acid-Sequence of Tyrosinase from Neurospora-Crassa. Experientia 1978, 34 (7), 914-914. 35. Duckwort.Hw; Coleman, J. E., Physicochemical and Kinetic Properties of Mushroom Tyrosinase. J Biol Chem 1970, 245 (7), 1613-&. 36. Hearing, V. J.; Tsukamoto, K., Enzymatic Control of Pigmentation in Mammals. Faseb J 1991, 5 (14), 2902-2909. 37. Sugumaran, H., Comparative biochemistry of eumelanogenesis and the protective roles of phenoloxidase and melanin in insects. Pigm Cell Res 2002, 15 (1), 2-9. 38. Freddi, G.; Anghileri, A.; Sampaio, S.; Buchert, J.; Monti, P.; Taddei, P., Tyrosinase-catalyzed modification of Bombyx mori silk fibroin: Grafting of chitosan under heterogeneous reaction conditions. Journal of Biotechnology 2006, 125 (2), 281-294. 39. VanGelder, C. W. G.; Flurkey, W. H.; Wichers, H. J., Sequence and structural features of plant and fungal tyrosinases. Phytochemistry 1997, 45 (7), 1309-1323. 40. Ismaya, W. T.; Rozeboom, H. J.; Weijn, A.; Mes, J. J.; Fusetti, F.; Wichers, H. J.; Dijkstra, B. W., Crystal Structure of Agaricus bisporus Mushroom Tyrosinase: Identity of the Tetramer Subunits and Interaction with Tropolone. Biochemistry-Us 2011, 50 (24), 5477-5486. 41. Decker, H.; Schwelkardt, T.; Nillius, D.; Salzbrunn, U.; Jaenicke, E.; Tuczek, F., Similar enzyme activation and catalysis in hemocyanins and tyrosinases. Gene 2007, 398 (1-2), 183-191. 42. Klabunde, T.; Eicken, C.; Sacchettini, J. C.; Krebs, B., Crystal structure of a plant catechol oxidase containing a dicopper center. Nat Struct Biol 1998, 5 (12), 1084-1090. 43. Lewis, E. A.; Tolman, W. B., Reactivity of dioxygen-copper systems. Chem Rev 2004, 104 (2), 1047-1076. 44. Selinheimo, E.; Saloheimo, M.; Ahola, E.; Westerholm-Parvinen, A.; Kalkkinen, N.; Buchert, J.; Kruus, K., Production and characterization of a secreted, C-terminally processed tyrosinase from the filamentous fungus Trichoderma reesei. Febs J 2006, 273 (18), 4322-4335. 45. TrTyr_PRDS - (Trichoderma reesei - Product Data Sheet). (supplier), V., Ed. Finland, 2012. 46. L. D. Nelson, M. M. C., Lehninger´s Principles of Biochemistry. 4ª ed.; Sarvier: 2004. 47. Sayre, L. M.; Nadkarni, D. V., Direct Conversion of Phenols to O-Quinones by Copper(I) Dioxygen - Questions Regarding the Monophenolase Activity of Tyrosinase Mimics. J Am Chem Soc 1994, 116 (7), 3157-3158. 48. Selinheimo, E.; Gasparetti, C.; Mattinen, M. L.; Steffensen, C. L.; Buchert, J.; Kruus, K., Comparison of substrate specificity of tyrosinases from Trichoderma reesei and Agaricus bisporus. Enzyme Microb Tech 2009, 44 (1), 1-10. 49. United States Environmental Protection Agency. RCRA Glossary of Terms. URL: http://nlquery.epa.gov/epasearch/epasearch?result_template=epafiles_default.xsl&action=filters
68
earch&filter=&typeofsearch=epa&querytext=bioremediation&submit=Go (acessed: September15, 2012). 50. Gianfreda, L.; Rao, M. A., Potential of extra cellular enzymes in remediation of polluted soils: a review. Enzyme Microb Tech 2004, 35 (4), 339-354. 51. Alcalde, M.; Ferrer, M.; Plou, F. J.; Ballesteros, A., Environmental biocatalysis: from remediation with enzymes to novel green processes. Trends Biotechnol 2006, 24 (6), 281-287. 52. Code of Federal Regulations Appendix A to Part 423 - 126 Priority Pollutants. United States Environmental Protection Agency: 30 de Dezembro de 2005. 53. Directive 2008/105/EC of the European Parliament and of the Council of 16 December 2008. Official Journal of the European Union 2008, 348 (84), 12-13. 54. (a) Karam, J., Nicell, J.A., Potential application of enzymes in waste treatment. J. Chem. Technol 1997, 69, 141-153; (b) Lourenco, E. L. B.; Ferreira, A.; Pinto, E.; Yonamine, M.; Farsky, S. H. P., On-fiber derivatization of SPME extracts of phenol, hydroquinone and catechol with GC-MS detection. Chromatographia 2006, 63 (3-4), 175-179. 55. An Vermeulen, K. W., Joeri Vercammen, Evaluation of a dedicated gas chromatography–mass spectrometry method for the analysis of phenols in water. J Chromatogr A 2004, (1071), 41-46. 56. Nicell, J. A., Bewtra, J.K., Biswas, N., Taylor, K.E., Enzyme catalyzed polymerization and precipitation of aromatic compounds from aqueous solution. Can. J. Civil Eng 1993, 20 (5), 725-735. 57. Ikehata, K.; Nicell, J. A., Characterization of tyrosinase for the treatment of aqueous phenols. Bioresource Technol 2000, 74 (3), 191-199. 58. (a) Devipriya, S. P.; Yesodharan, S., Photocatalytic degradation of phenol in water using TiO2 and ZnO. J Environ Biol 2010, 31 (3), 247-249; (b) Akbal, F.; Onar, A. N., Photocatalytic degradation of phenol. Environ Monit Assess 2003, 83 (3), 295-302. 59. Li, Y. F.; Liu, Z. M.; Liu, Y. L.; Yang, Y. H.; Shen, G. L.; Yu, R. Q., A mediator-free phenol biosensor based on immobilizing tyrosinase to ZnO nanoparticles. Anal Biochem 2006, 349 (1), 33-40. 60. Kim, G. Y.; Shim, J.; Kang, M. S.; Moon, S. H., Preparation of a highly sensitive enzyme electrode using gold nanoparticles for measurement of pesticides at the ppt level. J Environ Monitor 2008, 10 (5), 632-637. 61. Barlow, S.; Kavlock, R. J.; Moore, J. A.; Schantz, S. L.; Sheehan, D. M.; Shuey, D. L.; Lary, J. M., Teratology society public affairs committee position paper: Developmental toxicity of endocrine disruptors to humans. Teratology 1999, 60 (6), 365-375. 62. Sanz, V. C.; Mena, M. L.; Gonzalez-Cortes, A.; Yanez-Sedeno, P.; Pingarron, J. M., Development of a tyrosinase biosensor based on gold nanoparticles-modified glassy carbon electrodes - Application to the measurement of a bioelectrochemical polyphenols index in wines. Anal Chim Acta 2005, 528 (1), 1-8. 63. Borgmann, S., Advances in Electrochemical Science and Engineering: Bioelectrochemistry. Chapter 1- Amperometric Biosensors 2011. 64. (a) IUPAC, Compendium of Chemical Terminology, 2nd ed. (the "Gold Book").Compiled by A. D. McNaught and A. Wilkinson. Blackwell Scientific Publications, Oxford: 1997. XML on-line corrected version: http://goldbook.iupac.org (2006-) created by M. Nic, J. Jirat, B. Kosata; updates compiled by A. Jenkins; (b) Namiesnik, J., Trace analysis - Challenges and problems. Critical Reviews in Analytical Chemistry 2002, 32 (4), 271-300. 65. (a) EPA Method 604, Phenols, Part VIII, 40 CFR Part 136. Environmental Protection Agency: Washington, DC, 1984; p 58; (b) EPA Method 625, Base/Neutrals and Acids, Part VIII, 40 CFR Part 136. Environmental Protection Agency: Washington, DC, 1984; p 153; (c) EPA Method 8041, Phenols by Gas Chromatography: Capillary Column Technique. Environmental Protection Agency: Washington, DC, 1995; Vol. 26, p 1. 66. (a) Registry, A. f. T. S. a. D., Toxicological Profile for Cresols- Chapter 7. 2008; (b) Vermeulen, A.; Welvaert, K.; Vercammen, J., Evaluation of a dedicated gas chromatography-mass spectrometry method for the analysis of phenols in water. J Chromatogr A 2005, 1071 (1-2), 41-46. 67. Kovacs, A.; Mortl, M.; Kende, A., Development and optimization of a method for the analysis of phenols and chlorophenols from aqueous samples by gas chromatography-mass spectrometry, after solid-phase extraction and trimethylsilylation. Microchem J 2011, 99 (1), 125-131.
69
68. Chen, Y. L., Preparation and Characterization of Water-Soluble Chitosan Gel for Skin Hydration. 69. Augusto, A. L. P. V. F., Microextração por Fase Sólida. Química Nova 2000, 23 (4), 523-530. 70. Nomenclature Committee of the International Union of Biochemistry (NC-IUB) - Units of Enzyme -Activity - Recommendations 1978. Eur J Biochem 1979, 97 (2), 319-320. 71. Payne, G. F.; Sun, W. Q., Tyrosinase Reaction and Subsequent Chitosan Adsorption for Selective Removal of a Contaminant From a Fermentation Recycle Stream. Appl Environ Microb 1994, 60 (2), 397-401. 72. Cao, Z.; Gilbert, R. J.; He, W., Simple Agarose-Chitosan Gel Composite System for Enhanced Neuronal Growth in Three Dimensions. Biomacromolecules 2009, 10 (10), 2954-2959.
72
6-Appendixes
1.10- Appendix I- Protein quantification and activity
mol/(min.molTrT) =2693 nkatal (-10.1% than the provided 2996 nktal)
80
1.10- Appendix IV- Ultrafiltration
Figure 71– Distilled water filtrated volume as G force centrifugation function, using a Amicon Ultra-4 centrifugal unit 100 kDa cut-off(Millipore).
Figure 72– Percentage of activity retained by BNC-AbT after a single centrifugation [Amicon Ultra-4 centrifugal unit 100 kDa cut-off (Millipore)] at different velocities. Sigma activity protocol used to test the activity. 100% activity= BNC-AbT before centrifugation.
81
1.10- Appendix V- GC Chromatograms
Figure 73– Pure phenol chromatogram, retention time: 21.58 minutes.