REPORT BY THE FOUNDATION FOR WATER RESEARCH WASTEWATER RESEARCH & INDUSTRY SUPPORT FORUM ON URBAN RAINFALL & RUN-OFF A WORKSHOP HELD 30 TH APRIL 2004 AT GRIMSTOCK COUNTRY HOUSE, COLESHILL, NR BIRMINGHAM SPONSORED BY FWR AND WAPUG Foundation for Water Research, Allen House, The Listons, Liston Road, Marlow, Bucks. SL7 1FD, UK
Transcript
REPORT BY THE FOUNDATION FOR WATER RESEARCH WASTEWATER RESEARCH & INDUSTRY SUPPORT FORUM
ON
URBAN RAINFALL & RUN-OFF
A WORKSHOP HELD 30TH APRIL 2004
AT GRIMSTOCK COUNTRY HOUSE, COLESHILL, NR BIRMINGHAM
SPONSORED BY FWR AND WAPUG
Foundation for Water Research, Allen House, The Listons, Liston Road, Marlow, Bucks. SL7 1FD, UK
FWR (Foundation for Water Research) is an independent charity dedicated to education and information exchange. Its subjects are the science, engineering and management of water resources, water supply, wastewater disposal and the water environment in general. FWR brings together and disseminates knowledge and makes this available widely. WaPUG (Wastewater Planning Users Group) is a not-for-profit organisation established over fifteen years ago to promote best practice in the wastewater industry. Its terms of reference are to:
Provide a forum for discussion between users Facilitate the exchange of information between relevant organisations Identify areas for improvement or modifications to and associated research and development of
wastewater planning modules Identify education and training needs and encourage the necessary education and training.
First published August 2004 Any enquiries related to this report should be addressed to:- Foundation for Water Research Wastewater Research & Industry Support Forum Technical Secretary, Dr. T. D. Evans, Allen House, The Listons, Liston Road, Marlow, Bucks. SL7 1FD, UK Tel: +44 (0)1628 891 589 Fax: +44 (0)1628 472 711 Email: [email protected]
Page 4 of 43
Page 5 of 43
1 Executive summary The subject of urban rainfall and flooding has worried the industry for many years; perhaps it is perennial. The Romans in Pompeii engineered a solution by having raised curbs on the roads they designated as flood routes. The subject has been around a long time and there is little doubt it is going to get more difficult because of climate change. Partly there is an education and communication issue to explain the many contributory aspects and the difficulties of understanding them. The UK Government, which can be considered the elected representative of the customers, delivered the Ministerial Guidance for AMP4 in March 2004; this said the Government attaches a high priority to reducing the distress and disruption caused by sewer flooding and welcomes the proposals to increase the rate of tackling problems1. The Guidance also said that policies are needed for integrated planning of the whole drainage system. The House of Lords has removed the threat of extreme financial liability to the water companies for sewer flooding that lower courts had imposed. Had this decision not been made it would have had a massive effect on sewer work and investment and consequently on water bills. The National Audit Office acknowledged that work to alleviate known sewer flooding problems has accelerated since 2000. The number of properties reported to Ofwat as being at risk of sewer flooding has reduced to just over 11,000 however further work is expensive - the companies forecast that it would cost a further £1.1 billion to deal with the most severe known internal flooding problems, and a further £0.5 billion to tackle severe external flooding2. NAO said Ofwat should encourage companies to have a robust economic approach to assessing the balance between cost and benefits to help them to prioritise between known problems. NAO also said that although Ofwat has concluded that there is no evidence of deterioration in sewer networks since the early 1990s, there are risks that any problems could go undetected for some time before they affect performance to customers. Developments such as climate change, new housing development and European Union legislation [especially the Water Framework Directive which will make flooding less tolerable] will all place new demands on sewer networks and could increase the risk of sewer flooding incidents in future. The NAO said water companies, the industry's regulators and the government should work together to clarify responsibilities, and to produce more robust assessments of the long-term requirements of sewer networks and how these will be met. Despite all of this work the annual number of incidents of internal flooding of properties has been rather constant between 1996 and 2003 at 20-30 per 100,000 properties. The predictions for climate change are that the most likely consequence for the UK will be an increased frequency of extreme weather events. Managing surface water is likely to get even more challenging. If this were possible to remove the risk from the 30 that get flooded, are the 99,970 properties per 100,000 that don’t willing to pay; should this be by a linear development of current practice, or do we need a less expensive paradigm? Whatever engineering solution we adopt to manage flooding, we need to understand rainfall. The workshop concluded that the variation in temporal and spatial distribution of rainfall is much greater than the models can deal with at present. Meteorological rainfall radar has quantified this variation and examples were presented where the rainfall return period for a single event varied from 1 to 100 years over a distance of only about 5 km. The 100-year rain can cause flooding further down the catchment where the event was only 1-year rainfall. The flooding outcome can be very different depending whether the event moves in the direction of the drainage network or in the contrary direction. Some catchments (e.g. Manchester) are fortunate that the local topography gives protection from events that would follow the direction of drainage. Radar can give 1 km spatial resolution and instantaneous values of precipitation 1 The House of Commons’ Public Accounts Committee endorsed this in its report, published 16th July 2004 “Out of sight—not out of mind: Ofwat and the public sewer network in England and Wales” Thirtieth Report of Session 2003–04 2 The Association of British Insurers in a report supporting the need for this investment in the sewerage system says “Climate change will put further strain on the system. Average annual damages from sewer flooding could increase from £270m to £2bn - £15bn, unless we start to take action today.” (ABI, 2004)
Page 6 of 43
intensity at 5 minute intervals or less if required over the parts of the UK covered by the radar stations (Figure 11). However there are still significant areas of the country that are not covered by radar at 1km resolution. The workshop also agreed that although the models are widely used and the sewer designs that they have produced have been successful, at least as judged by the lack of customer complaints following implementation, their limitations and assumptions are often overlooked by (or unknown to) the people using them. Even the most established models are founded on quite limited data sets. Often a model will not hold good for summer conditions and for winter conditions and it has been found that different parameters need to be set for each to get a model that fits, i.e. a ‘summer’ and a ‘winter’ model. Run-off from slow-response surfaces (i.e. where the flow in the sewer system shows a response to rainfall hours or days after the rainfall has stopped) is the most difficult to model. Outcomes are also different if the drainage system has not had time to empty when a second event impacts the catchment or if there are high tides or river levels that have prevented emptying. This adds to the complexity of testing designs. It would be nice to have long time-series of rainfall and flooding data to assess and refine models. The complexity will probably necessitate work on pattern recognition software to simplify the data so that it can be used in run-off and drainage models. Inevitably and by definition a model is a simplification of the true system and its behaviour but it should represent the important aspects, and that means deciding what they are. The work being done to monitor and model SUDS is very welcome. SUDS could be an important alternative to putting additional water down combined sewers but we need to understand their longevity, maintenance requirements and design criteria better than we do at present. Similarly we need to evaluate the potential offered by rainwater harvesting at critical locations to modulate discharge to surface water management as well as the benefit rainwater harvesting can bring to water resources and enable housing development such as in the water-starved Thames Gateway.
5.1 Urban Rainfall and Run-off – A View from the Industry................................................ 10 5.1.1 Discussion ............................................................................................................. 13
5.2 What data on rainfall does the Industry need? ............................................................. 13 5.3 What rainfall data are/can be provided?....................................................................... 18 Delegate presentations on rainfall ........................................................................................... 22
5.3.1 What does the water industry need?..................................................................... 22 5.3.2 Rainfall profiles ...................................................................................................... 23 5.3.3 What the water industry needs .............................................................................. 23 5.3.4 Principles for consideration ................................................................................... 24
6.1 Run-off modelling – what does the Industry Need?...................................................... 25 6.2 Run-off modelling – what can be provided? ................................................................. 27 6.3 Delegate presentations on run-off modelling................................................................ 33
6.3.1 Run-off Modelling of Small (Un-)Natural Catchments – a case study................... 33 6.3.2 Run-off:- Problems with current practice - What does the water industry need?.. 35 6.3.3 Graham Squibbs.................................................................................................... 35
6.4 Discussion..................................................................................................................... 35 7 Summary and Conclusions .................................................................................................. 36
7.1 Research needs for Rainfall ......................................................................................... 36 7.2 Research needs for Run-off Modelling ......................................................................... 36 7.3 Final summing up and Close ........................................................................................ 37
8 References........................................................................................................................... 38 Appendix 1. Abbreviations and acronyms..................................................................... 39 Appendix 2. Recommendations Out Of Sight - Not Out Of Mind: Ofwat And The Public Sewer Network In England And Wales (NAO, 2004) ....................................................... 40 Appendix 3. List of invited delegates ............................................................................ 42 Appendix 4. Workshop programme .............................................................................. 43
Page 8 of 43
2 Conclusions The workshop debated the many factors that affect the success and reliability of run-off models. It is welcomed that there has been recognition that the recent Asset Management Planning process did not permit sufficient investment in our underground ‘out of sight’ assets and their maintenance, including day-to-day proactive operational work and the indication that this will be allowed to be corrected in the next period. Society has increasing expectations of the level of service that drainage should deliver; at the same time the impacts of climate change are most likely to make this more challenging because ‘extreme’ rainfall events are likely to occur more frequently. The Thames Barrier has operated 88 times since it was commissioned in 1983; nearly half of these have been since 2000, which looks like evidence of change3. In order that society gets the most cost effective solution to managing run-off and drainage there should be investment in models that are able to cope with the temporal and spatial variation of rainfall that has been measured using the modern technology of high resolution precipitation radar. Investment is also needed for the calibration and field-validation of these models. It is essential that users are aware of the limitations and assumptions of the models and that the models warn when they are being used beyond the limits of their assumptions. Objective assessment is required of ‘novel’ alternatives such as attenuating the discharge of rainfall and run-off to the drainage network by holding it outside the network, such as rainwater harvesting, porous road base and SUDS because these might be more cost-effective than just building bigger capacity underground. The longevity and maintenance requirements of these alternatives need to be assessed.
3 Sir John Harman ‘Flood risk management and consequences for the city of London’ speech to the Honourable Companies of Water Conservators and Insurers, 3rd June 2004.
Page 9 of 43
3 Recommendations • The business case for extending the coverage of precipitation radar to the population
centres that are not currently covered needs to be made and if it is proved the investment should be made.
• The drainage operators should be financed to purchase and use the high spatial and temporal resolution data that radar produces.
• The uncertainty and limitation of the existing data (including the physical assets) and the influence of climate change should be analysed.
• Design storms should be reviewed using large catchments and building in the spatial and temporal variation of rainfall and the likely influence of climate change.
• The way that long-term rainfall data are used and could be used / analysed should be reviewed.
• A ‘unified theory’ of urban run-off is needed that will explain observed performance for both winter and summer and for both heavy and light storms. It should include topography and the entry conditions to the network.
• Education is needed in the limitations and assumptions in models and training in the use of models. Perhaps this is a case for independent accreditation of training, e.g. by CIWEM, as is being considered for operators of processes.
• The prediction of infiltration, slow-response run-off, peak-flow, volume of flow, entry conditions and overland flow all need to be improved by analysing a sufficiency of long-term data.
• We need more long-term flow-monitoring – at present there are few sites that have 6-months’ data. In order to do this we need robust measuring devices that are able to withstand extreme events (which have been the cause of failure of most surveys).
• With the extreme complexity of data we shall need pattern recognition software that can make the data useable.
Much has been delivered already for reducing the risk of flooding, as has been acknowledged by Ofwat, the NAO, etc. and it seems almost inevitable that in order to do a lot better (i.e. further reduce the risk in a time of inherently increasing difficulty because of climate change) will require a paradigm shift / step-change in approach.
Page 10 of 43
4 Chairman’s Introduction Andy Eadon, Divisional Director - Planning & Network Services, Haswell Consulting Engineers The subject of this workshop (urban rainfall and run-off) has worried the industry for my entire career. The WaPUG Committee wants to identify research that is appropriate, achievable in a reasonable time and compatible with the industry’s procedures. If results cannot fit within established procedures they are very difficult to implement. The task of this workshop is to examine current practices and the necessity for change - what is the problem, what can be done about it now and what is needed by the water industry if we were able to do it?
5 Rainfall and Run-off 5.1 Urban Rainfall and Run-off – A View from the Industry Paul Brettell, Investment Planning Manager, Severn Trent Water The government could be considered to be the elected representative of the customers: the Ministerial Guidance for AMP4 delivered in March 2004 said the following in the context of sewer flooding:
• “The Government attaches a high priority to reducing the distress and disruption……..” • “The proposals to increase the rate of tackling problems are welcome…” • “Policies are needed for integrated planning of the whole drainage system”
The ‘Marcic case’ has been settled in the industry’s favour (House of Lords, 2003) had it been otherwise the consequent investment in flood prevention would have been very expensive; the cost being borne by all customers. The press release that accompanied the launch of the National Audit Office reported (2004) said ‘water and sewerage companies have taken action to remove the risk of sewer flooding from 3,300 properties in England and Wales since 2000. Ofwat has played an important role in achieving this reduction. However, Ofwat and companies face a number of challenges in reducing the risk of sewer flooding further, and in planning for the long term future of sewer networks. ‘Every year since 1994, there have been between 5,000 and 7,000 incidents of sewer flooding in properties. These can occur when sewers become overloaded due to heavy rainfall, sometimes exacerbated by extra demands placed on some sewers by new housing developments, or by sewer blockages and to a lesser extent sewer collapses. Companies are only required by law to pay an average of £125 in compensation to affected customers for each incident, and these payments do not vary with the damage suffered, although obtaining insurance cover against all types of flooding incidents is the householder's responsibility. ‘Work by companies to alleviate known sewer flooding problems has accelerated since 2000. The number of properties reported to Ofwat as being at risk of sewer flooding has reduced to just over 11,000 during this period, and Ofwat has made provision for such work when setting price limits. Such work is expensive - the companies forecast that it would cost a further £1.1 billion to deal with the most severe known internal flooding problems, and a further £0.5 billion to tackle severe external flooding. Ofwat should encourage companies to have a robust economic approach to assessing the balance between cost and benefits to help them to prioritise between known problems.
Page 11 of 43
‘Although Ofwat has concluded that there is no evidence of deterioration in sewer networks since the early 1990s, there are risks that any problems could go undetected for some time before they affect performance to customers. Developments such as climate change, new housing development and European Union legislation will place new demands on sewer networks and could increase the risk of sewer flooding incidents in future. Water companies, the industry's regulators and the government should work together to clarify responsibilities, and to produce more robust assessments of the long-term requirements of sewer networks and how these will be met.’ Sir John Bourn, head of the National Audit Office, said: "While incidents of sewer flooding in properties are relatively rare, few could deny that it is highly distressing. This must be especially so for those who suffer repeat incidents. And the harm to the environment should not be dismissed. That is why I have made these recommendations to encourage the work that is already being done to reduce the risks of sewer flooding." The NAO concluded there needs to be better legislation, better data, more studies and improvement in ‘best practice’. Figure 1 shows fewer than half of flooding incidents are attributed to overloaded sewers, however the difference in ranking of the companies between this and Figure 2 suggest that there might be differences in the quality of data between companies.
Figure 1 Properties /100k flooded from sewers 2002-03
0.0
10.0
20.0
30.0
40.0
50.0
60.0
Anglia
n
Thames
Dwr Cym
ru
Southe
rn
Severn
Trent
South
Wes
t
Indus
try
Wes
sex
Nothum
brian
Yorksh
ire
United
Utili
ties
Prop
ertie
s flo
oded
per
100
,000
OverloadedSewers
OtherCauses
0.000%
0.020%
0.040%
0.060%
0.080%
0.100%
0.120%
Yorksh
ire
Nothum
brian
Dwr Cym
ru
Southe
rn
Severn
Trent
South
Wes
t
United
Utili
ties
Anglia
n
Indus
try
Wes
sex
Thames
Prop
ertie
s at
Ris
k of
Inte
rnal
Flo
odin
g Once in TenYears
Twice inTen Years
Figure 2 Properties on the ‘at risk of flooding from sewers’ register (as at March 2003)
Page 12 of 43
Figure 4 shows the percentage of properties reported at risk of flooding (1 year in 10 plus 2 in 10) has been reduced from 138 per 100,000 in 1996-97 to 50 per 100,000 in 2002-03. This looks like good news until it is compared with the trend in reported actual incidents of internal flooding (Figure 3) which shows remarkable resistance to change. Every year from 1996-7 to 2002-3 there have been 20 to 30 properties per 100,000 that have suffered internal flooding, despite the prediction that the number at risk of such flooding has been reduced by ⅔. Is this a data issue or does it show that the models used to predict risk are incapable of dealing with the reality of today’s climate? As far as the occupants of the 20 to 30 properties per 100,000 that experience internal flooding it is real and very distressing.
Predictions for the effect of climate change are that the most probable consequence for the UK will be increased frequency of intense weather events. The frequency of intense rainfall events is likely to increase. Add to this the creep in non-permeable surface and it is obvious that surface water volumes per event are going to increase. Most of the business plans submitted to Ofwat for PR04 include extra expenditure to reduce the incidence of sewer flooding. Figure 5 shows the projected effect of these plans on water bills (not just sewer work). In reality all of the customers will be paying to reduce the risk of flooding, not just those whose properties are at risk. There is a strong case for innovation and alternative methods to reduce the risk of flooding rather than the linear application of conventional practice. Some issues related to modelling need to be resolved. We need to understand flooding return periods better, perhaps it would be better to stop using deign storms because it never rains like a design storm. Would it be better to design using NAPI values? We also need to account for
0.0
5.0
10.0
15.0
20.0
25.0
30.0
35.0
1996
-97
1997
-98
1998
-99
1999
-00
2000
-01
2001
-02
2002
-03
Prop
ertie
s flo
oded
per
100
,000
Figure 3 Internal flooding incidents (overloaded and other causes)
Figure 4 Changes in % of properties on the ‘at risk of flooding’ register (1996-2003)
0.000%
0.020%
0.040%
0.060%
0.080%
0.100%
0.120%
0.140%
0.160%
1996
-97
1997
-98
1998
-99
1999
-00
2000
-01
2001
-02
2002
-03
Prop
ertie
s at
Ris
k of
Inte
rnal
Flo
odin
g
0.000%
0.020%
0.040%
0.060%
0.080%
0.100%
0.120%
0.140%
0.160%
1996
-97
1997
-98
1998
-99
1999
-00
2000
-01
2001
-02
2002
-03
Prop
ertie
s at
Ris
k of
Inte
rnal
Flo
odin
g
Page 13 of 43
the interaction with watercourses better and to account for the spatial variability of rainfall and the run-off from permeable surface. If we consider the example of a sewer that floods 7 times in 100 years, that is a 7% probability or 1 in 14 years, but if a threshold for a significant event were set at 50 m3 and that was only exceeded on 3 occasions the probability reduces to 3% or 1 in 33 years. However we seldom have 100 years of detailed rainfall data; is there a surrogate?
5.1.1 Discussion We are not really looking at the 100 year risk but the risk in each year. If the design risk is changed from 1 in 15 years return period to 1 in 25 years the effect is huge but it is difficult to quantify. People who have been flooded aren’t really interested in design periods. A problem with changing the return period would be that some properties would come back onto the ‘at risk’ register, so for internal consistency we have to keep a consistent basis. The ABI’s reported aspiration for 1 in 100 years’ protection was considered by the participants at the workshop unattainable. It was reported that DEFRA wants to establish a coordinating body; in some other countries there is master planning to ensure that the activities of the various agencies that impact upon flooding risk are coordinated. This was a key recommendation of the September 2002 FWR-WaPUG workshop (FWR, 2002). The Water Framework Directive is likely to have an effect on the amount of flooding that will be tolerable. 5.2 What data on rainfall does the Industry need? Nick Martin, Thames Water The water industry needs rainfall data for water resources, sewerage and sewage treatment. The requirements are different but they are equally demanding. Our customers are pretty predictable in how they use water so base wastewater flows can be managed fairly easily. But rainfall induced flows are not nearly so easily dealt with because of the unpredictability of what we get. At Thames Water we use a range of data sources for different purposes and I think we have a pretty broad view of what is needed. There are several ways that I can look at the rainfall data needs: one is by time
• What has happened? System review (failure appraisal, post project appraisal call it what you like) and hence model evaluation and solution development and design.
• What is happening? For operations – direct measurement for operational control • What will happen? Useful for planning and design in the long term and for operations in the
immediate future
0
5
10
15
20
25
30
35
%
2005/ 6 2006/ 7 2007/ 8 2008/ 9 2009/ 10
Change in billsCumulative
Figure 5 Draft business plans (PR04) - Average changes in bills
Page 14 of 43
Another way of looking at rainfall data needs is by function – starting with operations the simple questions are:
• When will it rain? • How hard will it rain? • How long will it rain? • How hard is it raining now?
Or collectively stated: How will it affect the performance of the system? If we had the answer to these questions, potentially we could optimise our networks through the use of a real time control system, but models of the network would need good calibration. At present the possibility of proactively managing networks is not considered a high priority. Even if we were to know how hard it is going to rain it is unlikely that we would be able to operate sewerage differently and thus avoid flooding4. The first three above are weather forecasting issues, which are pretty difficult problems and I think a bit ambitious at this time. It would be good to have an immediate measurement of rainfall. This would have benefits, in calibrating our forecasts, and also as a cross reference to system alarms. High level alarms without rainfall would be different from alarms with rain and may be responded to differently. Even if we had the forecasting, the current state of our networks and planning is such that we couldn’t really get any value out of the information. As an aside, a few years ago we tried to set up a research study that looked at some flooding incidents with a view to identifying how we could have reduced the cost of the flooding had we known that the rainfall was going to happen. In practice the question was too difficult and we never really got an answer. At present the requirement can be left as a marker for the longer-term future. Rainfall data are needed to analyse what has happened by reviewing existing performance and known problems. Once we have a good understanding of the problems we can move to the future and the solution stages by applying sewerage models. To get good models we need real data to validate our models and to understand what has happened. The task is to convert the rainfall to flow rate in the sewer, usually through a hydrologic model. Without getting rainfall right there is no chance with the hydrology. Detailed data are needed both in terms of spatial and temporal resolution: 5 ha subdivisions of catchments and 2 minute intervals have been found to useful; it is also necessary to know the antecedent conditions for the previous 2 months. Figure 6 shows the general layout of a model, it has 3 types of land/receiving surface each with different infiltration/attenuation characteristics; the infiltration capacity of each is in turn related to the antecedent conditions.
4 But reliable knowledge of where, when and how much rainfall was going to happen would be invaluable if we were to move to an integrated approach where particular roads were designated and engineered as flood routes to carry excess surface water rather than admitting it to the underground system because it would be necessary to prepare to close roads to traffic and to prevent car parking and other obstructions.
Figure 6 General layout of a model
Page 15 of 43
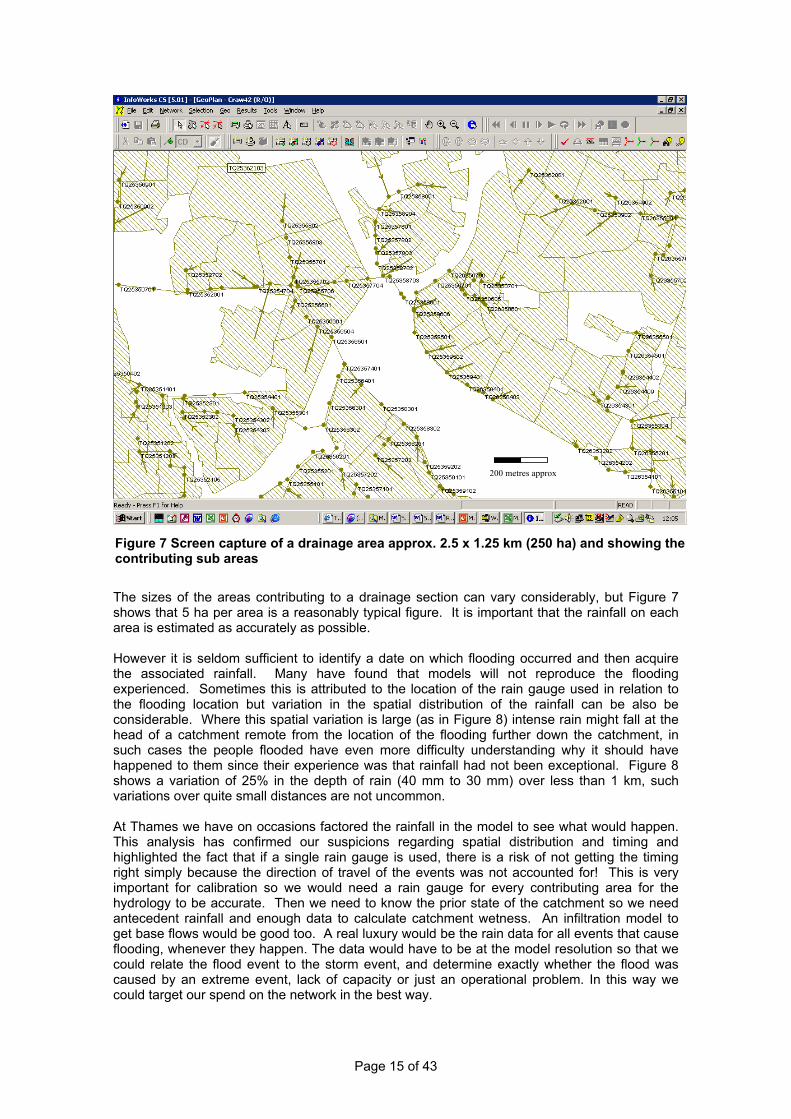
The sizes of the areas contributing to a drainage section can vary considerably, but Figure 7 shows that 5 ha per area is a reasonably typical figure. It is important that the rainfall on each area is estimated as accurately as possible. However it is seldom sufficient to identify a date on which flooding occurred and then acquire the associated rainfall. Many have found that models will not reproduce the flooding experienced. Sometimes this is attributed to the location of the rain gauge used in relation to the flooding location but variation in the spatial distribution of the rainfall can be also be considerable. Where this spatial variation is large (as in Figure 8) intense rain might fall at the head of a catchment remote from the location of the flooding further down the catchment, in such cases the people flooded have even more difficulty understanding why it should have happened to them since their experience was that rainfall had not been exceptional. Figure 8 shows a variation of 25% in the depth of rain (40 mm to 30 mm) over less than 1 km, such variations over quite small distances are not uncommon. At Thames we have on occasions factored the rainfall in the model to see what would happen. This analysis has confirmed our suspicions regarding spatial distribution and timing and highlighted the fact that if a single rain gauge is used, there is a risk of not getting the timing right simply because the direction of travel of the events was not accounted for! This is very important for calibration so we would need a rain gauge for every contributing area for the hydrology to be accurate. Then we need to know the prior state of the catchment so we need antecedent rainfall and enough data to calculate catchment wetness. An infiltration model to get base flows would be good too. A real luxury would be the rain data for all events that cause flooding, whenever they happen. The data would have to be at the model resolution so that we could relate the flood event to the storm event, and determine exactly whether the flood was caused by an extreme event, lack of capacity or just an operational problem. In this way we could target our spend on the network in the best way.
200 metres approx
Figure 7 Screen capture of a drainage area approx. 2.5 x 1.25 km (250 ha) and showing the contributing sub areas
Page 16 of 43
In summary: a modeller and planner needs a long record of rainfall recorded: • on a grid compatible with the sewerage model contributing areas (5 ha per record) • with intensities at 2 [or 5] minute intervals
Planners set the constraints to which engineers design. There will be a strategic objective for the level of risk to be controlled [level of protection to be provided]; this is usually related to the return period of an event. The engineer will then need to turn that risk into some design facts. In order to do this we need to understand what could happen and what is the likelihood is of this happening. Historically we have obtained good results from the work done by the FSR, extended in the FEH, and using past records to predict the future. These have provided us with the tools to convert return periods into rainfall depths. But as designs have become more complex so we need to know more about what we are dealing with, and there is the added complexity of the value of past trends in a time of climate change. The type of events that we design for are based upon rain gauge data, which have been disaggregated to get various durations and depths all of which should have equal probability at a site. The engineer then has to check that the design can cope with each different type of rainfall. The difference between 18 mm falling in ½ hour and 30 mm in 4 hours can lead to very different solutions. Even when a rainfall event has been defined (with the fallibility and limitations discussed) there is additional complication: the design might have to cope with events that are not strictly related to the current rainfall. Two examples illustrate the point.
1. When designing storage tanks we need to know the likelihood of the tank being partially full [not completely empty] when a storm arrives.
2. Some outfalls are restricted by river level. Many rivers run at a high level for days not hours. If discharge is restricted because of high water levels due to a previous rainfall event you will have to store or pump,
what are the odds of a 1:10 year short event occurring during, immediately after, or as part of a long event? To resolve this we use time series real rainfall to get a view of the past, but is this a realistic projection for the future? Spatial distribution is another problem. It can rain heavily in one part of the catchment but not in another. Our return periods are based on rain at a point. Figure 9 shows that the variation in return period for the event over Bracknell on 7th August 2002 based on the point calculation ranged from 1 year to 100 years. So designing to a return risk can be difficult.
Figure 8 Depth of rainfall 7th August 2002 illustrating large spatial variation - intense rainfall at one location can result in flooding down-catchment where there has been less rainfall.
Note: one square = 1 km2 = 100 ha
Page 17 of 43
Figure 9 Rainfall Gauge Locations in the Ascot Area with the Storm Return Period calculated for the 7th August 2002 event.
At the moment we design by assuming there will be the same depth of rain over the whole catchment. The areal reductions suggested in the rainfall analysis can reduce depths by 25% on a large urban catchment. By doing this are we being optimistic? Probably not, but really we need to know what the spatial distribution is likely to be, or perhaps what risk there is in having intense rain cells in the middle of a major event. For example, the risk of getting a ½ hour 1:15 event in the middle of a 6 or 12 hour 1:10 event. Bracknell and Wokingham often seem to get excessive rainfall. Is this bad luck, an artefact that arises because the Met Office was based there and was able to monitor it, or something about the geography/topography of the location that causes it5? The west of Scotland has a different climate from East Anglia but are there significant differences at much shorter range that we should design for locally? South London went under water on Wednesday 28th April. I used to live in Penge where the flooding was worst. It seemed the worst black clouds often hovered around Crystal Palace Hill6. Can we take this into account in our design? It appears that rain related data are more complex than we currently allow for and this complexity is hugely important if we are going to design drainage so as to have even greater confidence in its capability. Research is needed to analyse real data to understand the risks to return period depth calculation due to:
• local topography, • associated rainfall events, • spatial distribution.
With the results of such research we can verify network models and move on to the business of optimised design of sewers to meet site-specific risk levels. 5 Murray Dale confirmed that there is a roughly triangular area in the FEH rainfall maps around Bracknell, Berkshire that shows higher intensity, hourly and sub-hourly rainfall than in the FSR maps. 6 Murray Dale confirmed that Met Office data show that areas of higher elevation in London area such as Crystal Palace Hill do get more rain than the surroundings.
Page 18 of 43
Design using a long time series of spatially distributed rainfall would be very useful but it would: 1. be very time consuming. 2. have to assume that future distribution will be the same as historic
however the data are not available so a synthetic/design approach is needed first. In summary, rainfall needs are:
• reliable long records of data • records at an appropriate time interval • data spatially distributed at a resolution to suit the model type
we need to be sure that the synthetic/design rainfall is consistent with the protection we wish to design for, taking into account spatial distribution, antecedent conditions, etc. 5.3 What rainfall data are/can be provided? Murray Dale, Met Office The Met Office has gridded daily rain-gauge data with a spatial resolution of 5 km for the UK for the period 1958 to 2001 recorded by between approximately 4000 and 7000 gauges. 73 of those gauges have archived sub-hourly data at 5-minute intervals with calculated UCWI and API30 values for every event in the Met Office tool, Deluge7. As can be seen in Figure 11 there are twelve weather radars in the UK. They give rainfall data with a 1 km resolution within a 50 km radius of the station and 2 km resolution in the 50-100 km radius band. This can be regarded as equivalent to having approximately 7800 rain gauges within the 50km radius area. The three additional stations that have been proposed would cover significant areas that currently have lower resolution coverage, but they require planning permission and investment. The reason for the change of resolution is that the radar beam is of necessity divergent and by 50 km from the station it is 1 km wide. Data are available within 2 minutes of a scan. Each radar executes a scan pattern which is repeated at 5 minute intervals. The data therefore represent ‘snap-shots’ at 5 minute intervals which can be integrated to provide accumulations over time periods. The radar signals received from snow are very similar to those from rainfall (for the same equivalent rainfall rate). Hail does represent a problem for the current generation of radars because it generates a radar return which is much higher than from the equivalent rainfall rate. Tipping Bucket Rain-gauges (TBR) measure rainfall accumulation at a point.
7 http://www.metoffice.com/water/deluge/
0 10 20 30 40 50 60 70 80 90 100 mm
Figure 10 Illustration of the misleading impression that a rain gauge (here located at Beaufort Park) can give of rainfall intensity for locations close to the gauge (compared with 1km radar data)
Page 19 of 43
Sophisticated urban drainage models now exist; they cover large catchments. Currently “design storms” assume homogeneous rainfall, with a recognition of different profiles for ‘summer’ and ‘winter’ but this is also unrealistic. As a result local sewers might be under-designed and trunk sewers might be over-designed. Given the availability of rainfall data that has better spatial and temporal resolution than was possible in the past, one could consider a concept of a ‘Radar-based design storm’. The objective would be to derive a spatially heterogeneous storm event for large catchment sewer models. It would require analysing large numbers of radar images containing 1km resolution data, recognising ‘patterns’ within radar images for separate regions and from this derive a tool that attaches a rarity value (return period) to a synthetic event. This could be considered as three steps:
1. Trawl the archive to obtain rainfall accumulations for specific durations (e.g. 1, 3, 6, 12 and 24 hours) that are region-specific – and also record all current [contemporary] events
2. Determine a methodology for pattern recognition analysis and conversion to synthetic design storms of required return periods (5 year & 30 year?)
3. Undertake the analysis and creation of the tool
Figure 11 Weather radar coverage - main maps show coverage in 2004; the smaller insets show the proposed/possible coverage in 2005 if investment were made.
Page 20 of 43
Woodford 5-minute rainfall data on 31/12/03, aggregated to 15-minute totals
Shawbury 5-minute rainfall data on 28/8/03, aggregated to 15-minute totals
0.00
0.20
0.40
0.60
0.80
1.00
1.20
07:30
08:00
08:30
09:00
09:30
10:00
10:30
11:00
11:30
12:00
12:30
13:00
13:30
14:00
14:30
15:00
15:30
16:00
16:30
17:00
17:30
18:00
Rai
nfal
l (m
m)
Raingauge
Clee Hill radar
Rainfall total:Radar: 12.1mmRaingauge: 12.6mm
Dunkeswell 5-minute rainfall data on 1/12/03, aggregated to 15-minute totals
0.00
0.20
0.40
0.60
0.80
1.00
1.20
1.40
1.60
1.80
09:00
:00
09:15
:00
09:30
:00
09:45
:00
10:00
:00
10:15
:00
10:30
:00
10:45
:00
11:00
:00
11:15
:00
11:30
:00
11:45
:00
12:00
:00
12:15
:00
12:30
:00
12:45
:00
13:00
:00
13:15
:00
13:30
:00
13:45
:00
14:00
:00
14:15
:00
14:30
:00
14:45
:00
15:00
:00
15:15
:00
15:30
:00
15:45
:00
16:00
:00
16:15
:00
16:30
:00
16:45
:00
17:00
:00
Rai
nfal
l (m
m)
raingaugeCobbacombe radar
Rainfall totals:Radar: 23.6mmRaingauge: 15.8mm
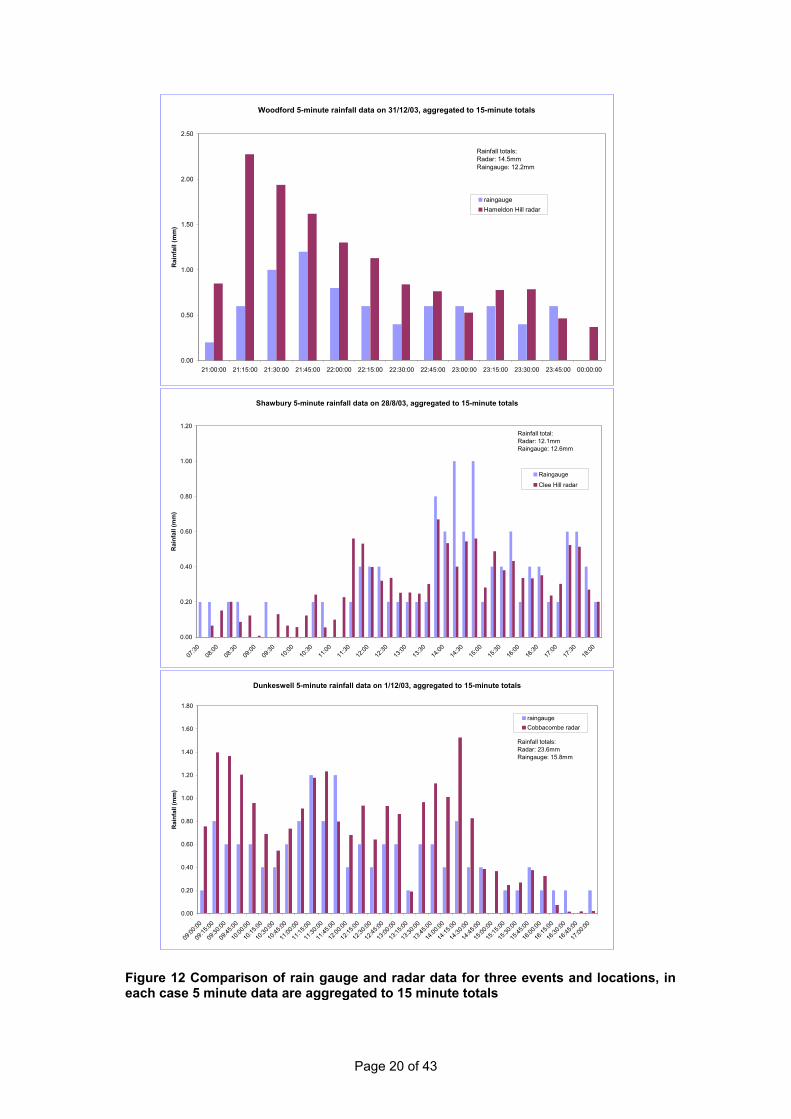
Figure 12 Comparison of rain gauge and radar data for three events and locations, in each case 5 minute data are aggregated to 15 minute totals
Page 21 of 43
Figure 12 shows the similarity/disparity of radar and rainfall data. The top graph compares Woodford 5-minute rainfall gauge data on 31/12/03 with the radar data from Hambledon Hill station: the former totalled 12.2 mm and the latter 14.5 mm rain. The middle graph compares Shawbury 5-minute rainfall gauge data on 28/8/03 with Clee Hill radar; the agreement is remarkable: the gauge recorded 12.1 mm and the radar 12.6 mm. The two estimates in the bottom graph are more divergent, Dunkeswell gauge recorded 15.8 mm on 1/12/03 but Cobbacombe radar recorded 23.6 mm. The extra rain recorded by radar could be as a result of hail, which is more reflective than rain, but more likely it was real and the gauge failed to capture all of the rain. The most likely cause of the disparity between rain-gauge and radar estimates of rain is due to the ability of radar to measure rainfall over the whole 1km2 and the gauge measuring a miniscule part of this area as a point measurement. Collaboration with HR Wallingford, Exeter University and Imperial College, London is anticipated for converting the radar-based design storms into forms that are useable by the industry. The existing procedures use average profiles and areal reduction factors for each catchment and compare the result with FSR. The technological capability exists to provide data that are more detailed in spatial and temporal resolution. This will enable development of models that are better able to simulate the effects of real rainfall events. However it throws up the need for a new ways of processing the data including the possibility of pattern recognition (Figure 13), a ‘radar-based design storm’ and development of procedures to be able to process the data.8
8 Discussions between HR Wallingford and Met Office since the workshop have indicated that the formulation of a long (100 years plus) time series of synthetic spatial rainfall data, developed from radar archive data, is likely to be necessary in order to meet industry requirements. This procedure is being discussed with academic institutions and is likely to be integrated in the forthcoming spatial rainfall business case (see section 7.1 Research needs for rainfall). (Addendum, Murray Dale, 3/8/04)
Figure 13 An example of the use of pattern recognition to simplify the event shown in Figure 10
0 10 20 30 40 50 60 70 80 90 100 mm
Area of 70mm and above
Area of 40 mm and above
Figure 14 Radar rainfall images from Chenies radar station for 08/02/200 at 5, 2 and 1km resolution
Page 22 of 43
Delegate presentations on rainfall 5.3.1 What does the water industry need?
David Terry – Senior Modeller, Severn Trent Water The water industry needs:
• to know what limitations there are when using modelling equations • to know or be warned when modelling equations would be working beyond their limitations. • research papers and guidance to expand the current equations’ limitations in line with the
water industry needs • to know what limitations there are when using modelling software and when and where the
software uses ‘black-box’ equations • to know where all the default values are placed in the software (there are 50 in InfoWorks)
and whether the default values bear any relationship to reality or best practice (some are compatible with best practice and others are not)
• to know or be warned by the software when it is using values or equations beyond the limit of research or current best practice knowledge
• to understand how to apply spatially varied design storm events on large catchments • more permanent intensity gauging stations (or radar stations) throughout the country • to understand how to make better use of the rainfall Radar data than we do at present
Procedure:- Select a rain cloud, by: 1) individual recorded event; 2) historical time series; 3) an individual design storm or set of design storm events of T-year return frequency; 4) combination of historical and/or design storms which have a one in xx% probability of occurring in the xx year operating period of a drainage system. Having selected the storm(s) the appropriate equations (determined by research) together with the software will generate the following storm properties:-
• Size of storm. • Total rain storm area and cell size area (the cell size could be user definable or from
rainfall research or it maybe limited by computer power/speed). • Shape of rain storm. One research paper has shown that rainfall cell sizes should be
elliptical. • Areal reduction factors for the individual cells. • Rainfall potential in that cloud.
Could the current research be aligned with this need? What is the current research? Some examples:-
• Satellite imagery to estimate/predict probable ground-level precipitation and location. Rainfall = fn (cloud area, cloud type (altitude)). This needs calibration over time with rainfall gauges.
• RADAR – Gathers reflected energy and stores processed information as a reflectivity factor (Z). Rainfall intensity (R) is related to Z in the form Z=a.Rb where a and b are constants based on empirical studies. (Marshall and Palmer, 1948).
• Mean areal rainfall estimation from the three main cloud types from which precipitation is most frequently associated: cumulonimbus, large cumulus and nimbostratus. (Follansbee, 1975).
• Geostatistical Analysis – A statistical procedure for analysing spatial structure of random variables and performing interpolation and areal estimation. (Felgate and Read, 1975), (Marshall, 1975), (Shaw, 1983)
1010101010
1030303010
1030403010
1030303010
1010101010
1010101010
1030303010
1030403010
1030303010
1010101010
5 km5
km
Potential rainfall intensity
Page 23 of 43
• Correlation Analysis – Determines the direction of movement, the speed and the mean size of rainfall cells.
Analysis was carried out by the Met Office on a network of 16 gauges at 1km spacing in Cardington from 1957 to early 1960’s and consisted of total amounts of rainfall at 2 minute intervals.
Having selected the rain storms the next steps are to:-
1. select the drainage catchment; 2. select the starting position of the rain storm; 3. select the path of the storm across the catchment; (the worst case scenario would be if
the path followed the paths of the existing drainage) 4. select the speed of the storm (maybe to match the time of concentration of a particular
part of the drainage system for worst case scenario) 5. Items 2 to 4 may already be determined if they are real events.
Antecedent conditions are set on the catchment. The ground regions need to be determined in the model from one of the following:-
• Rain gauge regions (crude) • Rain grid regions (generated by the software, user definable) – this is not current practice • Sub-catchment regions (current practice) • Individually defined surfaces (maybe for the future?)
The movement of the rain cloud including the non-rainfall periods is simulated in the computer model. The amount and location of rain falling on the catchment is determined by the individual cloud cells giving up rain to the ground regions below. Note: rainfall is probably affected by altitude, temperature, wind speed and dust particles but research is needed to put detail on these generalisations. 5.3.2 Rainfall profiles
Martin Osborne – Earth Tech Engineering Events that deliver the same total depth of rainfall but over different periods of time could all be classified as similar but they can have very different effects on drainage. 5.3.3 What the water industry needs
Graham Squibbs - United Utilities, Modelling Manager, Asset Creation
Page 24 of 43
It would be beneficial to use radar data to examine and analyse individual events in order to improve on model verification on extreme events. The issue with spatial variation in design is an issue for large catchments. Design events have worked reasonably well; we have not got many schemes wrong. For Manchester a storm travelling east to west would be very bad because that would be following the drainage network (i.e. adding rainfall to drainage already carry load from further up the catchment) however the Pennines generally prevent this so the reality for Manchester is that this element of spatial variation is not a problem. I represent Water UK on the Inter-Agency Committee on the Hydrological Use of Weather Radar. This has representatives amongst others from Defra, EA, Water UK, SEPA, Met Office and research organisations. The aim of the committee is to support the use of weather radar in the member organisations and assist in developing areas for research. It does not however have its own reserach budget. 5.3.4 Principles for consideration
Andy Eadon We need to identify the high level drivers. Changing, upgrading and extending drainage works is expensive so we don’t want to have to do it too often; it is important that designs have a long life. Customer telephones could be considered a form of post-project appraisal, if they don’t ring the scheme must be working [but are phone calls analysed in this way?] 5.4 Discussion – The rainfall issues
Reporters: Graham Squibbs and Vicki Harty • Design storms versus long time-series • Climate change • 100 year return-period • Return period of flooding versus return period of rainfall • Changes in procedure versus costs • Analysis of events • Links between rainfall for urban and river – how? • Continuous simulation • Assessment of uncertainty/confidence [of predictions] • Spatial and temporal needs – 2 min or 5 min? 1 km? calibration/verification of radar with
ground data • Can we make better use of the existing data from rain gauges and radar?
Page 25 of 43
6 Run-off modelling 6.1 Run-off modelling – what does the Industry Need?
Martin Osborne, Earth Tech The basic rules should be:
• Keep it simple • Readily available parameters – soil parameters, meteorological data • Easy to extract catchment data • Robust equations
o Handling a range of land uses o Appropriate from verification to design storms – different size storms
• Simple upgrade protocol for old and existing models • True run-off return periods o High return period storms – dry catchment o Low return period storms – wet catchment
Models should be scaleable – the results should be independent of
• Timestep (1 min to 1 day) • Division of catchments into sub-catchments (0.05 to 50 ha) • Division of events into sub-events (1 hour to 10 years)
The sources and types of run-off are:
• Rapid response o Paved run-off o Roof run-off o Urban pervious run-off
• Slow response o Rural pervious run-off o Direct infiltration o Groundwater infiltration o Stream inflow & infiltration
The components of run-off are:
• Initial loss • Run-off volume / loss • Attenuation & delay • (Entry limits & ponding) • (Infiltration)
Existing best practice
• Initial loss – slope or absolute • Impervious run-off – fixed + NR equation • Urban pervious – NR equation • Slow response o NR equation - large attenuation o Soil infiltration
Testing existing best practice against the rules
Page 26 of 43
• Initial loss - Not fully scaleable with sub-events because antecedent rainfall depth is poorly defined
• Impervious run-off - Variable run-off component discussed under urban pervious run-off - No issues
• Urban pervious run-off: o Soil class is readily available but should we change to HOST? HOST is used in FEH; it
defines soil in 26 classes whereas current models use just 5 soil classes. o Probably OK for robustness with storm size o Upgrade protocol has been defined o Not sure about true run-off return periods - design values of API - seasonal variation o Not fully scaleable with sub-events because of evaporation?
• Evaporation o A minor issue between calculating NAPI values and running continuously o An example - Summer conditions E = 3 mm / day - Event of 10 mm in 1 hour - Calculating NAPI the evaporation = 3 mm - Running continuously, evaporation is 3/24 + initial loss9 of 2 mm = 2.125 – the factor is
trivial - Paved and roof the problem is worse as lower initial loss so only 0.625
• Slow response o Slow response using the NR equation: - Same as urban pervious run-off plus - Concerns over robustness with storm size but we don’t know the real answer - Not sure about true run-off return periods
⋅ design values of API ⋅ seasonal variation - Care needed with run-off speed for flat gradients – absolute lag time model is better o Slow response using the soil infiltration model in InfoWorks: - Not simple - Not scaleable with sub-events – poor definition of initial conditions - Not sure about true run-off return periods
⋅ Design values for initial conditions - Probably robust with storm size - Does not use readily available soil parameters o Rural pervious run-off (NR equation) - Does not give the same answers as FSR / FEH - Concerns over robustness with storm size - Not sure about true run-off return periods
⋅ design values of API ⋅ seasonal variation - Care needed with run-off speed for flat gradients – absolute lag time model is better o Direct infiltration (infiltration model) - Not simple
9 This is an issue of InfoWorks – the simulation developed by HR Wallingford was OK, but it was implemented incorrectly
Page 27 of 43
- Not scaleable with sub-events – poor definition of initial conditions - Not sure about true run-off return periods
⋅ Design values for initial conditions - Probably robust with storm size - Does not use readily available soil parameters o (Groundwater infiltration) o Stream inflow & infiltration - Concerns over robustness with storm size - Not sure about true run-off return periods
⋅ design values of API ⋅ seasonal variation - Care needed with run-off speed for flat gradients – absolute lag time model is better - Still need fundamental information on capacity
• Modelling of inlet limitations o Allow inlet limitations and treat excess as flood water o Need good advice on use and standard parameters
• Summary of key issues o Should we use HOST? o API rather than NAPI is more scaleable o Design APIs / seasonal variation – especially if we change the definition o Concerns over robustness of NR with storm size especially for slow response o Infiltration model – design conditions? o Inlet limitations – and guidance
6.2 Run-off modelling – what can be provided?
John Packman – CEH, Wallingford Dreams: Easy to fit Remote sensed data, GIS/DEM driven Catchment boundaries flow paths, SUDS Easy parameters Surface lag~Roughness Soil properties Certain rainfall Design storms Antecedent conditions Continuous simulation
THE WASSP RUNOFF MODELRunoff Volume
Initial Loss DEPSTOG ≈ 0.5mm (dependent on surface slope)
WASSP ~ overall PR put to paved:pervious as (70+x%):(x%/3)WALLRUS finds PR separately for each subcatchment.
Runoff Rate
Non-linear reservoir k (q20.67- q1
0.67 ) = I – (q2+ q1) ∆T / 2where q = runoff rate, I = rain in time ∆T
and k = 0.51 SLOPE-0.23PAPG0.23 (28 gauges, ~300 events)
Page 28 of 43
Perhaps people who debate the merits of the New Run-off model do not realize that it was developed on data from only 11 sites and that the number of rainfall events at these sites ranged from 5 to 43 (Table 1) it was by no means comprehensive and there really is a need for more data to improve the model and sites for which there is at least a year of flow and rainfall data. There is no point having very complex models unless they are founded on adequate data.
‘NEW’ RUNOFF MODELRunoff Volume
Initial loss DEPSTOG (paved=0.5mm, pervious=2mm)evaporation = sine wave on regional data (0-3mm/day)
where IF = effective imperviousness (poor=.45,fair=.6,good=.75)PF = maximum soil moisture depth (set to 200mm)NAPI = API from rain net of DEPSTOG (paved≈.5,perv=2mm)NAPI0= kt/24 NAPI-1 + kt/48 NP-1
(k = .1, .5, .7, .9 for SOIL = 1, 2, 3, 4)NP = Rain less DEPSTOG in previous timestep
NAPI decay rate gives faster soil moisture decay in light soils Model not tested over full annual climate conditions
Runoff Rate
2 quasi-linear reservoirs k (q2- q1 ) = I – (q2+ q1) ∆T / 2where k = C i*
EVENTS' and Nov-Apr are those with 20mm/h for 5 minutes
Table 1 Date used to develop New Run-off model
Page 29 of 43
Modelling Philosophy A model has to be a simplification of the true behaviour of the system being modelled but it should represent the important aspects (which are? …). The important parameters should be validated by observations but in reality you can’t reliably optimise more than a few floating parameters, so a model should be ‘parameter efficient/parsimonious’. When a model has many parameters for which you choose values, you can get the result you want. It is necessary to have enough detail to model the possible interventions. Are separate parameters needed at each node? How do they vary in space and time? Do we want empirical process models, or simplified geometry? Run-off Mechanisms Figure 16 shows a conceptualised description of three types of run-off from permeable surfaces as used for rural areas. If the intensity of the incident rainfall exceeds the infiltration capacity, the excess will run off; if there has been so much rain that the permeable medium (we are normally thinking of soil) is saturated, the medium becomes effectively impermeable until drainage restores capacity; water can move down the hydraulic gradient within the medium and emerge further down the slope/catchment. In urban areas the run-off varies between and within events. Are we dealing with pervious area run-off or an increased contributing paved area? How does the pervious area contribution get into urban drains? Does the run-off enter via gullies, culverts or infiltration?
Figure 15 Wallingford Urban Run-off Model
Infiltration excess(rare in UK)
Saturation excess(contributing area)
Subsurface runoff
Infiltration excess(rare in UK)
Saturation excess(contributing area)
Subsurface runoff
Figure 16 Rural run-off mechanisms and soil properties (SOIL/HOST)
Page 30 of 43
Figure 17 shows the SPR model developed by John Boorman of CEH and John Hollis of National Soil Resources Institute (NSRI) for HOST. Note: a ‘gley’ layer in soil refers to the grey colour that is seen in waterlogged soil [temporary or permanent] that results from reduction of brown oxidised ferric iron (insoluble) to soluble reduced ferrous iron and indicates exclusion of oxygen from that zone of the soil by water.
Routing Mechanisms The ‘Kinematic wave’ model over planes and in gutters was assessed in Wallingford Method research
It is solved over finite space step or grid (2D kinematic model), but it was considered too slow, parameter optimisation was fraught, the simplified geometry undermines the physical status. As a result a non-linear reservoir model has been preferred. It uses 1-space-step kinematic equivalent, lumped geometry, planes and gutters not separately modelled but it is having difficulty in modelling flood routes. Is there renewed interest in the Kinematic wave model? AUDACIOUS – will produce a ‘Brand New’ Run-off Model (BNR ?) that will deal with conventional drainage and SUDS as follows: Conventional drainage
Adaptable drainage and SUDS Source control - infiltration and storage – retrofit and disconnect Buffer the impacts of climate change, but less predictable response
Figure 17 Standard Percentage Run-off (SPR) from BFIHOST (Base Flow Index) from HOST classification
∂A/∂t + ∂q/∂x = 0 & q=cs0.5yn (Chezy/Manning)
where A=cross section area(m2), t =time(s), q=flow(m3/s),x =distance(m), s =water slope, y=depth(m)
Soil Moisture Changes between Storms Between storms soil moisture changes as follows: within the rooting depth evaporation is at the potential rate (Penman, etc.) below the rooting depth the influence of evaporation decreases linearly with depth. When soil is above “Field Capacity” drainage is proportional to the difference between the moisture content and FC. FC is the residual moisture content of a soil that was saturated and then allowed to drain by gravity for 24 hours. 1. If soil moisture decay (drainage and evaporation) is proportional to relative moisture content (M/S), then dM/dt = i - kM/S (1) where: i is infiltration rate (= rainfall rate) and k is decay rate factor. Integrating for constant i over the timestep t (with I = it) gives M1 = M0 e-kt/S + I (1 - e-kt/S) S/(kt) (2) For infiltration a fixed % of rainfall, this is an ‘API’ equation with decay rate e-kt/S dependent on the drainage properties of the soil. 2. If infiltration:rainfall rate proportional to soil moisture deficit (1-M/S): dM/dt = r(1-M/S) - kM/S = r - (r + k)M/S (3) M1 = M0 e-(R+k)/S + I (1 - e-(R+kt)/S)S/((R+kt)) (4)
where: R=rt BUT drainage only happens if deficit < field capacity and evaporation rate is constant until deficit > rooting depth
Soil - capacity range
Mean capacity (MC)Field capacity (FC)Root depth (RD)c
Figure 18 Lumped Rainfall - Soil Moisture - Run-off Model
Page 32 of 43
CEH has EPSRC funding (WAND & AUDACIOUS) to monitor and model selected Sustainable Urban Drainage Systems (SUDS) structures to assess their long term performance, effects on and of groundwater and effects of climate change. Are SUDS the panacea for flood run-off control on new urban developments as the EA appears to believe or are they failed old fashioned methods? We need to assess how widescale use of SUDS will affect overall catchment response, whether and how to improve design and whether they can give long term protection from flood and pollution. The study has a number of potential monitoring sites that will be used to conduct as-built soakaway tests and infiltration tests; they have been selected to cover a range of soil types as well as types of SUDS:
Figure 19 Comparison of run-off models for catchment 390370 in year 2000.
The PDM model for BNR appears to give the best fit.
CWI API
Linear Run-off soil moisture ESFM– optimised riparian area
PDM for BNR
Page 33 of 43
Hanwell Fields, Banbury
concrete ring soakaways, some linked by infiltration trenches, draining residential development. Also garastores and conventional drains.
Cowley, Oxford permeable pavement train - residential development
NE Carterton MDA, Oxon swales and infiltration trenches - draining highway
Henry Box, Witney ACO curb drains - draining highway; swales - draining amenity area
CEH Wallingford soakaways - draining road, parking and roof areas
Bicester swale, ponds
Milton Trading Estate chain of ponds
Wheatley, Aylesbury, Didcot, Henley, EA Wallingford …???
soakaways, permeable pavements
In order to improve the run-off models we need further work on long runs of data to improve design storms and treatment of antecedent conditions. The EA has about 1800 recording rain gauges with more than 10 years of data (Figure 20). The data from these could be used for a continuous simulation and Monte Carlo studies to define the design conditions better than they are at present.
6.3 Delegate presentations on run-off modelling 6.3.1 Run-off Modelling of Small (Un-)Natural Catchments – a case study
W J Burton - Consultant This is a case study of a problem public surface water sewer (SWS) system, which I shall call Winson Green to protect the parties involved. It has two difficult sub-catchments connected to it. “A” is comprises 50 ha of farmland, scrubland and former part-industrial site connected in at the head of the system. “B” is a close-cropped school playing field area connected in part down the system. Extreme event flooding has internally flooded 34 properties further downstream, but
Figure 20 Distribution of EA recording rain gauges (red = >20 years’ data; green = >10 years’ data
Page 34 of 43
for some reason only one, at the very downstream extent of the system, is on the OFWAT register. Consultant 1 looked at the problem holistically, and used FSR, FEH, HW-SCS, MAFF-ADAS Note 34510, and other Rational Methods to determine the likely A/B inputs – the paved areas were the easy bit. Confidence in the modelling was based on reasonable verification against the extreme event flooding. The sustainable solution proposed (Figure 21) was to store surface water on part of the playing field area to deal with all the property flooding, and relieve the downstream public SWS.
Consultant 2 looked at the problem more focussed on the public SWS, and appeared to only consider the one property on the OFWAT register. Consultant 2 produced a model, verified on a short-term flow survey, that confirmed the one property flooding well and confirmed the other 33 to some degree, but the other flooding was regarded as being related to “land drainage” inadequacies. I do not know how the “difficult” sub-catchments A/B were modelled. I feel sure that their inputs were not properly verified in relation to extreme events. The proposed solution turned out to be an underground storage tank integral with the SWS and located downstream on the system near the property on the register it protects. The other 33 properties remain essentially unprotected from flooding and await their fate related to the “land drainage inadequacies”. The consultants worked independently and did not talk to each other; their results were very different. Consultant 1 scheme cost was circa £50k. Consultant 2 scheme cost was circa £1.4 million. Research is required and reliable methods need to be developed for run-off modelling of small natural/un-natural catchments such as the farmland/scrubland/ex-part-industrial area and the close-cropped playing field area here. The research and the methods need extending to include
10 MAFF 1983 The design of field drainage pipe systems. MAFF/ADAS Reference book 345 HMSO
AB
Figure 21 Consultant 1's proposal to manage Winson Green's flooding
Page 35 of 43
for extreme event rainfall response. The methods need to be simple, not requiring extensive data collection and verification and err on the generous side if necessary. This is all so that engineers and hydrologists who do not naturally take the wider holistic view of a flooding problem may be better guided in relation to these catchments. There is also an issue that some [young] modellers appear not to understand the software they are using and its limitations. 6.3.2 Run-off:- Problems with current practice - What does the water industry need?
David Terry – Senior Modeller, Severn Trent Water I want a ‘model for all seasons’ – a hydraulic and water quality model that accurately represents rainfall, run-off and routing through river and water collection systems for all flow conditions and for both present day and future scenarios under hundred year continuous simulation conditions. The equations we have cannot represent the run-off under all circumstances! Drainage catchments in which slow response run-off is observed are the most problematic. It is not uncommon to have two models which represent the seasonal variations for both ‘winter’ and ‘summer’ flow conditions. The problem is that it is very difficult to make the variable run-off equations we have match the observed slow response data and then run-off sensibly under higher return period storm events. We need greater understanding of that part of the Earth’s Water Cycle that relates to the wastewater industry. Understanding and implementing surface wetting and drying processes on different types of surfaces. We also need to be able to apply the variable run-off equations to all surfaces and testing and research on how the variable run-off equations react under low and high frequency rainfall and the drying processes, including finding its limitations. We need the ability to cap the run-off under extreme run-off conditions when either the equations react beyond the known limitations or when we know the maximum inflow values from the drainage system components (e.g. gutters/downpipes/gullies). We need the ability to route the capped flow to another drainage catchment (e.g. overland flow routing). 6.3.3 Graham Squibbs We did a large amount of modelling in AMP3 using the NEW UK Run-off model11. Some of the solutions were larger than anticipated due to the volumes of permeable run-off, and we have concerns over the extrapolation of verification into the use of the New UK Run off model in extreme design storm events. In some instances it was not possible to converge to a solution with increase in rainfall event duration. For this reason, UU has been looking at re-verification using fixed run-off from permeable areas with some success. In some instances we have had to develop two models, one for summer and one for winter due to the inability of the current run-off models to match both the summer and winter permeable responses. We added additional impermeable area in the winter model to account for saturated soil conditions and to replicate the increased tail. There are a number of locations were winter responses are greater than summer. Should we have 2 season verification? 6.4 Discussion
Reporters: Richard Long and Richard Kellagher The HOST map is digital and it is expensive. We did a calibration exercise to cross-correlate
HOST and SOIL PR equations NAPI or API? Soil Moisture or Brand New PI?
NR seems to work for big events but the same model won’t work for small events. Future release of the software should have a facility for water that does not get into the gullies and the routing of that water.
11 This runoff model was first released in 1991
Page 36 of 43
7 Summary and Conclusions 7.1 Research needs for Rainfall
Graham Squibbs and Vicki Harty • Build a business case for spatial rainfall data (radar has been used since 1990 for
verification) (Murray Dale and Richard Kellagher)
• Analysis of uncertainty (including Perimeta12); the limitations that should be put on the use
of the existing data; influence of climate change (Pennine Water Group, FaberMaunsell)
• Review of design storms using: Large catchments and building in spatial variation; Climate
change: on going changes, profiles; Return period rainfall and return period flooding. Review of how long term rainfall data are used / analysed (link with FEH)
(John Packman and Martin Osborne) 7.2 Research needs for Run-off Modelling
Richard Long and Richard Kellagher We need a ‘unified theory’ of urban run-off that will explain observed performance for both winter and summer and for both light and heavy storms. It should include topography and entry conditions. It should be rational and there should be education in its limitations and assumptions and training in its use. We need to analyse sufficient long-term, good-quality data to improve prediction of infiltration, slow response run-off, peak flow, volume of flow, entry conditions and overland flow taking account of topography. PR was based on 17 catchments. First we need to identify what flow monitoring data we have: we probably have data from about 2,500 sites but they will be for less than 6-months each and generally they do not cover extreme events. People say that surveys that are hit by extreme events generally fail, perhaps we should find out the reason for this. We need to understand what runs off and from where. The research would be to analyse and make sense of the existing data and to develop the tools by which to do this.
• Accuracy of equations and default values • 2 season verification • Convergence of rural/urban and routing rates. • Converging HOST and SOIL - digitising SOIL map • API / NAPI design • Brand New Run-off Model – need proof of model (SMD) • Design for New PR – pervious area • Inlet limitation [for gullies, etc.] • Topography – [flood] routing and run-off • Water Quality wash-off model • Provision of (large event) rainfall / run-off data (models) • SUDS (hydrological processes)
12 Also known as the “Italian flag” and formerly known as CMAM see www.fwr.org/wastewat/risk&fnc.pdf
Page 37 of 43
7.3 Final summing up and Close Andy Eadon and Peter Myerscough
It is perhaps disappointing that the workshop could not identify some immediate or short term fixes for the problems with rainfall and run-off which have been discussed but this confirms the difficulty for research and development in this area and the heavy dependency on capturing long term reliable data. It appears that the case for capturing these data has consistently failed to attract ownership and funding, and consequently we are still dependent upon the source data and procedures which were first applied some thirty years ago. The many factors that affect the success/reliability of run-off models have been discussed and a wish-list has been produced, we now need a sensitivity analysis to rank them. The outputs must be cost-beneficial and flexible. Many at-risk properties have been taken off the register and sewer improvement schemes have been successful but expectations of the system have increased and at the same time the rainfall it has to cope with is becoming more peaky. Perhaps we are going to have to change the paradigm and find new ways of dealing with extreme surface water volumes instead of trying to get them directly into combined sewers. It appears that improvements to the modelling, design and management of sewers will require significant advances and investment in many areas but the fundamental need for developments in rainfall and run-off knowledge must not continue to be overlooked by the Industry.
Page 38 of 43
8 References ABI (2004) The Case for Increased Investment in Sewer Infrastructure. Association of British Insurers; July 2004. http://www.abi.org.uk/Display/File/Child/228/sewerinvestment.pdf The House of Commons’ Public Accounts Committee (2004) “Out of sight—not out of mind: Ofwat and the public sewer network in England and Wales” Thirtieth Report of Session 2003–04 published 16th July 2004 http://www.publications.parliament.uk/pa/cm200304/cmselect/cmpubacc/463/46303.htm House Of Lords (2003) Opinions Of The Lords Of Appeal For Judgment In The Cause Marcic (Respondent) v. Thames Water Utilities Limited (Appellants) http://www.parliament.the-stationery-office.co.uk/pa/ld200304/ldjudgmt/jd031204/marcic-1.htm National Audit Office (2004) Out of Sight - Not Out of Mind: Ofwat and the Public Sewer Network in England and Wales http://www.nao.org.uk/pn/03-04/0304161.htm Follansbee, W. A., 1973: Estimation of average daily rainfall from satellite cloud photographs. NOAA Tech. Memo. NESS 44, 39 pp. [Available from NOAA/NESDIS Office of Research and Applications, 5200 Auth Rd., Camp Springs, MD, 20746–4304.] Felgate, D.G. and Read, D.G., 1975. Correlation analysis of the cellular structure of storms observed by raingauges. J. Hydrol. 24, 191-200. Follansbee, W. A., and V. J. Oliver, 1975: A comparison of infrared imagery and video pictures in the estimation of daily rainfall from satellite data. NOAA Tech. Memo. NESS 62, 14 pp. FWR (2002) Urban Flood Route Prediction - Can We Do It? Report of a workshop held 26th September 2002 at Renewal Conference Centre, Solihull Marshall R.J., 1975. A stochastic model to simulate moving storms. Proceedings of the National Symposium on Precipitation Analysis and Hydrological Modelling, Davis, California. Marshall, J. and W. Palmer (1948) The distribution of raindrops with size. Journal of Meteorology 5, 165-166. Shaw, S.R., 1983. An investigation of the cellular structure of storms using correlation techniques, J. Hydrol. 62, 63-79.
Page 39 of 43
Appendix 1. Abbreviations and acronyms13 ABI Association of British Insurers API Antecedent Precipitation Index DEFRA Department of Environment, Food and Rural Affairs FEH Flood Estimation Handbook (IH 1999) FSR Flood Studies Report (NERC, 1975) HOST Hydrology Of Soil Types NAO National Audit Office NAPI Net Antecedent Precipitation Index NR New Run-off model OFWAT Office of Water services P IMP Percentage IMPervious PR Percentage Run-off SAMOS Semi Automatic Meteorological Observing System SMD Soil Moisture Deficit (Met Office) SOIL Soil Index Value obtained from the WRAP [soil classification] map SPR Standard Percentage Run-off SWS Surface Water Sewer TBR Tipping Bucket Recorder UCWI Urban Catchment Wetness Index UPM Urban Pollution Management WRAP Winter Rain Acceptance Potential
13 see http://www.ciria.org.uk/suds/glossary.htm also Sustainable drainage systems: promoting good practice – a CIRIA initiative: Glossary
Page 40 of 43
Appendix 2. Recommendations Out Of Sight - Not Out Of Mind: Ofwat And The Public Sewer Network In England And Wales (NAO, 2004)
A. Sewerage companies have a duty to provide drainage and cannot stop additional flows
into the network even though these may overload it and cause flooding. The Department should consult on the need for legislation to improve the planning and co-ordination of how additional burdens placed on the sewerage network are approved and on whom the cost implications should fall.
B. Companies apply Ofwat's guidance on categorising properties at risk of sewer flooding inconsistently, hampering comparisons between companies. The 'at-risk' measure is also difficult for customers to interpret. Ofwat should encourage meetings between the 'reporters' used to validate company data, to identify and reduce significant data inconsistencies in the information reported on properties at risk. Ofwat should also decide whether they wish 'at-risk' figures simply to be a record of the number of incidents over previous years or whether 'at-risk' figures should also provide an indicator of risks customers actually face and inform the scope for reducing flooding of properties.
C. Ofwat has encouraged companies to develop robust cost-benefit analysis techniques to inform decisions on which sewer flooding problems to address. Only one company has done so to date and our adviser Professor Pearce doubts whether the findings are transferable to other companies. Ofwat should encourage the industry to carry out co-ordinated studies on customers' willingness to pay that, according to Professor Pearce's paper, are needed to give a rigorous understanding of which more expensive schemes are worth pursuing in each company's particular circumstances.
D. WaterVoice and the industry can play a role in the dissemination of best practice around dealing with sewer flooding. The WaterVoice best practice register is a useful initiative in highlighting company good practice. WaterVoice should develop the register further and publicise it, to encourage the industry to improve by giving more detailed examples on matters such as methods of minimising underreporting and on company websites with respect to information for customers on sewer flooding. Although household insurance plays an important role, the industry could consider more formal arrangements for making payments to customers affected by sewer flooding above the rebate of sewerage charges that better reflect the damage and hardship involved.
E. Companies should develop a clearer understanding of the rate of deterioration of their sewerage network assets. The industry or individual companies could achieve this by instituting a long-term programme (over perhaps 25 years) of surveys of a selected sample of different types of sewer. Ofwat should consult on the benefits and costs of either an industry-wide initiative to research the rate of deterioration of sewers or a requirement for each company to include such a sample in its regular five-year asset inventory assessments. In the longer term, once there is a better understanding of the condition of these assets, Ofwat should place more reliance on this information in its assessment of the needs of the networks.
F. Each sewerage company needs to have a thorough risk-based understanding of its networks and the linkages between condition, performance and the likely impact of intervention options. The common framework provides a means by which each company can achieve such an understanding through a coherent and convincing forward plan. The importance of a successful implementation of the common framework to the industry, and ultimately to customers, should not be underestimated. Ofwat should continue to encourage each company to implement processes consistent with the common framework as quickly as possible. Ofwat should encourage companies by identifying where its judgements have been informed by robust early work by companies on implementing the common framework.
G. Full implementation of the common framework by each company at the 2009 review should enable them to make robust and convincing assessments of capital maintenance needs that can be largely relied upon by Ofwat when it sets price limits for 2010 and beyond. Ofwat should set out more good practice and give each company tailored feedback on weaknesses in their submissions. Companies can use this
Page 41 of 43
feedback to develop their understanding of what Ofwat expects of them in the years leading up to the 2009 review. Ofwat should also ensure that its process for reviewing company submissions is quality controlled and that the company reporters are used to quality assure the companies' common framework processes.
H. Developments such as climate change, the Water Framework Directive and new housing development will place new demands on the performance of the sewerage network and the way investment in the network is prioritised against other demands falling on the industry. Consequently, there may be a need for more robust assessments of future demands on the networks, as currently happens for clean water through water resource plans. There have been various previous initiatives where the industry, Ofwat and other interested parties have worked together successfully, such as the common framework and the tri-partite review of water leakage. The industry, Ofwat, WaterVoice, the Environment Agency, the Department, local authorities and other interested parties should work together to establish a framework so that each company can develop strategic, evidence based assessments of the most likely longer-term requirements of their sewerage networks, how these will be met over time, and setting out the roles of the various interested parties.
Page 42 of 43
Appendix 3. List of invited delegates
Name Affiliation Contact e-mail addresses 1 Graham Squibbs United Utilities [email protected]
Appendix 4. Workshop programme Objective - to align the needs of the Water Industry with current research activity Chairman Andy Eadon, Haswell Consulting Engineers
Presenters Paul Brettell, Severn Trent Water Murray Dale, Meteorological Office
Nick Martin, Thames Water Martin Osborne, EarthTech
John Packman, CEH Wallingford
Reporters Vicki Harty, Hartfair Ltd Richard Kellagher, HR Wallingford
Richard Long, Ewan Associates Graham Squibbs, United Utilities
Publishing Dr Tim Evans, FWR PROGRAMME 09.00 – 0915 Arrival and Coffee
09.15 – 09.25 Welcome, Introductions and Objectives Andy Eadon
09.25 – 09.40 An Industry Background View Paul Brettell
09.40 – 10.00 What data on rainfall does the Industry need? Nick Martin
10.00 – 10.30 What data are/can be provided? Murray Dale
10.30 – 10.45 Tea/Coffee
10.45 – 11.15 Delegate presentations on rainfall Delegates
11.15 – 12.00 Discussion Reporters: Graham Squibbs Vicki Harty
12.00 – 12.30 Run-off modelling – what does the Industry Need?
Martin Osborne
12.30 – 13.15 Lunch
13.15 – 13.45 Run-off modelling – what can be provided? John Packman
13.45 – 14.15 Delegate presentations on run-off modelling Delegates
14.15 – 15.00 Discussion Reporters: Richard Long Richard Kellagher
15.00 – 15.15 Tea/Coffee
15.15 – 15.45 Summary on Rainfall Graham Squibbs Vicki Harty
15.45 – 16.15 Summary on Run-off Modelling Richard Long Richard Kellagher
16.15 – 16.30 Final summing up and Close Andy Eadon
Notes: 1. Main speakers and delegate presenters are both requested to provide a paper or a copy of their presentation (or both) and preferably in electronic form.
2. Presentations by delegates will be restricted by the time allowed for the session and must be pre-registered with the chairman. The suggested target is five minutes each. Any time saved will be used in discussion.
3. Discussion sessions will be led by the Chairman. 4. Summary Sessions will be led by the reporters and seek to reach a consensus on important issues and their priority. 5. A record of the day will be complied and published through FWR and WaPUG 6. Additional papers and written commentaries are welcome