12
USING GIS TO MAP COASTAL WATER QUALITY AT IMPERIAL BEACH Andrew Judd GIS in Water Resources University of Texas
| Date post: | 24-Dec-2015 |
| Category: |
Documents |
| Upload: | ferdinand-clark |
| View: | 214 times |
| Download: | 1 times |

USING GIS TO MAP
COASTAL WATER QUALITY
AT IMPERIAL BEACH
Andrew JuddGIS in Water Resources
University of Texas

TIJUANA, MEXICO
• Important part of Mexico’s growing economy
• Growth has not come without a price
• Infrastructure not kept pace with industrial development and population growth
• Overtaxed sewer systems spill into Tijuana’s waterways
• Most of which ultimately drains to the Tijuana River

IMPERIAL BEACH, CALIFORNIA
• Coastal community south of San Diego
• Located at estuary of Tijuana River
• Continual coastal water quality issues from untreated wastewater flow in Tijuana River
• Contaminated water dispersed along the coastline through ocean currentsImperial
Beach
Californi
a
PacificOcean

GIS PROJECT• Create GIS format for
assessment of Imperial Beach water quality as it relates to Tijuana River Flow
• Several water quality testing stations on Imperial Beach coastline
• River flow gage at the South Bay International Wastewater Treatment Plant
• Use data to create temporal map of water quality and river flow
Imperial BeachTesting Stations
Tijuana RiverFlow Gage

DEFINITIONS• In general, level of water quality
dependant on what is in the water and what the water is used for
• With untreated wastewater issues, coliform bacteria used to test for contamination
• Bacteria generally not harmful, but indicate presence of disease-causing pathogens
• This project using enterococci bacteria subgroup for water quality data
• Enterococci recommended by EPA for ocean water because the bacteria most closely mimic pathogens’ salt water life cycle

PROJECT DATA
• Water quality testing data from SDCOOS website (MPN/100mL)
• Testing at Imperial Beach stations somewhat sporadic (daily to weekly)
• Flow data for Tijuana River from IBWC website (MGD)
• Flow gage at upstream end of river estuary, used as general indicator of flow level
• Averaged river flow and water quality data over weekly basis to allow for comparison

MAP CREATION
• Testing station locations (latitude, longitude) from SDCOOS website
• Tijuana River reach from NHD website
• Weekly averaged bacteria and flow data converted to dbf format
• Linked data to stations using tracking analyst tools
• Using playback manager, can view time series of bacteria and flow data
Map of Imperial Beach Water Quality Testing Stations created with ArcGIS

ANIMATION OF TIME SERIES DATA
• For February to May 2000
• Displays weekly averaged Imperial Beach bacteria levels and Tijuana River flow
• Levels of bacteria and flow symbolized according to magnitude
• SHOW MOVIE

ANALYSIS OF TIME SERIES DATA
• Week of 2/14/2000, Tijuana River flow and bacteria at low levels
• During following two weeks, river flow above 100 MGD
• Bacteria testing at high levels throughout 3.5 miles of coastline
• Beaches are closed when enterococci levels exceed 104/100mL
• During week of 2/28/2000 bacteria levels exceed 1000/100mL
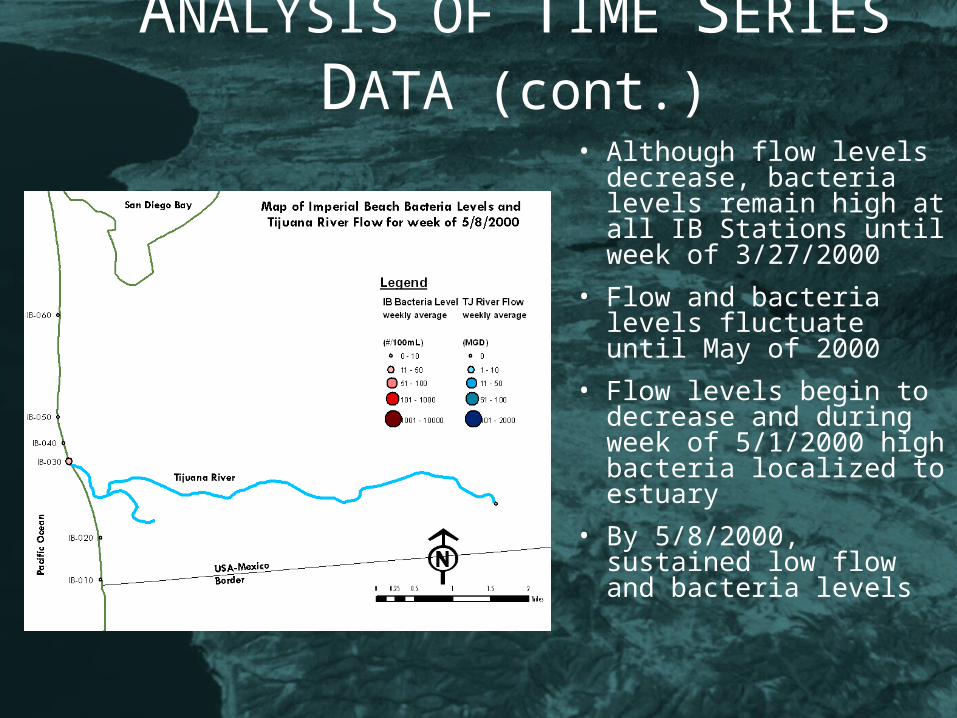
ANALYSIS OF TIME SERIES DATA (cont.)
• Although flow levels decrease, bacteria levels remain high at all IB Stations until week of 3/27/2000
• Flow and bacteria levels fluctuate until May of 2000
• Flow levels begin to decrease and during week of 5/1/2000 high bacteria localized to estuary
• By 5/8/2000, sustained low flow and bacteria levels

CONCLUSIONS• Strong relationship between
Tijuana River flow and Imperial Beach bacteria levels
• Contaminated flow in Tijuana River carries effects throughout Imperial Beach coastline
• ArcGIS is an effective tool for displaying groups of time series data

ADDITIONAL
INFORMATION• San Diego Coastal
Ocean Observing System (SDCOOS) through University of California San Diego
• Has water quality data as well as ocean current, water temperature, weather data and more
Bacteria Levels on 11/29/04 from SDCOOS website (www.sdcoos.ucsd.edu)


