Pulmonary Board Review: Study Design and Statistical Principles Terry Shaneyfelt, MD, MPH UAB Division of General Internal Medicine @EBMTeacher EBMTeacher.com UABEBMcourse YouTube logo image credit (CC0): http ://commons.wikimedia.org/wiki/File:Youtube.svg
Transcript
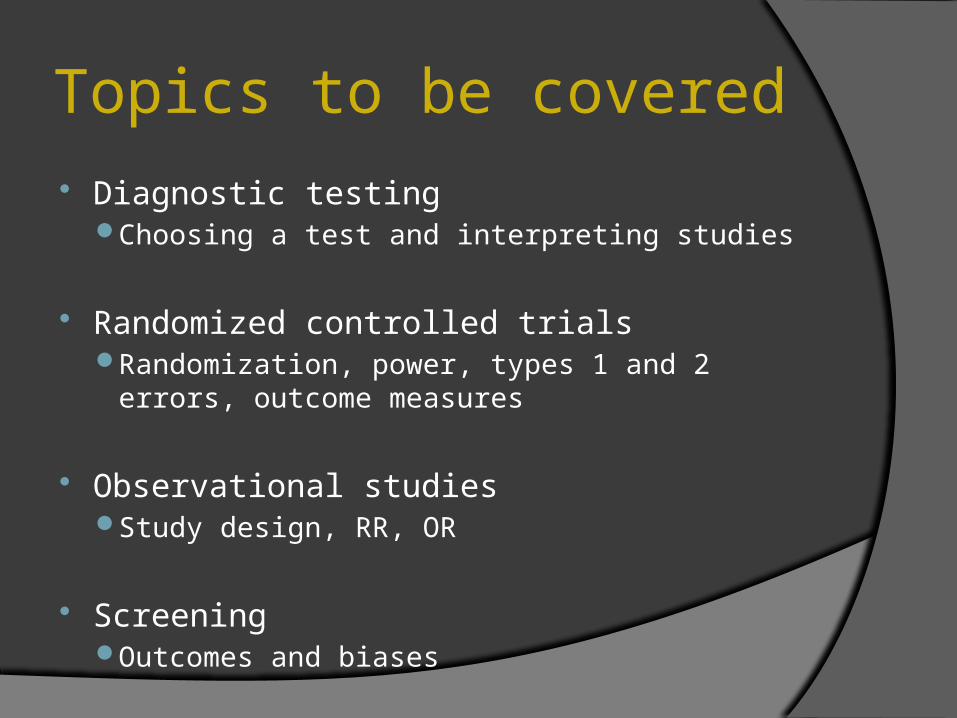
Pulmonary Board Review:Study Design and Statistical Principles
Terry Shaneyfelt, MD, MPHUAB Division of General Internal Medicine
@EBMTeacher
EBMTeacher.com
UABEBMcourseYouTube logo image credit (CC0): http://commons.wikimedia.org/wiki/File:Youtube.svg
Image from PrevMedFellow (CC A SA license): http://commons.wikimedia.org/wiki/File:Flowchart_of_Phases_of_Parallel_Randomized_Trial_-_Modified_from_CONSORT_2010.png
Control
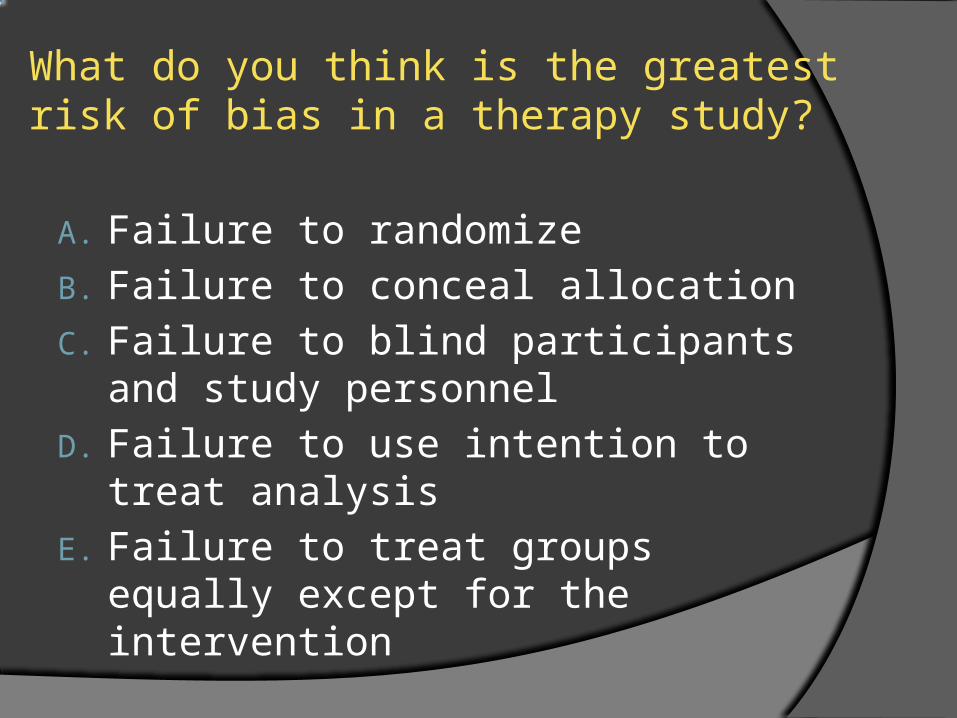
What do you think is the greatest risk of bias in a therapy study?
A. Failure to randomize
B. Failure to conceal allocation
C. Failure to blind participants and study personnel
D. Failure to use intention to treat analysis
E. Failure to treat groups equally except for the intervention
2 Reasons:
1. Reduces selection bias
2. Equally distributes prognostic factors (both known and unknown)
Why Is Randomization So Important?
The validity of a clinical trial depends on treated & control patients being prognostically equal, other than
the intervention being tested
TRUTHDifference No difference
Study Conclusion
Difference
No difference
Beta/ Type II error
Alpha/ Type I error
We estimated that with enrollment of 1130 subjects, the study would have 90% power to show a significant difference between the two groups in the time to the first acute exacerbation of COPD, assuming that 50% of the participants in the control group and 40% in the azithromycin group would have an acute exacerbation, that the rate of nonadherence would be 20%, and that 6% of participants would die or be lost to follow-up during the study, with a two-sided type I error of 0.05.
Azithromycin for Prevention of Exacerbations of COPD NEJM 2011;365:689
Power
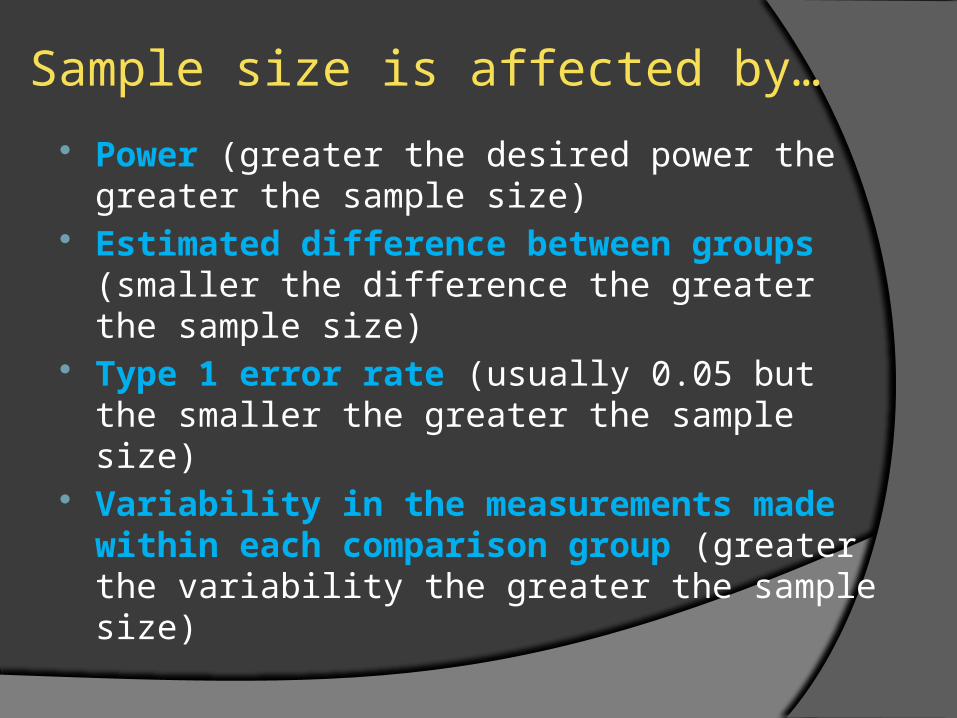
Power (greater the desired power the greater the sample size)
Estimated difference between groups (smaller the difference the greater the sample size)
Type 1 error rate (usually 0.05 but the smaller the greater the sample size)
Variability in the measurements made within each comparison group (greater the variability the greater the sample size)
Sample size is affected by…
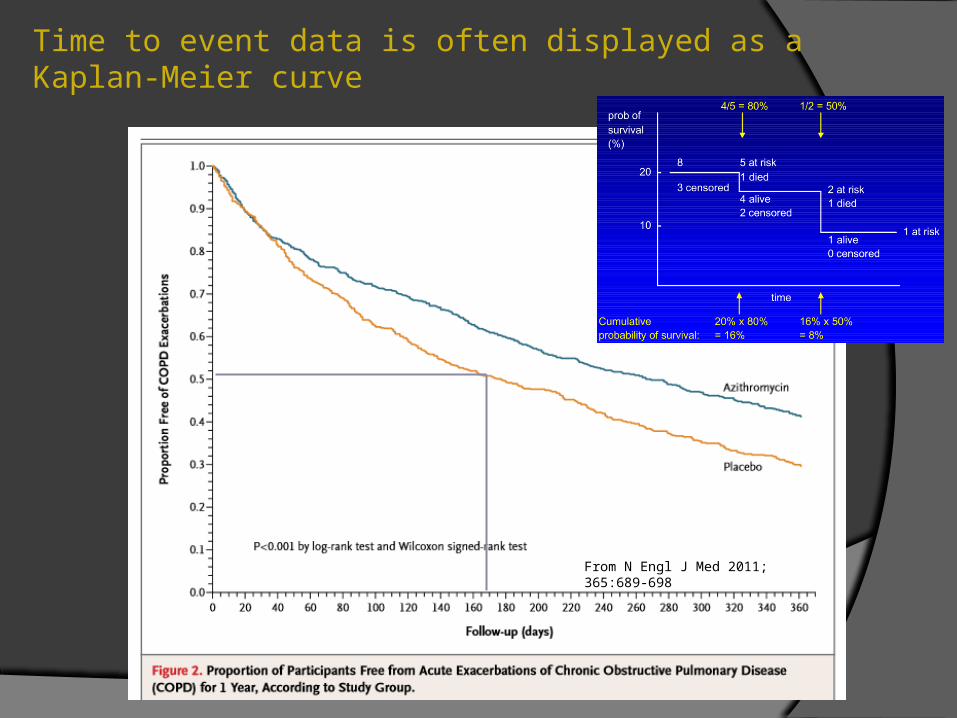
Time to event data is often displayed as a Kaplan-Meier curve
From N Engl J Med 2011; 365:689-698
Azithromycin(# of events)
Placebo(# of events)
Hazard Ratio(95% CI)
p-value
Hospitalization related to COPD
156 2000.82
(0.64 - 1.07)0.15
ED or urgent care visit
199 2570.81
(0.63 - 1.04)0.09
Unscheduled office visit
1202 13450.85
(0.74 - 0.98)0.02
Adapted from Table 2 from NEJM 2011; 365:689
What does a HR of 0.82 mean?
What does the confidence interval mean?
Where do p-values come from?
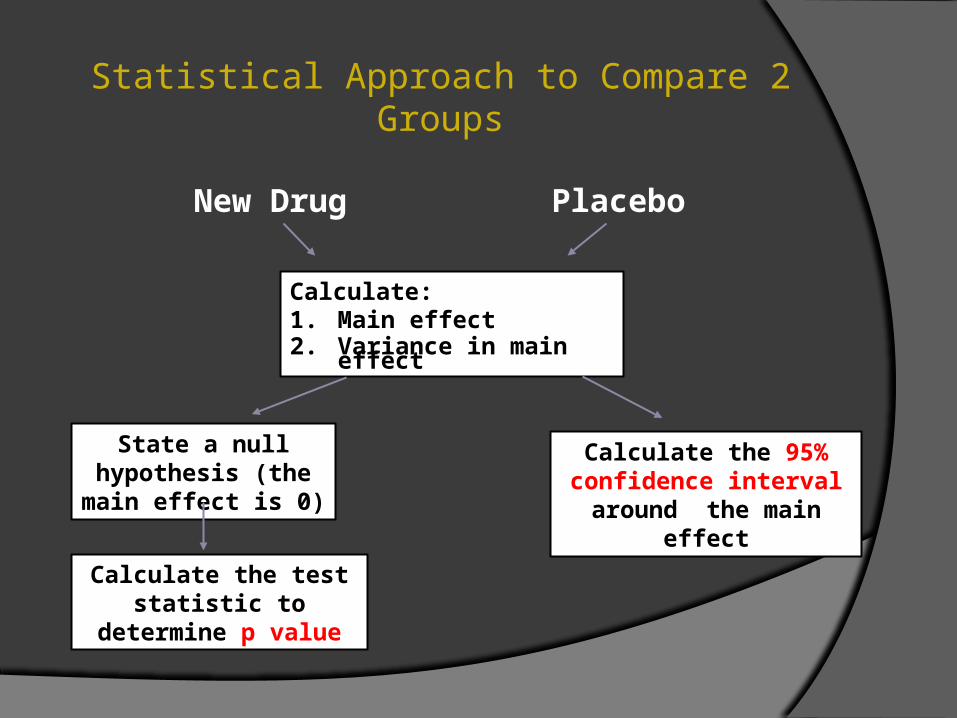
Statistical Approach to Compare 2 Groups
Calculate:1. Main effect2. Variance in main
effect
State a null hypothesis (the main effect is 0)
Calculate the test statistic to
determine p value
Calculate the 95% confidence interval around the main
effect
New Drug
Placebo
What does the 95% CI 0.64-1.07 imply?
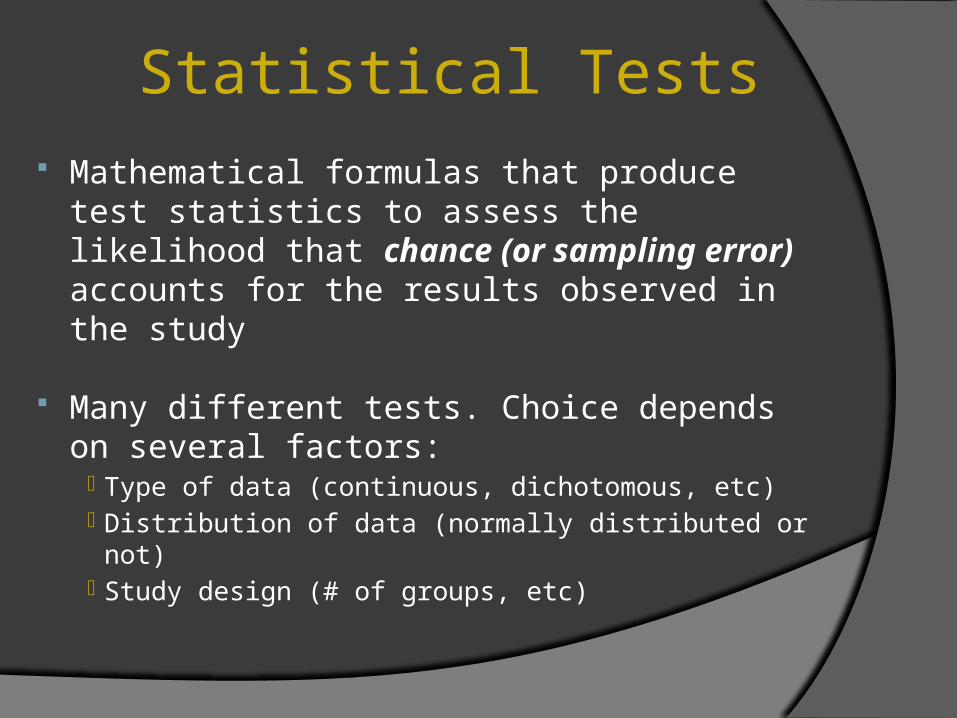
Statistical Tests Mathematical formulas that produce test
statistics to assess the likelihood that chance (or sampling error) accounts for the results observed in the study
Many different tests. Choice depends on several factors:
Type of data (continuous, dichotomous, etc) Distribution of data (normally distributed or not) Study design (# of groups, etc)
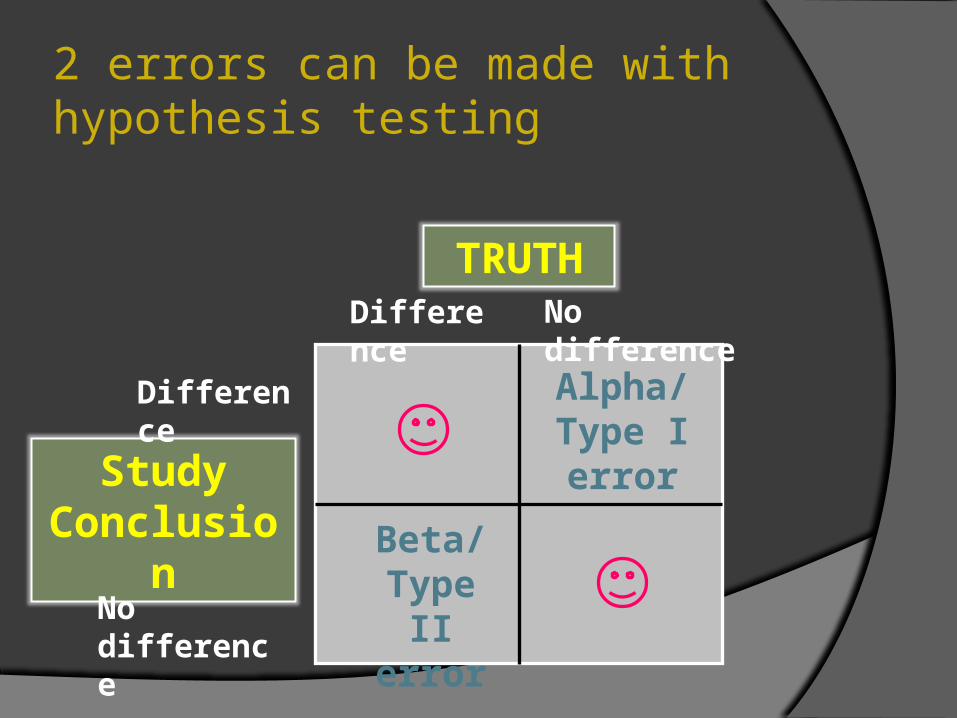
TRUTHDifference No difference
Study Conclusion
Difference
No difference
Beta/ Type II error
Alpha/ Type I error
2 errors can be made with hypothesis testing
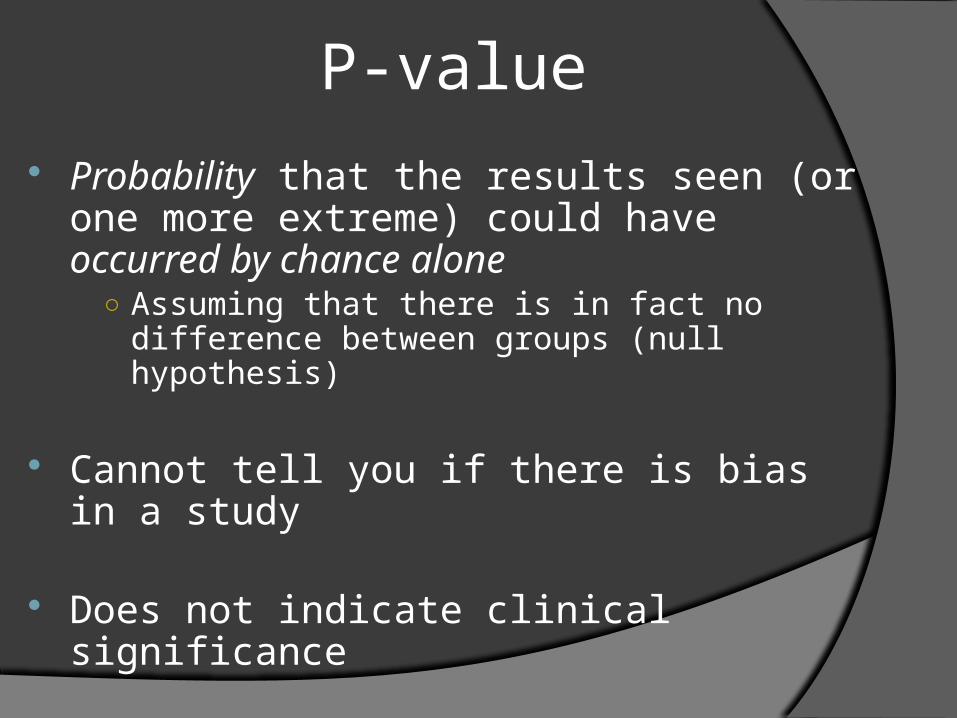
P-value
Probability that the results seen (or one more extreme) could have occurred by chance alone
○ Assuming that there is in fact no difference between groups (null hypothesis)
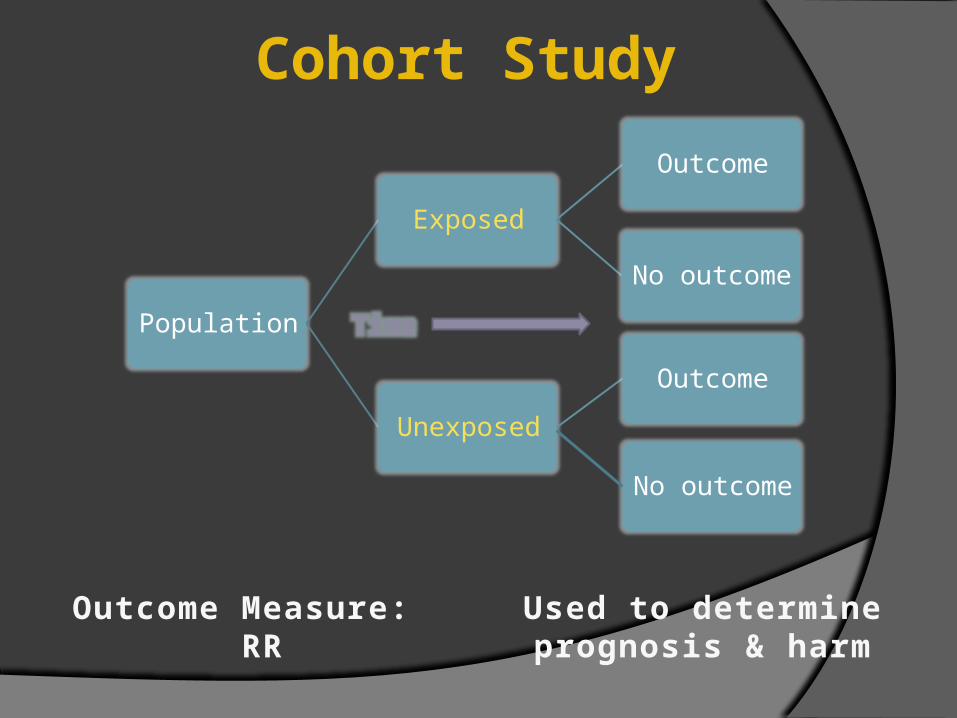
Can’t establish estimate of risk directly nor determine prevalence
Can only study one disease
More prone to bias
Case-Control: Strengths & Weaknesses
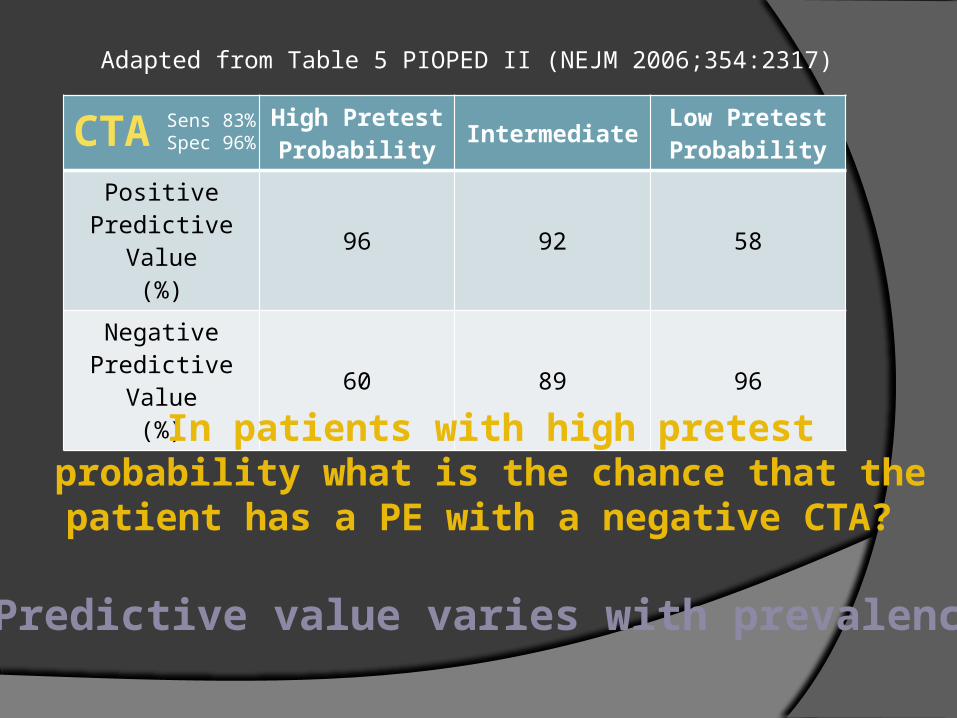
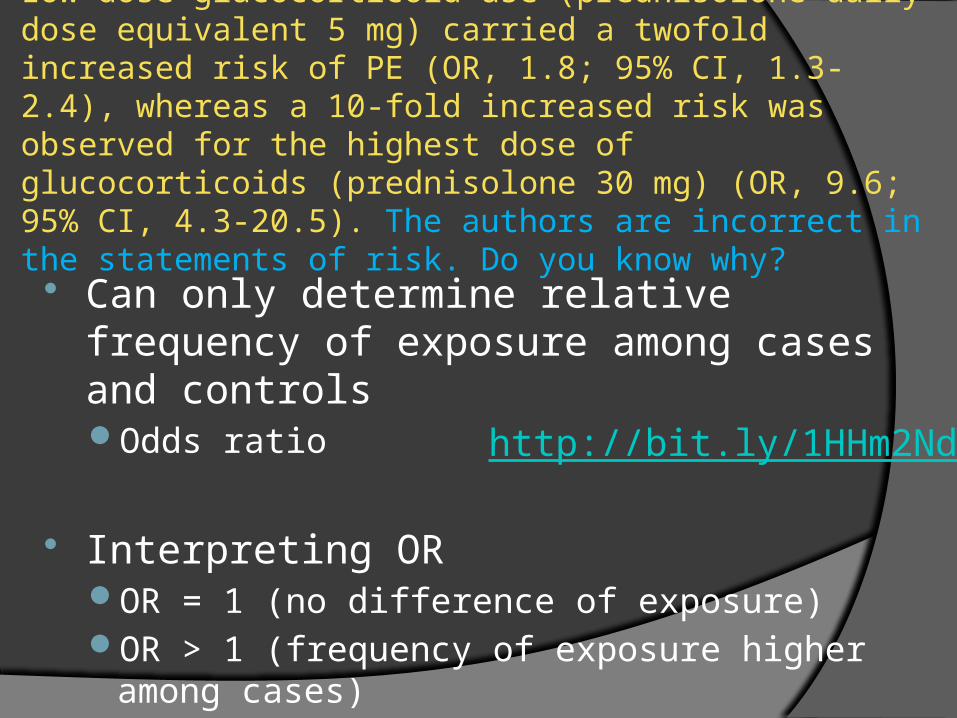
Low-dose glucocorticoid use (prednisolone daily dose equivalent 5 mg) carried a twofold increased risk of PE (OR, 1.8; 95% CI, 1.3-2.4), whereas a 10-fold increased risk was observed for the highest dose of glucocorticoids (prednisolone 30 mg) (OR, 9.6; 95% CI, 4.3-20.5). The authors are incorrect in the statements of risk. Do you know why?
Can only determine relative frequency of exposure among cases and controlsOdds ratio
Interpreting OROR = 1 (no difference of exposure)OR > 1 (frequency of exposure higher among cases)OR < 1 (frequency of exposure lower among cases)