88


Chairman’s Message 03
Board of Directors 06
Annual Report of the Board of Directors' 12
Corporate Governance 18
Audit Committee Report 28
Risk Management Committee Report 30
Directors’ Statement on Internal Control 31Over Financial Reporting
Independent Auditors’ Report 32
Financial Reports 34
Corporate Information 84
VISIONTo be “Sri Lanka’s preferred financial solutions provider”
COREVALUES
- Integrity- Ownership- Achievement- Best People- Team Spirit
BUSINESSPRINCIPLES
- Effective and Efficient Operations- Time tested Policies and Procedures- State of the Art IT Systems- Prudent Lending Policy- Strict Expense Discipline- Strong Capital and Liquidity- Good Corporate Governance
MISSION
- To provide our Depositors with secure
and maximized returns.
- To provide our Customers leverage to
achieve their aspirations
- To maximize Shareholder value
- To empower our Team to deliver the
values of the Company
- To operate within the Regulatory framework.
- To be a responsible corporate citizen towards
the betterment of Society
Content

Annual Report 2019 1
Chairman’s Message 03
Board of Directors 06
Annual Report of the Board of Directors' 12
Corporate Governance 18
Audit Committee Report 28
Risk Management Committee Report 30
Directors’ Statement on Internal Control 31Over Financial Reporting
Independent Auditors’ Report 32
Financial Reports 34
Corporate Information 84
VISIONTo be “Sri Lanka’s preferred financial solutions provider”
COREVALUES
- Integrity- Ownership- Achievement- Best People- Team Spirit
BUSINESSPRINCIPLES
- Effective and Efficient Operations- Time tested Policies and Procedures- State of the Art IT Systems- Prudent Lending Policy- Strict Expense Discipline- Strong Capital and Liquidity- Good Corporate Governance
MISSION
- To provide our Depositors with secure
and maximized returns.
- To provide our Customers leverage to
achieve their aspirations
- To maximize Shareholder value
- To empower our Team to deliver the
values of the Company
- To operate within the Regulatory framework.
- To be a responsible corporate citizen towards
the betterment of Society
Content

UB Finance2
Chairman’s Message 03
Board of Directors 06
Annual Report of the Board of Directors' 12
Corporate Governance 18
Audit Committee Report 28
Risk Management Committee Report 30
Directors’ Statement on Internal Control 31Over Financial Reporting
Independent Auditors’ Report 32
Financial Reports 34
Corporate Information 84
VISIONTo be “Sri Lanka’s preferred financial solutions provider”
COREVALUES
- Integrity- Ownership- Achievement- Best People- Team Spirit
BUSINESSPRINCIPLES
- Effective and Efficient Operations- Time tested Policies and Procedures- State of the Art IT Systems- Prudent Lending Policy- Strict Expense Discipline- Strong Capital and Liquidity- Good Corporate Governance
MISSION
- To provide our Depositors with secure
and maximized returns.
- To provide our Customers leverage to
achieve their aspirations
- To maximize Shareholder value
- To empower our Team to deliver the
values of the Company
- To operate within the Regulatory framework.
- To be a responsible corporate citizen towards
the betterment of Society
Content

Annual Report 2019 3
Alexis Lovell, MBEChairman
“ We have once more overcome a turbulent year on a positive note, by harnessing the power of innovative thinking and creative
problem solving.”

UB Finance4
Dear Shareholders,
Economic Overview
Strategic Goals
Future outlook

Annual Report 2019
Changes to directorate
Acknowledgements

UB Finance
“Our Board concentrates on strategy oversight and
governance practices that leads towards stability despite
economic volatility”
Alexis Lovell, MBE Chairman
Chandrakumar RamachandraNon Executive Director
Lisa Thomas Non Executive Director
Ananda AtukoralaDeputy Chairman
Indrajit Wickramasinghe Non Executive Director
Atul MalikNon Executive Director
Ranvir Dewan Non Executive Director
Malinda SamaratungaNon Executive Director
Ransith Karunaratne
Board of Directors

Annual Report 2019
“Our Board concentrates on strategy oversight and
governance practices that leads towards stability despite
economic volatility”
Alexis Lovell, MBE Chairman
Chandrakumar RamachandraNon Executive Director
Lisa Thomas Non Executive Director
Ananda AtukoralaDeputy Chairman
Indrajit Wickramasinghe Non Executive Director
Atul MalikNon Executive Director
Ranvir Dewan Non Executive Director
Malinda SamaratungaNon Executive Director
Ransith Karunaratne
Board of Directors

UB Finance
MR. ALEXIS INDRAJIT LOVELL, MBE
MR. ANANDA WIJETILAKA ATUKORALA
MR. RANVIR DEWAN
MR. ATUL MALIK

Annual Report 2019
MS. LISA G. THOMAS
MR. INDRAJIT WICKRAMASINGHE
MR. CHANDRAKUMAR RAMACHANDRA

UB Finance
MR. RANSITH KARUNARATNE
12
3
410
11
13
7
15
17
5
16
12
14
6
8
9
1.2.3.4.5.6.7.8.9.
10.11.12.13.14.15.16.17.
MR. MALINDA SAMARATUNGA
Annual Report 2019 11
12
3
410
11
13
7
15
17
5
16
12
14
6
8
9
1.2.3.4.5.6.7.8.9.
10.11.12.13.14.15.16.17.

UB Finance12
st
Legal Status of the Company
th
th
th
Major Shareholders of the Company
Principle Activities and the Nature of the Company
Financial Statements
Auditors Report
th
Accounting Policies
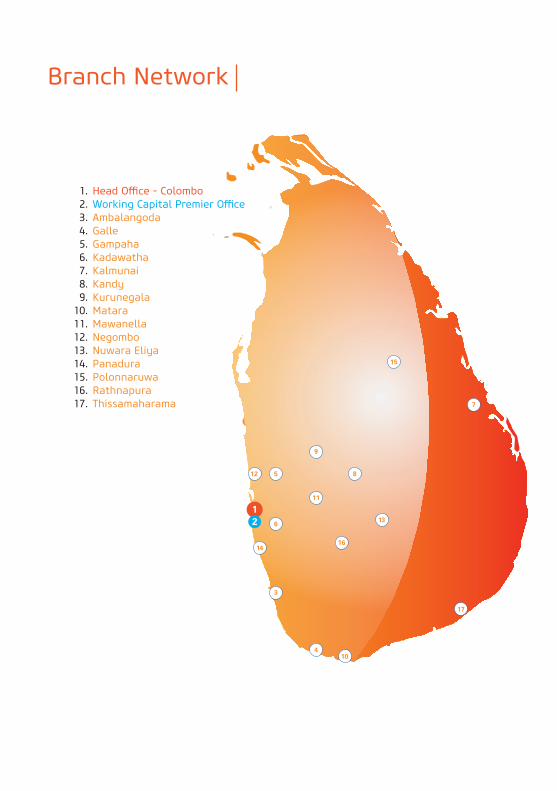
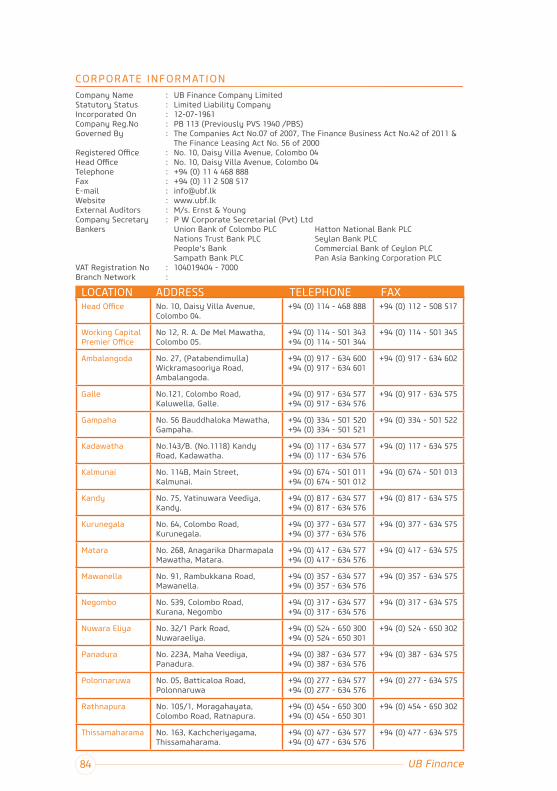
Branch Network
st
Financial Reporting & Responsibility for the Accounts
as at 31st
st
Payments made to Directors
Shareholder Register
st
has

Annual Report 2019 13
Shareholdings of Directors in the Company / Parent Company:
st
st
Name of the Director
Name of the Director
Position
No. of VotingShares in the
Company
No. of Non VotingShares in the
Company
No. of VotingShares in the
Parent Company
Date ofAppointment
None
NoneNoneNoneNoneNoneNoneNone
NoneNoneNoneNoneNoneNoneNoneNoneNone
NoneNoneNoneNoneNoneNoneNone

UB Finance14
Name of the DirectorNo. of Directorates / equivalent positions held
in companies / societies / corporate bodies as at 31.03.2019
Director
Chairman
Director
Principal
Director
Chairman
Director
Competent Authority
Director
Principal
Chairman
Director
Non-Executive Director/Treasurer
Set out below are the directorships held by the Directors in other Institutions as at 31st March 2019

Annual Report 2019
Register of Directors and Secretaries
Communication
Directors' Transactions with the Company / Related Party Disclosures
Events after the Reporting period
Interest Register
Compliance with Rules & Regulations including Corporate Governance Practices

UB Finance
Audit Committee
Integrated Risk Management Committee
Board Credit Committee
Human Resources and Remuneration Committee
Strategic Planning Committee
st

Annual Report 2019
EE
EE
EE
AA
AA
AA
12 12 12 12 12 12 12 12 12
11 11 12
4 4 4 4 4 2
2 2 4 2 3 2
1 4 4 4 3 4
1 4 3 4 3 2
4 4 4 4
4 4 3 3
3 3 1 3 3 2
3 3 1 3 3 2
4 4 4 4
2 3 4 3
Ann
ual
Gen
eral
Mee
ting
EA

UB Finance
stakeholders
2.00 The Responsibilities of the Board of Directors
Section Principle Degree of Compliance

Annual Report 2019
ests
ditors
Section Principle Degree of Compliance

UB Finance
3.00 Meetings of the Board
Section Principle Degree of Compliance

Annual Report 2019 21
4.00 Compositions of the Board
Section Principle Degree of Compliance
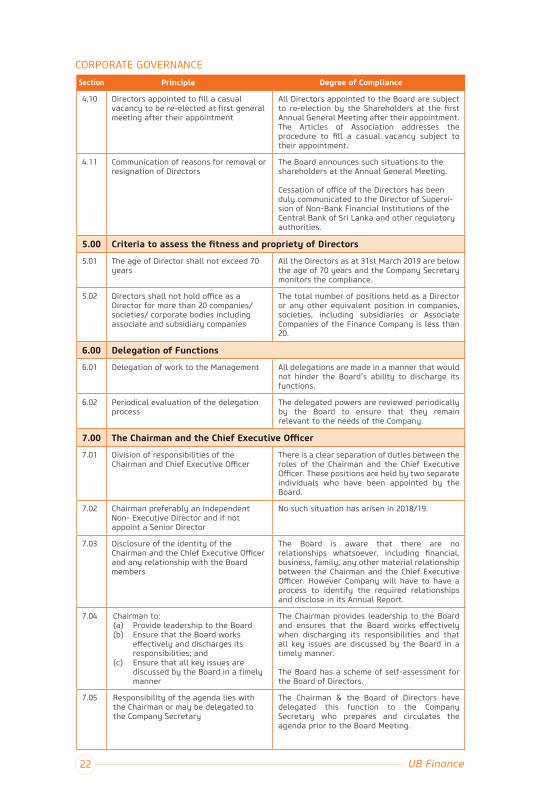
UB Finance22
5.00
6.00 Delegation of Functions
7.00
Section Principle Degree of Compliance

Annual Report 2019 23
duties
Shareholders
8.00 Board appointed Committees
Section Principle Degree of Compliance

UB Finance24
auditor
auditor
D
E
F
thereto
Section Principle Degree of Compliance

Annual Report 2019
external auditors
M
N
O
D
E
Section Principle Degree of Compliance

UB Finance
F
9.00 Related party transactions
Section Principle Degree of Compliance

Annual Report 2019
10.00 Disclosures
in aggregate
Section Principle Degree of Compliance

UB Finance
Composition and Performance
Mr. Chandrakumar Ramachandra (Chairman)
Mr. Ananda Wijetilaka Atukorala
Ms. Lisa Thomas
Mr. Malinda Namal Samaratunga
Mr. Ranvir Dewan
The Role of the Audit Committee
Terms of Reference
Key responsibilities of the BAC Financial Reporting
Internal Audit and Internal Controls
Annual Report 2019
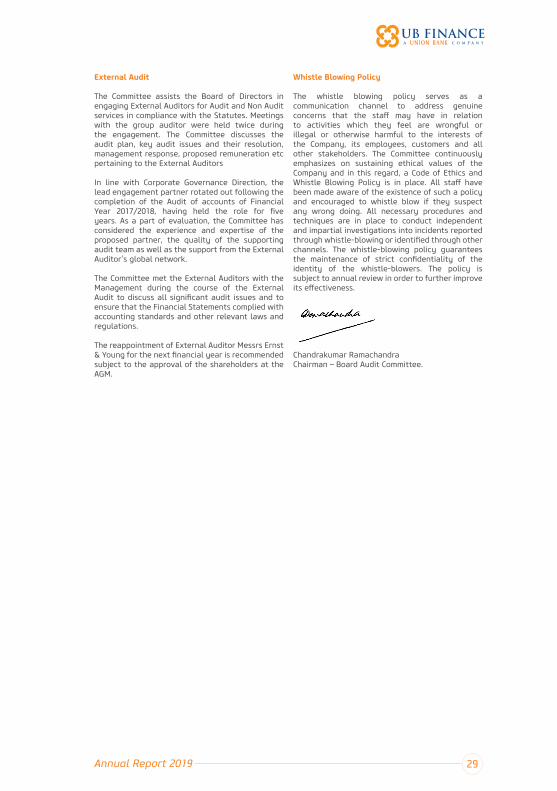
External Audit Whistle Blowing Policy

UB Finance
Purpose
Composition
Mr. Ranvir Dewan
Ms. Lisa G. Thomas
Mr. Indrajit Wickramasinghe
Mr. Chandrakumar Ramachandra
Mr. Ransith Karunaratne
Terms of Reference
Committee Meetings
Activities of the Committee
Mr. Ranvir Dewan

Annual Report 2019 31
Responsibility

UB Finance32
INDEPENDENT AUDITOR’S REPORTTO THE SHAREHOLDERS OF UB FINANCE COMPANY LIMITED
Opinion
Basis for opinion
Responsibilities of management and those
statements
Auditor’s responsibilities for the audit of the

Annual Report 2019 33
Report on Other Legal and Regulatory Requirements
A member firm of Ernst & Young Global Limited
Principal
Partners: W R H Fernando FCA FCMA M P D Cooray FCA FCMA R N de Saram ACA FCMA Ms. N A De Silva FCA Ms. Y A De Silva FCA W K B S P Fernando FCA FCMAMs. K R M Fernando FCA ACMA Ms. L K H L Fonseka FCA A P A Gunasekera FCA FCMA A Herath FCA D K Hulangamuwa FCA FCMA LLB (Lond) H M A Jayasinghe FCA FCMAMs. A A Ludowyke FCA FCMA Ms. G G S Manatunga FCA Ms. P V K N Sajeewani FCA N M Sulaiman ACA ACMA B E Wijesuriya FCA FCMA
T P M Ruberu FCMA FCCA

UB Finance34
Income
Net Interest Income
Net Fee and Commission Income
Total Operating Income
Net Operating Income
4
Notes 2019Rs.
2,152,702,226
721,455,584
43,514,032
786,237,481
571,884,805
99,377,351
46,194,476
20,147,430
2,010,850,282
612,670,144
52,040,820
685,831,046
553,695,483
139,582,997
88,261,309 71,868,790
2018Rs.

Annual Report 2019
Income Statement
Income Statement
Total Comprehensive Income for the Year
19,442,484
64,914,582
Notes 2019Rs.
2018Rs.

UB Finance
th
Notes 2019Rs.
2018Rs.
Assets
Total AssetsLiabilities
Total Liabilities
Equity
Total Shareholders’ EquityTotal Equity and Liabilities
121314
14
212223
24
11,126,678,828
10,356,599,511
770,079,317 11,126,678,828
11,150,799,635
9,969,780,151
1,181,019,484 11,150,799,635

Annual Report 2019
Stat
utor
y Re
serv
e Fu
ndSt
ated
Ca
pita
lAv
aila
ble-
for-
Sale
Res
erve
Reva
luat
ion
Rese
rves
Accu
mul
ated
Tota
l
Rs
. Rs
. Rs
. Rs
. Rs
. Rs
.
Bala
nce
as a
t 1
Apri
l 20
17
Bala
nce
as a
t 31
Mar
ch 2
018
Rest
ated
ope
ning
bal
ance
as
at 1
Apr
il 2
018
as p
er S
LFRS
9
Bala
nce
as a
t 31
Mar
ch 2
019
Not
e
3,1
52,0
47,5
99 - -
3,1
52,0
47,5
99
1,0
28,2
72,8
10
52,
044,
800 - -
52,
044,
800
66,
854,
606
- - - - - - -
-
-
28,
554,
226 - -
28,
554,
226 - -
-
-
28,
554,
226
(2,
051,
627,
141)
(2,
482,
009,
792)
(35
3,60
2,32
5)
1,1
81,0
19,4
84
750
,636
,833
770
,079
,317

UB Finance
Cash Flow from Operating Activities
(Increase) / Decrease in Operating Assets:
Others Increase in Operating Liabilities Others Net Cash used in Operating Activities before Income Tax
Net Cash used in Operating Activities Cash Flow from Investing Activities
Net Cash used in Investing Activities
Cash Flow from Financing Activities
Net Cash Generated from Financing Activities Net (Decrease) / Increase in Cash and Cash Equivalents Cash and Cash Equivalents at Beginning of the Year Cash and Cash Equivalents at End of the Year Reconciliation of Cash and Cash Equivalents
14
22
426,680,167
1,368,972,347
1,368,972,347
535,240,987
917,429,081
917,429,081
23
213,633,075
110,379,754
324,367,267
326,091,230
Notes2019
Rs.2018
Rs.
(85,516,657)
7,063,416

Annual Report 2019
1. CORPORATE INFORMATION
1.1 General
1.2 Parent Entity and the Ultimate Controlling Parties
1.3 Principal Activities and Nature of Operations
1.4 Date of Authorization for Issue
1.5 Director’s Responsibility Statement
2. BASIS OF PREPARATION & SIGNIFICANT ACCOUNTING POLICIES
2.1 Basis of Preparation
2.1.1 Statement of Compliance
2.1.2 Basis of Measurement
2.1.3 Functional and presentation currency
2.1.4 Presentation of Financial Statements
2.1.5 Materiality and Aggregation

UB Finance
2.1.6 Changes in accounting policies and disclosures
changes due to the adoption of
2.1.6.1 SLFRS 9 Financial Instruments
Changes to classification and measurement
• •
•
•
Changes to the impairment calculation
2.1.7 Comparative Information
2.1.8 Rounding
2.2 SIGNIFICANT ACCOUNTING JUDGEMENTS, ESTIMATES AND ASSUMPTIONS
2.2.1 Going Concern
2.2.2 Classification of Financial Instruments
2.2.2.1 Business model assessment

Annual Report 2019 41
•
•
•
•
2.2.2.2 The Solely Payment of Principal and Interest (SPPI) Test
2.2.3 Fair value of financial instruments
2.2.4 Impairment Losses on Loans and Advances
2.2.4.1 Individual Impairment Assessment
2.2.4.2 Collective Impairment Assessment
Accounting policy applicable period from 1 April 2018
•
•
•
•
•
Accounting policy applicable period before 1 April 2018

UB Finance42
2.2.5 Useful lives of Property, Plant and Equipment and Intangibles
2.2.6 Taxation
2.2.7 Deferred Tax Assets
2.2.8 Defined Benefit Plan
2.2.9 Commitments and Contingencies
2.2.10 Revaluation of Property Plant and Equipment
2.3 SIGNIFICANT ACCOUNTING POLICIES
2.3.1 Cash and Cash Equivalents
2.3.2 Reverse Repurchased Agreements

Annual Report 2019 43
2.3.3 Financial Instruments – Initial Recognition, Classification and Subsequent Measurement
2.3.3.1 Date of Recognition
2.3.3.2 Recognition and Initial measurement of Financial Instruments
2.3.3.3 Measurement categories of financial assets and liabilities.
• •
•
2.3.3.3.1 Financial Investments at Fair Value Through Profit or Loss
2.3.3.3.2 Financial Assets at Amortized Cost – Loans and receivables from Customers
Policy applicable from 1 April 2018
•
•
Policy applicable before 1 April 2018
Financial Investments – Held to Maturity
•
•
•

UB Finance44
Collateral Valuation
2.3.3.3.3 Financial Investments at Fair Value Through Other Comprehensive Income
Policy applicable from 1 April 2018 Debt Instruments
•
•
Equity Instruments
Policy applicable before 1 April 2018
2.3.3.3.4 Classification and Subsequent Measurement of Financial Liabilities at fair value through profit or loss
2.3.3.3.5 Classification and Subsequent Measurement of Financial Liabilities at amortized cost
Due to Banks
Due to Customers
Other Borrowed Funds

Annual Report 2019
2.3.4 Impairment of Financial Assets
Policy applicable before 1 April 2018
Financial Assets carried at amortized cost
Policy applicable after 1 April 2018
•
•
•

UB Finance
The calculation of ECLs
•
•
•
•
2.3.5 De-recognition of Financial Assets and Financial Liabilities
2.3.5.1 De-recognition due to substantial modification of terms and conditions
2.3.5.2 De-recognition other than for substantial modification
Financial assets
•
asset, or•
•
•
•
•
•
asset

Annual Report 2019
Financial liabilities
2.3.6 Fair Value Determination and Measurement2.3.6.1 Determination of fair value
2.3.6.2 Measurement of fair value
2.3.6.3 Fair Value Hierarchy
Level 1Inputs that are unadjusted quoted market prices in an active market for identical instruments
Level 2Inputs other than quoted prices included within Level 1 that are observable either directly (i.e. as prices) or indirectly (i.e. derived from prices)
Level 3
Inputs that are unobservable
2.3.7 Real Estate Property
• • •
2.3.8 Property, Plant and Equipment
Basis of Recognition

UB Finance
Measurement
Subsequent costs
De-recognition
Depreciation
Furniture and Fittings
Cost model
Revaluation Model
2.3.9 Intangible Assets
Basis of Recognition
Software

Annual Report 2019
Estimated Useful Life of Intangible Assets
Intangible Amortization Period
to use
Other Intangible Assets
Subsequent Measurement
De-recognition of Intangible Assets
2.3.10 Deferred Tax
2.3.11 Current Tax Asset/ Liabilities
2.3.12 Other Assets

UB Finance
2.3.13 Impairment of non–Financial Assets
2.3.14 Other Liabilities
2.3.15 Defined Benefit Plan
Recognition of actuarial gains and losses
Funding arrangement
Principal Actuarial Assumptions
2.3.16 Provisions
2.3.17 Regulatory Provision
(a) Statutory Reserve Fund
(b) Deposit Insurance and Liquidity Support Scheme

Annual Report 2019
(c) Crop Insurance Levy
2.3.18 Capital commitments and contingencies
RECOGNITION OF INCOME AND EXPENSES
2.3.19 Gross Income
2.3.20 Net interest Income

UB Finance
2.3.21 Interest Income on Overdue Rentals
2.3.22 Net Fee and Commission Income
Fee and commission expenses
2.3.23 Other Operating Income
2.3.24 Dividend Income
2.3.25 Recovery of Bad Debts Written Off
2.3.26 Impairment
Policy applicable from 1 April 2018
Policy applicable before 1 April 2018
2.3.27 Personnel Expenses
Employees’ Provident Fund and Employees’ Trust Fund
2.3.28 Depreciation and Amortization
2.3.29 Other Expenses
2.3.30 Value Added Tax (VAT), Nation Building Tax (NBT) and Debt Repayment Levy(DRL) on Financial Services
Value Added Tax (VAT)
Nation Building Tax (NBT)

Annual Report 2019
Debt Repayment Levy (DRL)
2.3.31 Tax Expense
Income tax and other taxes
Economic Service Charge (ESC)
OTHER ACCOUNTING POLICIES
2.3.32 Earnings per Share (EPS)
2.3.33 Segment Reporting
• Others
2.3.34 Cash Flow Statement
2.3.35 Events occurring after the reporting date
2.3 SRI LANKA ACCOUNTING STANDARDS ISSUED BUT NOT EFFECTIVE AS AT REPORTING DATE
SLFRS 16- Leases
Summary of the Requirements
Possible Impact on Financial Statements

UB Finance
Assets / Liabilities
TRANSITION DISCLOSURES
The impact of transition to SLFRS 9 on retained earnings
Reconciliation of the aggregate opening loan loss provision allowances under LKAS 39 to the expected credit loss provision under SLFRS 9
Reconciliation between carrying amounts under LKAS 39 to the balances reported under SLFRS 9 as of 1 April 2018
Retained Earnings
Impairment on Financial Assets/ Liabilities
3
3.2.1
A
3.2.2
3.1
Category CategoryAmount RemeasurmentSLFRS 9
AmountRef LKAS 39
31st 1st

Annual Report 2019
INCOME
Interest Income
2,066,869,420
1,904,703,382
4
4.1
2,152,702,226
2,010,850,282
Notes 2019Rs.
2019Rs.
2018Rs.
2018Rs.
Interest Expense
Net Fee And Commission Income
OTHER OPERATING INCOME
Others
Financial assets at amortised cost- Loans and advances to customers Stage 1Stage 2Stage 3
Stage 3
IMPAIRMENT CHARGE FOR LOANS AND RECEIVABLES, AND OTHER ASSETS
1,345,413,836 1,292,033,238
721,455,584 612,670,144
21,267,866 21,120,082
214,352,676
216,199,649
132,135,563
152,777,679
4.2
4.3
5
6.1
6
2019Rs.
2018Rs.
2019Rs.
2018Rs.
2019Rs.
2018Rs.
2019Rs.
2019Rs.
2018Rs.
2018Rs.
Net interest income
43,514,032
52,040,820

UB Finance
TAXATION
Less: Deductions under Section 32
Tax expense for the period (@28%)
26,047,047 16,392,520
9.
Reconciliation of Current Income Tax Expense9.1
STAFF COSTS
Salaries
Others 193,257,023
170,344,838
7.
OTHER EXPENSES
Others 248,745,701 220,208,106
8.
2019Rs.
2019Rs.
2019Rs.
2019Rs.
2018Rs.
2018Rs.
2018Rs.
2018Rs.
Notes

Annual Report 2019
2019
2019 20192018 2018
2018
EARNINGS PER SHARE
Weighted Average Number of Ordinary Shares for Basic EPS
10.
10.1
10.2
10.2.1
10.2.2
11.
0.01 0.04
2,295,095,035
2,295,095,035
2,295,095,035
1,845,004,840
Amount used as the numerator:
Number of ordinary shares used as denominator
MEASUREMENT OF FINANCIAL INSTRUMENTS
Earnings per share: Basic
Outstanding No. of Shares Weighted Average No. of Shares
Notes
ASSETS
Total Financial Assets
LIABILITIES
Total Financial Liabilities
-
200,900
10,313,952,309
10,209,464,699
10,314,153,209
10,209,464,699
Fair value through
P&L
Fair value through
P&L
Amortised cost
Fair value through
OCI
Amortised cost
Total
Total

UB Finance
11. MEASUREMENT OF FINANCIAL INSTRUMENTS (Contd...)
ASSETS
Total Financial Assets
LIABILITIES
Total Financial Liabilities
Stage 1Stage 2Stage 3
-
10,525,239,726 200,900
9,845,510,875
10,525,440,626
9,845,510,875
Held to Maturity
Held for Trading
Held for Trading
Amortised cost
Loans & Receivables
Available for sale
Total
Total
2019Rs.
2019Rs.
2019Rs.
2019Rs.
2018Rs.
2018Rs.
2018Rs.
12.
13.
14.
14.1
473,888,928
455,042,958
8,785,229,424
546,524,988
9,972,045,533
9,452,656,902
455,652,248
CASH IN HAND AND BALANCES WITH BANKS
REVERSE REPURCHASED AGREEMENTS
FINANCIAL ASSETS AT AMORTIZED COST - LOANS AND RECEIVABLES TO OTHER CUSTOMERS/ LOAN AND RECEIVABLES FROM CUSTOMERS

Annual Report 2019
14. LOANS AND RECEIVABLES FROM CUSTOMERS (Contd...)
14.1.
14.1.1
14.2
14.3
(294,450,263)
(892,365,846)
(228,929,374)
(329,912,709)
9,972,045,533
10,011,498,985
9,972,045,533
10,011,498,985
Contractual maturities of Loans and Receivables from Customers
Gross Loans and Receivables to other customers - By Industry
Movements in Individual and Collective Impairment Charges during the Year
Other
Individual impairment charges
Balance as at 31 March
Collective impairment charges
Balance as at 31 March
As at 31st March 2019
As at 31st March 2018
Over 5 YearsRs.
Over 5 YearsRs.
Within one yearRs.
Within one yearRs.
TotalRs.
TotalRs.
1 to 5 YearsRs.
1 to 5 YearsRs.
2019Rs.
2019Rs.
2019Rs.
2018Rs.
2018Rs.
2018Rs.
9,972,045,533
10,011,498,985
Gross Loans and Receivables from Customers - By Product

UB Finance
15.
200,900 200,900
FINANCIAL ASSETS MEASURED AT FAIR VALUE THROUGH OTHER COMPREHENSIVE INCOME
2018Rs.
2019Rs.
15.1 Unquoted InvestmentsNo. ofShares
No. ofShares
Cost (Rs.)
Cost (Rs.)
Fair Value ( Rs.)
Fair Value ( Rs.)
2019 2018
200,900
200,900
200,900
200,900
Notes
2019Rs.
2019Rs.
2019Rs.
2018Rs.
2018Rs.
2018Rs.
16.
18.
17.
64,133,550
2,855,901
53,801,944
120,791,395
108,069,691
2,855,901
52,902,834
163,828,425
25,266,870
7,935,521
24,163,458
8,427,137
111,842,459 79,402,061
INVESTMENTS IN REAL ESTATELand
Net Value
Housing Projects
Net Value Other Projects
Net Value
INTANGIBLE ASSETS
Cost
(Less): Amortisation of Intangible Assets
Net book value at 31 March
OTHER ASSETS
Other Financial Assets
Other Non Financial Assets

Annual Report 2019
PROPERTY, PLANT AND EQUIPMENT
Net Book Values
Property, Plant and Equipment
Property, Plant and Equipment
19.
19.1
19.2
19.3
2018
91,267,500
1,332,030
89,935,470
91,267,500
666,015
90,601,485
53,817,542
26,669,254
27,148,288
53,318,093
20,609,800
32,708,293
36,699,801
29,811,492 6,888,309
33,644,928
25,311,586 8,333,342
81,393,384
38,370,478
43,022,906
63,852,485
29,602,901
34,249,584
94,117,086
15,758,402
78,358,684
30,279,685
7,559,888
22,719,797
357,295,312
111,941,654 245,353,658
272,362,691
83,750,190
188,612,501
Land andBuildings
Rs.
Land andBuildings
Rs.
Computer &Equipments
Rs.
Computer &Equipments
Rs.
Furniture & Fittings
Rs.
Furniture & Fittings
Rs.
Motor Vehicles
Rs.
Motor Vehicles
Rs.
Total
Rs.
Total
Rs.
LeaseholdImprovements
Rs.
LeaseholdImprovements
Rs.
Cost or Valuation
Cost or Valuation
At Cost
245,353,657
188,612,501
2019
Balance as at 31 March
(Less): Accumulated depreciation
Balance as at 31 March
Net book value as at 31 March
Balance as at 31 March
(Less): Accumulated depreciation
Balance as at 31 March
Net book value as at 31 March
2019Rs.
2018Rs.

UB Finance
Fair Valuation Process and Key Valuation Assumptions 19.4
19.5
19.6
2019Rs.
2018Rs.
20.
449,459,725
(119,588,734)
329,870,991
363,502,884
(175,230,023)
188,272,861
DEFERRED TAXATION
Statement of Financial Position
Deferred Tax Assets
Deferred Tax Liability
Net Deferred Tax Asset
Deferred Tax Assets/ (Liabilities) Movement
Balance as at the year end

Annual Report 2019
2019Rs.
2018Rs.DUE TO BANKS
DUE TO OTHER CUSTOMERS
Due to Other Customers - By Products
OTHER BORROWED FUNDS
FINANCIAL LIABILITIES
NON FINANCIAL LIABILITIES
DUE TO BANKS
Securitised Borrowings and Other Bank Facilities
21.
22
22.1
23.
23.1
24
25
156,482,133
7,219,951,634
7,219,951,634
2,725,340,507
151,969,768
7,237,344,201
7,237,344,201
2,225,701,258
107,690,424 230,495,647
122,084,845 103,551,734
2,725,340,507
2,225,701,258
1,250,614,923
1,276,255,262
1,474,725,584
949,445,996
2019Rs.
2018Rs.
2019Rs.
2018Rs.
2019Rs.
2018Rs.
2019Rs.
2018Rs.
2019Rs.
2018Rs.
Rs.
Rs.
Rs.
Rs.
Rs.
Rs.
Rs.
Rs.
Rs.
Rs.
Rs.
Rs.
2019 2018
Amount repayabale
within 1 year
As at 01.04.2018
Amount repayabale
within 1 year
CapitalRepayment
Amount repayabale after 1 year
Loans Obtained
Amount repayabale after 1 year
Interest
Total
Interest Recognised
Total
As at 31.03.2019
Notes

UB Finance
Amount recognised in Income Statement
Amount recognised in Other Comprehensive Income
The principal assumptions used in determining Post Employment Liability are shown below;
Within Next 12 Months
POST EMPLOYMENT LIABILITY 26
26.1
26.2
26.3
26.4
26.5
26.6
26.7
The movement of the Post Employment Liability of the Company is given below;
Notes 2019Rs.
2018Rs.
17,122,708
4,338,867
979,092
12,790,282
3,723,694
(5,378,191)
2019Rs.
2018Rs.
2018Rs.
2019 2018
2019Rs.
2019Rs.

Annual Report 2019
27
27.1
28
28.1
29
STATED CAPITAL
Capital Management
Balance as at 31 March
STATUTORY RESERVE FUND
2019Rs.
2018Rs.
2019Rs.
2018Rs.
2019Rs.
2018Rs.
66,854,606 52,044,800
(353,602,325) (2,051,627,141)
ACCUMULATED LOSS
Balance as at 31 March
Notes

UB Finance
COMMITMENTS AND CONTINGENCIES
Capital commitments
Lease Arrangements
Operating Lease Commitments - Company as Lessee
Litigations against the Company
Litigations against UB Finance Company Limited
e
30
30.1
30.1
30.2
2019Rs.
2019Rs.
2018Rs.
2018Rs.
107,158,292
155,155,810
71,798,965
186,629,560

Annual Report 2019
COMMITMENTS AND CONTINGENCIES (Contd…)
Contingent Liabilities
Capital Commitments
30
30.3
30.4

UB Finance
31
31.1
31.2
31.3
FAIR VALUE OF ASSETS AND LIABILITIES
Assets and Liabilities recorded at fair value
Financial instruments at fair value through other comprehensive income/Financial investments - Available for sale
Valuation Model
Valuation Framework Cash and Cash Equivalents
Finance Receivables (Loans, Lease Rentals Receivable & Stock out on Hire)
Other Financial Assets

Annual Report 2019
Assets and liabilities measured at fair value - fair value hierarchy
Assets for which fair value approximates carrying value
31.4
31.5
Financial Assets measured at fair value
Financial Investments at fair value through other comprehensive income
Non Financial Assets
Financial Assets measured at fair value
Financial Investments - Available for sale
Non Financial Assets
Level 1Rs.
Level 1Rs.
Level 2Rs.
Level 2Rs.
Level 3Rs.
Level 3Rs.
Total Rs.
Total Rs.
2019
2018
-
-
-
-
91,468,400
91,468,400
91,468,400
91,468,400

UB Finance
RISK MANAGEMENT
Introduction
Financial Assets
Financial Liabilities
Financial Assets
Financial Liabilities
Assets :
Liabilities :
Level 1
Fair Value
Fair Value
Level 1
Level 3Level 2
Level 2 Level 3
Carryingamount
Carryingamount
Carrying amount
FairValue
FairValue
2019
2018
31.5
32
32.1
9,370,405,244
9,851,749,500
9,498,133,491
7,278,724,778
9,370,405,244
9,851,749,500
9,498,133,491
7,278,724,778
8,785,229,424
9,945,292,141
9,452,656,902
9,463,045,459
-
---
-
---
-
---
-
---
Rs.
Rs.
Rs.
Rs.
Rs.
Rs.
Rs.
Rs.
Rs.
Rs.
2019Rs.
2018Rs.

Annual Report 2019
32.2 Risk management structure
32.3 Risk measurement and reporting systems
32.4 Risk mitigation
32.5 Excessive risk concentration
32.6 Credit Risk
32. RISK MANAGEMENT (Contd...)

UB Finance
32.7 Impairment Assessment
NeitherPast Due
Nor Impaired Rs.
3 to 6 Months
Past Due But Not Impaired *
Less than 3 Months
Past Due but Not Impaired
Rs.
6 to 12 Months
Individually Impaired
Rs.
More than 12 Months
Total Rs.
Total
As at 31 March 2019
5,214,015,986
5,531,832,366
755,120,965
11,500,969,317 Total Financial Assets
32.8 Credit Quality by Class of Financial Assets
NeitherPast Due
Nor Impaired Rs.
3 to 6 Months
Past Due But Not Impaired *
Less than 3 Months
Past Due but Not Impaired
Rs.
6 to 12 Months
Individually Impaired
Rs.
More than 12 Months
Total Rs.
Total
As at 31 March 2018Assets
3,820,188,432
6,760,187,483
503,906,795
11,084,282,710 Total Financial Assets

Annual Report 2019
32.9 Analysis of Credit Risk Exposure
As at 31 March
Total Financial Assets
2019 2018
Maximum Exposure to Credit Risk
Rs.
Maximum Exposure to Credit Risk
Rs.
Net Exposure Credit Risk
Rs.
Net Exposure Credit Risk
Rs.
10,314,153,208
10,525,440,625
3,369,019,236
1,628,705,940
32.10 Credit–related commitment risks
32.11 Collateral and other credit enhancements:
• • • •
•
•
•
•

UB Finance
32.1
2
32.
R
ISK
MAN
AGEM
ENT
(Con
td...
)
Anal
ysis
of
risk
con
cent
rati
on
523
,243
,191
Agri
cult
ure
Rs.
Cons
truc
tion
&
Tra
nspo
rtRs
.
Trad
ing
&
Man
ufac
turi
ngRs
.
Serv
ices
Incl
udin
g Fi
nanc
ial
Serv
ices
Rs.
Oth
erRs
.To
tal
Rs.
505
,477
,056
Agri
cult
ure
Rs.
989
,771
,716
1,0
76,7
82,0
28
3,1
68,0
47,6
49
3,2
35,4
84,7
61
2,1
28,5
52,3
62
2,1
81,6
82,1
01
3,5
04,5
38,2
91
3,5
26,0
14,6
80
10,
314,
153,
208
10,
525,
440,
626
Cons
truc
tion
&
Tran
spor
tRs
.
Trad
ing
&
Man
ufac
turi
ngRs
.
Serv
ices
Incl
udin
g Fi
nanc
ial
Serv
ices
Rs.
Oth
erRs
.To
tal
Rs.
As a
t 3
1 M
arch
201
9
Fina
ncia
l As
sets
Tota
l Fi
nanc
ial
Asse
ts
As a
t 3
1 M
arch
201
8
Fina
ncia
l As
sets
Tota
l Fi
nanc
ial
Asse
ts

Annual Report 2019
Liabilities
Assets
20193 to 12 Months
Less than3 Months
1 to 5 Years
Over 5 Years
Total Balances
4,856,163,900
2,991,116,701
2,829,230,810
3,701,434,547
6,126,748,538
5,081,607,740
277,235,931
-
14,089,379,180
11,774,158,988
32. RISK MANAGEMENT (Contd...)
32.13 Liquidity risk and funding management
Advances to Deposit Ratios
2019
2019
2018
2018
Liquid Asset Ratios

UB Finance
32. RISK MANAGEMENT (Contd...)
32.13 Liquidity risk and funding management (Contd..)
32.14
Interest Rate Risk
2018Assets
3 to 12 Months
Less than3 Months
1 to 5 Years
Over 5 Years
Total Balances
3,812,035,528
2,766,982,134
3,000,145,352
4,024,721,848
7,028,392,392
4,778,057,965
200,900
-
13,840,774,172
11,569,761,947
Liabilities

Annual Report 2019
32.1
4.1
Int
eres
t Ra
te R
isk
Expo
sure
on
Fina
ncia
l As
sets
and
Lia
bili
ties
32.1
4
Inte
rest
Rat
e Ri
sk (
Cont
d...)
Up
to 3
M
onth
sRs
.
03-1
2 M
onth
sRs
.
01-0
5 Ye
ars
Rs.
Ove
r 05
Ye
ars
Rs.
Non
Inte
rest
Be
arin
gRs
.
Tota
l as
at
31/0
3/20
19
Rs.
As a
t 3
1 M
arch
201
9
Fina
ncia
l As
sets
Fina
ncia
l Li
abil
itie
s
INTE
REST
SEN
SITI
VITY
GAP
2,0
95,3
73,8
55
3,3
15,9
62,3
86
(1,
220,
588,
531)
2,5
80,9
15,1
08
3,0
13,3
21,1
45
(43
2,40
6,03
7)
4,8
51,2
75,6
52
3,6
33,1
88,9
83
1,2
18,0
86,6
69
309
,230
,362
309
,230
,362
477
,358
,232
246
,992
,185
230
,366
,046
10,
314,
153,
209
10,
209,
464,
699
104
,688
,510

UB Finance
Up
to 3
M
onth
sRs
.
03-1
2 M
onth
sRs
.
01-0
5 Ye
ars
Rs.
Ove
r 05
Ye
ars
Rs.
Non
Inte
rest
Be
arin
gRs
.
Tota
l as
at
31/0
3/20
18
Rs.
2,4
84,2
78,1
68
3,0
83,0
89,4
98
(598
,811
,330
)
2,1
63,3
13,9
00
3,1
86,5
09,4
35
(1,0
23,1
95,5
35)
5,1
20,8
56,9
12
3,3
45,4
16,2
94
1,7
75,4
40,6
18
298
,563
,812
298
,563
,812
458
,427
,833
230
,495
,648
227
,932
,184
10,
525,
440,
624
9,8
45,5
10,8
75
679
,929
,750
32.1
4.1
Int
eres
t Ra
te R
isk
Expo
sure
on
Fina
ncia
l As
sets
and
Lia
bili
ties
(Co
ntd.
..)
As a
t 3
1 M
arch
201
8
Fina
ncia
l As
sets
Fina
ncia
l Li
abil
itie
s
INTE
REST
SEN
SITI
VITY
GAP

Annual Report 2019
32.14.2 Interest Rate Sensitivity
Net Interest Income (NII) Sensitivity by Interest Rate Change
Parallel Increase/Decrease of Rate
2019 2018
32.14.3
Assets
Liabilities
Total Equity & Liabilities
3 to 12 Months
Less than3 Months
1 to 5 Years
Over 5 Years
Total Balances
2,635,634,673
3,169,050,034
2,634,993,770
3,073,027,863
4,963,659,854
4,097,398,906
892,390,531
787,202,024
11,126,678,828
11,126,678,828
As at 31 March 2019
Current and Non Current Analysis of Assets and Liabilities

UB Finance
33.
34.
As at 31 March 2018
Description ofProperty
Description ofProperty
Nature ofEncumbrance
Nature ofEncumbrance
Included Under
Included Under
Carrying Amount ofAssets Pledged Rs.
Assets Pledged Rs.
32.14.3 Current and Non Current Analysis of Assets and Liabilities (Contd..)
EVENTS AFTER THE REPORTING PERIOD
ASSETS PLEDGED
32. RISK MANAGEMENT (Contd...)
Assets
Liabilities
Total Equity & Liabilities
3 to 12 Months
Less than3 Months
1 to 5 Years
Over 5 Years
Total BalancesAs at 31 March 2018
As at 31 March 2019

Annual Report 2019
Statement of Financial Position Reported Under
Liabilities
Statement of Comprehensive Income
Transactions with Parent Company Reported UnderStatement of Financial Position Liabilities
Statement of Comprehensive Income
Other Transactions
35.
35.1
35.2
35.3
35.4
RELATED PARTY DISCLOSURES
Transactions with Key Management Personnel
Key Management Personnel Compensation
2019Rs.
2019Rs.
2018Rs.
2018Rs.
Transactions, arrangements and agreements with Key Management Personnel and their close members of the family of the company
6,588,350
615,198
15,228,131
1,465,826
781,250,000 847,916,667
137,780,503 97,343,634
(66,666,667)
(70,833,333)
Transactions with Other Related Parties
Transactions with parent Company - Union Bank of Colombo PLC.
2019Rs.
2018Rs.
36,960,682
32,701,670

UB Finance
36.
SEG
MEN
T IN
FORM
ATIO
N
Leas
e
Rs.
Hir
e Pu
rcha
se
Rs.
Fact
orin
g
Rs.
Spec
ial
Purp
ose
and
Hir
e Pu
rcha
se L
oans
Rs.
Hou
sing
Lo
ans
Rs.
Oth
ers
Rs.
Tota
l
Rs.
2019
Net
Inte
rest
Inco
me
Net
Fee
and
Com
mis
sion
Inco
me
Tota
l O
pera
ting
Inco
me
Net
Ope
rati
ng In
com
e
/ (L
oss)
Bef
ore
Taxa
tion
/ (L
oss)
for
the
Yea
r
53
9,95
1,55
5 27
8,32
9,76
0
278
,329
,760
278
,329
,760
5,
382,
785
4,00
0,11
9
4,0
00,1
19
4,0
00,1
19
5,
212,
713
(83,
196,
477)
(83
,196
,477
)
(83
,196
,477
)
(2
9,26
5,87
8) (7
7,51
6,77
5)
(77
,516
,775
)
(77
,516
,775
)
(1
6,16
8,61
0) (2
4,14
8,47
8)
(24
,148
,478
)
(24
,148
,478
)
66
,772
,241
1,
909,
203
(51
,273
,671
)
(77
,320
,718
)
57
1,88
4,80
6 99
,377
,352
46,
194,
478
20,
147,
430

Annual Report 2019
2018
Net
Inte
rest
Inco
me
Net
Fee
and
Com
mis
sion
Inco
me
Tota
l O
pera
ting
Inco
me
Net
Ope
rati
ng In
com
e
/ (L
oss)
Bef
ore
Taxa
tion
/ (L
oss)
for
the
Yea
r
36.
SEG
MEN
T IN
FORM
ATIO
N (
Cont
d..)
Leas
e
Rs.
Hir
e Pu
rcha
se
Rs.
Fact
orin
g
Rs.
Spec
ial
Purp
ose
and
Hir
e Pu
rcha
se L
oans
Rs.
Hou
sing
Lo
ans
Rs.
Oth
ers
Rs.
Tota
l
Rs.
374
,577
,379
21,
302,
339
395
,879
,718
308
,232
,657
72,
612,
629
72,
612,
629
72,
612,
629
13,
399,
023
273
,579
13,
672,
602
15,
653,
267
13,
476,
800
13,
476,
800
13,
476,
800
141
,851
,829
20,
181,
637
162
,033
,466
121,
920,
039
50,
014,
133
50,
014,
133
50,
014,
133
26,
420,
296
5,5
93,2
48
32,
013,
544
(5,
189,
972)
(96
,417
,876
)
(96
,417
,876
(96
,417
,876
)
(22
,872
,934
) 1
(1)
(22
,872
,935
)
(18
,434
,826
)
(25
,522
,605
)
(25
,522
,605
)
(25
,522
,605
)
79,
294,
551
4,6
90,0
18
105
,104
,651
131,
514,
317
125
,419
,917
125
,419
,917
125
,419
,917
612
,670
,144
52,
040,
820
685
,831
,046
553,
695,
483
139
,582
,997
88,
261,
309
71,
868,
790
UB Finance
Matara


