43
UBI 2019-2020 Business Plan 27 th June 2016
UBI 2019-2020 Business Plan
27thJune 2016
1

Key messages of the Business Plan
• Business Plan objectives are distributed equally over threecomponents, revenues, operating expenses and credit, by means of thefollowing:following:- Transition from a federal model to a Single Bank, with confirmation of our close
relationship with the territories
- An innovative approach on “Persons and Families” and “Businesses”
- Evolution of the Distribution Model
- Maintenance of strong discipline over costs
- Confirmation of a “best in class” asset quality and adequate provisioning for NonPerforming Exposures (NPEs) also by means of a partial re absorption of thePerforming Exposures (NPEs) also by means of a partial re-absorption of theshortfall
• Investments mainly to support the revenue component• Investments mainly to support the revenue component
• Substantial generation turnover
• A progressive return to value creation, confirming the fundamental solidityof the Group in observance of the often declared criteria we considerappropriate for a Q alit Bank
2
appropriate for a Quality Bank
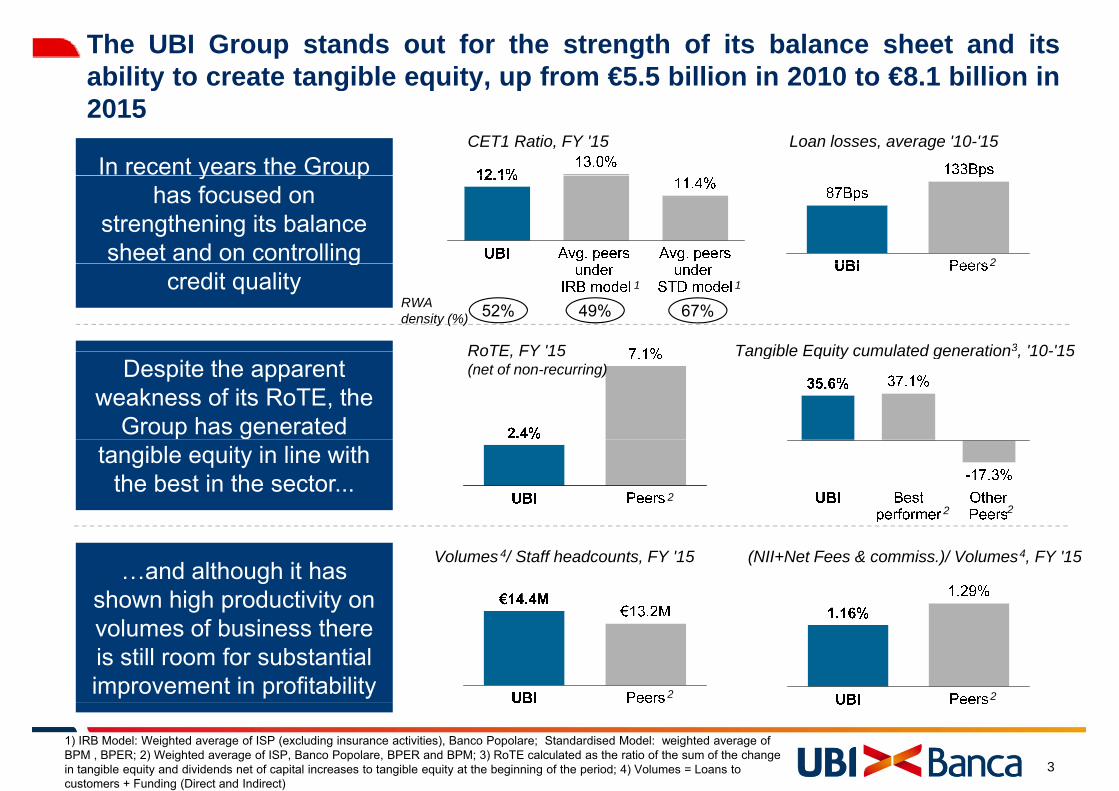
The UBI Group stands out for the strength of its balance sheet and itsability to create tangible equity, up from €5.5 billion in 2010 to €8.1 billion in
CET1 Ratio, FY '15 Loan losses, average '10-'15
y g q y, p2015
In recent years the Group
2
y phas focused on
strengthening its balance sheet and on controlling
RoTE FY '15 Tangible Equity cumulated generation3 '10-'15
2gcredit quality
52% 49% 67%RWAdensity (%)
1 1
RoTE, FY 15(net of non-recurring)
Tangible Equity cumulated generation , 10- 15Despite the apparent
weakness of its RoTE, the Group has generated
2
gtangible equity in line with
the best in the sector...22
(NII+Net Fees & commiss.)/ Volumes4, FY '15Volumes 4/ Staff headcounts, FY '15…and although it has
shown high productivity on volumes of business there is still room for substantial improvement in profitability 2 2
3
1) IRB Model: Weighted average of ISP (excluding insurance activities), Banco Popolare; Standardised Model: weighted average of BPM , BPER; 2) Weighted average of ISP, Banco Popolare, BPER and BPM; 3) RoTE calculated as the ratio of the sum of the change in tangible equity and dividends net of capital increases to tangible equity at the beginning of the period; 4) Volumes = Loans to customers + Funding (Direct and Indirect)

The background scenario to the Business Plan
GDP(YoY % change)
Average annual 3 E ib3m-Euribor
(% rate)
Macro-economic scenario
• Slow recovery in GDP affected also by a low contribution from demographictrends and by recent events
Banking • Profit margins still under pressure due to negative interest rates
R l t f k th t i i i l t i i t findustry • Regulatory framework that requires increasingly greater rigour in terms ofcapital, liquidity and IT investments
Social and economic context
• In recent years the economic crisis and the technological revolution have determinedstructural changes in the priorities of individual and business customer needs
4Source: Prometeia and the UBI Group Internal Studies Office

Business Plan guidelines
Transition from a federal model to a Single Bank, with confirmation of our close relationship with the territorySimplification and optimisation of Non Performing Exposures
Simplification of the baseline organisational
structure for the Simplification and optimisation of Non Performing Exposures (NPEs) managementBusiness Plan
Design of a new customer segment strategyChange of commercial
Evolution of the distribution model
Change of commercial approach
Balanced capital and financial structure
Continuation of activity to rationalise the cost baseC fi ti f
Investments and Enhancement of human resources
Continuation of activity to rationalise the cost baseConfirmation of structural strengths
Maintenance of best in class asset quality and of adequate coverage ratios on NPEs
O ff i d i 2016
Cost/Income, RoTE and CET1 among the best in class on completion of the Plan
One-off expenses recognised in 2016Income statement and balance sheet impacts
5
completion of the Plan

Single Bank: changing the federal model is an enabling factor for the Plan’s strategic decisionsg
Merger of the 7 Network Banks into UBI Banca by 1H 2017
Staff freed up by the Single Bank operation (#)
Expenses for the Single Bank operation €M
y
Elimination of operational inefficienciesRedundancy fund1
Other expenses
Branch clos res follo ing
Elimination of operational inefficiencies and optimisation of structures and
activities
Benefits on operating costs atBranch closures following optimisation of distribution network 2 (#)IT simplification with capacity freed up
and costs optimised
Benefits on operating costs at regime in 2018 - €M
To which tax benefits on
Optimisation of the branch network
Staff costOther expenses
benefits on intragroup
dividends are to be added3
pfootprint with the closure of around 130
branchesInternal profitability benchmark per customer for Network Banks (100 = base value)
Enabling of Internal transfer of best practices
6
1) Redundancy fund relating to the Single Bank Operation only. Total redundancy expenses of €323 million are expected over the course of the Plan2) Around 280 branch closures are planned over the course of the Business Plan. The figure of 130 relates to the Single Bank operation only3) For example, tax on intragroup dividends amounted to €7.8 million in 2015

The merger by incorporation of 7 Network Banks into UBI Banca will involve the purchase of minority interests in some subsidiaries…involve the purchase of minority interests in some subsidiaries…
Other minority shareholders
Other minority shareholders
Other minority shareholders
74.8% 83.8% 99.6% 99.99% 98.6%100% 100%
Other minority shareholders
16.2% 0.4% 0.01% 1.4%
0.3%24.9%
• The purchase of minority interests will take place mainly1 by swapping minority shares with newly issued• The purchase of minority interests will take place mainly by swapping minority shares with newly issuedUBI Banca shares
• The increase in the share capital, inclusive of marginal minority interests, will be up to a maximum of 75.8p g y pmillion new shares with a dilution effect of up to 7.8%, but with more than proportional benefits in terms ofprofits over the course of the plan (the share capital increase will be carried out at the same time of themerger deeds, once obtained the necessary authorisations, probably towards year-end 2016)
• The increase in the capital for the benefit of minority interests will be fully eligible for inclusion in the CET1capital, compared with the current limited eligibility under Basel 3 rules, with an estimated impact ofapprox. 30 bps
7
pp p
1) With the exclusion of savings and privileged shares paid for in cash
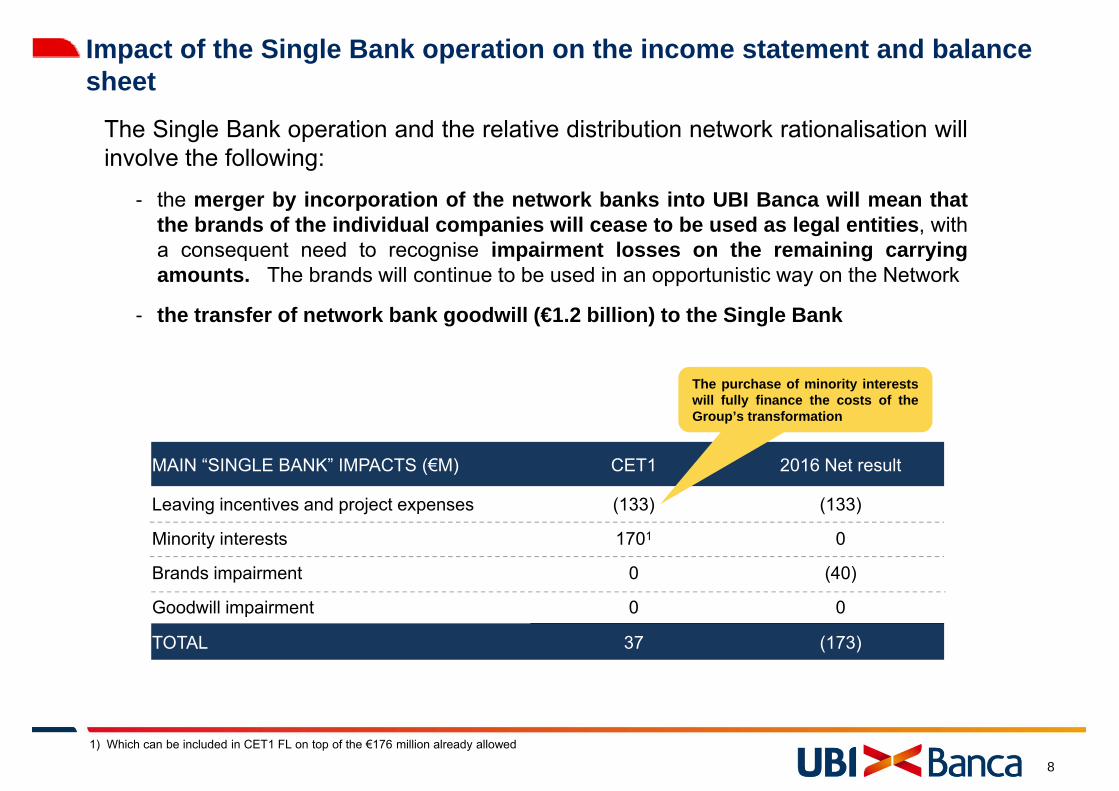
Impact of the Single Bank operation on the income statement and balance sheetsheet
The Single Bank operation and the relative distribution network rationalisation willinvolve the following:
- the merger by incorporation of the network banks into UBI Banca will mean thatthe brands of the individual companies will cease to be used as legal entities, witha consequent need to recognise impairment losses on the remaining carryingamounts. The brands will continue to be used in an opportunistic way on the Network
- the transfer of network bank goodwill (€1.2 billion) to the Single Bank
The purchase of minority interestswill fully finance the costs of theGroup’s transformation
MAIN “SINGLE BANK” IMPACTS (€M) CET1 2016 Net result
Leaving incentives and project expenses (133) (133)
Minority interests 1701 0
Brands impairment 0 (40)
Goodwill impairment 0 0p
TOTAL 37 (173)
8
1) Which can be included in CET1 FL on top of the €176 million already allowed
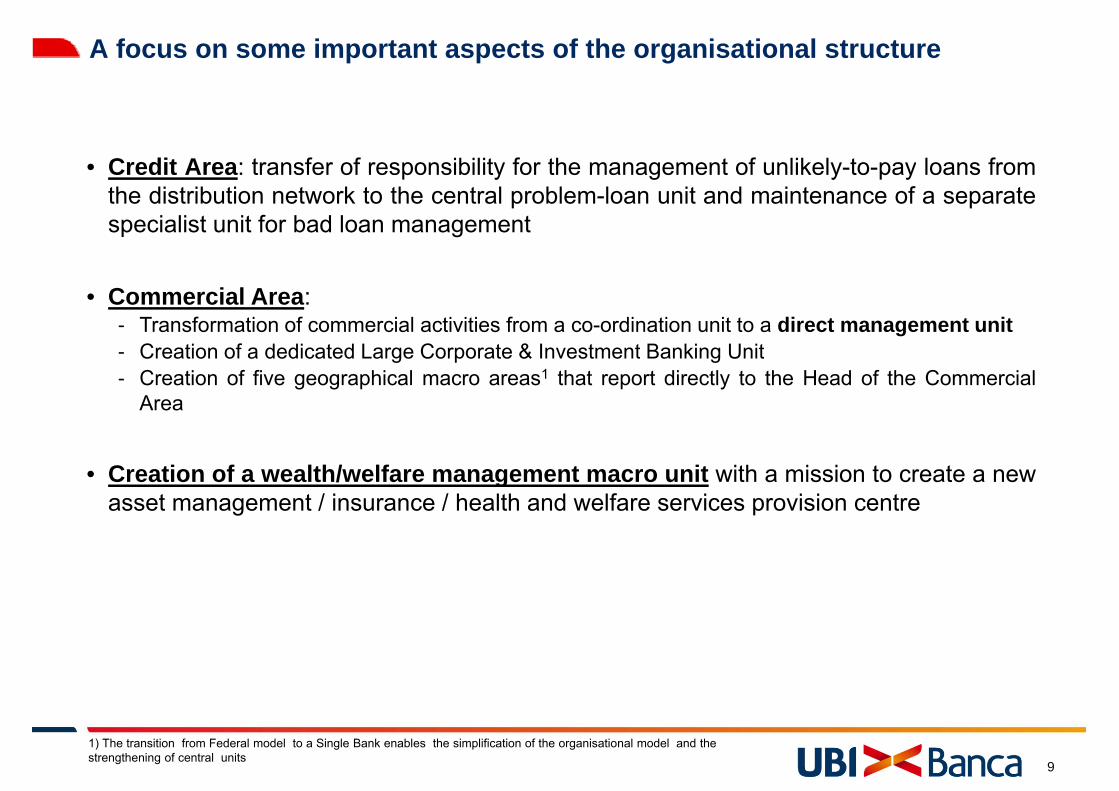
A focus on some important aspects of the organisational structure
• Credit Area: transfer of responsibility for the management of unlikely-to-pay loans fromp y g y p ythe distribution network to the central problem-loan unit and maintenance of a separatespecialist unit for bad loan management
• Commercial Area:- Transformation of commercial activities from a co-ordination unit to a direct management unit- Creation of a dedicated Large Corporate & Investment Banking Unit- Creation of a dedicated Large Corporate & Investment Banking Unit- Creation of five geographical macro areas1 that report directly to the Head of the Commercial
Area
• Creation of a wealth/welfare management macro unit with a mission to create a newasset management / insurance / health and welfare services provision centre
9
1) The transition from Federal model to a Single Bank enables the simplification of the organisational model and the strengthening of central units

UBI Banca presents a loan portfolio that reflects prudent risk management
Portfolio strongly backed by guarantees
Performing loans risk profileIRB perimeter, Network Banks +UBI Banca - 31 March 2016
Guarantees include collaterals and personal guarantees ontotal loan portfoliop
Total NPEs lower than the sector (2015)Gross non-performing exposures as a percentage of gross loans to customers
• The value of real estate collateral is1
3
The value of real estate collateral is updated every six months
• Average loan to value ratio of around 55%
High bad loan recovery rates (2015)Rate of bad loan recovery (%)2
55%
1
UBI came out as the best Italian bank in terms of CET1 ratio after the AQR exercise, which also confirmed the adequacy of its processes loan classification etc
10
1) Weighted average of ISP, Banco Popolare, BPER and BPM; 2) The recovery rate is taken from Section A.1.7 – Part E of the notes to the consolidated financial statements and consists of the ratio of payments received during the year (excluding disposals and/or write-offs) and the sum of gross outstanding bad loans at the beginning of the year, plus the gross inflow during the year; 3) Calculated on net loans
confirmed the adequacy of its processes, loan classification, etc.
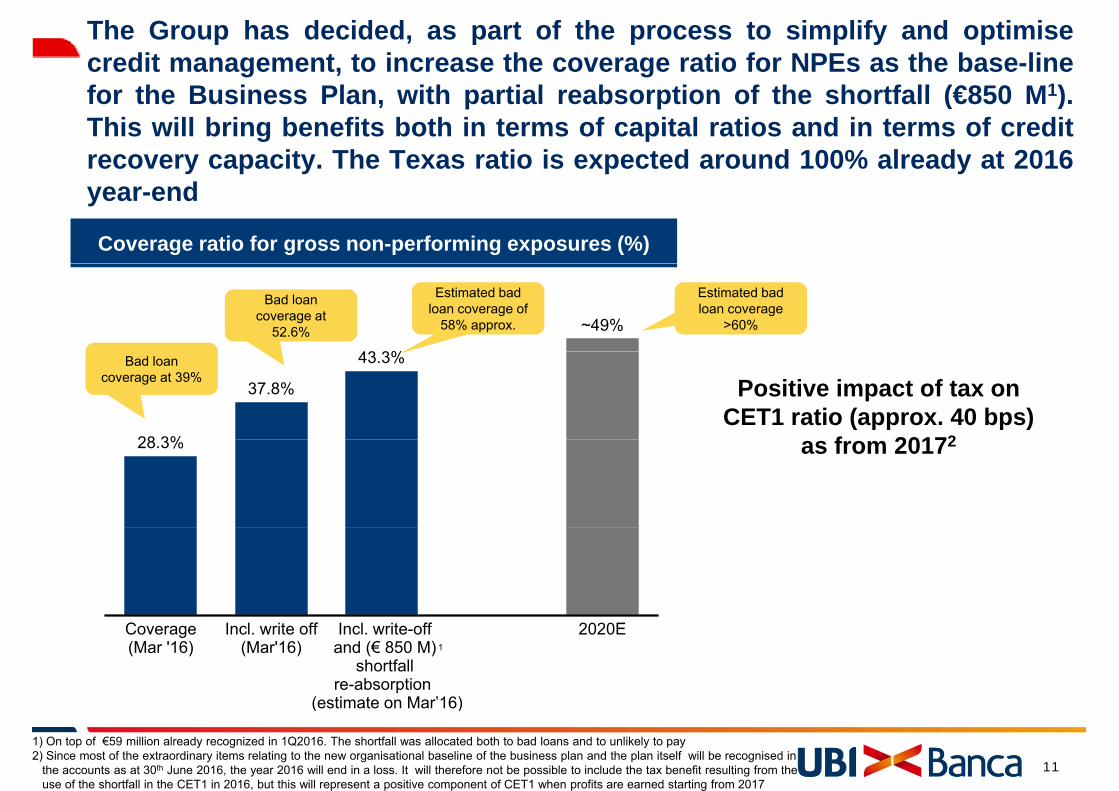
The Group has decided, as part of the process to simplify and optimisecredit management, to increase the coverage ratio for NPEs as the base-linef th B i Pl ith ti l b ti f th h tf ll (€850 M1)for the Business Plan, with partial reabsorption of the shortfall (€850 M1).This will bring benefits both in terms of capital ratios and in terms of creditrecovery capacity. The Texas ratio is expected around 100% already at 2016year-end
Coverage ratio for gross non-performing exposures (%)
43 3%
~49%
Estimated bad loan coverage of
58% approx.
Estimated bad loan coverage
>60%
Bad loan coverage at
52.6%
28 3%
37.8%
43.3%
Positive impact of tax on CET1 ratio (approx. 40 bps)
f 20172
Bad loan coverage at 39%
28.3% as from 20172
Coverage(Mar '16)
Incl. write off(Mar'16)
2020EIncl. write-offand (€ 850 M)
shortfallre-absorption
(estimate on Mar’16)
1
11
(estimate on Mar 16)
1) On top of €59 million already recognized in 1Q2016. The shortfall was allocated both to bad loans and to unlikely to pay2) Since most of the extraordinary items relating to the new organisational baseline of the business plan and the plan itself will be recognised in
the accounts as at 30th June 2016, the year 2016 will end in a loss. It will therefore not be possible to include the tax benefit resulting from theuse of the shortfall in the CET1 in 2016, but this will represent a positive component of CET1 when profits are earned starting from 2017

Business Plan guidelines
Transition from a federal model to a Single Bank, with confirmation of our close relationship with the territory
Si lifi ti d ti i ti f NPE t
Simplification of the baseline organisational
structure for the Simplification and optimisation of NPEs managementBusiness Plan
Design of a new customer segment strategyChange of commercial
Evolution of the distribution model
Change of commercial approach
Balanced capital and financial structure
Continuation of activity to rationalise the cost baseC fi ti f
Investments and Enhancement of human resources
Continuation of activity to rationalise the cost baseConfirmation of structural strengths
Maintenance of best in class asset quality and of adequate coverage ratios on NPEs
O ff i d i 2016
Cost/Income, RoTE and CET1 among the best in class on completion of the Plan
One-off expenses recognised in 2016Income statement and balance sheet impacts
12
completion of the Plan

The Segment Analysis shows upside opportunities which will be taken over the course of the Plan Product companies of excellencethe course of the Plan
Customer segments Other Group companies/product companiesGroup
Product companies of excellence to serve growth in different market
segments
Analysis by R RAC
Persons and
Families
Affluent and Private Banking
BusinessesTotal
customer segment shows upside
Toda
y
RoRAC
V l upside opportun-
ities…
Value creation
…that are det
RoRAC
grasped over the
course of the Plan
Targ
e
Value creation
1
Positive Positive but not full potential Negative
13
1) Positive value creation considering the contribution to consolidated results

Persons and Families (70% of total Group customers)
Up to the 1990s……from the 90s until before the
…during the crisis and post-crisis p
crisis…pyears
• Packages inclusive of • Pension and health• Current Accounts g- Mobile phones- Discounts on
entertainment and
coverage needs, notmet with adequateproducts offerings
• Cheque-books
• Mortgages + +leisure time
• Basic online services
• Prepaid cards
“ Health, a race to the private sector, but 11 million renounce treatment, hit by costs and waiting lists”
Il Sole 24 Ore June '16
+ +
• Prepaid cards Il Sole 24 Ore, June 16
“63% of pensions below €750”Il Sole 24 ore, March '16
• Evolved digitalisation and multichannel services
A change of approach is necessary to satisfy new customer needs
14
A change of approach is necessary to satisfy new customer needs

Persons and Families: customer segmentation by uniform needs
Business areas linked to needsBusiness areas linked to needs
Lif C l S t FiLife-Cycle Segments and relative needs
Manage payments
Finance consum-
ption
Purchase a home
Save for an objective
Manage savings Protection
Simplicity with
Singles
Young peopleSimplicity with
value for money
Easy availability of all services/Singles
Newly formed couples
savings
Purchase a home and plan
the future
Childless couples
Manage their savings
Couples with children
Put their family first
Maturity Enjoy their l i ti
SeniorSecurity of an
old-age without worries
Maturity leisure time
1515
o es

Persons and Families: a change in our way of banking, bringing it into line with new customer needs, combining quality and efficiency to create valuewith new customer needs, combining quality and efficiency to create value (1/2)
f Trends for direct and indirect funding (€B)F l
DESCRIPTION THE FIGURES
• Range of products and services organised around the life cycle, brought into line with new customer priorities and able to offer one-stop
Trends for direct and indirect funding (€B)
4.1% 4.0%
For example: . pensions, family planning, insurance wrapper , d l ti
CAGR
priorities and able to offer one stop shop solutions
• Enhancement of the product range in order to increase funding and Direct funding
Indirect funding
decumulation, discounts on health services/UBI care…
order to increase funding and customer loyalty
Direct funding
Trends for net loans (€B)
• Digitalisation of loans to private individuals, to be able to make
2.5% 2.3%For example: a loan proposal is made by means of a “push” notification following a
CAGR
individuals, to be able to make proposals at the time when the need arises
notification following a credit/debit card transaction
16

Persons and Families: a change in our way of banking, bringing it into line with new customer needs, combining quality and efficiency to create valuewith new customer needs, combining quality and efficiency to create value (2/2)
DESCRIPTION THE FIGURES
• Leverage on new technologies (Big Data and AdvancedAnalytics) to make the right commercial proposals
Customers already reclassified out of“Persons and Families” into the “Affluent”
t b i Bi D t l i i th
DESCRIPTION THE FIGURES
y ) g p psegment by using Big Data analysis in thefirst five months of 2016 (#)
• Simplification of customer relationships by means of digitalprocesses and a simple range of products: reduction of theproduct catalogue by over 30%
Multichannel customers already showed a strong increase in profitability in 2015 (%)
• Increase in contact time with customers as a result ofintegrated multichannel services (€20m already invested inDigital Innovation and a further €60m in the pipeline over the
strong increase in profitability in 2015 (%)
+78%
g p pcourse of the Plan)
17
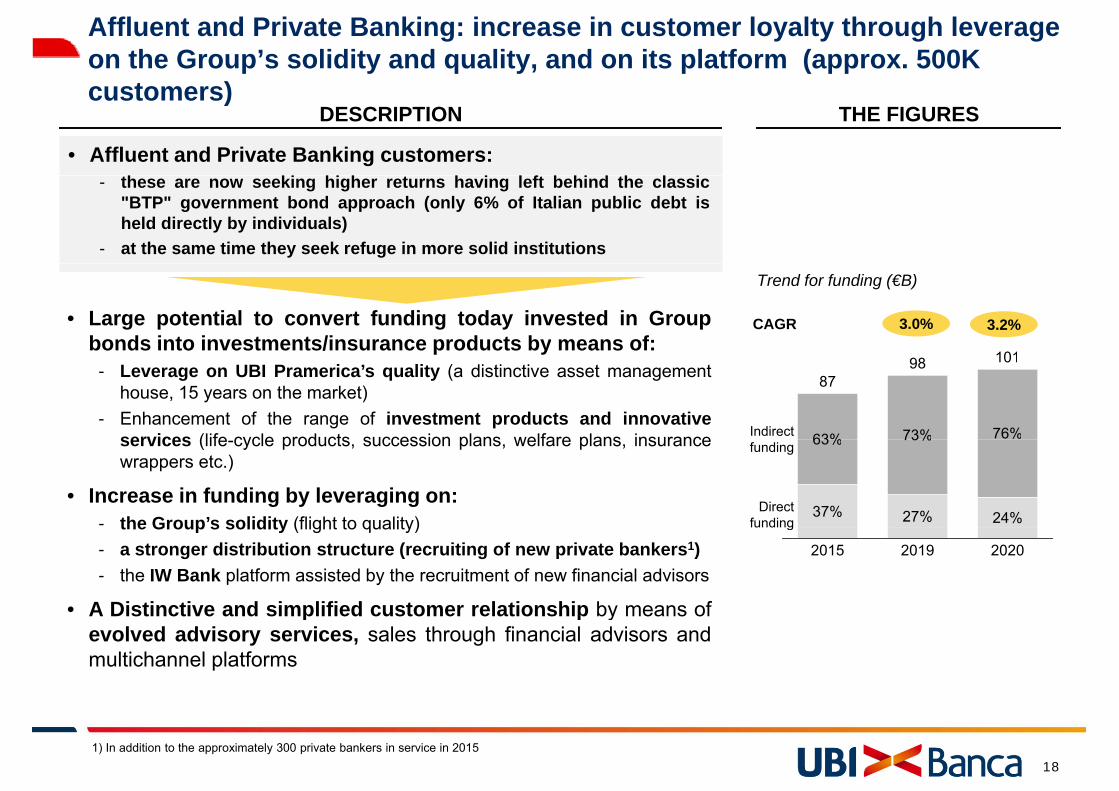
Affluent and Private Banking: increase in customer loyalty through leverage on the Group’s solidity and quality, and on its platform (approx. 500K customers)
• Affluent and Private Banking customers:h ki hi h h i l f b hi d h l i
customers)DESCRIPTION THE FIGURES
- these are now seeking higher returns having left behind the classic"BTP" government bond approach (only 6% of Italian public debt isheld directly by individuals)
- at the same time they seek refuge in more solid institutions
• Large potential to convert funding today invested in Groupbonds into investments/insurance products by means of:
Trend for funding (€B)
3.0% 3.2%CAGRp y
- Leverage on UBI Pramerica’s quality (a distinctive asset managementhouse, 15 years on the market)
- Enhancement of the range of investment products and innovativeservices (life cycle products succession plans welfare plans insurance 63%
87
73%
98
76%
101
Indirect services (life-cycle products, succession plans, welfare plans, insurancewrappers etc.)
• Increase in funding by leveraging on:- the Group’s solidity (flight to quality)
37%
63%
27%
73%
24%
funding
Direct fundingthe Group s solidity (flight to quality)
- a stronger distribution structure (recruiting of new private bankers1)- the IW Bank platform assisted by the recruitment of new financial advisors
• A Distinctive and simplified customer relationship by means of
2015 2019 2020
funding
A Distinctive and simplified customer relationship by means ofevolved advisory services, sales through financial advisors andmultichannel platforms
181) In addition to the approximately 300 private bankers in service in 2015

Businesses: the Group’s answers to current trends in the business world
Identification of business sectors • The relation with corporate clients based purely on negotiation of
terms and conditions is now increasingly a thing of the past with the best prospects and
recruitment of sector
terms and conditions is now increasingly a thing of the past
• Today businesses must be able to talk to staff who have a perfectcommand of the trends that businesses in the client’s sector areexperiencing
Rethinking the
specialistsexperiencing
• The Italian industry is an environment of medium-sized businessesi d th h i t l l h i ( 300 i t l l Rethinking the
underlying logics in the analysis of
Businesses also in
organised through virtual supply chains (approx. 300 virtual supplychains identified in the system with on average 100 businesses each)
• It is essential to identify and assess individual business clients not onlyin their guise as a company but also as part of the economic virtual Businesses also in
a virtual supply chain perspective
t e gu se as a co pa y but a so as pa t o t e eco o c tuasupply chain in which they operate:- A medium sized farm taken per se may not belong to an “excellent” risk
category, affected by its small operating size, but that positioning improvessignificantly if the business forms part of an integrated and successful foodsignificantly if the business forms part of an integrated and successful foodsupply chain
There is room in the market to support• The average size of Italian companies and their fragmentation limits market to support
medium to small size businesses in their growth processes
The average size of Italian companies and their fragmentation limitstheir capacity to compete in a global context
19
growth processes

Businesses: evolution of the approach with a sector/virtual supply chain perspective, confirming a prudent risk profile on over 300K Group clients…perspective, confirming a prudent risk profile on over 300K Group clients…
• UBI Banca has an important client base (more than 300K) ofhi h 40% l i k d t t ti l f th
DESCRIPTION THE FIGURES
which over 40% are low risk and present potential for theincrease in the share of wallet
• Strengthening of the relationship (UBI proposed as the
Trend for loans (€B)
2.7% 2.5%CAGR
42%
3642%
40
43%
41Strengthening of the relationship (UBI proposed as thereference bank) with local clients who already generate positivevalue for the Bank:
- 3,000 firms approx. have already been selected as targets for a new
BT
MLT
2015
58%
2019
58%
2020
57%3,000 firms approx. have already been selected as targets for a newcommercial proposition
- leveraging on historical relationships on local markets, specialisation ofthe corporate division with a sector/virtual supply chain specialist
MLT
approach: priority sectors already identified on which to focus commercial
efforts
industry specialist training already launched
Percentage of low risk loans on performing loan portfolio
industry specialist training already launched
investments in specialised tools dedicated to serve the virtualsupply chain (reverse factoring and IT) already provided for
- Support for businesses in their growth abroad and ininternationalisation
• Maintenance of a prudent risk profile
20

…and extension of Corporate & Investment Banking services to medium-to-small size businessessmall size businesses
DESCRIPTION THE FIGURES
• To become the reference bank on evolved services formedium-to-small size businesses with leverage on internalmedium-to-small size businesses with leverage on internalknow-how (former Centrobanca)
- UBI already has a significant market share for evolved
Trend for MLT loans (€B, commercial perimeter)
2.0% 1.4%CAGRUBI already has a significant market share for evolvedservices with a focus on medium-size clients
‣ 10% approx. of M&A market share for medium tolarge-size transactions
‣ 4th largest player in terms of volumes and number oft ti th C t L di d St t dtransactions on the Corporate Lending and StructuredFinance market
21

Distribution model: evolution in a multi-channel perspective, simplifying the branch network footprint and reviewing the branch conceptp g p
% of products sold to individualcustomers on all distribution channels• Innovative distribution model (approx. 80% implemented
DESCRIPTION THE FIGURES
Integrated multi-
channel distribution
customers on all distribution channels(branches, online, mobile, contact centre)by end of 2018) where:
- customers can, in any moment, access and operatewithout distinction on all channels (development andintegration of existing channels)distribution
network- the bank will use in a targeted way the different channels
to reach the customer with the right commercial offer
Number of points of sale (#)
Revision of the branch
network
• Simplification of the branch network with the closure ofnearly 280 points of sale by the end of the Plan (of which130 as part of the Single Bank operation)
• Expansion of the private banker network to serve private
-18%Number of points of sale (#)
1
network footprint
Expansion of the private banker network to serve privatebanking clients
• Enlargement of the IW Bank distribution network
The new
• Renewal of over 40% of the branch network with a strongdrive towards cashless banking, with consequent freeingup of commercial time
New concept branches over the course of the plan (#)
branch • Innovation of the branch concept which will include anew approach to receiving customers (introduction ofspecialist staff)
221) Network Banks perimeter as at 31 December 2015

Business Plan guidelines
Transition from a federal model to a Single Bank, with confirmation of our close relationship with the territory
Si lifi ti d ti i ti f NPE t
Simplification of the baseline organisational
structure for the Simplification and optimisation of NPEs managementBusiness Plan
Design of a new customer segment strategyChange of commercial
Evolution of the distribution model
Change of commercial approach
Balanced capital and financial structure
Continuation of activity to rationalise the cost baseC fi ti f
Investments and Enhancement of human resources
Continuation of activity to rationalise the cost baseConfirmation of structural strengths
Maintenance of best in class asset quality and of adequate coverage ratios on NPEs
O ff i d i 2016
Cost/Income, RoTE and CET1 among the best in class on completion of the Plan
One-off expenses recognised in 2016Income statement and balance sheet impacts
23
completion of the Plan
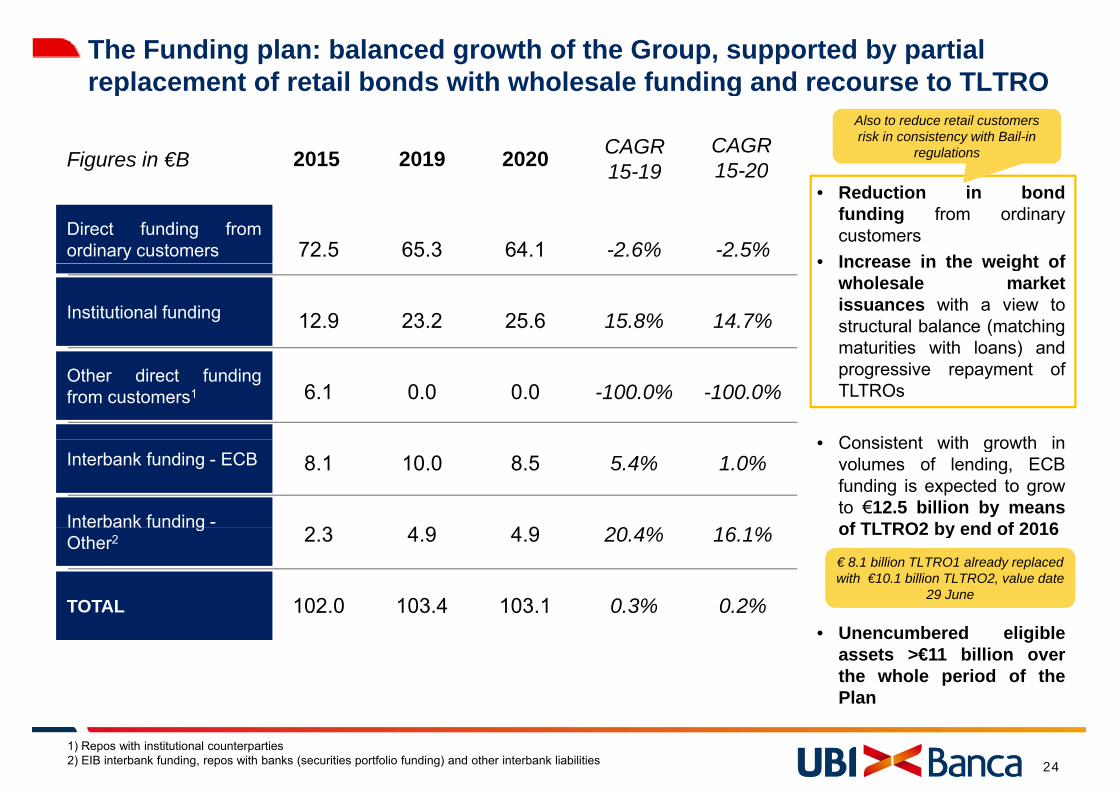
The Funding plan: balanced growth of the Group, supported by partial replacement of retail bonds with wholesale funding and recourse to TLTROreplacement of retail bonds with wholesale funding and recourse to TLTRO
2015 20202019 CAGR 15-19
CAGR 15-20Figures in €B
Also to reduce retail customers risk in consistency with Bail-in
regulations15 19 15 20
Direct funding fromordinary customers 72.5 65.3 64.1 -2.6% -2.5%
• Reduction in bondfunding from ordinarycustomers
• Increase in the weight of
Institutional funding 12.9 23.2 25.6 15.8% 14.7%
• Increase in the weight ofwholesale marketissuances with a view tostructural balance (matchingmaturities with loans) and
6.1 0.0 0.0 -100.0% -100.0%
maturities with loans) andprogressive repayment ofTLTROs
Consistent ith gro th in
Other direct fundingfrom customers1
Interbank funding - ECB
Interbank funding -
8.1 10.0 8.5 5.4% 1.0%
2 3 4 9 4 9 20 4% 16 1%
• Consistent with growth involumes of lending, ECBfunding is expected to growto €12.5 billion by meansof TLTRO2 by end of 2016Interbank funding
Other2
TOTAL
2.3 4.9 4.9 20.4% 16.1%
102.0 103.4 103.1 0.3% 0.2%
of TLTRO2 by end of 2016
€ 8.1 billion TLTRO1 already replaced with €10.1 billion TLTRO2, value date
29 June
• Unencumbered eligibleassets >€11 billion overthe whole period of thePlan
24
Plan
1) Repos with institutional counterparties2) EIB interbank funding, repos with banks (securities portfolio funding) and other interbank liabilities

The Securities portfolio: reduction and change in the mix with a view to diversificationdiversification
COMPOSITION OF THE SECURITIES PORTFOLIOValue at year end (€B)1
• Consistent with a recovery in volumes of
GUIDELINES FOR FUTURE TRENDS
Other2
• Consistent with a recovery in volumes ofcommercial lending over the course of theplan, the securities portfolio will be reducedto more contained levels
-31%
Corporate bonds
US Treasury bonds
- Reduction in the ratio between the size of thesecurities portfolio and Tangible Common Equityfrom 2.5 as at Dec 2015 to 1.5 in 2020
Euro Gov. bonds
- A reduction in the Group’s portfolio by €6 billion(-35% over the period 2015-2020) due mainly tothe sale of Italian government securities (-€11billion)
• Diversification of the portfolio through achange in the mix with an increase in euro
Italy Gov. bonds
garea government securities, with thepercentage of Italian government securitiesfalling from over 90% to below 50%
• Portfolio of unencumbered securities atthe service of the LCR for over €10 billion atthe end of the Plan
25
the end of the Plan
1) The securities portfolio does not include equity instruments and hedging derivatives2) Emerging markets (3% in 2020), Hedge Funds (1% in 2020), Equities (0% in 2020)

Investments of over € 850 M (including Redundancy fund) over the course of the Plan to support income and strengthen the Group structurallyof the Plan to support income and strengthen the Group structurally
ACCUMULATED CASH-OUT OVER THE PLAN €M MAIN INITIATIVESOVER THE PLAN – €M MAIN INITIATIVES
included in June2016 accounts
• Access to the solidarity fund for around 1,300 staff
2016 accounts
• Integrated multi-channel development/CRM
• Introduction of a short and modular product catalogue
• New platforms for corporate businesses and tools for private bankers
• Redesign of around 500 branches
• Development of Group technological infrastructure
• Single Bank Project related actions
• Other action to strengthen central and co-ordination units
26

Substantial generation turnover (approx. 2,750 staff leaving and over 1,100recruited) which ensures new expertise to support the change in our way ofb kibanking
ACTIONS CHANGES IN STAFF NUMBERS 2015-2020Use of the sector’s Solidarity fundi l ti t th i lifi ti f
Headcounts
Redund-ancy fund
in relation to the simplification ofoperational headquarters -distribution network (Single Bank,cashless branches, reduction of
ti i b h ) 1 65011 6501
~17,700Other Business
Pl
operations in branches)
Rationalisation of the Group’s non-core activities and processes
~ -1,6501~ -1,6501
Level reached already in 2019
~ -800
-1,300
~ 650
1,100 ~16,050Plan initiatives
G i
p
R it t f t ff t d lOf which ~200 at ~ -650Generation
turnoverRecruitment of new staff to developnew skills and expertise
Enhancement/development action:
~ 323€M which will be booked in
June 2016
March 20162
2015 Inertial Redundancyfund
OtherB.P.
Initiatives
Generationturnover
2020Enhance-ment of
p- Increase in variable remuneration
(expenses up 50% in 2020)- Increase in training (almost half a million
man/days over the plan)f
3
3
human resources
- Increase in flexible working thanks togreater use of smart working and work-lifebalance measures
- Extension of the talents programme(over 100 staff over the course of the plan)
271) Over 85% of exits scheduled within 2018 2) Trade union agreement end of 2015/start of 2016 – recruitment + natural attrition; 3) Includes around 600 staff due to natural attrition
( p )- …

Continuation of “harmonious” cost reduction despite investments to support growth in revenues and personnel developmentsupport growth in revenues and personnel development
ACTIONS PLANNED TREND FOR OPERATIONAL COSTS OVER THE PLAN
Efficien-
Increase in Operational efficiency following:
- Single Bank operation 2,431
-6%-6%-14%-14%1
cies - Cost optimisation initiatives- Increased personnel productivity
2,431
Includes savings on HR not included in the Single Bank operation, optimization of operational processes
Develop-
Investments to achieve Business Plan goals:
- Evolved tools to support business- New branch model
2,102
71 2,173
operational processes, renegotiation of supply contracts, etc…
1
ment - Human resource enhancement- Technological infrastructure
development
-80
-152
41 1,982Trend on a like-to-like
basis with ordinary actions
Generation Generation turnover also to bring innew knowledge/ expertise to supportB i Pl i iti ti
152
turnover Business Plan initiativesFY
2010FY
2015Inertial FY 2020
InertialSingleBank
CostOptimi-zation
Invest.to support
B.P.initiatives
FY 2020Piano
2 102 49 2 151 80 157 50 1 965
Trend 2019
2
28
1) Normalised data2) Impacts on 2020 income statement relating to expenses accumulated over the course of the plan to support revenues (€24M approx.) and other structural reinforcement intervention (17€M approx.)
2,102 49 2,151 -80 -157 50 1,965

Maintenance of “best in class” cost of risk with high coverage ratios
• Focus on organisational
Action planned The figures
TOTAL GROSS NON-PERFORMING LOAN LOSS PROVISIONS b
Total Gross NPEs peaked in 2015 and are expected to
decrease over the Plan
• Focus on organisationalstructure and improvement ofcredit recovery operations:- bad loans: the centralised
t f b d l l d i
EXPOSURES – €B LOAN LOSS PROVISIONS - bpsDecrease in NPE stocks and LLPs enabled by the reduction in new inflows of NPEs
already in progress over the last 3 years (latest figures: -40% Mar’16 /Mar ‘15)
management of bad loans - already inplace since 2009 with over 130 staff -is confirmed
- other NPEs: organisational changeswith the introduction of problem loan 84% of NPEs portfolio is backedwith the introduction of problem loanaccount managers reportingdirectly to the Chief Lending Officerwith over 200 staff inclusive ofcentral department and network
84% of NPEs portfolio is backed by guarantees. Real estate
collateral represents 79% of total guarantees
resources
• Reinforcement of monitoring
COVERAGE RATIO - %
Total Non-performing exposures1 Bad loans1gtools with the introduction ofevolved behavioural information(e.g. big data)
37.4%
~49% ~49%52.5%
~61% ~61%
• Creation of a ReoCo to support thevalue of real estate collateral
2015 2019 2020 2015 2019 2020
291) Inclusive of write-offs
2015 2019 2020 2015 2019 2020

Business Plan guidelines
Transition from a federal model to a Single Bank, with confirmation of our close relationship with the territory
Si lifi ti d ti i ti f NPE t
Simplification of the baseline organisational
structure for the Simplification and optimisation of NPEs managementBusiness Plan
Design of a new customer segment strategyChange of commercial
Evolution of the distribution model
Change of commercial approach
Balanced capital and financial structure
Continuation of activity to rationalise the cost baseC fi ti f
Investments and Enhancement of human resources
Continuation of activity to rationalise the cost baseConfirmation of structural strengths
Maintenance of best in class asset quality and of adequate coverage ratios on NPEs
O ff i d i 2016
Cost/Income, RoTE and CET1 among the best in class on completion of the Plan
One-off expenses recognised in 2016Income statement and balance sheet impacts
30
completion of the Plan

Over 95% of one-off costs relating to the simplification in the baselineorganisational structure and to the Business Plan recognised in P&L as at30 J 201630 June 2016
JUNE 2016 ONE-OFF INCOME STATEMENT IMPACTS – €M
Net Impact
Tax and minorities Impact
Gross Impact
428870 1,298
Shortfallreabsorption 300609 909
428 870 1,298
1
Redundancyfund 106217 323
Of which:- 59€M relating to 1Q 2016- 850€M relating to 2Q 2016
fundcontribution
106217 323
2040Notwithstanding P&L
60
1.53.5
BrandsWrite-off
Notwithstanding P&L one-off impacts, a dividend payment
is forecast in relation to the 2016 financial year, for an amount at least i li ith th t f th 2015FY i
Single Bankproject
expenses5
in line with that of the 2015FY, given that CET1 ratio will remain well above the SREP requirement
2
31
1) Since most of the extraordinary items relating to the new organisational baseline of the business plan and the plan itself will be recognised in the accountsas at 30th June 2016, the year 2016 will end in a loss. It will therefore not be possible to include the tax benefit resulting from the use of the shortfall in theCET1 in 2016, but this will represent a positive component of CET1 when profits are earned starting from 2017; 2) The expenses relating to the Single Bankoperation, for a total of approx. €43M, will be booked as follows: €5M in 2Q2016 and the remaining amount in 2H2016, according to the accrual criteria
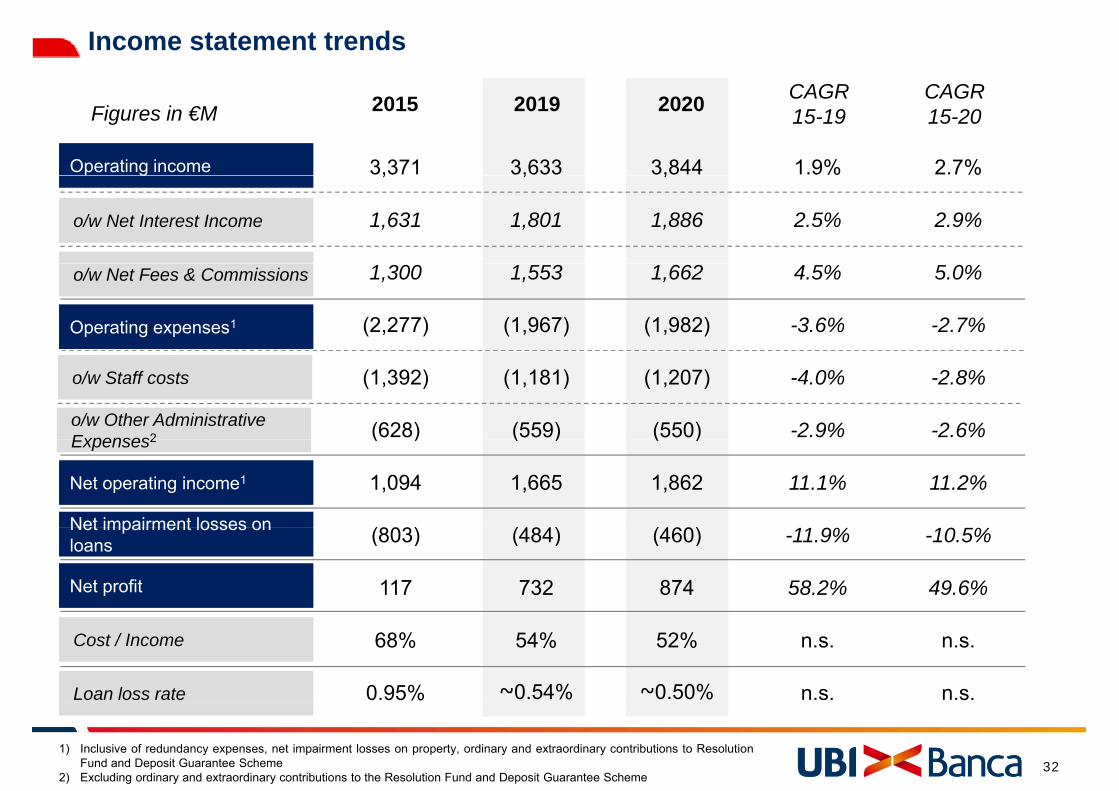
Income statement trends
CAGR CAGR
3,371 3,633 3,844 1.9% 2.7%
2015 20202019 CAGR 15-19
CAGR 15-20Figures in €M
Operating income , , ,
1,631 1,801 1,886 2.5% 2.9%
g
o/w Net Interest Income
1,300 1,553 1,662 4.5% 5.0%
(2,277) (1,967) (1,982) -3.6% -2.7%
o/w Net Fees & Commissions
Operating expenses1
(1,392) (1,181) (1,207) -4.0% -2.8%
(628) (559) (550) -2.9% -2.6%
o/w Staff costs
o/w Other Administrative Expenses2 ( ) ( ) ( )
1,094 1,665 1,862 11.1% 11.2%
( ) ( ) ( ) % %
Net operating income1
Net impairment losses on
Expenses2
(803) (484) (460) -11.9% -10.5%
117 732 874 58.2% 49.6%
Net impairment losses on loans
Net profit
68% 54% 52% n.s. n.s.
0.95% ~0.54% ~0.50% n.s. n.s.
Cost / Income
Loan loss rate
321) Inclusive of redundancy expenses, net impairment losses on property, ordinary and extraordinary contributions to Resolution
Fund and Deposit Guarantee Scheme2) Excluding ordinary and extraordinary contributions to the Resolution Fund and Deposit Guarantee Scheme

Trends for volumes of business with ordinary and institutional customers
84 6 88 9 92 0 1 3% 1 7%
Figures in €B
Net loans to c stomers
2015 20202019 CAGR 15-19
CAGR 15-20
Increase in AuM and bancassurance products driven by:
1) switch from direct funding84.6 88.9 92.0 1.3% 1.7%
74.9 81.7 85.1 2.2% 2.6%
Net loans to customers
o/w performing
1) switch from direct funding (bonds placed to ordinary customers) to indirect funding and from assets under custody to AuM and bancassurance
9.7 7.2 6.9 -7.0% -6.5%o/w non-performing
bancassurance
2) hiring of private bankers
3) leveraging on IW Bank network which will be
72.5 65.3 64.1 -2.6% -2.5%
79 5 100 4 107 9 6 0% 6 3%
Direct funding from ordinary customers
Indirect funding from
reinforced (+200 financial advisors during the course of the Business Plan)
4) leveraging on the i / lf79.5 100.4 107.9 6.0% 6.3%
31.0 28.1 28.8 -2.4% -1.5%
ordinary customers
o/w under custody
insurance/welfare component of the “Persons and Families” and “Affluent and Private” segments
48.6 72.3 79.1 10.4% 10.3%o/w AuM and bancassurance
T t l f di f di152.1 165.6 172.0 2.2% 2.5%
12 9 23 2 25 6 15 8% 14 7%
Total funding from ordinary customers
Institutional funding1
331) Interbank funding is excluded. Please, see slide 24
12.9 23.2 25.6 15.8% 14.7%Institutional funding
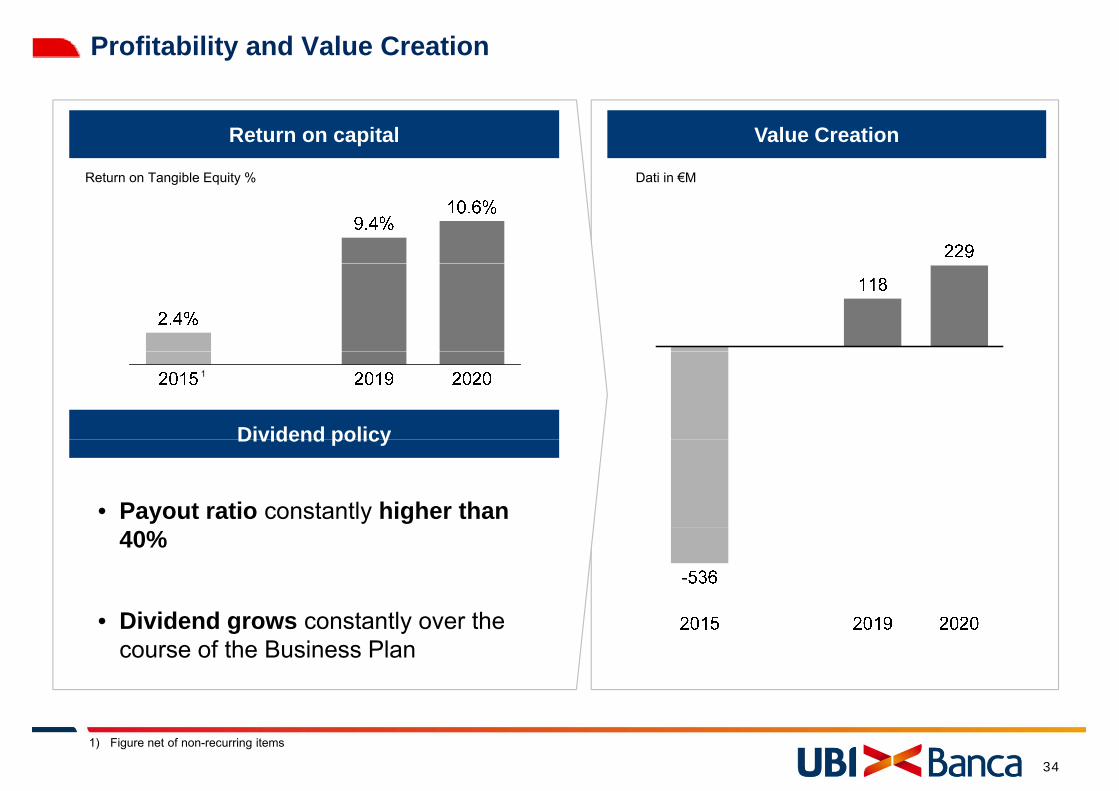
Profitability and Value Creation
Return on capital Value Creation
Dati in €MReturn on Tangible Equity % Dati in €MReturn on Tangible Equity %
Dividend policy
1
Dividend policy
• Payout ratio constantly higher than 40%
Di id d t tl th• Dividend grows constantly over the course of the Business Plan
34
1) Figure net of non-recurring items

Return to value creation through a balanced contribution between the threeordinary operating componentsy p g p
Ordinary operating components Other components
+€ 763 M
Value creation
componentscomponents and trend €M
1 2
Single operating component as a %
f t t l ti42% 27% 30%
of total operating components
Business Plan
Investments 72% 25% 3%
388 133 19€M
% of total
35
1) Higher taxes due to the trend for profits (no change in the tax rate is forecast)2) Mainly attributable to a ) Net impairment losses on other financial assets/liabilities. Provisions for risks and charges. Profit
(loss) on the disposal of equity investments. Profit (loss) for the year attributable to non-controlling interests.

Revenue growth supported by a reduction in funding costs and by the fee andcommission component – also driven by products linked to new priorities inp y p pcustomer needs
Trend for operating income €M of which: Trend for net interest income €Mp g
1- 34 €M volume effect+192 €M spread effect
276
41 1 886
+209 €M volume effect-75 €M spread effect+2 €M mix effect
+192 €M spread effect+118 €M mix effect +23 €M
TLTRO effect
1,631
136 -198
41 1,886
- 89 €M volume effect- 109 €M spread effect
2015 Interb.and
TLTRO
2020Loans Funding Financialassetsto/from customers
36
1) Figure stated includes non-recurring items (e.g. disposal of ICPBI)

Generation of profits over the course of the Plan drives strengthening of capital ratioscapital ratios
CET1 Ratio (fully loaded) %( y )
+1.2 pp
Includes neutral impact from the combination of the following:- new regulations (IFRS9, LGD default, etc.)- update of the models- other minor effects
37
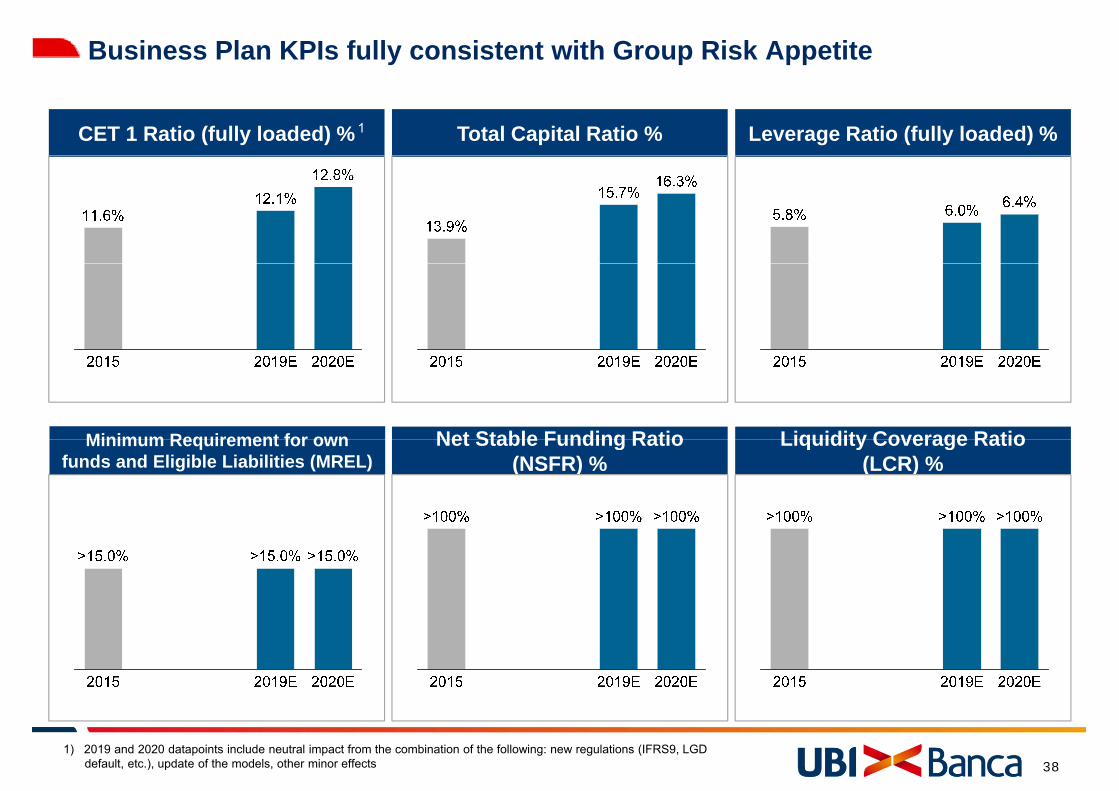
Business Plan KPIs fully consistent with Group Risk Appetite
CET 1 Ratio (fully loaded) % Leverage Ratio (fully loaded) %Total Capital Ratio %1
Liquidity Coverage RatioNet Stable Funding RatioMinimum Requirement for own Liquidity Coverage Ratio (LCR) %
Net Stable Funding Ratio (NSFR) %
Minimum Requirement for ownfunds and Eligible Liabilities (MREL)
381) 2019 and 2020 datapoints include neutral impact from the combination of the following: new regulations (IFRS9, LGD
default, etc.), update of the models, other minor effects

Business Plan objectives allow sustainable profits to be earned over time
Cost / Income Ratio (%) Texas Ratio (%) 1
~100%expected in 2016
Cost of Risk (Bps) Return on Tangible Equity (%)
22
391) Texas ratio calculated as net NPEs to customers on tangible equity (excluding profit for the year and including minorities) 2) Figure net of non-recurring items

Masterplan to implement the main initiatives of the Business Plan
Simplification of the b li
2020Macro work plan
2016 2017 2018 2019Transition to a Single Bank
NOT EXHAUSTIVE
baseline organisation for the
Business Plan
Revision of the organisational model
Entrance into force of new commercial approach to
Technological Infrastructure evolution
Entrance into force of new commercial approach to Persons & Families
Release of service model for Businesses by sector/virtual supply
chainIncrease in Private
Change of commercial approach
Increase in Private Banker staff numbers
New multi-channel platformEvolution Contact Centre
“Big Data”
approach p
Rationalisation of branch network footprint (first wave – Single Bank)
Rationalisation of branch network footprint (second wave)
Evolution of product company platforms
New branch concept
Product offerings evolution
Confirmation of structural strengths
Initiatives to rationalise cost base
Increase in new Problem loan unit staffing
Improvements to credit management tools and processes
40
Improvements to credit management tools and processes

Attachments
41

Performance indicators for the Italian economy and the Italian banking systemCagr
nom
y2010 2011 2012 2013 2014 2015 Delta % Cagr
10-15 %Italian GDP at current prices (€B) 1 1.605 1.637 1.613 1.604 1.612 1.636 2.0% 0.4%
alia
n ec
on Italian population (M) 2 59.2 59.4 59.7 59.7 60.8 60.8 2.7% 0.5%
3 Month Euribor % 3 0.8% 1.4% 0.6% 0.2% 0.2% 0.0% - -
Ita Inflation % 1 1.6 2.9 3.3 1.3 0.2 0.1 - -
Gross income(€B) 3 72.8 71.0 74.7 75.8 75.9 76.8 5.5% 1.1%
em
Core Revenues* (€B) 3 73.0 71.6 69.2 68.0 69.6 69.8 -4.3% -0.9%
Operating costs(€B) 3 47.3 47.9 47.0 44.8 45.8 47.5 0.3% 0.1%
Net impairment losses
king
Sys
te Net impairment losses on loans (€B) 3 12.6 13.8 24.2 31.4 30.2 21.0 66.6% 10.8%
Bad loans stock (€B) 3 77.8 107.2 125.0 155.9 183.7 200.9 158.1% 20.9%
Ban
k Total loans (€B) 3 1.733 1.753 1.761 1.691 1.658 1.659 -4.3% -0.9%
Bad loans on total loans % 3 4.5% 6.1% 7.1% 9.2% 11.1% 12.1% - -
Note: * Gross Income net of result for trading and fair value movements and net of other income
CET1 ** ratio 4 9.0% 9.3% 10.8% 11.6% 12.5% 13.6% 51.1% 10.9%
# of branches (K) 5 33.7 33.6 32.9 31.8 30.7 30.3 -10.1% -2.1%
42Sources: 1) ISTAT final figures. For inflation rate, yearly average data, IPCA index; 2) ISTAT as at 1st January; 3) Prometeia, Bank Financial Statements, April 2016 ; 4) EBA Risk Dashboard – 4Q 2015; 5) Bank of Italy
g** This is the Tier 1 ratio excluding “hybrid” capital instruments for December 2013

In December 2015 the UBI Group had 1,550 branches in Italy of which over 1,000 located in three regions that generate approx. 40% of GDP and exports
Distribution of UBI branchesDistribution of UBI branches# branches
(principal regions)Loans 1UBI %
Deposits1
UBI %Per capita GDP
(€ - 2014)% of
export2Market shares % of total
GDPBranches Loans Deposits
12.6% 9.4% 8.4% 67.3% 60.4%
6.9% 5.2% 4.7% 6.2% 7.9% 11%8%
27%22%
4.2% 3.0% 2.8% 5.7% 8.0%
7 3% 4 8% 5 8% 2 3% 4 5%
5%12%
2%4%7.3% 4.8% 5.8% 2.3% 4.5%
18.3% 13.5% 18.8% 1.8% 4.4%
2%4%
0%2%
7.5% 8.9% 6.9% 4.1% 3.9%
5.3% 4.4% 3.9% 2.7% 4.0%
3%2%
2%6%
1.4% 1.7% 0.7% 2.6% 1.4%
4.4% 6.8% 3.6% 2.7% 2.0% UBI Market Share:
14%9%
2%3%
0.9% 1.1% 0.5% 1.8% 1.0%
1 0% 0 8% 0 6% 2 7% 2 6%
≥10%
5% - 10%≤5%
Core Regions
14%9%
43
1.0% 0.8% 0.6% 2.7% 2.6%
Sources: Bank of Italy, UBI branch database (data as at 31/12/2015), ISTAT: GDP 2014, export 2015 Notes: 1) Sum of business and household customers; 2) Share of country’s total exports
Core RegionsUBI ~30€K


