UBL-Binding Domain of Ufd2 SUPPLEMENTAL DATA Experimental Procedures Construct DesignPlasmids pGEX-4T1-Ufd2, pGEX-4T1-Rad23, and pGEX-Dsk2 for the expression of N-terminally GST-tagged Saccharomyces cerevisiae Ufd2, Rad23, and Dsk2 were kindly provided by Stefan Jentsch. The UBL domains of Rad23 (aa 1-84) and Dsk2 (aa 1-79 and aa 1-84) were PCR amplified and inserted into the pET21b vector (Novagen, C-terminal His-tag, NdeI/BamHI). N-terminal His-tagged Rad23-UBL (aa 1-74) and Dsk2-UBL (aa 1-74) were cloned additionally from chromosomal DNA into the vector pETM11 (EMBL Heidelberg, NcoI/XhoI). C-terminal GST-tagged Ufd2 expression plasmid: The open reading frame (ORF) of Ufd2 was PCR amplified and inserted into the pET3a-GST plasmid (NdeI/ApaI). The pET3a- GST plasmid was generated by cloning the GST-encoding ORF of pGEX-4T1 (GE-Healthcare) into the pET3a vector (Novagen, ApaI/BamHI) (Sven Eiselein). C-terminally GST-tagged Ufd2 was used to compare and validate the optimal binding of N-terminally GST-tagged Ufd2 with the UBL domains in the SPR interaction studies. For cloning of the Schizosaccharomyces pombe homolog of Ufd2 and the UBL domains of SpRad23 (Rhp23) and SpDsk2 (Dph1), S. pombe cDNA was prepared by reverse transcription. The fragments encoding for UBLs as well as the ORF of Ufd2 were amplified and inserted into pET21b (Novagen, NdeI/BamHI) or pET3a-GST (NdeI/ApaI), respectively. Protein Expression and PurificationAll proteins were expressed in E. coli BL21(DE3) RIL cells (Novagen). GST-Ufd2 was expressed after heat shock at 42C for 30 minutes and by induction at an OD 600 = 0.6 with 0.01 mM IPTG (isopropyl--thiogalactoside) at 16C for 40 h. His 6 tagged Rad23-UBL and Dsk2-UBL proteins were expressed by induction at an OD 600 = 0.6 with 0.4 mM IPTG at 37C for 4-5 h. Untagged Ufd2 was purified in PBS buffer by affinity chromatography using immobilized glutathione (GST•Bind Resin, Novagen) followed by overnight on-column cleavage with 1
Transcript
UBL-Binding Domain of Ufd2
SUPPLEMENTAL DATA
Experimental Procedures
Construct DesignPlasmids pGEX-4T1-Ufd2, pGEX-4T1-Rad23, and pGEX-Dsk2 for the
expression of N-terminally GST-tagged Saccharomyces cerevisiae Ufd2, Rad23, and Dsk2 were
kindly provided by Stefan Jentsch. The UBL domains of Rad23 (aa 1-84) and Dsk2 (aa 1-79 and
aa 1-84) were PCR amplified and inserted into the pET21b vector (Novagen, C-terminal His-tag,
NdeI/BamHI). N-terminal His-tagged Rad23-UBL (aa 1-74) and Dsk2-UBL (aa 1-74) were
cloned additionally from chromosomal DNA into the vector pETM11 (EMBL Heidelberg,
NcoI/XhoI). C-terminal GST-tagged Ufd2 expression plasmid: The open reading frame (ORF) of
Ufd2 was PCR amplified and inserted into the pET3a-GST plasmid (NdeI/ApaI). The pET3a-
GST plasmid was generated by cloning the GST-encoding ORF of pGEX-4T1 (GE-Healthcare)
into the pET3a vector (Novagen, ApaI/BamHI) (Sven Eiselein). C-terminally GST-tagged Ufd2
was used to compare and validate the optimal binding of N-terminally GST-tagged Ufd2 with the
UBL domains in the SPR interaction studies. For cloning of the Schizosaccharomyces pombe
homolog of Ufd2 and the UBL domains of SpRad23 (Rhp23) and SpDsk2 (Dph1), S. pombe
cDNA was prepared by reverse transcription. The fragments encoding for UBLs as well as the
ORF of Ufd2 were amplified and inserted into pET21b (Novagen, NdeI/BamHI) or pET3a-GST
(NdeI/ApaI), respectively.
Protein Expression and PurificationAll proteins were expressed in E. coli BL21(DE3) RIL
cells (Novagen). GST-Ufd2 was expressed after heat shock at 42C for 30 minutes and by
induction at an OD600 = 0.6 with 0.01 mM IPTG (isopropyl--thiogalactoside) at 16C for 40 h.
His6 tagged Rad23-UBL and Dsk2-UBL proteins were expressed by induction at an OD600 = 0.6
with 0.4 mM IPTG at 37C for 4-5 h.
Untagged Ufd2 was purified in PBS buffer by affinity chromatography using immobilized
glutathione (GST•Bind Resin, Novagen) followed by overnight on-column cleavage with
1
UBL-Binding Domain of Ufd2
thrombin at 16 C and size-exclusion chromatography (HiLoad 26/60 Superdex 200 prep grade,
GE Healthcare) or (High performance Superdex 200 10/300 GL) in 50 mM HEPES pH 7.4, 150
mM NaCl and 1 mM -mercaptoethanol.
For GST pull-down and comparative SPR binding studies, GST-tagged Ufd2 was eluted from
the GSH column with 20 mM reduced glutathione and desalted either by size-exclusion
chromatography on Sephadex G-25 equilibrated with 50 mM HEPES pH 7.4, 150 mM NaCl and
1 mM -mercaptoethanol or using U-tube concentrators (Novagen).
Rad23- and Dsk2-UBL domains were purified in sodium phosphate buffer by metal affinity
chromatography (Ni-NTA, Invitrogen) followed by size-exclusion chromatography (HiLoad
26/60 Superdex 200 prep grade, GE Healthcare) in 50 mM HEPES pH 7.4, 150 mM NaCl and 1
mM -mercaptoethanol. All proteins were concentrated to ~20 mg/ml by ultrafiltration (Vivaspin,
Sartorius), shock frozen, and stored at -80 °C.
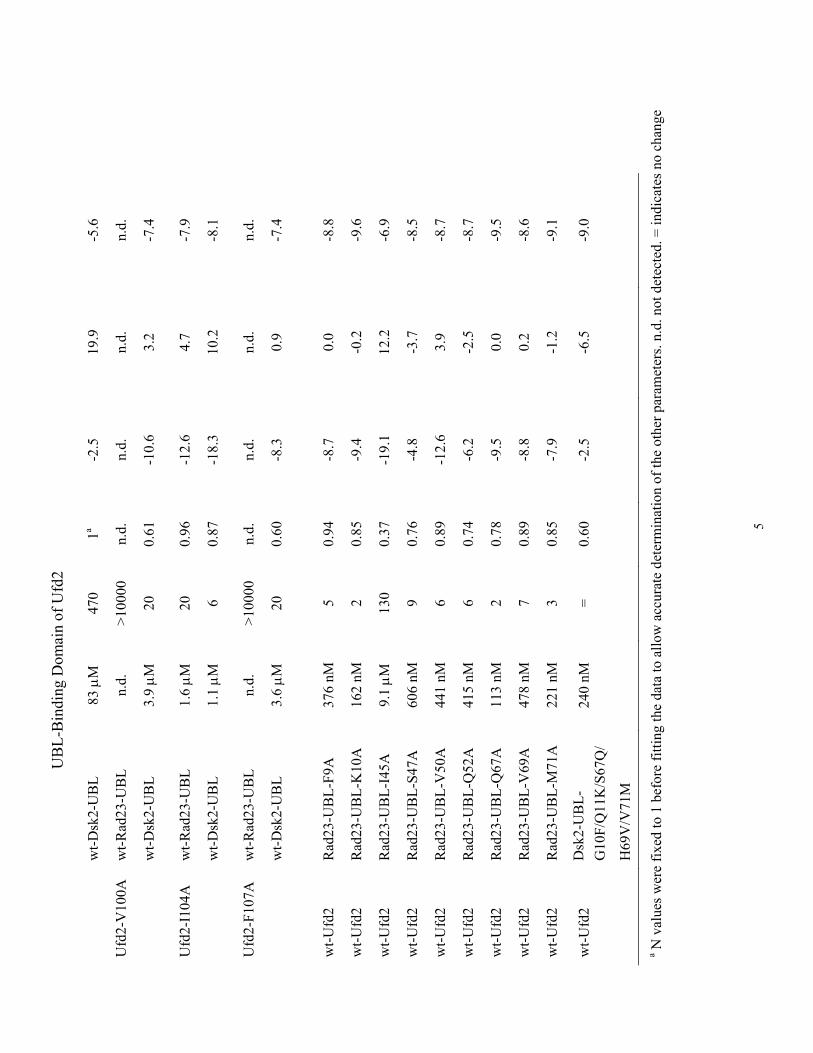
Site Directed MutagenesisFor site directed mutagenesis the QuikChange® II Site-Directed
Mutagenesis Kit from Stratagene was used. The following mutants were created: (a) pGEX-4T1-


![Universal Business Language Version 2docs.oasis-open.org/ubl/cs1-UBL-2.1/UBL-2.1.pdf · OASIS Universal Business Language TC Chairs: Jon Bosak (bosak@pinax.com), Individual ... [UBL-2.1]](https://static.documents.pub/doc/80x56/5e7065bd965725432c6cc8bd/universal-business-language-version-2docsoasis-openorgublcs1-ubl-21ubl-21pdf.jpg)


