84
UBS AG Second quarter 2021 report

UBS AGSecond quarter 2021 report

3 Introduction
1. Risk and capital management
8 Risk management and control9 Capital management
2. Consolidatedfinancial statements
17 UBS AG interim consolidated financial statements (unaudited)
3. UBS AG standalone financial information
71 UBS AG interim standalone financial information (unaudited)
Appendix
74 Alternative performance measures77 Abbreviations frequently used in our
financial reports79 Information sources80 Cautionary statement
Corporate calendar UBS AG
Publication of the third quarter 2021 report: Friday, 29 October 2021
Publication dates of quarterly and annual reports and results are made available as part of the corporate calendar of UBS AG at ubs.com/investors
Contacts
SwitchboardsFor all general inquiriesubs.com/contact
Zurich +41-44-234 1111London +44-207-567 8000New York +1-212-821 3000Hong Kong +852-2971 8888Singapore +65-6495 8000
Investor RelationsInstitutional, professional and retailinvestors are supported by UBS’sInvestor Relations team.
UBS AG, Investor RelationsP.O. Box, CH-8098 Zurich, Switzerland
ubs.com/investors
Zurich +41-44-234 4100New York +1-212-882 5734
Media RelationsGlobal media and journalists are supportedby UBS’s Media Relations team.
ubs.com/media
Zurich +41-44-234 [email protected]
London +44-20-7567 4714 [email protected]
New York +1-212-882 5858 [email protected]
Hong Kong +852-2971 [email protected]
Imprint
Publisher: UBS AG, Zurich, Switzerland | ubs.com/mediaLanguage: English
© UBS 2021. The key symbol and UBS are among the registered and unregistered trademarks of UBS. All rights reserved.

Second quarter 2021 report
2
UBS AG consolidated key figures
UBS AG consolidated key figuresAs of or for the quarter ended As of or year-to-date
USD million, except where indicated 30.6.21 31.3.21 31.12.20 30.6.20 30.6.21 30.6.20ResultsOperating income 9,071 8,836 8,220 7,512 17,906 15,521Operating expenses 6,589 6,684 6,324 5,987 13,274 12,197Operating profit / (loss) before tax 2,481 2,151 1,896 1,525 4,632 3,324Net profit / (loss) attributable to shareholders 1,913 1,710 1,563 1,194 3,623 2,615Profitability and growthReturn on equity (%) 13.6 11.9 10.9 8.4 12.7 9.3Return on tangible equity (%) 15.3 13.4 12.2 9.5 14.3 10.5Return on common equity tier 1 capital (%) 19.4 17.8 16.3 13.0 18.6 14.4Return on risk-weighted assets, gross (%) 12.5 12.3 11.7 10.9 12.4 11.6Return on leverage ratio denominator, gross (%)1 3.5 3.4 3.3 3.2 3.4 3.4Cost / income ratio (%) 73.3 75.9 76.3 76.9 74.6 75.9Net profit growth (%) 60.3 20.3 151.3 (8.7) 38.5 10.1ResourcesTotal assets 1,085,861 1,109,234 1,125,327 1,063,446 1,085,861 1,063,446Equity attributable to shareholders 55,361 57,446 57,754 55,384 55,361 55,384Common equity tier 1 capital2 40,190 38,826 38,181 37,403 40,190 37,403Risk-weighted assets2 290,470 285,119 286,743 284,798 290,470 284,798Common equity tier 1 capital ratio (%)2 13.8 13.6 13.3 13.1 13.8 13.1Going concern capital ratio (%)2 19.1 18.7 18.3 17.9 19.1 17.9Total loss-absorbing capacity ratio (%)2 34.6 34.2 34.2 31.9 34.6 31.9Leverage ratio denominator1,2 1,039,375 1,039,736 1,036,771 974,135 1,039,375 974,135Common equity tier 1 leverage ratio (%)1,2 3.87 3.73 3.68 3.84 3.87 3.84Going concern leverage ratio (%)1,2 5.3 5.1 5.1 5.2 5.3 5.2Total loss-absorbing capacity leverage ratio (%)2 9.7 9.4 9.5 9.3 9.7 9.3OtherInvested assets (USD billion)3 4,485 4,306 4,187 3,588 4,485 3,588Personnel (full-time equivalents) 47,227 47,592 47,546 47,120 47,227 47,1201 Leverage ratio denominators and leverage ratios for the respective periods in 2020 do not reflect the effects of the temporary exemption that applied from 25 March 2020 until 1 January 2021 and was granted by FINMA in connection with COVID-19. Refer to the “Regulatory and legal developments” section of our Annual Report 2020 for more information. 2 Based on the Swiss systemically relevant bank framework as of 1 January 2020. Refer to the “Capital management” section of this report for more information. 3 Consists of invested assets for Global Wealth Management, Asset Management and Personal & Corporate Banking. Refer to “Note 32 Invested assets and net new money” in the “Consolidated financial statements” section of our Annual Report 2020 for more information.
Alternative performance measures
An alternative performance measure (an APM) is a financial measure of historical or future financial performance, financial position or cash flows other than a financial measure defined or specified in the applicable recognized accounting standards or in other applicable regulations. We report a number of APMs in our external reports (annual, quarterly and other reports). We use APMs to provide a more complete picture of our operating performance and to reflect management’s view of the fundamental drivers of our business results. A definition of each APM, the method used to calculate it and the information content are presented under “Alternative performance measures” in the appendix to this report. Our APMs may qualify as non-GAAP measures as defined by US Securities and Exchange Commission (SEC) regulations.
3
Introduction
Overview
UBS Group AG is the holding company for the UBS Group and the parent company of UBS AG. UBS Group AG holds 100% of the issued shares in UBS AG. Financial information for UBS AG consolidated does not differ materially from that for UBS Group AG consolidated.
This report includes risk and capital management information for UBS AG consolidated and the interim consolidated financial statements, as well as UBS AG standalone financial information for the quarter ended 30 June 2021. Regulatory information for UBS AG standalone is provided in the 30 June 2021 Pillar 3 report, available under “Pillar 3 disclosures” at ubs.com/investors.
› Refer to the UBS Group second quarter 2021 report, available
under “Quarterly reporting” at ubs.com/investors, for more
information
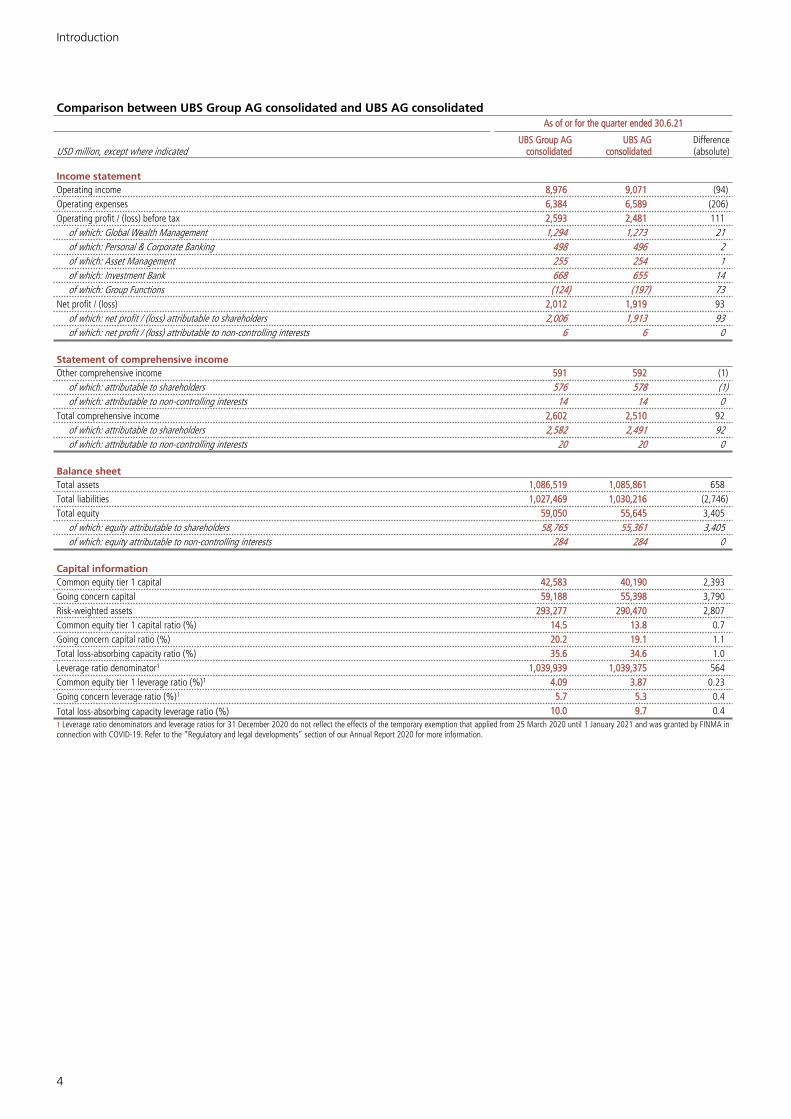
Comparison between UBS Group AG consolidated and UBS AG consolidated
The table on the following page contains a comparison of selected financial and capital information between UBS Group AG consolidated and UBS AG consolidated.
The accounting policies applied under International Financial Reporting Standards (IFRS) to both the UBS Group AG and the UBS AG consolidated financial statements are identical. However, there are certain scope and presentation differences as noted below.– Assets, liabilities, operating income, operating expenses and
operating profit before tax relating to UBS Group AG and its directly held subsidiaries, including UBS Business Solutions AG, are reflected in the consolidated financial statements of UBS Group AG but not in those of UBS AG. UBS AG’s assets, liabilities, operating income and operating expenses related to transactions with UBS Group AG and its directly held subsidiaries, including UBS Business Solutions AG and other shared services subsidiaries, are not subject to elimination in the consolidated financial statements of UBS AG, but are eliminated in the consolidated financial statements of UBS Group AG. UBS Business Solutions AG and other shared services subsidiaries of UBS Group AG charge other legal entities within the UBS AG consolidation scope for services provided, including a markup on costs incurred.
– The equity of UBS Group AG consolidated was USD 3.4 billion higher than the equity of UBS AG consolidated as of 30 June 2021. This difference was mainly driven by higher dividends paid by UBS AG to UBS Group AG compared with
the dividend distributions of UBS Group AG, as well as higher retained earnings in the consolidated financial statements of UBS Group AG, largely related to the aforementioned markup charged by shared services subsidiaries of UBS Group AG to other legal entities in the UBS AG scope of consolidation. In addition, UBS Group AG is the grantor of the majority of the compensation plans of the Group and recognizes share premium for equity-settled awards granted. These effects were partly offset by treasury shares acquired and canceled as part of our share repurchase programs and those held to hedge share delivery obligations associated with Group compensation plans, as well as additional share premium recognized at the UBS AG consolidated level related to the establishment of UBS Group AG and UBS Business Solutions AG, a wholly owned subsidiary of UBS Group AG.
– The going concern capital of UBS Group AG consolidated was USD 3.8 billion higher than the going concern capital of UBS AG consolidated as of 30 June 2021, reflecting higher common equity tier 1 (CET1) capital of USD 2.4 billion and going concern loss-absorbing additional tier 1 (AT1) capital of USD 1.4 billion.
– The CET1 capital of UBS Group AG consolidated was USD 2.4 billion higher than that of UBS AG consolidated as of 30 June 2021. The higher CET1 capital of UBS Group AG consolidated was primarily due to higher UBS Group AG consolidated IFRS equity of USD 3.4 billion, as described above, and lower UBS Group AG accruals for future capital returns to shareholders, partly offset by compensation-related regulatory capital accruals and a capital reserve for potential share repurchases at the UBS Group AG level.
– The going concern loss-absorbing AT1 capital of UBS Group AG consolidated was USD 1.4 billion higher than that of UBS AG consolidated as of 30 June 2021, mainly reflecting deferred contingent capital plan awards granted at the Group level to eligible employees for the performance years 2016 to 2020, partly offset by two loss-absorbing AT1 capital instruments on-lent by UBS Group AG to UBS AG.› Refer to “Holding company and significant regulated
subsidiaries and sub-groups” under “Complementary financial
information” at ubs.com/investors for an illustration of the
consolidation scope differences between UBS AG and UBS Group
AG
› Refer to the “Capital management” section of this report for
more information about differences in the loss-absorbing
capacity between UBS Group AG consolidated and UBS AG
consolidated
Introduction
4
Comparison between UBS Group AG consolidated and UBS AG consolidatedAs of or for the quarter ended 30.6.21
USD million, except where indicatedUBS Group AG
consolidatedUBS AG
consolidatedDifference(absolute)
Income statementOperating income 8,976 9,071 (94)Operating expenses 6,384 6,589 (206)Operating profit / (loss) before tax 2,593 2,481 111
of which: Global Wealth Management 1,294 1,273 21of which: Personal & Corporate Banking 498 496 2of which: Asset Management 255 254 1of which: Investment Bank 668 655 14of which: Group Functions (124) (197) 73
Net profit / (loss) 2,012 1,919 93of which: net profit / (loss) attributable to shareholders 2,006 1,913 93of which: net profit / (loss) attributable to non-controlling interests 6 6 0
Statement of comprehensive incomeOther comprehensive income 591 592 (1)
of which: attributable to shareholders 576 578 (1)of which: attributable to non-controlling interests 14 14 0
Total comprehensive income 2,602 2,510 92of which: attributable to shareholders 2,582 2,491 92of which: attributable to non-controlling interests 20 20 0
Balance sheetTotal assets 1,086,519 1,085,861 658Total liabilities 1,027,469 1,030,216 (2,746)Total equity 59,050 55,645 3,405
of which: equity attributable to shareholders 58,765 55,361 3,405of which: equity attributable to non-controlling interests 284 284 0
Capital informationCommon equity tier 1 capital 42,583 40,190 2,393Going concern capital 59,188 55,398 3,790Risk-weighted assets 293,277 290,470 2,807Common equity tier 1 capital ratio (%) 14.5 13.8 0.7Going concern capital ratio (%) 20.2 19.1 1.1Total loss-absorbing capacity ratio (%) 35.6 34.6 1.0Leverage ratio denominator1 1,039,939 1,039,375 564Common equity tier 1 leverage ratio (%)1 4.09 3.87 0.23Going concern leverage ratio (%)1 5.7 5.3 0.4
Total loss-absorbing capacity leverage ratio (%) 10.0 9.7 0.41 Leverage ratio denominators and leverage ratios for 31 December 2020 do not reflect the effects of the temporary exemption that applied from 25 March 2020 until 1 January 2021 and was granted by FINMA in connection with COVID-19. Refer to the “Regulatory and legal developments” section of our Annual Report 2020 for more information.
5
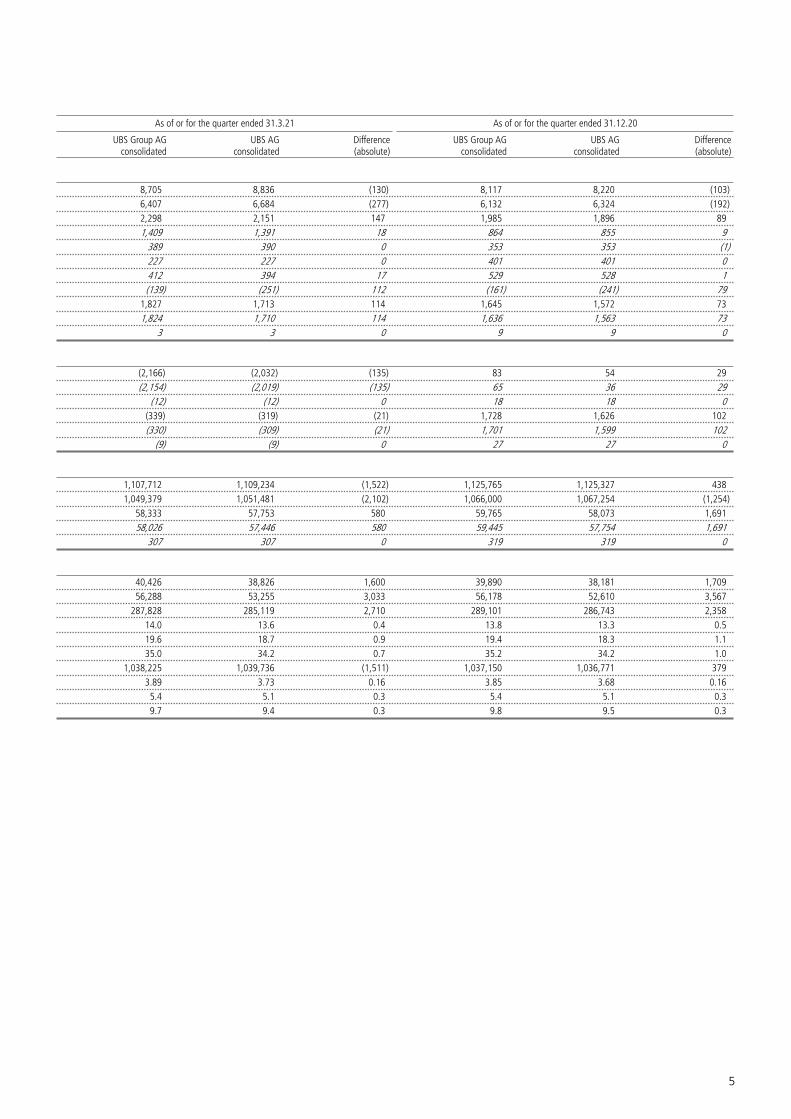
As of or for the quarter ended 31.3.21 As of or for the quarter ended 31.12.20
UBS Group AGconsolidated
UBS AGconsolidated
Difference(absolute)
UBS Group AGconsolidated
UBS AGconsolidated
Difference(absolute)
8,705 8,836 (130) 8,117 8,220 (103) 6,407 6,684 (277) 6,132 6,324 (192) 2,298 2,151 147 1,985 1,896 89 1,409 1,391 18 864 855 9
389 390 0 353 353 (1) 227 227 0 401 401 0 412 394 17 529 528 1 (139) (251) 112 (161) (241) 79
1,827 1,713 114 1,645 1,572 73 1,824 1,710 114 1,636 1,563 73
3 3 0 9 9 0
(2,166) (2,032) (135) 83 54 29(2,154) (2,019) (135) 65 36 29
(12) (12) 0 18 18 0(339) (319) (21) 1,728 1,626 102(330) (309) (21) 1,701 1,599 102
(9) (9) 0 27 27 0
1,107,712 1,109,234 (1,522) 1,125,765 1,125,327 4381,049,379 1,051,481 (2,102) 1,066,000 1,067,254 (1,254)
58,333 57,753 580 59,765 58,073 1,69158,026 57,446 580 59,445 57,754 1,691
307 307 0 319 319 0
40,426 38,826 1,600 39,890 38,181 1,709 56,288 53,255 3,033 56,178 52,610 3,567
287,828 285,119 2,710 289,101 286,743 2,358 14.0 13.6 0.4 13.8 13.3 0.5 19.6 18.7 0.9 19.4 18.3 1.1 35.0 34.2 0.7 35.2 34.2 1.0
1,038,225 1,039,736 (1,511) 1,037,150 1,036,771 379 3.89 3.73 0.16 3.85 3.68 0.16
5.4 5.1 0.3 5.4 5.1 0.3 9.7 9.4 0.3 9.8 9.5 0.3


Risk and capital managementManagement report

Risk management and control
8
Risk management and control
UBS AG consolidated risk profile
The risk profile of UBS AG consolidated does not differ materially from that of UBS Group AG consolidated and the risk information provided in the UBS Group second quarter 2021 report is equally applicable to UBS AG consolidated.
The credit risk profile of UBS AG consolidated differs from that of UBS Group AG consolidated primarily in relation to
receivables of UBS AG and UBS Switzerland AG from UBS Group AG. The total banking products exposure of UBS AG consolidated as of 30 June 2021 was USD 1.2 billion, or 0.2%, higher than the exposure of UBS Group, compared with USD 3.3 billion, or 0.5%, as of 31 March 2021.
› Refer to the “Risk management and control” section of the
UBS Group second quarter 2021 report for more information
9
Capital management
Going and gone concern requirements and information
UBS is considered a systemically relevant bank (an SRB) under Swiss banking law and, on a consolidated basis, both UBS Group AG and UBS AG are required to comply with regulations based on the Basel III framework as applicable for Swiss SRBs.
The Swiss SRB framework and requirements applicable to UBS AG consolidated are consistent with those applicable to UBS Group AG consolidated and are described in the “Capital, liquidity and funding, and balance sheet” section of our Annual Report 2020.
UBS AG is subject to going and gone concern requirements on a standalone basis. Capital and other regulatory information for UBS AG standalone is provided under “Holding company and significant regulated subsidiaries and sub-groups” at ubs.com/investors and in the 30 June 2021 Pillar 3 report, which will be available as of 20 August 2021 under “Pillar 3 disclosures” at ubs.com/investors.
The table on the next page provides the risk-weighted assets (RWA)- and leverage ratio denominator (LRD)-based requirements and information as of 30 June 2021 for UBS AG consolidated.

Capital management
10
Swiss SRB going and gone concern requirements and information
As of 30.6.21 RWA LRD
USD million, except where indicated in % in %Required going concern capitalTotal going concern capital 13.961 40,552 4.881 50,670Common equity tier 1 capital 9.66 28,062 3.382 35,079
of which: minimum capital 4.50 13,071 1.50 15,591of which: buffer capital 5.14 14,930 1.88 19,488of which: countercyclical buffer 0.02 61
Maximum additional tier 1 capital 4.30 12,490 1.50 15,591of which: additional tier 1 capital 3.50 10,166 1.50 15,591of which: additional tier 1 buffer capital 0.80 2,324
Eligible going concern capitalTotal going concern capital 19.07 55,398 5.33 55,398Common equity tier 1 capital 13.84 40,190 3.87 40,190Total loss-absorbing additional tier 1 capital 5.24 15,208 1.46 15,208
of which: high-trigger loss-absorbing additional tier 1 capital 4.37 12,702 1.22 12,702of which: low-trigger loss-absorbing additional tier 1 capital 3 0.86 2,506 0.24 2,506
Required gone concern capital4
Total gone concern loss-absorbing capacity5 10.60 30,803 3.76 39,071of which: base requirement 12.86 37,354 4.50 46,772of which: additional requirement for market share and LRD 1.08 3,137 0.38 3,898of which: applicable reduction on requirements (3.34) (9,688) (1.12) (11,598)
of which: rebate granted (equivalent to 47.5% of maximum rebate) 6 (2.54) (7,368) (0.89) (9,257)of which: reduction for usage of low-trigger tier 2 capital instruments (0.80) (2,320) (0.23) (2,342)
Eligible gone concern capitalTotal gone concern loss-absorbing capacity 15.53 45,110 4.34 45,110Total tier 2 capital 1.80 5,232 0.50 5,232
of which: low-trigger loss-absorbing tier 2 capital 1.61 4,686 0.45 4,686of which: non-Basel III-compliant tier 2 capital 0.19 547 0.05 547
TLAC-eligible senior unsecured debt 13.73 39,878 3.84 39,878
Total loss-absorbing capacityRequired total loss-absorbing capacity 24.57 71,356 8.63 89,741Eligible total loss-absorbing capacity 34.60 100,508 9.67 100,508
Risk-weighted assets / leverage ratio denominatorRisk-weighted assets 290,470Leverage ratio denominator 1,039,3751 Includes applicable add-ons of 1.08% for RWA and 0.375% for LRD. 2 Our minimum CET1 leverage ratio requirement of 3.375% consists of a 1.5% base requirement, a 1.5% base buffer capital requirement, a 0.25% LRD add-on requirement and a 0.125% market share add-on requirement based on our Swiss credit business. 3 The relevant capital instruments were issued after the new Swiss SRB framework had been implemented and qualify as going concern capital at the UBS AG consolidated level, as agreed with FINMA. 4 A maximum of 25% of the gone concern requirements can be met with instruments that have a remaining maturity of between one and two years. Once at least 75% of the minimum gone concern requirement has been met with instruments that have a remaining maturity of greater than two years, all instruments that have a remaining maturity of between one and two years remain eligible to be included in the total gone concern capital. 5 The gone concern requirement after the application of the rebate for resolvability measures and the reduction for the use of higher quality capital instruments is floored at 8.6% and 3% for the RWA- and LRD-based requirements, respectively. This means that the combined reduction may not exceed 5.34 percentage points for the RWA-based requirement of 13.94% and 1.875 percentage points for the LRD-based requirement of 4.875%. 6 Based on the actions we completed up to December 2020 to improve resolvability, FINMA granted an increase of rebate on the gone concern requirement from 47.5% to 55.0% of the maximum rebate, effective from 1 July 2021.
11
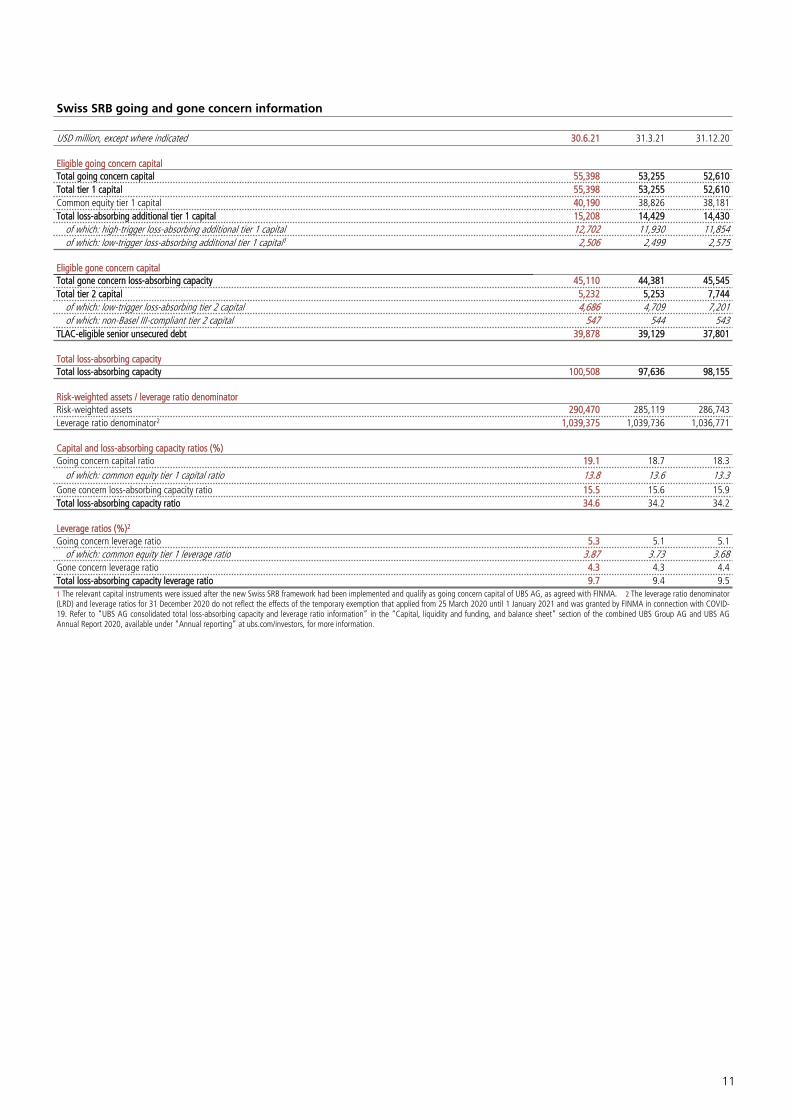
Swiss SRB going and gone concern information
USD million, except where indicated 30.6.21 31.3.21 31.12.20
Eligible going concern capitalTotal going concern capital 55,398 53,255 52,610Total tier 1 capital 55,398 53,255 52,610Common equity tier 1 capital 40,190 38,826 38,181Total loss-absorbing additional tier 1 capital 15,208 14,429 14,430
of which: high-trigger loss-absorbing additional tier 1 capital 12,702 11,930 11,854of which: low-trigger loss-absorbing additional tier 1 capital1 2,506 2,499 2,575
Eligible gone concern capitalTotal gone concern loss-absorbing capacity 45,110 44,381 45,545Total tier 2 capital 5,232 5,253 7,744
of which: low-trigger loss-absorbing tier 2 capital 4,686 4,709 7,201of which: non-Basel III-compliant tier 2 capital 547 544 543
TLAC-eligible senior unsecured debt 39,878 39,129 37,801
Total loss-absorbing capacityTotal loss-absorbing capacity 100,508 97,636 98,155
Risk-weighted assets / leverage ratio denominatorRisk-weighted assets 290,470 285,119 286,743Leverage ratio denominator2 1,039,375 1,039,736 1,036,771
Capital and loss-absorbing capacity ratios (%)Going concern capital ratio 19.1 18.7 18.3
of which: common equity tier 1 capital ratio 13.8 13.6 13.3Gone concern loss-absorbing capacity ratio 15.5 15.6 15.9Total loss-absorbing capacity ratio 34.6 34.2 34.2
Leverage ratios (%)2
Going concern leverage ratio 5.3 5.1 5.1of which: common equity tier 1 leverage ratio 3.87 3.73 3.68
Gone concern leverage ratio 4.3 4.3 4.4Total loss-absorbing capacity leverage ratio 9.7 9.4 9.51 The relevant capital instruments were issued after the new Swiss SRB framework had been implemented and qualify as going concern capital of UBS AG, as agreed with FINMA. 2 The leverage ratio denominator (LRD) and leverage ratios for 31 December 2020 do not reflect the effects of the temporary exemption that applied from 25 March 2020 until 1 January 2021 and was granted by FINMA in connection with COVID-19. Refer to “UBS AG consolidated total loss-absorbing capacity and leverage ratio information” in the “Capital, liquidity and funding, and balance sheet” section of the combined UBS Group AG and UBS AG Annual Report 2020, available under “Annual reporting” at ubs.com/investors, for more information.
Capital management
12
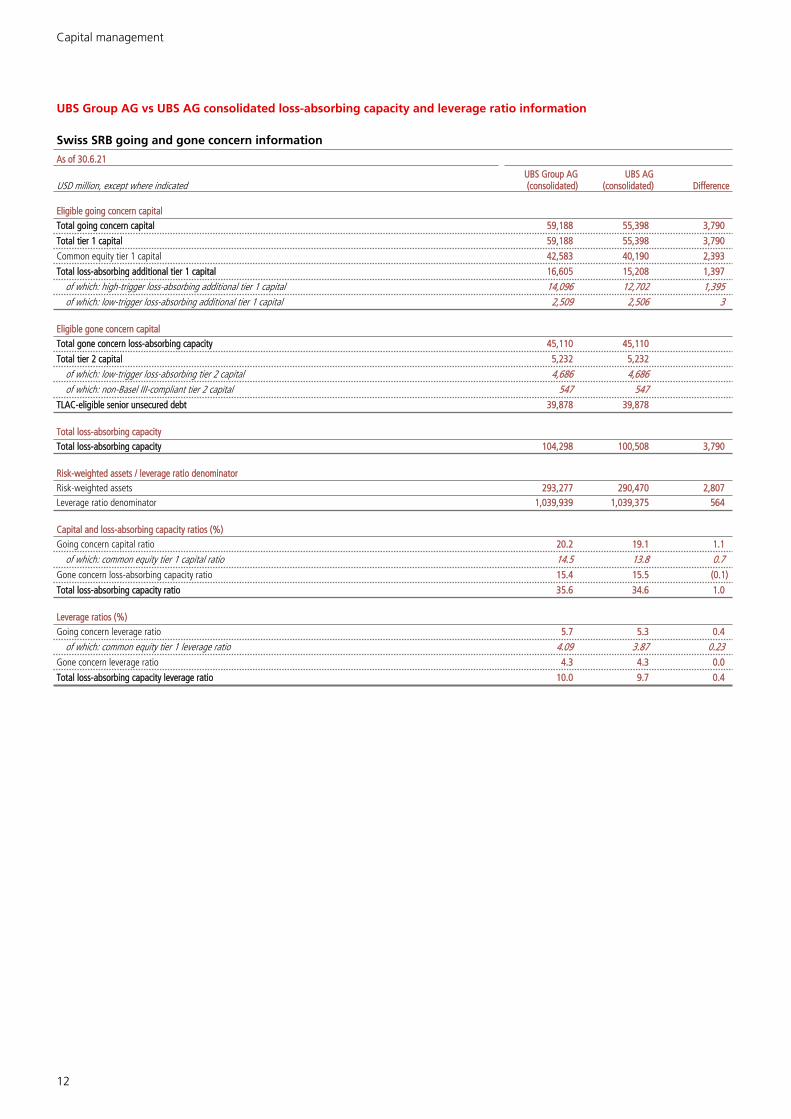
UBS Group AG vs UBS AG consolidated loss-absorbing capacity and leverage ratio information
Swiss SRB going and gone concern information
As of 30.6.21
USD million, except where indicatedUBS Group AG (consolidated)
UBS AG (consolidated) Difference
Eligible going concern capitalTotal going concern capital 59,188 55,398 3,790
Total tier 1 capital 59,188 55,398 3,790
Common equity tier 1 capital 42,583 40,190 2,393
Total loss-absorbing additional tier 1 capital 16,605 15,208 1,397
of which: high-trigger loss-absorbing additional tier 1 capital 14,096 12,702 1,395of which: low-trigger loss-absorbing additional tier 1 capital 2,509 2,506 3
Eligible gone concern capitalTotal gone concern loss-absorbing capacity 45,110 45,110
Total tier 2 capital 5,232 5,232
of which: low-trigger loss-absorbing tier 2 capital 4,686 4,686of which: non-Basel III-compliant tier 2 capital 547 547
TLAC-eligible senior unsecured debt 39,878 39,878
Total loss-absorbing capacityTotal loss-absorbing capacity 104,298 100,508 3,790
Risk-weighted assets / leverage ratio denominatorRisk-weighted assets 293,277 290,470 2,807Leverage ratio denominator 1,039,939 1,039,375 564
Capital and loss-absorbing capacity ratios (%)Going concern capital ratio 20.2 19.1 1.1
of which: common equity tier 1 capital ratio 14.5 13.8 0.7Gone concern loss-absorbing capacity ratio 15.4 15.5 (0.1)
Total loss-absorbing capacity ratio 35.6 34.6 1.0
Leverage ratios (%)Going concern leverage ratio 5.7 5.3 0.4
of which: common equity tier 1 leverage ratio 4.09 3.87 0.23Gone concern leverage ratio 4.3 4.3 0.0
Total loss-absorbing capacity leverage ratio 10.0 9.7 0.4
13
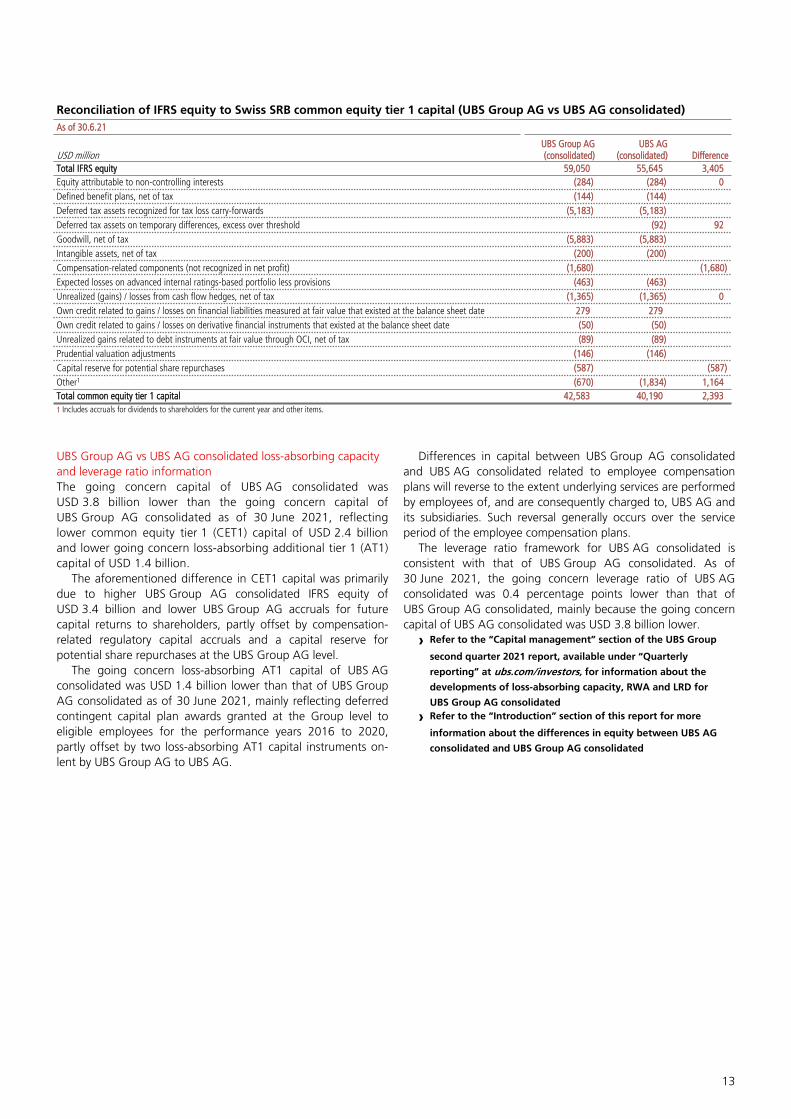
Reconciliation of IFRS equity to Swiss SRB common equity tier 1 capital (UBS Group AG vs UBS AG consolidated)As of 30.6.21
USD millionUBS Group AG(consolidated)
UBS AG(consolidated) Difference
Total IFRS equity 59,050 55,645 3,405Equity attributable to non-controlling interests (284) (284) 0Defined benefit plans, net of tax (144) (144)Deferred tax assets recognized for tax loss carry-forwards (5,183) (5,183)Deferred tax assets on temporary differences, excess over threshold (92) 92Goodwill, net of tax (5,883) (5,883)Intangible assets, net of tax (200) (200)Compensation-related components (not recognized in net profit) (1,680) (1,680)Expected losses on advanced internal ratings-based portfolio less provisions (463) (463)Unrealized (gains) / losses from cash flow hedges, net of tax (1,365) (1,365) 0Own credit related to gains / losses on financial liabilities measured at fair value that existed at the balance sheet date 279 279Own credit related to gains / losses on derivative financial instruments that existed at the balance sheet date (50) (50)Unrealized gains related to debt instruments at fair value through OCI, net of tax (89) (89)Prudential valuation adjustments (146) (146)Capital reserve for potential share repurchases (587) (587)Other1 (670) (1,834) 1,164Total common equity tier 1 capital 42,583 40,190 2,3931 Includes accruals for dividends to shareholders for the current year and other items.
UBS Group AG vs UBS AG consolidated loss-absorbing capacity and leverage ratio informationThe going concern capital of UBS AG consolidated was USD 3.8 billion lower than the going concern capital of UBS Group AG consolidated as of 30 June 2021, reflecting lower common equity tier 1 (CET1) capital of USD 2.4 billion and lower going concern loss-absorbing additional tier 1 (AT1) capital of USD 1.4 billion.
The aforementioned difference in CET1 capital was primarily due to higher UBS Group AG consolidated IFRS equity of USD 3.4 billion and lower UBS Group AG accruals for future capital returns to shareholders, partly offset by compensation-related regulatory capital accruals and a capital reserve for potential share repurchases at the UBS Group AG level.
The going concern loss-absorbing AT1 capital of UBS AG consolidated was USD 1.4 billion lower than that of UBS Group AG consolidated as of 30 June 2021, mainly reflecting deferred contingent capital plan awards granted at the Group level to eligible employees for the performance years 2016 to 2020, partly offset by two loss-absorbing AT1 capital instruments on-lent by UBS Group AG to UBS AG.
Differences in capital between UBS Group AG consolidated and UBS AG consolidated related to employee compensation plans will reverse to the extent underlying services are performed by employees of, and are consequently charged to, UBS AG and its subsidiaries. Such reversal generally occurs over the service period of the employee compensation plans.
The leverage ratio framework for UBS AG consolidated is consistent with that of UBS Group AG consolidated. As of 30 June 2021, the going concern leverage ratio of UBS AG consolidated was 0.4 percentage points lower than that of UBS Group AG consolidated, mainly because the going concern capital of UBS AG consolidated was USD 3.8 billion lower.
› Refer to the “Capital management” section of the UBS Group
second quarter 2021 report, available under “Quarterly
reporting” at ubs.com/investors, for information about the
developments of loss-absorbing capacity, RWA and LRD for
UBS Group AG consolidated
› Refer to the “Introduction” section of this report for more
information about the differences in equity between UBS AG
consolidated and UBS Group AG consolidated


Consolidatedfinancial statementsUnaudited

Table of contents
UBS AG interim consolidated financial statements (unaudited)
17 Income statement18 Statement of comprehensive income20 Balance sheet22 Statement of changes in equity24 Statement of cash flows
26 1 Basis of accounting and other financial reportingeffects
28 2 Segment reporting29 3 Net interest income29 4 Net fee and commission income30 5 Other income30 6 Personnel expenses30 7 General and administrative expenses30 8 Income taxes31 9 Expected credit loss measurement38 10 Fair value measurement47 11 Derivative instruments48 12 Other assets and liabilities50 13 Debt issued designated at fair value50 14 Debt issued measured at amortized cost51 15 Interest rate benchmark reform54 16 Provisions and contingent liabilities60 17 Currency translation rates
61 18 Supplemental guarantor information required under SEC regulations

17
UBS AG interim consolidatedfinancial statements (unaudited)
Income statementFor the quarter ended Year-to-date
USD million Note 30.6.21 31.3.21 30.6.20 30.6.21 30.6.20Interest income from financial instruments measured at amortized cost and fair value throughother comprehensive income 3 2,107 2,098 2,135 4,205 4,591Interest expense from financial instruments measured at amortized cost 3 (860) (859) (1,112) (1,719) (2,519)
Net interest income from financial instruments measured at fair value through profit or loss 3 359 351 354 710 616
Net interest income 3 1,607 1,589 1,376 3,196 2,689
Other net income from financial instruments measured at fair value through profit or loss 1,471 1,314 1,944 2,785 3,719
Credit loss (expense) / release 9 80 28 (272) 108 (540)
Fee and commission income 4 6,047 6,197 4,730 12,244 10,211
Fee and commission expense 4 (484) (478) (419) (962) (875)
Net fee and commission income 4 5,563 5,719 4,311 11,282 9,336
Other income 5 350 185 153 535 317
Total operating income 9,071 8,836 7,512 17,906 15,521
Personnel expenses 6 4,072 4,086 3,682 8,158 7,391
General and administrative expenses 7 2,070 2,141 1,879 4,211 3,960
Depreciation and impairment of property, equipment and software 439 449 409 887 814
Amortization and impairment of goodwill and intangible assets 9 8 17 17 32
Total operating expenses 6,589 6,684 5,987 13,274 12,197
Operating profit / (loss) before tax 2,481 2,151 1,525 4,632 3,324
Tax expense / (benefit) 8 563 439 328 1,001 703
Net profit / (loss) 1,919 1,713 1,197 3,631 2,621
Net profit / (loss) attributable to non-controlling interests 6 3 3 9 6
Net profit / (loss) attributable to shareholders 1,913 1,710 1,194 3,623 2,615

UBS AG interim consolidated financial statements (unaudited)
18
Statement of comprehensive income
For the quarter ended Year-to-date
USD million 30.6.21 31.3.21 30.6.20 30.6.21 30.6.20
Comprehensive income attributable to shareholders
Net profit / (loss) 1,913 1,710 1,194 3,623 2,615
Other comprehensive income that may be reclassified to the income statement
Foreign currency translation
Foreign currency translation movements related to net assets of foreign operations, before tax 447 (1,407) 447 (960) 172
Effective portion of changes in fair value of hedging instruments designated as net investment hedges, before tax (203) 705 (196) 502 (61)
Foreign currency translation differences on foreign operations reclassified to the income statement (9) 1 0 (8) 0Effective portion of changes in fair value of hedging instruments designated as net investment hedges reclassified to the income statement 8 0 2 8 (7)Income tax relating to foreign currency translations, including the impact of net investment hedges (4) 10 (2) 6 (2)Subtotal foreign currency translation, net of tax 239 (691) 249 (452) 103
Financial assets measured at fair value through other comprehensive income
Net unrealized gains / (losses), before tax 21 (131) 19 (110) 226
Realized gains reclassified to the income statement from equity (3) (8) (15) (11) (24)
Realized losses reclassified to the income statement from equity 0 2 0 2 0
Income tax relating to net unrealized gains / (losses) (4) 35 (3) 31 (54)Subtotal financial assets measured at fair value through other comprehensive income, net of tax 14 (102) 1 (88) 149
Cash flow hedges of interest rate risk
Effective portion of changes in fair value of derivative instruments designated as cash flow hedges, before tax 542 (1,172) 291 (630) 2,244
Net (gains) / losses reclassified to the income statement from equity (268) (254) (171) (522) (274)
Income tax relating to cash flow hedges (51) 266 (25) 215 (370)Subtotal cash flow hedges, net of tax 222 (1,160) 95 (937) 1,600
Cost of hedging
Change in fair value of cost of hedging, before tax (24) (13) (18) (37) (12)
Amortization of initial cost of hedging to the income statement 7 7 5 14 7
Income tax relating to cost of hedging 0 0 0 0 0Subtotal cost of hedging, net of tax (16) (6) (13) (23) (4)
Total other comprehensive income that may be reclassified to the income statement, net of tax 459 (1,958) 333 (1,500) 1,847
Other comprehensive income that will not be reclassified to the income statement
Defined benefit plans
Gains / (losses) on defined benefit plans, before tax 0 (35) (417) (35) (314)
Income tax relating to defined benefit plans 0 3 (81) 4 43
Subtotal defined benefit plans, net of tax 0 (32) (498) (31) (270)
Own credit on financial liabilities designated at fair value1
Gains / (losses) from own credit on financial liabilities designated at fair value, before tax 118 (29) (1,095) 89 62
Income tax relating to own credit on financial liabilities designated at fair value 0 0 223 0 0
Subtotal own credit on financial liabilities designated at fair value, net of tax 118 (29) (872) 89 62
Total other comprehensive income that will not be reclassified to the income statement, net of tax 119 (61) (1,370) 58 (208)
Total other comprehensive income 578 (2,019) (1,037) (1,442) 1,639
Total comprehensive income attributable to shareholders 2,491 (309) 157 2,181 4,254
19
Statement of comprehensive income (continued)For the quarter ended Year-to-date
USD million 30.6.21 31.3.21 30.6.20 30.6.21 30.6.20
Comprehensive income attributable to non-controlling interests
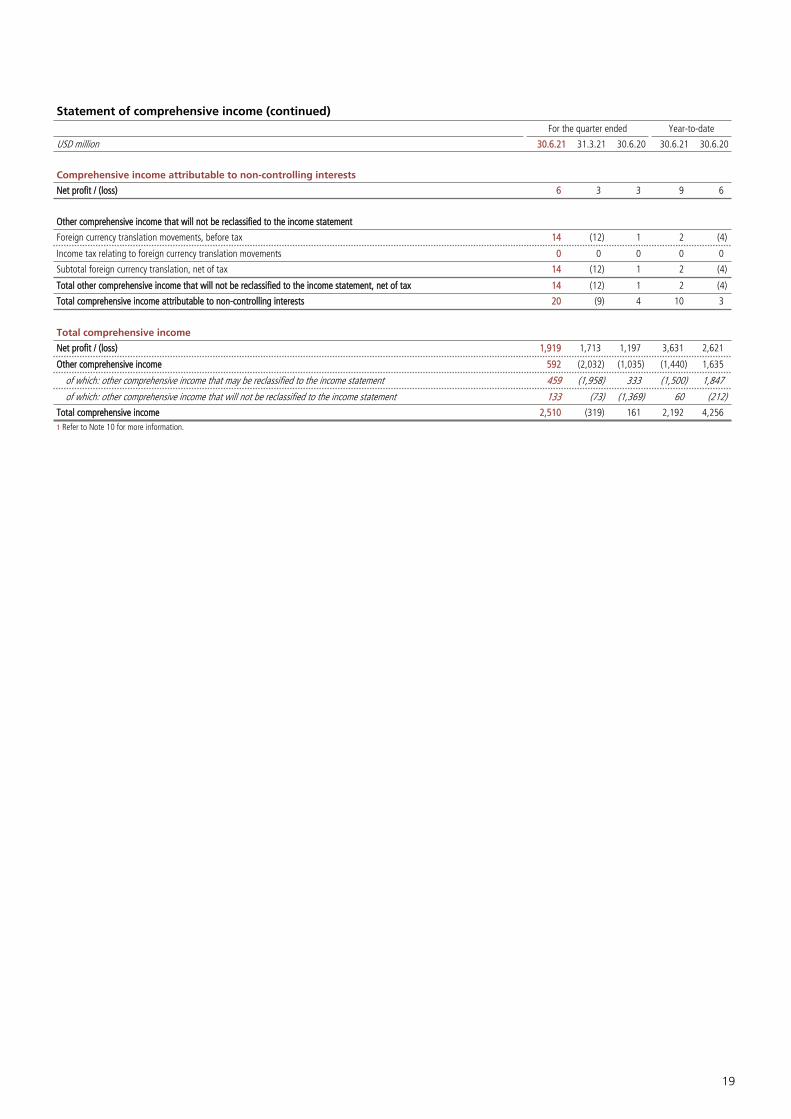
Net profit / (loss) 6 3 3 9 6
Other comprehensive income that will not be reclassified to the income statement
Foreign currency translation movements, before tax 14 (12) 1 2 (4)
Income tax relating to foreign currency translation movements 0 0 0 0 0
Subtotal foreign currency translation, net of tax 14 (12) 1 2 (4)
Total other comprehensive income that will not be reclassified to the income statement, net of tax 14 (12) 1 2 (4)
Total comprehensive income attributable to non-controlling interests 20 (9) 4 10 3
Total comprehensive income
Net profit / (loss) 1,919 1,713 1,197 3,631 2,621
Other comprehensive income 592 (2,032) (1,035) (1,440) 1,635
of which: other comprehensive income that may be reclassified to the income statement 459 (1,958) 333 (1,500) 1,847
of which: other comprehensive income that will not be reclassified to the income statement 133 (73) (1,369) 60 (212)
Total comprehensive income 2,510 (319) 161 2,192 4,2561 Refer to Note 10 for more information.

UBS AG interim consolidated financial statements (unaudited)
20
Balance sheetUSD million Note 30.6.21 31.3.21 31.12.20
AssetsCash and balances at central banks 160,672 158,914 158,231
Loans and advances to banks 16,376 18,348 15,344
Receivables from securities financing transactions 83,494 82,384 74,210
Cash collateral receivables on derivative instruments 11 29,787 35,050 32,737
Loans and advances to customers 9 391,406 380,141 380,977
Other financial assets measured at amortized cost 12 27,201 26,837 27,219
Total financial assets measured at amortized cost 708,937 701,674 688,717
Financial assets at fair value held for trading 10 122,628 120,717 125,492
of which: assets pledged as collateral that may be sold or repledged by counterparties 44,333 48,385 47,098
Derivative financial instruments 10, 11 121,622 148,284 159,618
Brokerage receivables 10 23,010 24,201 24,659
Financial assets at fair value not held for trading 10 64,952 68,763 80,038
Total financial assets measured at fair value through profit or loss 332,211 361,964 389,808
Financial assets measured at fair value through other comprehensive income 10 7,775 8,100 8,258
Investments in associates 1,198 1,542 1,557
Property, equipment and software 11,732 11,610 11,958
Goodwill and intangible assets 6,452 6,427 6,480
Deferred tax assets 8,951 9,161 9,174
Other non-financial assets 12 8,603 8,755 9,374
Total assets 1,085,861 1,109,234 1,125,327

21
Balance sheet (continued)USD million Note 30.6.21 31.3.21 31.12.20
LiabilitiesAmounts due to banks 14,615 12,564 11,050
Payables from securities financing transactions 5,972 6,651 6,321
Cash collateral payables on derivative instruments 11 32,193 36,571 37,313
Customer deposits 517,462 508,903 527,929
Funding from UBS Group AG 55,907 57,699 53,979
Debt issued measured at amortized cost 14 84,491 87,495 85,351
Other financial liabilities measured at amortized cost 12 10,671 9,624 10,421
Total financial liabilities measured at amortized cost 721,311 719,508 732,364
Financial liabilities at fair value held for trading 10 33,348 37,062 33,595
Derivative financial instruments 10, 11 121,688 146,041 161,102
Brokerage payables designated at fair value 10 39,129 45,600 38,742
Debt issued designated at fair value 10, 13 72,799 64,635 59,868
Other financial liabilities designated at fair value 10, 12 32,908 30,769 31,773
Total financial liabilities measured at fair value through profit or loss 299,871 324,108 325,080
Provisions 16 2,792 2,693 2,791
Other non-financial liabilities 12 6,241 5,171 7,018
Total liabilities 1,030,216 1,051,481 1,067,254
Equity
Share capital 338 338 338
Share premium 24,542 24,579 24,580
Retained earnings 24,414 26,926 25,251
Other comprehensive income recognized directly in equity, net of tax 6,067 5,603 7,585
Equity attributable to shareholders 55,361 57,446 57,754
Equity attributable to non-controlling interests 284 307 319
Total equity 55,645 57,753 58,073
Total liabilities and equity 1,085,861 1,109,234 1,125,327

UBS AG interim consolidated financial statements (unaudited)
22
Statement of changes in equity
USD millionShare
capitalShare
premiumRetained earnings
Balance as of 1 January 2020 338 24,659 23,419
Tax (expense) / benefit (2)
Dividends (2,550)
Translation effects recognized directly in retained earnings (11)
Share of changes in retained earnings of associates and joint ventures (40)
New consolidations / (deconsolidations) and other increases / (decreases) 0
Total comprehensive income for the period 2,406
of which: net profit / (loss) 2,615
of which: OCI that may be reclassified to the income statement, net of tax
of which: OCI that will not be reclassified to the income statement, net of tax – defined benefit plans (270)
of which: OCI that will not be reclassified to the income statement, net of tax – own credit 62
of which: OCI that will not be reclassified to the income statement, net of tax – foreign currency translation
Balance as of 30 June 2020 338 24,657 23,225
Balance as of 1 January 2021 338 24,580 25,251
Tax (expense) / benefit 2
Dividends (4,539)
Translation effects recognized directly in retained earnings 19
Share of changes in retained earnings of associates and joint ventures 2
New consolidations / (deconsolidations) and other increases / (decreases) (39)
Total comprehensive income for the period 3,681
of which: net profit / (loss) 3,623
of which: OCI that may be reclassified to the income statement, net of tax
of which: OCI that will not be reclassified to the income statement, net of tax – defined benefit plans (31)
of which: OCI that will not be reclassified to the income statement, net of tax – own credit 89
of which: OCI that will not be reclassified to the income statement, net of tax – foreign currency translation
Balance as of 30 June 2021 338 24,542 24,4141 Excludes other comprehensive income related to defined benefit plans and own credit that is recorded directly in Retained earnings.

23
Other comprehensive income recognized
directly in equity, net of tax 1
of which: foreign currency
translation
of which: financial assets
measured at fair value through OCI
of which:cash flow hedges
of which:cost of hedging
Total equity attributable to
shareholdersNon-controlling
interestsTotal
equity 5,306 4,032 14 1,260 53,722 174 53,896
(2) (2)
(2,550) (4) (2,554)
11 0 11 0 0
(40) (40)
0 0 0
1,847 103 149 1,600 (4) 4,254 3 4,256
2,615 6 2,621
1,847 103 149 1,600 (4) 1,847 1,847
(270) (270)
62 62
0 (4) (4)
7,164 4,134 163 2,871 (4) 55,384 173 55,557
7,585 5,126 151 2,321 (13) 57,754 319 58,073
2 2
(4,539) (4) (4,542)
(19) 0 (19) 0 0 0
2 2
(39) (42) (81)
(1,500) (452) (88) (937) (23) 2,181 10 2,192
3,623 9 3,631
(1,500) (452) (88) (937) (23) (1,500) (1,500)
(31) (31)
89 89
0 2 2
6,067 4,675 63 1,365 (36) 55,361 284 55,645

UBS AG interim consolidated financial statements (unaudited)
24
Statement of cash flowsYear-to-date
USD million 30.6.21 30.6.20
Cash flow from / (used in) operating activities
Net profit / (loss) 3,631 2,621
Non-cash items included in net profit and other adjustments:
Depreciation and impairment of property, equipment and software 887 814
Amortization and impairment of goodwill and intangible assets 17 32
Credit loss expense / (release) (108) 540
Share of net profits of associates / joint ventures and impairment of associates (74) (29)
Deferred tax expense / (benefit) 278 191
Net loss / (gain) from investing activities (239) 240
Net loss / (gain) from financing activities 2,070 (7,047)
Other net adjustments 4,742 (595)
Net change in operating assets and liabilities:
Loans and advances to banks / amounts due to banks 3,872 5,585
Securities financing transactions (10,249) 3,167
Cash collateral on derivative instruments (2,183) (2,046)
Loans and advances to customers (19,714) (14,143)
Customer deposits 573 21,004
Financial assets and liabilities at fair value held for trading and derivative financial instruments (1,278) 38,756
Brokerage receivables and payables 2,047 1,140
Financial assets at fair value not held for trading, other financial assets and liabilities 14,416 (7,484)
Provisions, other non-financial assets and liabilities 261 (1,323)
Income taxes paid, net of refunds (363) (364)Net cash flow from / (used in) operating activities (1,413) 41,060
Cash flow from / (used in) investing activities
Purchase of subsidiaries, associates and intangible assets (1) (1)
Disposal of subsidiaries, associates and intangible assets1 437 14
Purchase of property, equipment and software (757) (725)
Disposal of property, equipment and software 264 4
Purchase of financial assets measured at fair value through other comprehensive income (1,950) (4,132)
Disposal and redemption of financial assets measured at fair value through other comprehensive income 2,324 1,944
Net (purchase) / redemption of debt securities measured at amortized cost 116 (4,817)
Net cash flow from / (used in) investing activities 434 (7,713)

25
Statement of cash flows (continued)Year-to-date
USD million 30.6.21 30.6.20
Cash flow from / (used in) financing activities
Net short-term debt issued / (repaid) (3,877) 14,912
Distributions paid on UBS shares (4,539) (2,550)
Repayment of lease liabilities (274) (262)
Issuance of debt designated at fair value and long-term debt measured at amortized cost2 63,845 46,001
Repayment of debt designated at fair value and long-term debt measured at amortized cost2 (45,244) (46,137)
Net changes in non-controlling interests (4) (4)
Net cash flow from / (used in) financing activities 9,908 11,960
Total cash flow
Cash and cash equivalents at the beginning of the period 173,430 119,804
Net cash flow from / (used in) operating, investing and financing activities 8,929 45,308
Effects of exchange rate differences on cash and cash equivalents (5,389) 1,567
Cash and cash equivalents at the end of the period3 176,971 166,679
of which: cash and balances at central banks 4 160,541 149,430
of which: loans and advances to banks 15,001 14,339
of which: money market paper 1,428 2,911
Additional information
Net cash flow from / (used in) operating activities includes:
Interest received in cash 5,475 6,375
Interest paid in cash 2,703 4,249
Dividends on equity investments, investment funds and associates received in cash 1,263 1,1041 Includes cash proceeds from the sale of UBS’s minority investment in Clearstream Fund Centre for the period ended 30 June 2021, and dividends received from associates in both periods. 2 Includes funding from UBS Group AG measured at amortized cost (recognized in Funding from UBS Group AG in the balance sheet) and measured at fair value (recognized in Other financial liabilities designated at fair value in the balance sheet). 3 USD 3,432 million and USD 5,393 million of cash and cash equivalents (mainly reflected in Loans and advances to banks) were restricted as of 30 June 2021 and 30 June 2020, respectively. Refer to “Note 23 Restricted and transferred financial assets” in the “Consolidated financial statements” section of the Annual Report 2020 for more information. 4 Includes only balances with an original maturity of three months or less.

Notes to the UBS AG interim consolidated financial statements (unaudited)
26
Notes to the UBS AG interim consolidated financial statements (unaudited)
Note 1 Basis of accounting and other financial reporting effects
Basis of preparation
The consolidated financial statements (the financial statements) of UBS AG and its subsidiaries (together, UBS AG) are prepared in accordance with International Financial Reporting Standards (IFRS), as issued by the International Accounting Standards Board (the IASB), and are presented in US dollars (USD). These interim financial statements are prepared in accordance with IAS 34, Interim Financial Reporting.
In preparing these interim financial statements, the same accounting policies and methods of computation have been applied as in the UBS AG consolidated annual financial statements for the period ended 31 December 2020, except for the changes described in this Note. These interim financial statements are unaudited and should be read in conjunction with UBS AG’s audited consolidated financial statements included in the Annual Report 2020. In the opinion of management, all necessary adjustments were made for a fair presentation of UBS AG’s financial position, results of operations and cash flows.
Preparation of these interim financial statements requires management to make estimates and assumptions that affect the reported amounts of assets, liabilities, income, expenses and disclosures of contingent assets and liabilities. These estimates and assumptions are based on the best available information. Actual results in the future could differ from such estimates and differences may be material to the financial statements. Revisions to estimates, based on regular reviews, are recognized in the period in which they occur. For more information about areas of estimation uncertainty that are considered to require critical judgment, refer to “Note 1a Significant accounting policies” in the “Consolidated financial statements” section of the Annual Report 2020.
Amendments to IFRS 9, IAS 39 and IFRS 7 (Interest Rate Benchmark Reform – Phase 2)
On 1 January 2021, UBS AG adopted Interest Rate Benchmark Reform – Phase 2, Amendments to IFRS 9, IAS 39, IFRS 7, IFRS 4 and IFRS 16, addressing a number of issues in financial reporting areas that arise when interbank offered rates (IBORs) are reformed or replaced.
The amendments provide a practical expedient which permits certain changes in the contractual cash flows of debt instruments attributable to the replacement of IBORs with alternative reference rates (ARRs) to be accounted for prospectively by updating the instrument’s effective interest rate (EIR), provided (i) the change is necessary as a direct consequence of IBOR reform and (ii) the new basis for determining the contractual cash flows is economically equivalent to the previous basis.
UBS AG adopted the amendments, which provide a practical expedient with no material effect on the its financial statements.

27
Note 1 Basis of accounting and other financial reporting effects (continued)
Furthermore, the amendments provide various hedge accounting reliefs, with the following expected to benefit UBS AG.– Risk components
The amendments permit UBS AG to designate an alternative benchmark rate as a non-contractually specified risk component, even if it is not separately identifiable at the date when it is designated, provided UBS AG can reasonably expect that it will meet the requirements within 24 months of the first designation and the risk component is reliably measurable. As of 30 June 2021, the alternative benchmark rates that UBS AG has designated as the hedged risk in fair value hedges of interest rate risk related to debt instruments and cash flow hedges of forecast transactions were the Secured Overnight Financing Rate (SOFR), the Swiss Average Rate Overnight (SARON) and the Sterling Overnight Index Average (SONIA). The designated notionals were USD 11 billion, USD 1.1 billion and USD 0.7 billion, respectively.
– Hedge designationFollowing amendments to the hedge documentation to reflect the change in designation relating to IBOR reform, UBS AG will continue its hedge relationships provided the other hedge accounting criteria and requirements of the phase 2 amendment are met. As of 30 June 2021, no such changes have been made.
– Amounts accumulated in the cash flow hedge reserveUpon changing the hedge designation as set out above, the accumulated amounts in the cash flow hedge reserve are
assumed to be based on the alternative benchmark rate. For discontinued hedging relationships, when the interest rate benchmark on which the hedged future cash flows were based is changed as required by IBOR reform, the amount accumulated in the cash flow hedge reserve is also assumed to be based on the alternative benchmark rate for the purpose of assessing whether the hedged future cash flows are still expected to occur. As of 30 June 2021, no such changes have been made.
– Retrospective effectiveness assessment as applied to hedges designated under IAS 39Upon the end of the phase 1 relief for effectiveness assessment UBS AG may elect to reset to zero the cumulative fair value changes of the hedged item and hedging instrument for the purpose of assessing the retrospective effectiveness of a hedging relationship. As of 30 June 2021, no such election has been made.› Refer to “Note 25 Hedge accounting” in the “Consolidated
financial statements” section of the Annual Report 2020 for
details about phase 1 accounting reliefs
The amendments also introduced additional disclosure requirements regarding UBS AG’s management of the transition to alternative benchmark rates, its progress at the reporting date and the risks to which it is exposed arising from financial instruments because of the transition.
› Refer to Note 15 for more information

Notes to the UBS AG interim consolidated financial statements (unaudited)
28
Note 2 Segment reporting
UBS AG’s businesses are organized globally into four business divisions: Global Wealth Management, Personal & Corporate Banking, Asset Management and the Investment Bank. All four business divisions are supported by Group Functions and qualify as reportable segments for the purpose of segment reporting. Together with Group Functions they reflect the management structure of UBS AG.
› Refer to “Note 2 Segment reporting” in the “Consolidated
financial statements” section of the Annual Report 2020 for
more information about UBS AG’s reporting segments
USD millionGlobal Wealth Management
Personal & Corporate
BankingAsset
ManagementInvestment
BankGroup
Functions UBS AG
For the six months ended 30 June 2021Net interest income 2,023 1,039 (7) 244 (103) 3,196Non-interest income 7,582 1,063 1,310 4,479 167 14,603Income 9,606 2,103 1,303 4,724 64 17,798Credit loss (expense) / release 16 69 0 23 (1) 108Total operating income 9,622 2,172 1,303 4,747 63 17,906Total operating expenses 6,958 1,286 822 3,698 511 13,274Operating profit / (loss) before tax 2,664 886 481 1,049 (448) 4,632Tax expense / (benefit) 1,001Net profit / (loss) 3,631
As of 30 June 2021Total assets 375,076 222,013 29,027 344,069 115,675 1,085,861
USD millionGlobal Wealth Management
Personal & Corporate
BankingAsset
ManagementInvestment
BankGroup
Functions UBS AG
For the six months ended 30 June 2020Net interest income 2,054 1,029 (9) 3 (387) 2,689Non-interest income 6,553 886 1,048 4,906 (20) 13,372Income 8,607 1,914 1,038 4,909 (407) 16,061Credit loss (expense) / release (117) (187) 0 (200) (35) (540)Total operating income 8,489 1,727 1,038 4,709 (443) 15,521Total operating expenses 6,421 1,155 724 3,419 478 12,197Operating profit / (loss) before tax 2,068 573 314 1,290 (921) 3,324Tax expense / (benefit) 703Net profit / (loss) 2,621
As of 31 December 2020Total assets 367,714 231,710 28,266 369,778 127,858 1,125,327
29
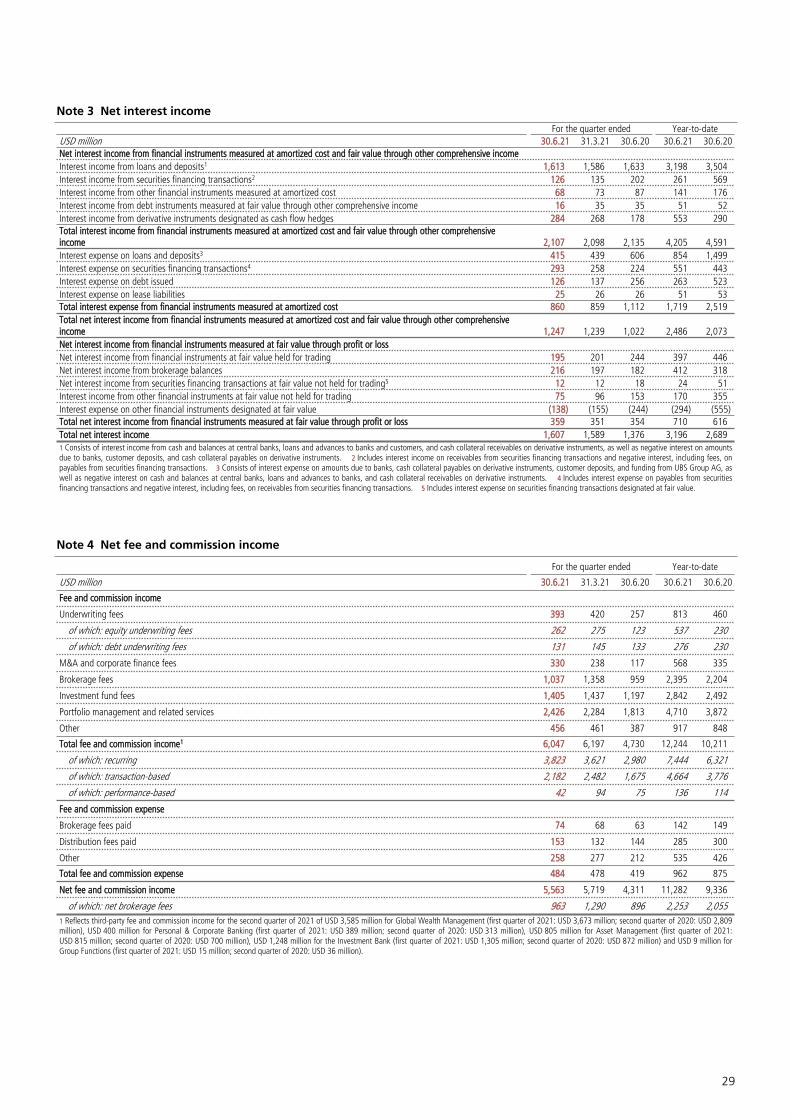
Note 3 Net interest incomeFor the quarter ended Year-to-date
USD million 30.6.21 31.3.21 30.6.20 30.6.21 30.6.20Net interest income from financial instruments measured at amortized cost and fair value through other comprehensive incomeInterest income from loans and deposits1 1,613 1,586 1,633 3,198 3,504Interest income from securities financing transactions2 126 135 202 261 569Interest income from other financial instruments measured at amortized cost 68 73 87 141 176Interest income from debt instruments measured at fair value through other comprehensive income 16 35 35 51 52Interest income from derivative instruments designated as cash flow hedges 284 268 178 553 290Total interest income from financial instruments measured at amortized cost and fair value through other comprehensive income 2,107 2,098 2,135 4,205 4,591Interest expense on loans and deposits3 415 439 606 854 1,499Interest expense on securities financing transactions4 293 258 224 551 443Interest expense on debt issued 126 137 256 263 523Interest expense on lease liabilities 25 26 26 51 53Total interest expense from financial instruments measured at amortized cost 860 859 1,112 1,719 2,519Total net interest income from financial instruments measured at amortized cost and fair value through other comprehensive income 1,247 1,239 1,022 2,486 2,073Net interest income from financial instruments measured at fair value through profit or lossNet interest income from financial instruments at fair value held for trading 195 201 244 397 446Net interest income from brokerage balances 216 197 182 412 318Net interest income from securities financing transactions at fair value not held for trading5 12 12 18 24 51Interest income from other financial instruments at fair value not held for trading 75 96 153 170 355Interest expense on other financial instruments designated at fair value (138) (155) (244) (294) (555)Total net interest income from financial instruments measured at fair value through profit or loss 359 351 354 710 616Total net interest income 1,607 1,589 1,376 3,196 2,6891 Consists of interest income from cash and balances at central banks, loans and advances to banks and customers, and cash collateral receivables on derivative instruments, as well as negative interest on amounts due to banks, customer deposits, and cash collateral payables on derivative instruments. 2 Includes interest income on receivables from securities financing transactions and negative interest, including fees, on payables from securities financing transactions. 3 Consists of interest expense on amounts due to banks, cash collateral payables on derivative instruments, customer deposits, and funding from UBS Group AG, as well as negative interest on cash and balances at central banks, loans and advances to banks, and cash collateral receivables on derivative instruments. 4 Includes interest expense on payables from securities financing transactions and negative interest, including fees, on receivables from securities financing transactions. 5 Includes interest expense on securities financing transactions designated at fair value.
Note 4 Net fee and commission income
For the quarter ended Year-to-date
USD million 30.6.21 31.3.21 30.6.20 30.6.21 30.6.20
Fee and commission income
Underwriting fees 393 420 257 813 460
of which: equity underwriting fees 262 275 123 537 230
of which: debt underwriting fees 131 145 133 276 230
M&A and corporate finance fees 330 238 117 568 335
Brokerage fees 1,037 1,358 959 2,395 2,204
Investment fund fees 1,405 1,437 1,197 2,842 2,492
Portfolio management and related services 2,426 2,284 1,813 4,710 3,872
Other 456 461 387 917 848
Total fee and commission income1 6,047 6,197 4,730 12,244 10,211
of which: recurring 3,823 3,621 2,980 7,444 6,321
of which: transaction-based 2,182 2,482 1,675 4,664 3,776
of which: performance-based 42 94 75 136 114
Fee and commission expense
Brokerage fees paid 74 68 63 142 149
Distribution fees paid 153 132 144 285 300
Other 258 277 212 535 426
Total fee and commission expense 484 478 419 962 875
Net fee and commission income 5,563 5,719 4,311 11,282 9,336
of which: net brokerage fees 963 1,290 896 2,253 2,0551 Reflects third-party fee and commission income for the second quarter of 2021 of USD 3,585 million for Global Wealth Management (first quarter of 2021: USD 3,673 million; second quarter of 2020: USD 2,809 million), USD 400 million for Personal & Corporate Banking (first quarter of 2021: USD 389 million; second quarter of 2020: USD 313 million), USD 805 million for Asset Management (first quarter of 2021: USD 815 million; second quarter of 2020: USD 700 million), USD 1,248 million for the Investment Bank (first quarter of 2021: USD 1,305 million; second quarter of 2020: USD 872 million) and USD 9 million for Group Functions (first quarter of 2021: USD 15 million; second quarter of 2020: USD 36 million).

Notes to the UBS AG interim consolidated financial statements (unaudited)
30
Note 5 Other income
UBS AG recognized USD 350 million of other income in the second quarter of 2021, compared with USD 153 million in the second quarter of 2020. This includes gains of USD 101 million from properties held for sale, largely driven by the sale of a
property in Basel, and other income of USD 45 million related to a legacy bankruptcy claim. In addition, the investment in Clearstream Fund Centre was sold to Deutsche Börse AG during the quarter, resulting in a USD 37 million net gain.
Note 6 Personnel expenses
For the quarter ended Year-to-date
USD million 30.6.21 31.3.21 30.6.20 30.6.21 30.6.20
Salaries and variable compensation 2,432 2,370 2,276 4,802 4,408
Financial advisor compensation1 1,183 1,170 941 2,353 2,035
Contractors 38 36 35 75 64
Social security 187 211 182 398 347
Post-employment benefit plans 1242 194 143 319 321
Other personnel expenses 108 105 104 212 217
Total personnel expenses 4,072 4,086 3,682 8,158 7,3911 Financial advisor compensation consists of grid-based compensation based directly on compensable revenues generated by financial advisors and supplemental compensation calculated on the basis of financial advisor productivity, firm tenure, assets and other variables. It also includes expenses related to compensation commitments with financial advisors entered into at the time of recruitment that are subject to vesting requirements. 2 Includes curtailment gains of USD 36 million, which represent a reduction in the defined benefit obligation related to the Swiss pension plan resulting from a decrease in headcount following restructuring activities.
Note 7 General and administrative expenses
For the quarter ended Year-to-date
USD million 30.6.21 31.3.21 30.6.20 30.6.21 30.6.20
Outsourcing costs 95 89 99 184 211
IT expenses 122 125 106 247 222
Consulting, legal and audit fees 115 84 137 199 269
Real estate and logistics costs 126 127 134 253 271
Market data services 93 89 89 182 175
Marketing & communication 36 32 25 68 56
Travel and entertainment 12 8 10 20 54
Litigation, regulatory & similar matters1 63 9 2 72 8
Other2 1,408 1,578 1,278 2,986 2,695
of which: shared services costs charged by UBS Group AG or its subsidiaries 1,294 1,375 1,127 2,669 2,377
of which: UK and German bank levies (11) 41 3 30 17
Total general and administrative expenses 2,070 2,141 1,879 4,211 3,9601 Reflects the net increase in / (release of) provisions for litigation, regulatory and similar matters recognized in the income statement. Refer to Note 16 for more information. 2 Includes charitable donations.
Note 8 Income taxes
Income tax expenses of USD 563 million were recognized for the second quarter of 2021, representing an effective tax rate of 22.7%, compared with USD 328 million for the second quarter of 2020 and an effective tax rate of 21.5%.
Current tax expenses were USD 346 million, compared with USD 329 million, and related to taxable profits of UBS Switzerland AG and other entities.
Deferred tax expenses were USD 217 million, compared with a net deferred tax benefit of USD 1 million, and primarily related to the amortization of deferred tax assets previously recognized in relation to tax losses carried forward and deductible temporary differences of UBS Americas Inc.
31
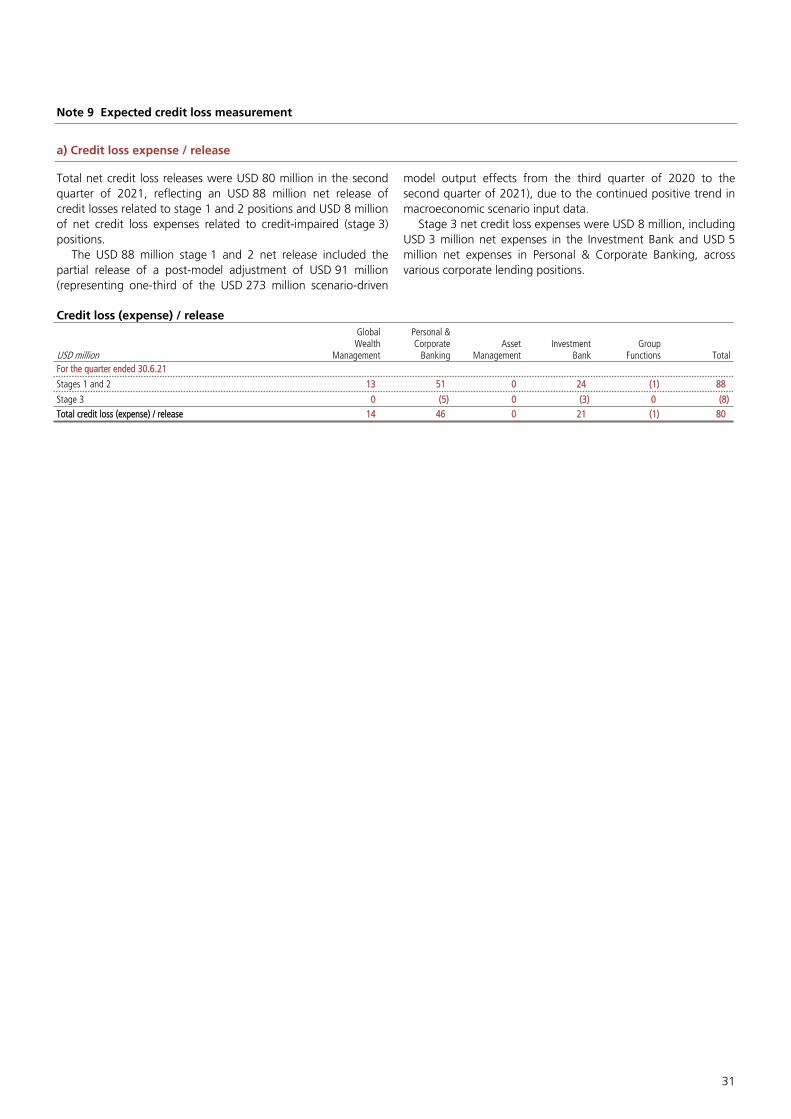
Note 9 Expected credit loss measurement
a) Credit loss expense / release
Total net credit loss releases were USD 80 million in the second quarter of 2021, reflecting an USD 88 million net release of credit losses related to stage 1 and 2 positions and USD 8 million of net credit loss expenses related to credit-impaired (stage 3) positions.
The USD 88 million stage 1 and 2 net release included the partial release of a post-model adjustment of USD 91 million (representing one-third of the USD 273 million scenario-driven
model output effects from the third quarter of 2020 to the second quarter of 2021), due to the continued positive trend in macroeconomic scenario input data.
Stage 3 net credit loss expenses were USD 8 million, including USD 3 million net expenses in the Investment Bank and USD 5 million net expenses in Personal & Corporate Banking, across various corporate lending positions.
Credit loss (expense) / release
USD million
Global Wealth
Management
Personal & Corporate
BankingAsset
ManagementInvestment
BankGroup
Functions TotalFor the quarter ended 30.6.21
Stages 1 and 2 13 51 0 24 (1) 88
Stage 3 0 (5) 0 (3) 0 (8)Total credit loss (expense) / release 14 46 0 21 (1) 80
Notes to the UBS AG interim consolidated financial statements (unaudited)
32
Note 9 Expected credit loss measurement (continued)
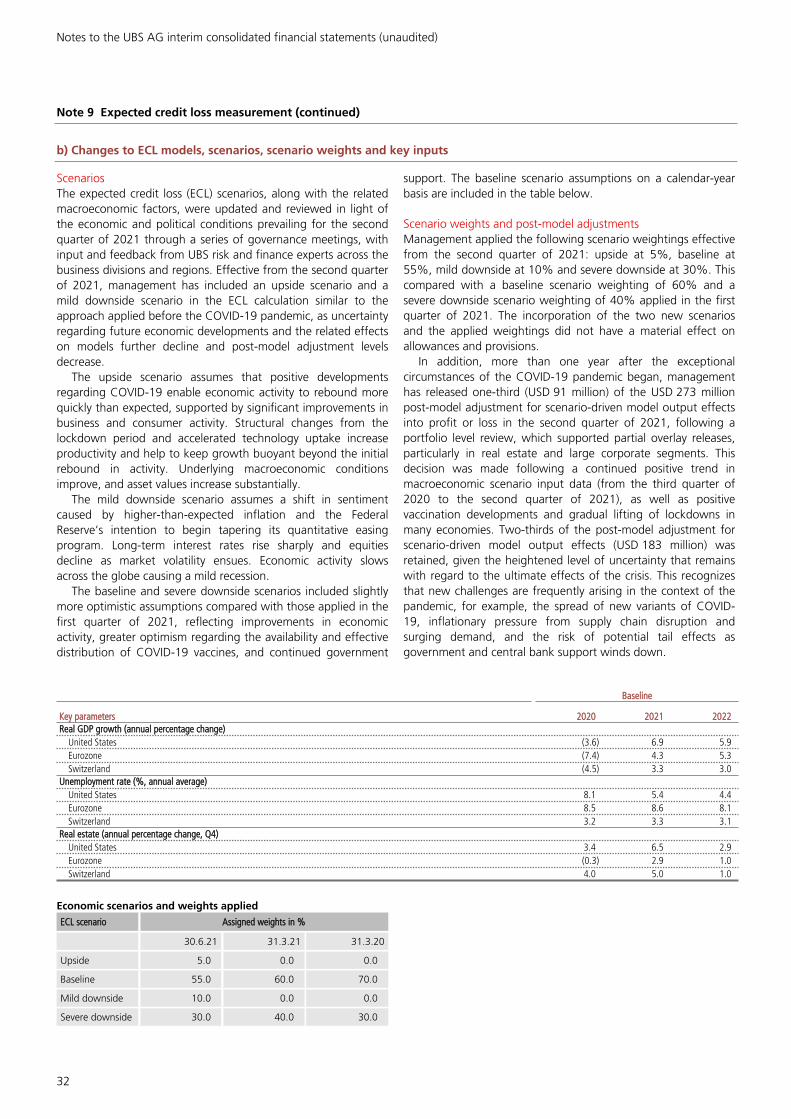
b) Changes to ECL models, scenarios, scenario weights and key inputs
Scenarios The expected credit loss (ECL) scenarios, along with the related macroeconomic factors, were updated and reviewed in light of the economic and political conditions prevailing for the second quarter of 2021 through a series of governance meetings, with input and feedback from UBS risk and finance experts across the business divisions and regions. Effective from the second quarter of 2021, management has included an upside scenario and a mild downside scenario in the ECL calculation similar to the approach applied before the COVID-19 pandemic, as uncertainty regarding future economic developments and the related effects on models further decline and post-model adjustment levels decrease.
The upside scenario assumes that positive developments regarding COVID-19 enable economic activity to rebound more quickly than expected, supported by significant improvements in business and consumer activity. Structural changes from the lockdown period and accelerated technology uptake increase productivity and help to keep growth buoyant beyond the initial rebound in activity. Underlying macroeconomic conditions improve, and asset values increase substantially.
The mild downside scenario assumes a shift in sentiment caused by higher-than-expected inflation and the Federal Reserve’s intention to begin tapering its quantitative easing program. Long-term interest rates rise sharply and equities decline as market volatility ensues. Economic activity slows across the globe causing a mild recession.
The baseline and severe downside scenarios included slightly more optimistic assumptions compared with those applied in the first quarter of 2021, reflecting improvements in economic activity, greater optimism regarding the availability and effective distribution of COVID-19 vaccines, and continued government
support. The baseline scenario assumptions on a calendar-year basis are included in the table below.
Scenario weights and post-model adjustmentsManagement applied the following scenario weightings effective from the second quarter of 2021: upside at 5%, baseline at 55%, mild downside at 10% and severe downside at 30%. This compared with a baseline scenario weighting of 60% and a severe downside scenario weighting of 40% applied in the first quarter of 2021. The incorporation of the two new scenarios and the applied weightings did not have a material effect on allowances and provisions.
In addition, more than one year after the exceptional circumstances of the COVID-19 pandemic began, management has released one-third (USD 91 million) of the USD 273 million post-model adjustment for scenario-driven model output effects into profit or loss in the second quarter of 2021, following a portfolio level review, which supported partial overlay releases, particularly in real estate and large corporate segments. This decision was made following a continued positive trend in macroeconomic scenario input data (from the third quarter of 2020 to the second quarter of 2021), as well as positive vaccination developments and gradual lifting of lockdowns in many economies. Two-thirds of the post-model adjustment for scenario-driven model output effects (USD 183 million) was retained, given the heightened level of uncertainty that remains with regard to the ultimate effects of the crisis. This recognizes that new challenges are frequently arising in the context of the pandemic, for example, the spread of new variants of COVID-19, inflationary pressure from supply chain disruption and surging demand, and the risk of potential tail effects as government and central bank support winds down.
Baseline
Key parameters 2020 2021 2022Real GDP growth (annual percentage change)
United States (3.6) 6.9 5.9Eurozone (7.4) 4.3 5.3Switzerland (4.5) 3.3 3.0
Unemployment rate (%, annual average)United States 8.1 5.4 4.4Eurozone 8.5 8.6 8.1Switzerland 3.2 3.3 3.1
Real estate (annual percentage change, Q4)United States 3.4 6.5 2.9Eurozone (0.3) 2.9 1.0Switzerland 4.0 5.0 1.0
Economic scenarios and weights applied
ECL scenario Assigned weights in %
30.6.21 31.3.21 31.3.20
Upside 5.0 0.0 0.0
Baseline 55.0 60.0 70.0
Mild downside 10.0 0.0 0.0
Severe downside 30.0 40.0 30.0
33
Note 9 Expected credit loss measurement (continued)
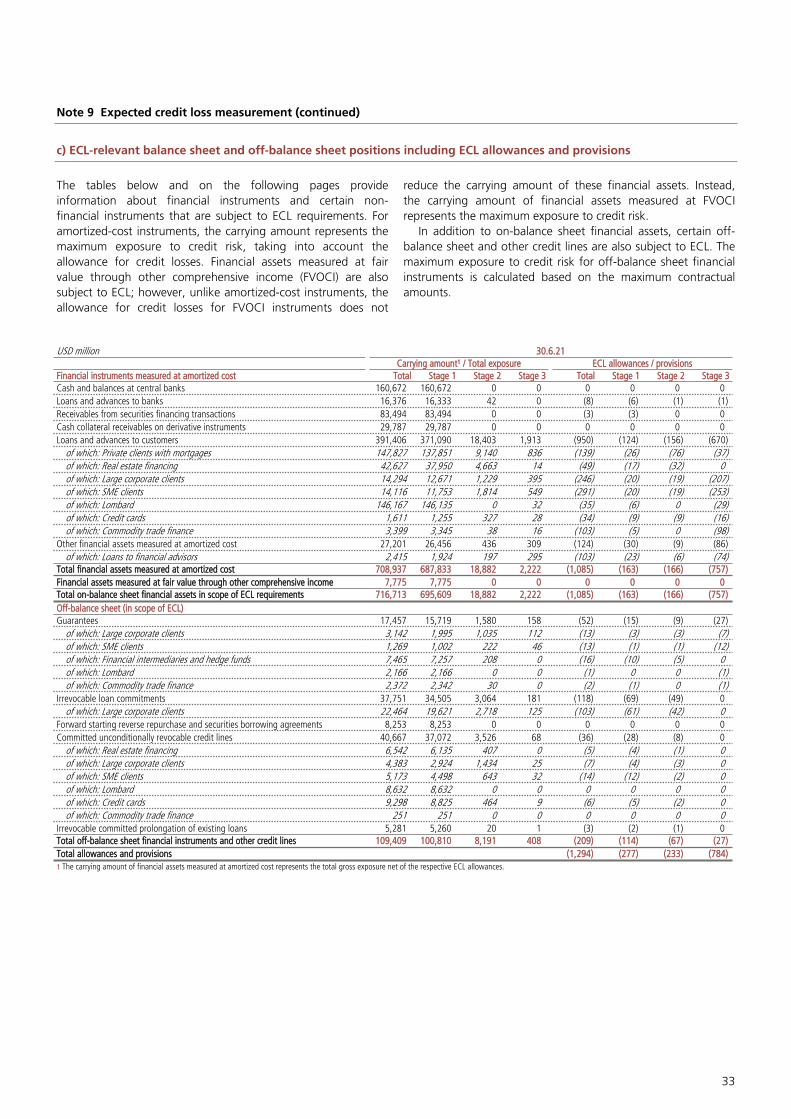
c) ECL-relevant balance sheet and off-balance sheet positions including ECL allowances and provisions
The tables below and on the following pages provide information about financial instruments and certain non-financial instruments that are subject to ECL requirements. For amortized-cost instruments, the carrying amount represents the maximum exposure to credit risk, taking into account the allowance for credit losses. Financial assets measured at fair value through other comprehensive income (FVOCI) are also subject to ECL; however, unlike amortized-cost instruments, the allowance for credit losses for FVOCI instruments does not
reduce the carrying amount of these financial assets. Instead, the carrying amount of financial assets measured at FVOCI represents the maximum exposure to credit risk.
In addition to on-balance sheet financial assets, certain off-balance sheet and other credit lines are also subject to ECL. The maximum exposure to credit risk for off-balance sheet financial instruments is calculated based on the maximum contractual amounts.
USD million 30.6.21Carrying amount¹ / Total exposure ECL allowances / provisions
Financial instruments measured at amortized cost Total Stage 1 Stage 2 Stage 3 Total Stage 1 Stage 2 Stage 3Cash and balances at central banks 160,672 160,672 0 0 0 0 0 0Loans and advances to banks 16,376 16,333 42 0 (8) (6) (1) (1)Receivables from securities financing transactions 83,494 83,494 0 0 (3) (3) 0 0Cash collateral receivables on derivative instruments 29,787 29,787 0 0 0 0 0 0Loans and advances to customers 391,406 371,090 18,403 1,913 (950) (124) (156) (670)
of which: Private clients with mortgages 147,827 137,851 9,140 836 (139) (26) (76) (37)of which: Real estate financing 42,627 37,950 4,663 14 (49) (17) (32) 0of which: Large corporate clients 14,294 12,671 1,229 395 (246) (20) (19) (207)of which: SME clients 14,116 11,753 1,814 549 (291) (20) (19) (253)of which: Lombard 146,167 146,135 0 32 (35) (6) 0 (29)of which: Credit cards 1,611 1,255 327 28 (34) (9) (9) (16)of which: Commodity trade finance 3,399 3,345 38 16 (103) (5) 0 (98)
Other financial assets measured at amortized cost 27,201 26,456 436 309 (124) (30) (9) (86)of which: Loans to financial advisors 2,415 1,924 197 295 (103) (23) (6) (74)
Total financial assets measured at amortized cost 708,937 687,833 18,882 2,222 (1,085) (163) (166) (757)Financial assets measured at fair value through other comprehensive income 7,775 7,775 0 0 0 0 0 0Total on-balance sheet financial assets in scope of ECL requirements 716,713 695,609 18,882 2,222 (1,085) (163) (166) (757)Off-balance sheet (in scope of ECL)Guarantees 17,457 15,719 1,580 158 (52) (15) (9) (27)
of which: Large corporate clients 3,142 1,995 1,035 112 (13) (3) (3) (7)of which: SME clients 1,269 1,002 222 46 (13) (1) (1) (12)of which: Financial intermediaries and hedge funds 7,465 7,257 208 0 (16) (10) (5) 0of which: Lombard 2,166 2,166 0 0 (1) 0 0 (1)of which: Commodity trade finance 2,372 2,342 30 0 (2) (1) 0 (1)
Irrevocable loan commitments 37,751 34,505 3,064 181 (118) (69) (49) 0of which: Large corporate clients 22,464 19,621 2,718 125 (103) (61) (42) 0
Forward starting reverse repurchase and securities borrowing agreements 8,253 8,253 0 0 0 0 0 0Committed unconditionally revocable credit lines 40,667 37,072 3,526 68 (36) (28) (8) 0
of which: Real estate financing 6,542 6,135 407 0 (5) (4) (1) 0of which: Large corporate clients 4,383 2,924 1,434 25 (7) (4) (3) 0of which: SME clients 5,173 4,498 643 32 (14) (12) (2) 0of which: Lombard 8,632 8,632 0 0 0 0 0 0of which: Credit cards 9,298 8,825 464 9 (6) (5) (2) 0of which: Commodity trade finance 251 251 0 0 0 0 0 0
Irrevocable committed prolongation of existing loans 5,281 5,260 20 1 (3) (2) (1) 0Total off-balance sheet financial instruments and other credit lines 109,409 100,810 8,191 408 (209) (114) (67) (27)Total allowances and provisions (1,294) (277) (233) (784)1 The carrying amount of financial assets measured at amortized cost represents the total gross exposure net of the respective ECL allowances.
Notes to the UBS AG interim consolidated financial statements (unaudited)
34
Note 9 Expected credit loss measurement (continued)
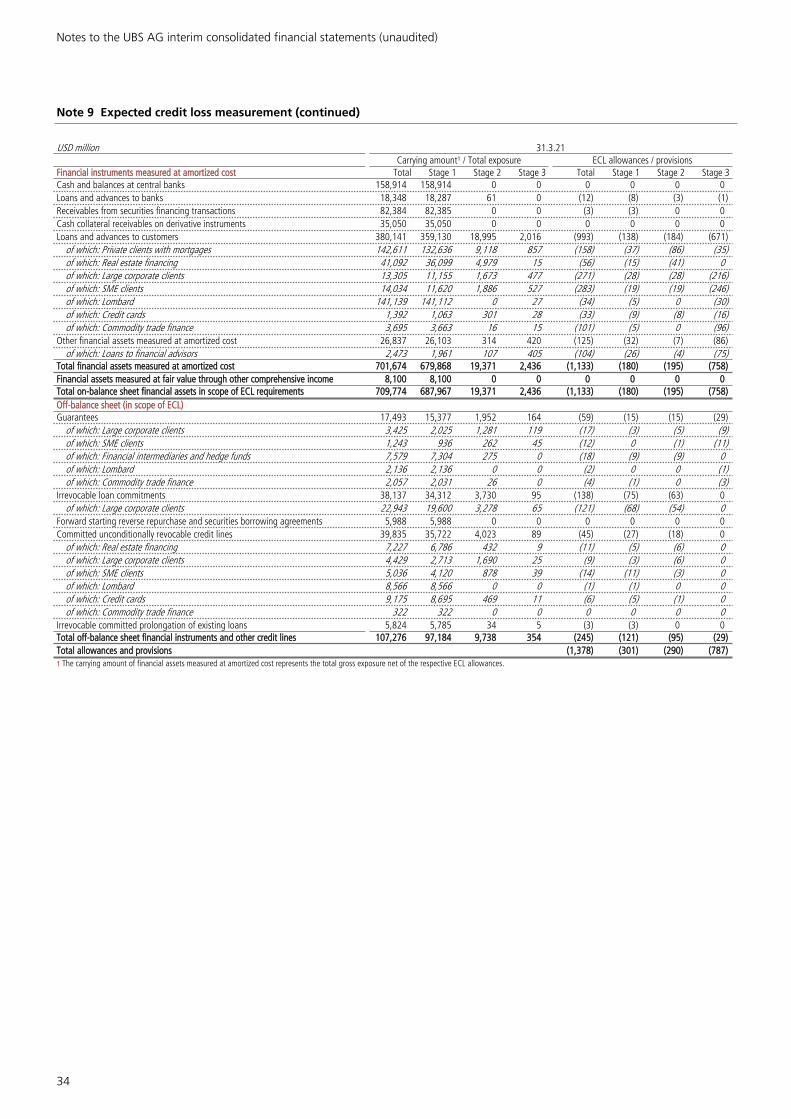
USD million 31.3.21Carrying amount¹ / Total exposure ECL allowances / provisions
Financial instruments measured at amortized cost Total Stage 1 Stage 2 Stage 3 Total Stage 1 Stage 2 Stage 3Cash and balances at central banks 158,914 158,914 0 0 0 0 0 0Loans and advances to banks 18,348 18,287 61 0 (12) (8) (3) (1)Receivables from securities financing transactions 82,384 82,385 0 0 (3) (3) 0 0Cash collateral receivables on derivative instruments 35,050 35,050 0 0 0 0 0 0Loans and advances to customers 380,141 359,130 18,995 2,016 (993) (138) (184) (671)
of which: Private clients with mortgages 142,611 132,636 9,118 857 (158) (37) (86) (35)of which: Real estate financing 41,092 36,099 4,979 15 (56) (15) (41) 0of which: Large corporate clients 13,305 11,155 1,673 477 (271) (28) (28) (216)of which: SME clients 14,034 11,620 1,886 527 (283) (19) (19) (246)of which: Lombard 141,139 141,112 0 27 (34) (5) 0 (30)of which: Credit cards 1,392 1,063 301 28 (33) (9) (8) (16)of which: Commodity trade finance 3,695 3,663 16 15 (101) (5) 0 (96)
Other financial assets measured at amortized cost 26,837 26,103 314 420 (125) (32) (7) (86)of which: Loans to financial advisors 2,473 1,961 107 405 (104) (26) (4) (75)
Total financial assets measured at amortized cost 701,674 679,868 19,371 2,436 (1,133) (180) (195) (758)Financial assets measured at fair value through other comprehensive income 8,100 8,100 0 0 0 0 0 0Total on-balance sheet financial assets in scope of ECL requirements 709,774 687,967 19,371 2,436 (1,133) (180) (195) (758)Off-balance sheet (in scope of ECL)Guarantees 17,493 15,377 1,952 164 (59) (15) (15) (29)
of which: Large corporate clients 3,425 2,025 1,281 119 (17) (3) (5) (9)of which: SME clients 1,243 936 262 45 (12) 0 (1) (11)of which: Financial intermediaries and hedge funds 7,579 7,304 275 0 (18) (9) (9) 0of which: Lombard 2,136 2,136 0 0 (2) 0 0 (1)of which: Commodity trade finance 2,057 2,031 26 0 (4) (1) 0 (3)
Irrevocable loan commitments 38,137 34,312 3,730 95 (138) (75) (63) 0of which: Large corporate clients 22,943 19,600 3,278 65 (121) (68) (54) 0
Forward starting reverse repurchase and securities borrowing agreements 5,988 5,988 0 0 0 0 0 0Committed unconditionally revocable credit lines 39,835 35,722 4,023 89 (45) (27) (18) 0
of which: Real estate financing 7,227 6,786 432 9 (11) (5) (6) 0of which: Large corporate clients 4,429 2,713 1,690 25 (9) (3) (6) 0of which: SME clients 5,036 4,120 878 39 (14) (11) (3) 0of which: Lombard 8,566 8,566 0 0 (1) (1) 0 0of which: Credit cards 9,175 8,695 469 11 (6) (5) (1) 0of which: Commodity trade finance 322 322 0 0 0 0 0 0
Irrevocable committed prolongation of existing loans 5,824 5,785 34 5 (3) (3) 0 0Total off-balance sheet financial instruments and other credit lines 107,276 97,184 9,738 354 (245) (121) (95) (29)Total allowances and provisions (1,378) (301) (290) (787)1 The carrying amount of financial assets measured at amortized cost represents the total gross exposure net of the respective ECL allowances.
35
Note 9 Expected credit loss measurement (continued)
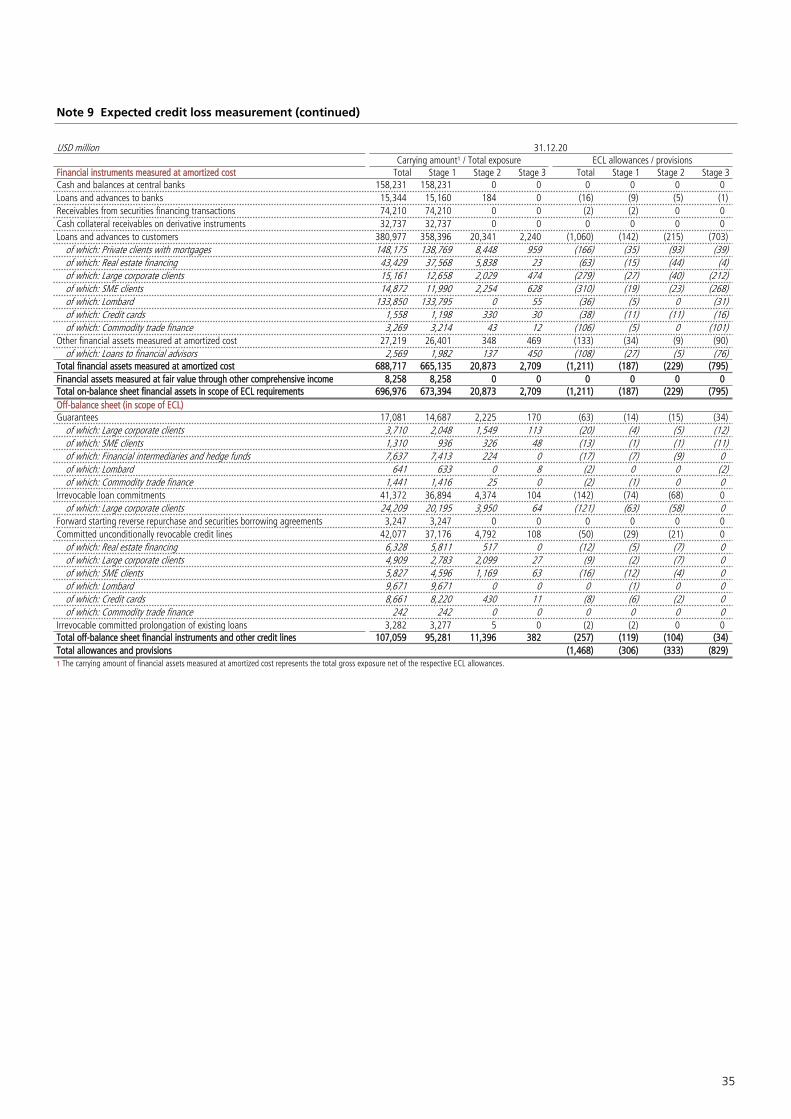
USD million 31.12.20Carrying amount¹ / Total exposure ECL allowances / provisions
Financial instruments measured at amortized cost Total Stage 1 Stage 2 Stage 3 Total Stage 1 Stage 2 Stage 3Cash and balances at central banks 158,231 158,231 0 0 0 0 0 0Loans and advances to banks 15,344 15,160 184 0 (16) (9) (5) (1)Receivables from securities financing transactions 74,210 74,210 0 0 (2) (2) 0 0Cash collateral receivables on derivative instruments 32,737 32,737 0 0 0 0 0 0Loans and advances to customers 380,977 358,396 20,341 2,240 (1,060) (142) (215) (703)
of which: Private clients with mortgages 148,175 138,769 8,448 959 (166) (35) (93) (39)of which: Real estate financing 43,429 37,568 5,838 23 (63) (15) (44) (4)of which: Large corporate clients 15,161 12,658 2,029 474 (279) (27) (40) (212)of which: SME clients 14,872 11,990 2,254 628 (310) (19) (23) (268)of which: Lombard 133,850 133,795 0 55 (36) (5) 0 (31)of which: Credit cards 1,558 1,198 330 30 (38) (11) (11) (16)of which: Commodity trade finance 3,269 3,214 43 12 (106) (5) 0 (101)
Other financial assets measured at amortized cost 27,219 26,401 348 469 (133) (34) (9) (90)of which: Loans to financial advisors 2,569 1,982 137 450 (108) (27) (5) (76)
Total financial assets measured at amortized cost 688,717 665,135 20,873 2,709 (1,211) (187) (229) (795)Financial assets measured at fair value through other comprehensive income 8,258 8,258 0 0 0 0 0 0Total on-balance sheet financial assets in scope of ECL requirements 696,976 673,394 20,873 2,709 (1,211) (187) (229) (795)Off-balance sheet (in scope of ECL)Guarantees 17,081 14,687 2,225 170 (63) (14) (15) (34)
of which: Large corporate clients 3,710 2,048 1,549 113 (20) (4) (5) (12)of which: SME clients 1,310 936 326 48 (13) (1) (1) (11)of which: Financial intermediaries and hedge funds 7,637 7,413 224 0 (17) (7) (9) 0of which: Lombard 641 633 0 8 (2) 0 0 (2)of which: Commodity trade finance 1,441 1,416 25 0 (2) (1) 0 0
Irrevocable loan commitments 41,372 36,894 4,374 104 (142) (74) (68) 0of which: Large corporate clients 24,209 20,195 3,950 64 (121) (63) (58) 0
Forward starting reverse repurchase and securities borrowing agreements 3,247 3,247 0 0 0 0 0 0Committed unconditionally revocable credit lines 42,077 37,176 4,792 108 (50) (29) (21) 0
of which: Real estate financing 6,328 5,811 517 0 (12) (5) (7) 0of which: Large corporate clients 4,909 2,783 2,099 27 (9) (2) (7) 0of which: SME clients 5,827 4,596 1,169 63 (16) (12) (4) 0of which: Lombard 9,671 9,671 0 0 0 (1) 0 0of which: Credit cards 8,661 8,220 430 11 (8) (6) (2) 0of which: Commodity trade finance 242 242 0 0 0 0 0 0
Irrevocable committed prolongation of existing loans 3,282 3,277 5 0 (2) (2) 0 0Total off-balance sheet financial instruments and other credit lines 107,059 95,281 11,396 382 (257) (119) (104) (34)Total allowances and provisions (1,468) (306) (333) (829)1 The carrying amount of financial assets measured at amortized cost represents the total gross exposure net of the respective ECL allowances.

Notes to the UBS AG interim consolidated financial statements (unaudited)
36
Note 9 Expected credit loss measurement (continued)
The table below provides information about the ECL gross exposure and the ECL coverage ratio for our core loan portfolios (i.e., Loans and advances to customers and Loans to financial advisors) and relevant off-balance sheet exposures. Cash and balances at central banks, Loans and advances to banks, Receivables from securities financing transactions, Cash collateral receivables on derivative instruments and Financial assets
measured at fair value through other comprehensive income are not included in the table below, due to their lower sensitivity to ECL.
ECL coverage ratios are calculated by taking ECL allowances and provisions divided by the gross carrying amount of the exposures.
Coverage ratios for core loan portfolio 30.6.21
Gross carrying amount (USD million) ECL coverage (bps)On-balance sheet Total Stage 1 Stage 2 Stage 3 Total Stage 1 Stage 2 Stage 3
Private clients with mortgages 147,966 137,877 9,216 874 9 2 82 427Real estate financing 42,677 37,967 4,696 14 12 4 69 101Large corporate clients 14,540 12,691 1,247 602 169 16 151 3,446SME clients 14,407 11,772 1,833 802 202 17 102 3,152Lombard 146,202 146,141 0 61 2 0 0 4,698Credit cards 1,644 1,264 336 44 205 72 261 3,608Commodity trade finance 3,503 3,350 38 114 295 15 2 8,605Other loans and advances to customers 21,418 20,152 1,193 73 25 11 13 4,051Loans to financial advisors 2,518 1,946 202 369 408 116 290 2,016
Total1 394,875 373,161 18,762 2,952 27 4 86 2,521
Gross exposure (USD million) ECL coverage (bps)Off-balance sheet Total Stage 1 Stage 2 Stage 3 Total Stage 1 Stage 2 Stage 3
Private clients with mortgages 8,063 7,809 251 3 4 4 7 349Real estate financing 8,048 7,596 452 0 9 7 49 0Large corporate clients 29,990 24,540 5,187 262 41 27 91 278SME clients 8,273 7,099 1,040 134 43 20 91 878Lombard 14,736 14,735 0 0 1 0 0 0Credit cards 9,298 8,825 464 9 7 5 33 0Commodity trade finance 2,623 2,593 30 0 8 5 50 0Financial intermediaries and hedge funds 12,447 11,981 466 0 14 10 120 0Other off-balance sheet commitments 7,678 7,377 301 0 17 8 21 0
Total2 101,155 92,556 8,191 408 21 12 82 6711 Includes Loans and advances to customers of USD 392,357 million and Loans to financial advisors of USD 2,518 million, which are presented on the balance sheet line Other assets measured at amortized cost. 2 Excludes Forward starting reverse repurchase and securities borrowing agreements.
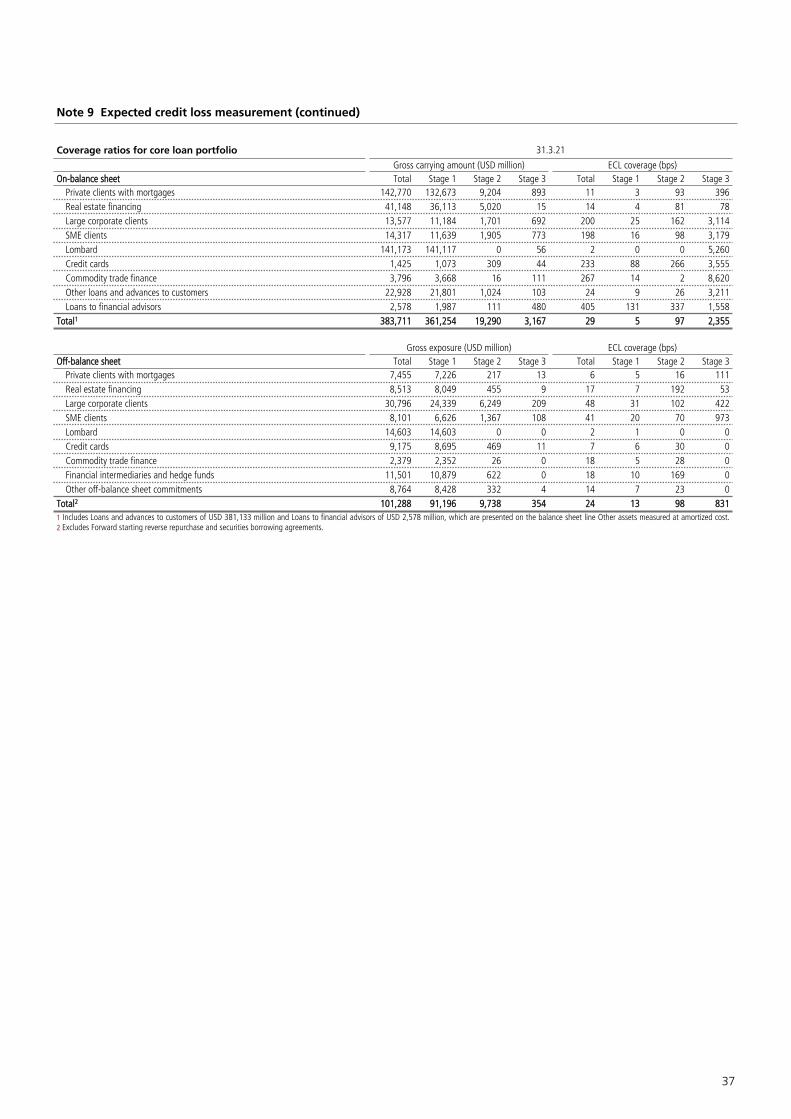
37
Note 9 Expected credit loss measurement (continued)
Coverage ratios for core loan portfolio 31.3.21
Gross carrying amount (USD million) ECL coverage (bps)On-balance sheet Total Stage 1 Stage 2 Stage 3 Total Stage 1 Stage 2 Stage 3
Private clients with mortgages 142,770 132,673 9,204 893 11 3 93 396Real estate financing 41,148 36,113 5,020 15 14 4 81 78Large corporate clients 13,577 11,184 1,701 692 200 25 162 3,114SME clients 14,317 11,639 1,905 773 198 16 98 3,179Lombard 141,173 141,117 0 56 2 0 0 5,260Credit cards 1,425 1,073 309 44 233 88 266 3,555Commodity trade finance 3,796 3,668 16 111 267 14 2 8,620Other loans and advances to customers 22,928 21,801 1,024 103 24 9 26 3,211Loans to financial advisors 2,578 1,987 111 480 405 131 337 1,558
Total1 383,711 361,254 19,290 3,167 29 5 97 2,355
Gross exposure (USD million) ECL coverage (bps)Off-balance sheet Total Stage 1 Stage 2 Stage 3 Total Stage 1 Stage 2 Stage 3
Private clients with mortgages 7,455 7,226 217 13 6 5 16 111Real estate financing 8,513 8,049 455 9 17 7 192 53Large corporate clients 30,796 24,339 6,249 209 48 31 102 422SME clients 8,101 6,626 1,367 108 41 20 70 973Lombard 14,603 14,603 0 0 2 1 0 0Credit cards 9,175 8,695 469 11 7 6 30 0Commodity trade finance 2,379 2,352 26 0 18 5 28 0Financial intermediaries and hedge funds 11,501 10,879 622 0 18 10 169 0Other off-balance sheet commitments 8,764 8,428 332 4 14 7 23 0
Total2 101,288 91,196 9,738 354 24 13 98 8311 Includes Loans and advances to customers of USD 381,133 million and Loans to financial advisors of USD 2,578 million, which are presented on the balance sheet line Other assets measured at amortized cost. 2 Excludes Forward starting reverse repurchase and securities borrowing agreements.
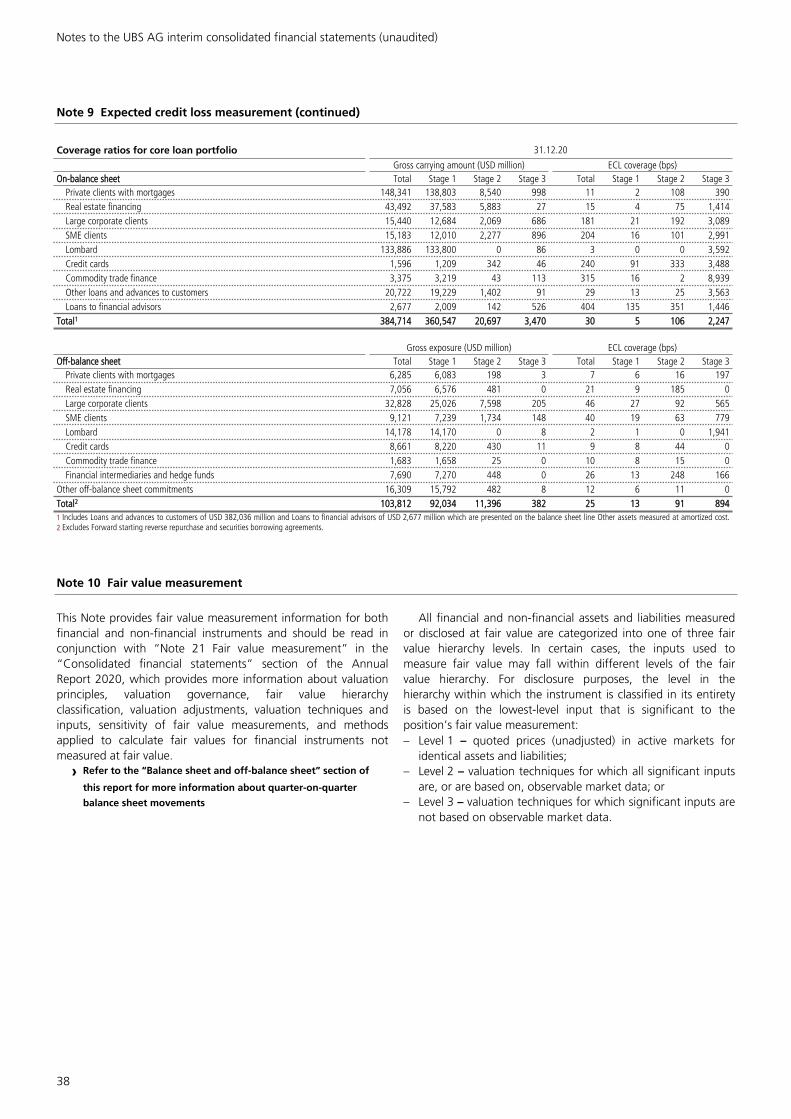
Notes to the UBS AG interim consolidated financial statements (unaudited)
38
Note 9 Expected credit loss measurement (continued)
Coverage ratios for core loan portfolio 31.12.20
Gross carrying amount (USD million) ECL coverage (bps)On-balance sheet Total Stage 1 Stage 2 Stage 3 Total Stage 1 Stage 2 Stage 3
Private clients with mortgages 148,341 138,803 8,540 998 11 2 108 390Real estate financing 43,492 37,583 5,883 27 15 4 75 1,414Large corporate clients 15,440 12,684 2,069 686 181 21 192 3,089SME clients 15,183 12,010 2,277 896 204 16 101 2,991Lombard 133,886 133,800 0 86 3 0 0 3,592Credit cards 1,596 1,209 342 46 240 91 333 3,488Commodity trade finance 3,375 3,219 43 113 315 16 2 8,939Other loans and advances to customers 20,722 19,229 1,402 91 29 13 25 3,563Loans to financial advisors 2,677 2,009 142 526 404 135 351 1,446
Total1 384,714 360,547 20,697 3,470 30 5 106 2,247
Gross exposure (USD million) ECL coverage (bps)Off-balance sheet Total Stage 1 Stage 2 Stage 3 Total Stage 1 Stage 2 Stage 3
Private clients with mortgages 6,285 6,083 198 3 7 6 16 197Real estate financing 7,056 6,576 481 0 21 9 185 0Large corporate clients 32,828 25,026 7,598 205 46 27 92 565SME clients 9,121 7,239 1,734 148 40 19 63 779Lombard 14,178 14,170 0 8 2 1 0 1,941Credit cards 8,661 8,220 430 11 9 8 44 0Commodity trade finance 1,683 1,658 25 0 10 8 15 0Financial intermediaries and hedge funds 7,690 7,270 448 0 26 13 248 166
Other off-balance sheet commitments 16,309 15,792 482 8 12 6 11 0Total2 103,812 92,034 11,396 382 25 13 91 8941 Includes Loans and advances to customers of USD 382,036 million and Loans to financial advisors of USD 2,677 million which are presented on the balance sheet line Other assets measured at amortized cost. 2 Excludes Forward starting reverse repurchase and securities borrowing agreements.
Note 10 Fair value measurement
This Note provides fair value measurement information for both financial and non-financial instruments and should be read in conjunction with “Note 21 Fair value measurement” in the “Consolidated financial statements” section of the Annual Report 2020, which provides more information about valuation principles, valuation governance, fair value hierarchy classification, valuation adjustments, valuation techniques and inputs, sensitivity of fair value measurements, and methods applied to calculate fair values for financial instruments not measured at fair value.
› Refer to the “Balance sheet and off-balance sheet” section of
this report for more information about quarter-on-quarter
balance sheet movements
All financial and non-financial assets and liabilities measured or disclosed at fair value are categorized into one of three fair value hierarchy levels. In certain cases, the inputs used to measure fair value may fall within different levels of the fair value hierarchy. For disclosure purposes, the level in the hierarchy within which the instrument is classified in its entirety is based on the lowest-level input that is significant to the position’s fair value measurement:– Level 1 – quoted prices (unadjusted) in active markets for
identical assets and liabilities;– Level 2 – valuation techniques for which all significant inputs
are, or are based on, observable market data; or– Level 3 – valuation techniques for which significant inputs are
not based on observable market data.

39
Note 10 Fair value measurement (continued)
a) Fair value hierarchy
The fair value hierarchy classification of financial and non-financial assets and liabilities measured at fair value is summarized in the table below.
Determination of fair values from quoted market prices or valuation techniques1
30.6.21 31.3.21 31.12.20USD million Level 1 Level 2 Level 3 Total Level 1 Level 2 Level 3 Total Level 1 Level 2 Level 3 Total
Financial assets measured at fair value on a recurring basis
Financial assets at fair value held for trading 103,722 16,782 2,123 122,628 101,907 16,630 2,179 120,717 107,526 15,630 2,337 125,492of which:Equity instruments 86,760 1,336 128 88,224 85,251 736 137 86,124 90,327 1,101 171 91,599Government bills / bonds 8,123 1,776 10 9,910 8,384 1,890 10 10,284 9,028 2,207 10 11,245Investment fund units 8,048 1,707 18 9,773 7,400 1,602 31 9,033 7,374 1,794 23 9,192Corporate and municipal bonds 784 8,524 821 10,129 865 9,926 783 11,575 789 8,432 817 10,038Loans 0 3,115 1,000 4,114 0 2,234 1,052 3,285 0 1,860 1,134 2,995Asset-backed securities 7 323 147 478 6 242 166 415 8 236 181 425
Derivative financial instruments 795 119,348 1,479 121,622 1,142 145,508 1,633 148,284 795 157,069 1,754 159,618of which:Foreign exchange contracts 296 49,154 6 49,456 459 70,221 12 70,692 319 68,425 5 68,750Interest rate contracts 0 38,104 342 38,446 0 39,529 391 39,920 0 50,353 537 50,890Equity / index contracts 1 28,383 801 29,185 0 31,369 820 32,189 0 33,990 853 34,842Credit derivative contracts 0 1,739 303 2,043 0 1,914 395 2,309 0 2,008 350 2,358Commodity contracts 0 1,832 24 1,856 0 2,187 14 2,201 0 2,211 6 2,217
Brokerage receivables 0 23,010 0 23,010 0 24,201 0 24,201 0 24,659 0 24,659
Financial assets at fair value not held for trading 29,125 31,367 4,459 64,952 31,596 32,962 4,206 68,763 40,986 35,110 3,942 80,038of which:Financial assets for unit-linked investment contracts 21,974 9 8 21,991 21,162 0 3 21,166 20,628 101 2 20,731Corporate and municipal bonds 88 16,009 333 16,430 98 15,114 334 15,547 290 16,957 372 17,619Government bills / bonds 6,640 3,331 0 9,971 9,985 3,970 0 13,956 19,704 3,593 0 23,297Loans 0 5,626 1,087 6,712 0 6,900 1,093 7,993 0 7,699 862 8,561Securities financing transactions 0 6,203 201 6,404 0 6,811 119 6,930 0 6,629 122 6,751Auction rate securities 0 0 1,563 1,563 0 0 1,587 1,587 0 0 1,527 1,527Investment fund units 317 172 120 610 263 165 99 528 278 121 105 505Equity instruments 105 18 594 717 86 0 530 616 86 0 544 631Other 0 0 554 554 0 0 441 441 0 10 408 418
Financial assets measured at fair value through other comprehensive income on a recurring basis
Financial assets measured at fair value through other comprehensive income 2,165 5,611 0 7,775 2,154 5,946 0 8,100 1,144 7,114 0 8,258
of which:Asset-backed securities 0 5,200 0 5,200 0 5,480 0 5,480 0 6,624 0 6,624Government bills / bonds 2,121 44 0 2,165 2,115 43 0 2,159 1,103 47 0 1,150Corporate and municipal bonds 44 367 0 411 38 423 0 461 40 444 0 485
Non-financial assets measured at fair value on a recurring basis
Precious metals and other physical commodities 5,470 0 0 5,470 5,709 0 0 5,709 6,264 0 0 6,264
Non-financial assets measured at fair value on a non-recurring basis
Other non-financial assets2 0 1 67 68 0 1 247 248 0 1 245 246Total assets measured at fair value 141,277 196,119 8,129 345,525 142,508 225,248 8,266 376,022 156,716 239,583 8,278 404,576

Notes to the UBS AG interim consolidated financial statements (unaudited)
40
Note 10 Fair value measurement (continued)
Determination of fair values from quoted market prices or valuation techniques (continued)1
30.6.21 31.3.21 31.12.20USD million Level 1 Level 2 Level 3 Total Level 1 Level 2 Level 3 Total Level 1 Level 2 Level 3 Total
Financial liabilities measured at fair value on a recurring basis
Financial liabilities at fair value held for trading 27,038 6,216 94 33,348 30,888 6,114 61 37,062 26,889 6,652 55 33,595of which:Equity instruments 20,826 387 75 21,288 26,191 151 50 26,392 22,519 425 40 22,985Corporate and municipal bonds 37 4,592 13 4,642 32 4,718 7 4,757 31 4,048 9 4,089Government bills / bonds 5,727 620 0 6,347 4,168 807 0 4,975 3,642 1,036 0 4,678Investment fund units 442 581 6 1,028 492 397 3 891 696 1,127 5 1,828
Derivative financial instruments 754 117,985 2,950 121,688 1,405 141,522 3,114 146,041 746 156,884 3,471 161,102of which:Foreign exchange contracts 280 47,050 59 47,389 541 67,047 54 67,642 316 70,149 61 70,527Interest rate contracts 0 32,177 526 32,703 0 33,501 546 34,046 0 43,389 527 43,916Equity / index contracts 9 34,431 1,902 36,342 0 36,614 2,070 38,684 0 38,870 2,306 41,176Credit derivative contracts 0 2,000 392 2,392 0 2,139 369 2,508 0 2,403 528 2,931Commodity contracts 0 2,034 51 2,085 0 1,907 59 1,966 0 2,003 24 2,027
Financial liabilities designated at fair value on a recurring basis
Brokerage payables designated at fair value 0 39,129 0 39,129 0 45,600 0 45,600 0 38,742 0 38,742
Debt issued designated at fair value 0 60,321 12,478 72,799 0 53,900 10,736 64,635 0 50,273 9,595 59,868
Other financial liabilities designated at fair value 0 30,032 2,876 32,908 0 28,317 2,452 30,769 0 29,682 2,091 31,773of which:Financial liabilities related to unit-linked investment contracts 0 22,217 0 22,217 0 21,357 0 21,357 0 20,975 0 20,975Securities financing transactions 0 6,181 3 6,184 0 5,651 0 5,651 0 7,317 0 7,317Over-the-counter debt instruments 0 1,550 592 2,142 0 1,261 526 1,787 0 1,363 697 2,060
Total liabilities measured at fair value 27,792 253,682 18,398 299,871 32,293 275,453 16,362 324,108 27,635 282,233 15,212 325,0801 Bifurcated embedded derivatives are presented on the same balance sheet lines as their host contracts and are not included in this table. The fair value of these derivatives was not material for the periods presented. 2 Other non-financial assets primarily consist of properties and other non-current assets held for sale, which are measured at the lower of their net carrying amount or fair value less costs to sell.
b) Valuation adjustments and other items
The table below summarizes the valuation adjustment reserves recognized on the balance sheet. Details about each category are provided further below.
Valuation adjustment reserves on the balance sheet
As of
Life-to-date gain / (loss), USD million 30.6.21 31.3.21 31.12.20
Deferred day-1 profit or loss reserves 405 387 269
Own credit adjustments on financial liabilities designated at fair value (278) (400) (381)
CVAs, FVAs, DVAs and other valuation adjustments (956) (977) (959)
Deferred day-1 profit or loss reservesThe table below summarizes the changes in deferred day-1 profit or loss reserves during the relevant period.
Deferred day-1 profit or loss is generally released into Other net income from financial instruments measured at fair value through profit or loss when pricing of equivalent products or the underlying parameters become observable or when the transaction is closed out.
Deferred day-1 profit or loss reservesFor the quarter ended Year-to-date
USD million 30.6.21 31.3.21 30.6.20 30.6.21 30.6.20Reserve balance at the beginning of the period 387 269 194 269 146Profit / (loss) deferred on new transactions 97 181 121 278 239(Profit) / loss recognized in the income statement (79) (63) (72) (142) (141)Foreign currency translation 0 (1) 0 (1) (1)Reserve balance at the end of the period 405 387 243 405 243
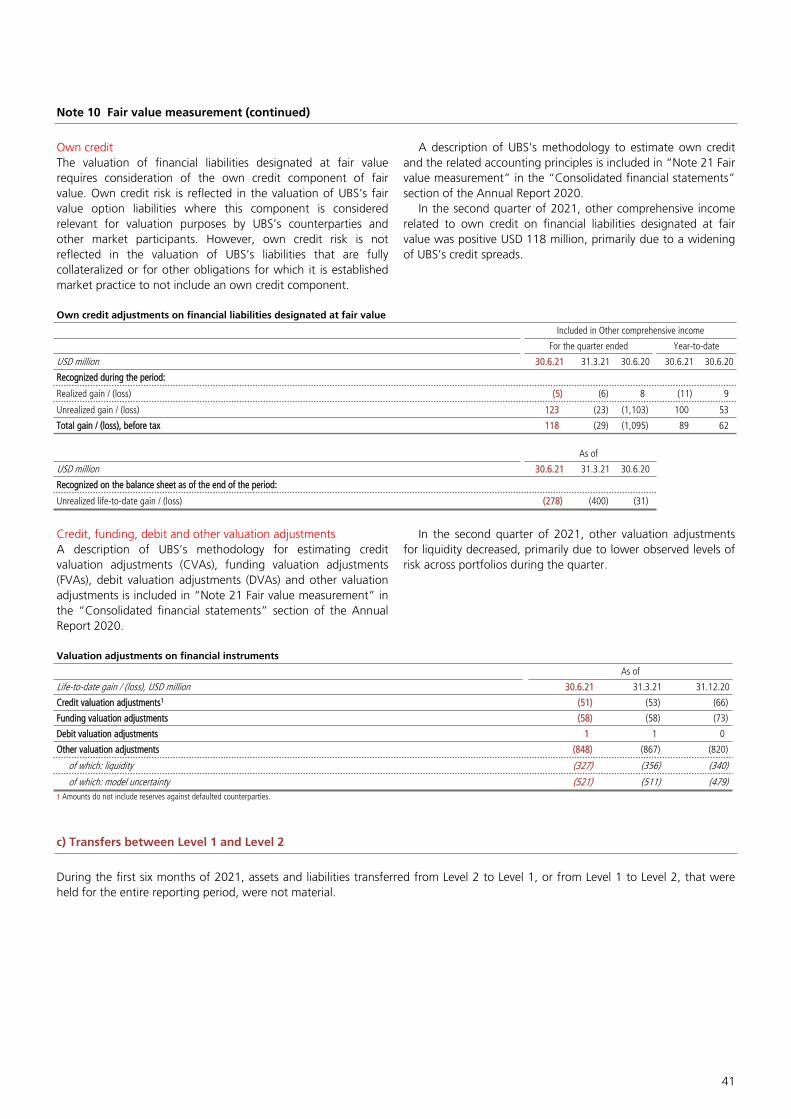
41
Note 10 Fair value measurement (continued)
Own creditThe valuation of financial liabilities designated at fair value requires consideration of the own credit component of fair value. Own credit risk is reflected in the valuation of UBS’s fair value option liabilities where this component is considered relevant for valuation purposes by UBS’s counterparties and other market participants. However, own credit risk is not reflected in the valuation of UBS’s liabilities that are fully collateralized or for other obligations for which it is established market practice to not include an own credit component.
A description of UBS’s methodology to estimate own credit and the related accounting principles is included in “Note 21 Fair value measurement” in the “Consolidated financial statements” section of the Annual Report 2020.
In the second quarter of 2021, other comprehensive income related to own credit on financial liabilities designated at fair value was positive USD 118 million, primarily due to a widening of UBS’s credit spreads.
Own credit adjustments on financial liabilities designated at fair value
Included in Other comprehensive income
For the quarter ended Year-to-date
USD million 30.6.21 31.3.21 30.6.20 30.6.21 30.6.20
Recognized during the period:
Realized gain / (loss) (5) (6) 8 (11) 9
Unrealized gain / (loss) 123 (23) (1,103) 100 53
Total gain / (loss), before tax 118 (29) (1,095) 89 62
As of
USD million 30.6.21 31.3.21 30.6.20
Recognized on the balance sheet as of the end of the period:
Unrealized life-to-date gain / (loss) (278) (400) (31)
Credit, funding, debit and other valuation adjustmentsA description of UBS’s methodology for estimating credit valuation adjustments (CVAs), funding valuation adjustments (FVAs), debit valuation adjustments (DVAs) and other valuation adjustments is included in “Note 21 Fair value measurement” in the “Consolidated financial statements” section of the Annual Report 2020.
In the second quarter of 2021, other valuation adjustments for liquidity decreased, primarily due to lower observed levels of risk across portfolios during the quarter.
Valuation adjustments on financial instruments
As of
Life-to-date gain / (loss), USD million 30.6.21 31.3.21 31.12.20
Credit valuation adjustments1 (51) (53) (66)
Funding valuation adjustments (58) (58) (73)
Debit valuation adjustments 1 1 0
Other valuation adjustments (848) (867) (820)
of which: liquidity (327) (356) (340)
of which: model uncertainty (521) (511) (479)1 Amounts do not include reserves against defaulted counterparties.
c) Transfers between Level 1 and Level 2
During the first six months of 2021, assets and liabilities transferred from Level 2 to Level 1, or from Level 1 to Level 2, that were held for the entire reporting period, were not material.

Notes to the UBS AG interim consolidated financial statements (unaudited)
42
Note 10 Fair value measurement (continued)
d) Level 3 instruments: valuation techniques and inputs
The table below presents material Level 3 assets and liabilities, together with the valuation techniques used to measure fair value, the inputs used in a given valuation technique that are considered significant as of 30 June 2021 and unobservable, and a range of values for those unobservable inputs.
The range of values represents the highest- and lowest-level inputs used in the valuation techniques. Therefore the range does not reflect the level of uncertainty regarding a particular input or an assessment of the reasonableness of UBS´s estimates and assumptions, but rather the different underlying characteristics of the relevant assets and liabilities held by UBS. The ranges will therefore vary from period to period and parameter to parameter based on characteristics of the instruments held at each balance
sheet date. Furthermore, the ranges of unobservable inputs may differ across other financial institutions, reflecting the diversity of the products in each firm’s inventory.
The significant unobservable inputs disclosed in the table below are consistent with those included in “Note 21 Fair value measurement” in the “Consolidated financial statements” section of the Annual Report 2020. A description of the potential effect that a change in each unobservable input in isolation may have on a fair value measurement, including information to facilitate an understanding of factors that give rise to the input ranges shown, is also provided in “Note 21 Fair value measurement” in the “Consolidated financial statements” section of the Annual Report 2020.
Valuation techniques and inputs used in the fair value measurement of Level 3 assets and liabilitiesFair value Range of inputs
Assets Liabilities 30.6.21 31.12.20
USD billion 30.6.21 31.12.20 30.6.21 31.12.20Valuation technique(s)
Significant unobservable input(s)1 low high
weighted average2 low high
weighted average2 unit1
Financial assets and liabilities at fair value held for trading and Financial assets at fair value not held for tradingCorporate and municipal bonds 1.2 1.2 0.0 0.0
Relative value to market comparable Bond price equivalent 15 143 100 1 143 100 pointsDiscounted expected cash flows Discount margin 358 358
268 268
basis points
Traded loans, loans measured at fair value, loan commitments and guarantees 2.6 2.4 0.0 0.0
Relative value to market comparable Loan price equivalent 1 101 99 0 101 99 points
Discounted expected cash flows Credit spread 180 800
190 800
basis points
Market comparable and securitization model Credit spread 28
1,55
8 228 40
1,85
8 333basis
points
Auction rate securities 1.6 1.5Discounted expected cash flows Credit spread 115 222 162
100 188 140
basis points
Investment fund units 3 0.1 0.1 0.0 0.0Relative value to market comparable Net asset value
Equity instruments 3 0.7 0.7 0.1 0.0Relative value to market comparable Price
Debt issued designated at fair value4 12.5 9.6Other financial liabilities designated at fair value 2.9 2.1
Discounted expected cash flows Funding spread 35 175 42 175
basis points
Derivative financial instruments
Interest rate contracts 0.3 0.5 0.5 0.5 Option model Volatility of interest rates 49 73 29 69basis
points
Credit derivative contracts 0.3 0.3 0.4 0.5Discounted expected cash flows Credit spreads 2 496 1 489
basis points
Bond price equivalent 3 102 0 100 pointsEquity / index contracts 0.8 0.9 1.9 2.3 Option model Equity dividend yields 0 11 0 13 %
Volatility of equity stocks, equity and other indices 4 99 4 100 %Equity-to-FX correlation (30) 70 (34) 65 %Equity-to-equity correlation (25) 99 (16) 100 %
1 The ranges of significant unobservable inputs are represented in points, percentages and basis points. Points are a percentage of par (e.g., 100 points would be 100% of par). 2 Weighted averages are provided for non-derivative financial instruments and were calculated by weighting inputs based on the fair values of the respective instruments. Weighted averages are not provided for inputs related to derivative contracts, as this would not be meaningful. 3 The range of inputs is not disclosed, as there is a dispersion of values given the diverse nature of the investments. 4 Debt issued designated at fair value is composed primarily of UBS structured notes, which include variable maturity notes with various equity and foreign exchange underlying risks, rates-linked and credit-linked notes, all of which have embedded derivative parameters that are considered to be unobservable. The equivalent derivative instrument parameters are presented in the respective derivative financial instruments lines in this table.
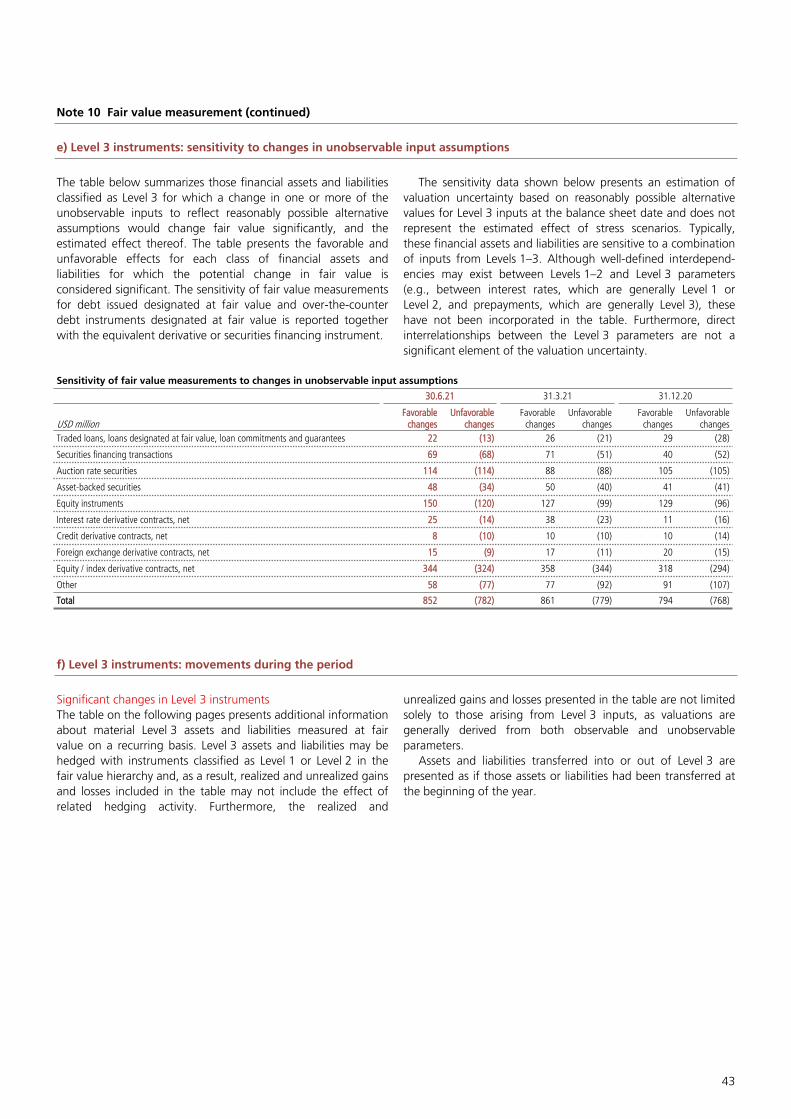
43
Note 10 Fair value measurement (continued)
e) Level 3 instruments: sensitivity to changes in unobservable input assumptions
The table below summarizes those financial assets and liabilities classified as Level 3 for which a change in one or more of the unobservable inputs to reflect reasonably possible alternative assumptions would change fair value significantly, and the estimated effect thereof. The table presents the favorable and unfavorable effects for each class of financial assets and liabilities for which the potential change in fair value is considered significant. The sensitivity of fair value measurements for debt issued designated at fair value and over-the-counter debt instruments designated at fair value is reported together with the equivalent derivative or securities financing instrument.
The sensitivity data shown below presents an estimation of valuation uncertainty based on reasonably possible alternative values for Level 3 inputs at the balance sheet date and does not represent the estimated effect of stress scenarios. Typically, these financial assets and liabilities are sensitive to a combination of inputs from Levels 1–3. Although well-defined interdepend-encies may exist between Levels 1–2 and Level 3 parameters (e.g., between interest rates, which are generally Level 1 or Level 2, and prepayments, which are generally Level 3), these have not been incorporated in the table. Furthermore, direct interrelationships between the Level 3 parameters are not a significant element of the valuation uncertainty.
Sensitivity of fair value measurements to changes in unobservable input assumptions
30.6.21 31.3.21 31.12.20
USD millionFavorable
changesUnfavorable
changesFavorable
changesUnfavorable
changesFavorable
changesUnfavorable
changesTraded loans, loans designated at fair value, loan commitments and guarantees 22 (13) 26 (21) 29 (28)
Securities financing transactions 69 (68) 71 (51) 40 (52)
Auction rate securities 114 (114) 88 (88) 105 (105)
Asset-backed securities 48 (34) 50 (40) 41 (41)
Equity instruments 150 (120) 127 (99) 129 (96)
Interest rate derivative contracts, net 25 (14) 38 (23) 11 (16)
Credit derivative contracts, net 8 (10) 10 (10) 10 (14)
Foreign exchange derivative contracts, net 15 (9) 17 (11) 20 (15)
Equity / index derivative contracts, net 344 (324) 358 (344) 318 (294)
Other 58 (77) 77 (92) 91 (107)
Total 852 (782) 861 (779) 794 (768)
f) Level 3 instruments: movements during the period
Significant changes in Level 3 instrumentsThe table on the following pages presents additional information about material Level 3 assets and liabilities measured at fair value on a recurring basis. Level 3 assets and liabilities may be hedged with instruments classified as Level 1 or Level 2 in the fair value hierarchy and, as a result, realized and unrealized gains and losses included in the table may not include the effect of related hedging activity. Furthermore, the realized and
unrealized gains and losses presented in the table are not limited solely to those arising from Level 3 inputs, as valuations are generally derived from both observable and unobservable parameters.
Assets and liabilities transferred into or out of Level 3 are presented as if those assets or liabilities had been transferred at the beginning of the year.
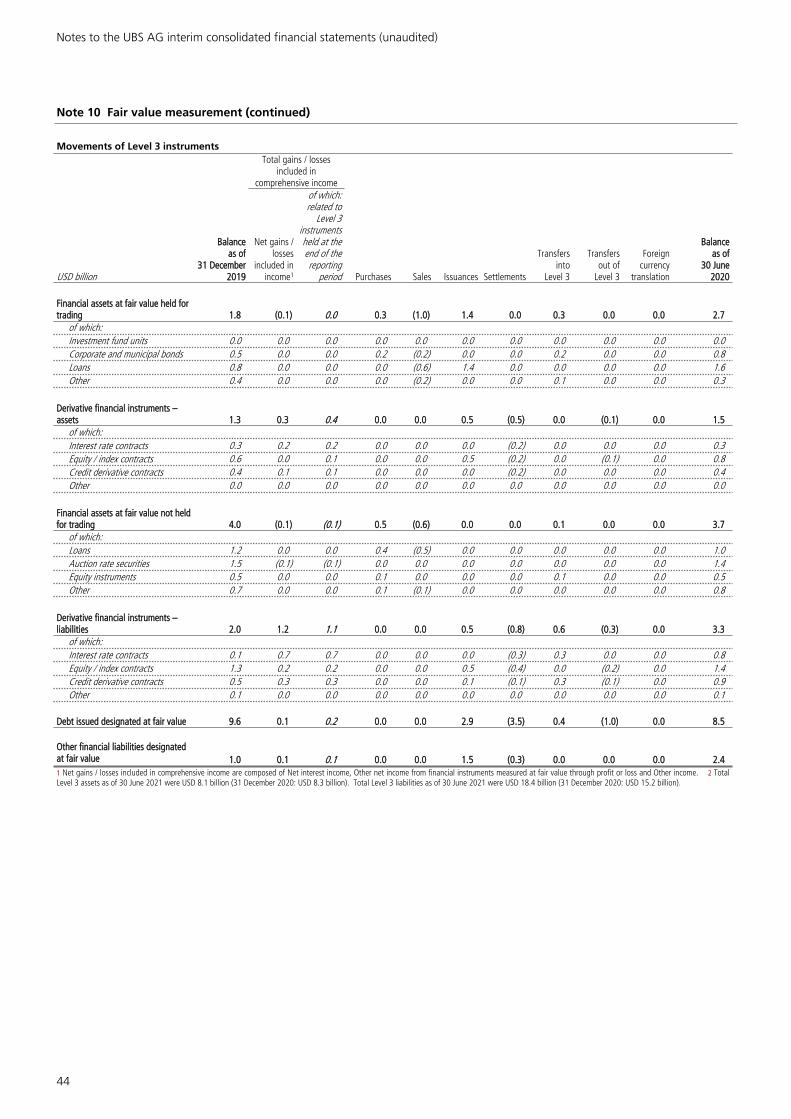
Notes to the UBS AG interim consolidated financial statements (unaudited)
44
Note 10 Fair value measurement (continued)
Movements of Level 3 instrumentsTotal gains / losses
included in comprehensive income
USD billion
Balance as of
31 December 2019
Net gains / losses
included in income1
of which: related to
Level 3 instruments held at the end of the reporting
period Purchases Sales Issuances Settlements
Transfers into
Level 3
Transfers out of
Level 3
Foreign currency
translation
Balance as of
30 June2020
Financial assets at fair value held for trading 1.8 (0.1) 0.0 0.3 (1.0) 1.4 0.0 0.3 0.0 0.0 2.7
of which:Investment fund units 0.0 0.0 0.0 0.0 0.0 0.0 0.0 0.0 0.0 0.0 0.0Corporate and municipal bonds 0.5 0.0 0.0 0.2 (0.2) 0.0 0.0 0.2 0.0 0.0 0.8Loans 0.8 0.0 0.0 0.0 (0.6) 1.4 0.0 0.0 0.0 0.0 1.6Other 0.4 0.0 0.0 0.0 (0.2) 0.0 0.0 0.1 0.0 0.0 0.3
Derivative financial instruments – assets 1.3 0.3 0.4 0.0 0.0 0.5 (0.5) 0.0 (0.1) 0.0 1.5
of which:Interest rate contracts 0.3 0.2 0.2 0.0 0.0 0.0 (0.2) 0.0 0.0 0.0 0.3Equity / index contracts 0.6 0.0 0.1 0.0 0.0 0.5 (0.2) 0.0 (0.1) 0.0 0.8Credit derivative contracts 0.4 0.1 0.1 0.0 0.0 0.0 (0.2) 0.0 0.0 0.0 0.4Other 0.0 0.0 0.0 0.0 0.0 0.0 0.0 0.0 0.0 0.0 0.0
Financial assets at fair value not held for trading 4.0 (0.1) (0.1) 0.5 (0.6) 0.0 0.0 0.1 0.0 0.0 3.7
of which:Loans 1.2 0.0 0.0 0.4 (0.5) 0.0 0.0 0.0 0.0 0.0 1.0Auction rate securities 1.5 (0.1) (0.1) 0.0 0.0 0.0 0.0 0.0 0.0 0.0 1.4Equity instruments 0.5 0.0 0.0 0.1 0.0 0.0 0.0 0.1 0.0 0.0 0.5Other 0.7 0.0 0.0 0.1 (0.1) 0.0 0.0 0.0 0.0 0.0 0.8
Derivative financial instruments – liabilities 2.0 1.2 1.1 0.0 0.0 0.5 (0.8) 0.6 (0.3) 0.0 3.3
of which:Interest rate contracts 0.1 0.7 0.7 0.0 0.0 0.0 (0.3) 0.3 0.0 0.0 0.8Equity / index contracts 1.3 0.2 0.2 0.0 0.0 0.5 (0.4) 0.0 (0.2) 0.0 1.4Credit derivative contracts 0.5 0.3 0.3 0.0 0.0 0.1 (0.1) 0.3 (0.1) 0.0 0.9Other 0.1 0.0 0.0 0.0 0.0 0.0 0.0 0.0 0.0 0.0 0.1
Debt issued designated at fair value 9.6 0.1 0.2 0.0 0.0 2.9 (3.5) 0.4 (1.0) 0.0 8.5
Other financial liabilities designated at fair value 1.0 0.1 0.1 0.0 0.0 1.5 (0.3) 0.0 0.0 0.0 2.41 Net gains / losses included in comprehensive income are composed of Net interest income, Other net income from financial instruments measured at fair value through profit or loss and Other income. 2 Total Level 3 assets as of 30 June 2021 were USD 8.1 billion (31 December 2020: USD 8.3 billion). Total Level 3 liabilities as of 30 June 2021 were USD 18.4 billion (31 December 2020: USD 15.2 billion).

45
Note 10 Fair value measurement (continued)
.
Total gains / losses included in
comprehensive income
Balance as of
31 December20202
Net gains / losses
included in income1
of which: related to
Level 3 instruments held at the end of the reporting
period Purchases Sales Issuances Settlements
Transfers into
Level 3
Transfers out of
Level 3
Foreign currency
translation
Balance as of
30 June20212
2.3 0.0 0.0 0.3 (0.8) 0.4 0.0 0.2 (0.2) 0.0 2.1
0.0 0.0 0.0 0.0 0.0 0.0 0.0 0.0 0.0 0.0 0.0 0.8 0.0 0.0 0.1 (0.1) 0.0 0.0 0.0 (0.1) 0.0 0.8 1.1 0.0 0.0 0.1 (0.5) 0.4 0.0 0.0 (0.2) 0.0 1.0 0.4 (0.1) (0.1) 0.0 (0.2) 0.0 0.0 0.1 0.0 0.0 0.3
1.8 (0.2) (0.1) 0.0 0.0 0.5 (0.4) 0.0 (0.1) 0.0 1.5
0.5 (0.1) (0.1) 0.0 0.0 0.0 (0.1) 0.0 0.0 0.0 0.3 0.9 0.1 0.1 0.0 0.0 0.3 (0.4) 0.0 (0.1) 0.0 0.8 0.3 (0.1) (0.1) 0.0 0.0 0.1 0.0 0.0 0.0 0.0 0.3 0.0 0.0 0.0 0.0 0.0 0.0 0.0 0.0 0.0 0.0 0.0
3.9 0.1 0.1 0.7 (0.3) 0.0 0.0 0.1 0.0 0.0 4.5
0.9 0.0 0.0 0.4 (0.1) 0.0 0.0 0.0 0.0 0.0 1.1 1.5 0.0 0.0 0.0 0.0 0.0 0.0 0.0 0.0 0.0 1.6 0.5 0.1 0.1 0.1 (0.1) 0.0 0.0 0.0 0.0 0.0 0.6 1.0 0.0 0.0 0.2 0.0 0.0 0.0 0.0 0.0 0.0 1.2
3.5 0.2 0.0 0.0 0.0 0.7 (1.2) 0.0 (0.2) 0.0 2.9
0.5 (0.1) (0.1) 0.0 0.0 0.1 0.0 0.0 0.0 0.0 0.5 2.3 0.4 0.2 0.0 0.0 0.5 (1.1) 0.0 (0.2) 0.0 1.9 0.5 (0.2) (0.2) 0.0 0.0 0.1 0.0 0.0 0.0 0.0 0.4 0.1 0.1 0.0 0.0 0.0 0.0 (0.1) 0.0 0.0 0.0 0.1
9.6 0.3 0.2 0.0 0.0 6.3 (2.9) 0.1 (0.8) (0.2) 12.5
2.1 0.0 0.0 0.0 0.0 1.0 (0.2) 0.0 0.0 0.0 2.9

Notes to the UBS AG interim consolidated financial statements (unaudited)
46
Note 10 Fair value measurement (continued)
g) Financial instruments not measured at fair value
The table below reflects the estimated fair values of financial instruments not measured at fair value.
Financial instruments not measured at fair value
30.6.21 31.3.21 31.12.20
USD billionCarrying amount Fair value
Carrying amount Fair value
Carrying amount Fair value
Assets
Cash and balances at central banks 160.7 160.7 158.9 158.9 158.2 158.2
Loans and advances to banks 16.4 16.4 18.3 18.3 15.3 15.3
Receivables from securities financing transactions 83.5 83.5 82.4 82.4 74.2 74.2
Cash collateral receivables on derivative instruments 29.8 29.8 35.0 35.0 32.7 32.7
Loans and advances to customers 391.4 391.0 380.1 380.1 381.0 382.3
Other financial assets measured at amortized cost 27.2 27.7 26.8 27.3 27.2 28.0
Liabilities
Amounts due to banks 14.6 14.6 12.6 12.6 11.0 11.1
Payables from securities financing transactions 6.0 6.0 6.7 6.7 6.3 6.3
Cash collateral payables on derivative instruments 32.2 32.2 36.6 36.6 37.3 37.3
Customer deposits 517.5 517.5 508.9 509.0 527.9 528.0
Funding from UBS Group AG 55.9 57.5 57.7 59.2 54.0 55.6
Debt issued measured at amortized cost 84.5 85.4 87.5 88.3 85.4 86.3
Other financial liabilities measured at amortized cost1 7.0 7.0 6.0 6.0 6.6 6.7 1 Excludes lease liabilities.
The fair values included in the table above have been calculated for disclosure purposes only. The valuation techniques and assumptions relate only to UBS’s financial instruments not otherwise measured at fair value. Other institutions may use
different methods and assumptions for their fair value estimation, and therefore such fair value disclosures cannot necessarily be compared from one financial institution to another.
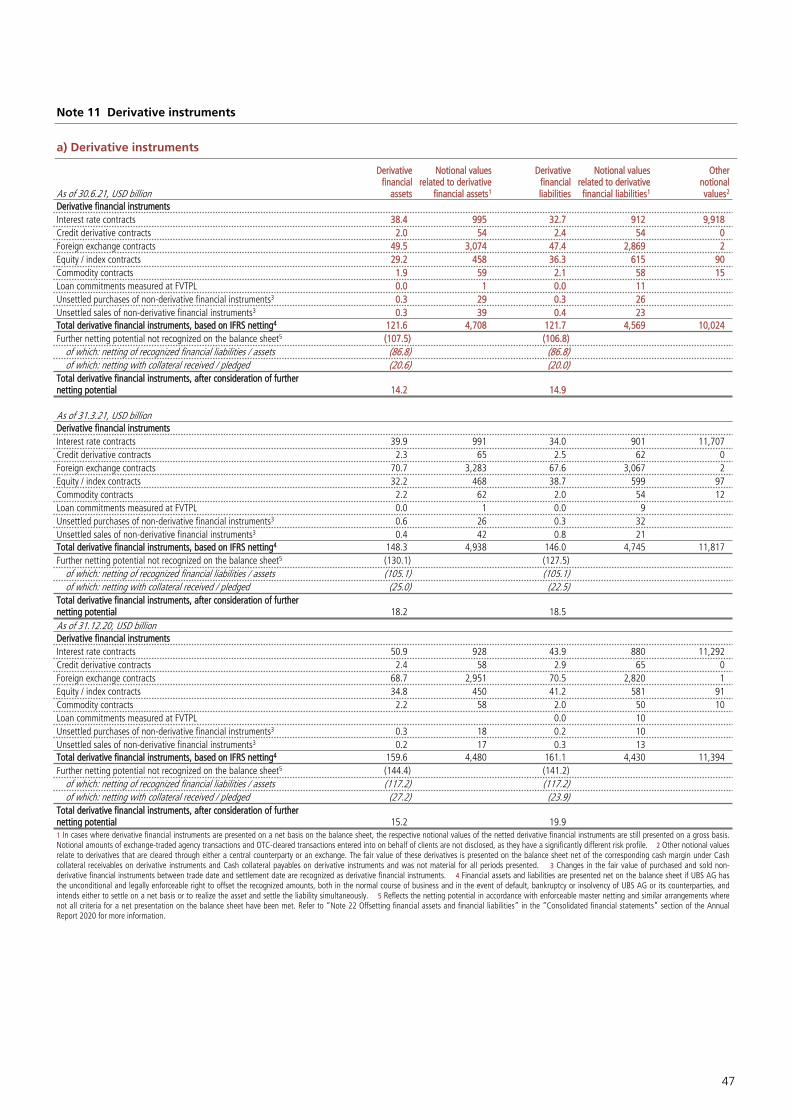
47
Note 11 Derivative instruments
a) Derivative instruments
As of 30.6.21, USD billion
Derivativefinancial
assets
Notional valuesrelated to derivative
financial assets1
Derivativefinancialliabilities
Notional valuesrelated to derivativefinancial liabilities1
Othernotionalvalues2
Derivative financial instrumentsInterest rate contracts 38.4 995 32.7 912 9,918Credit derivative contracts 2.0 54 2.4 54 0Foreign exchange contracts 49.5 3,074 47.4 2,869 2Equity / index contracts 29.2 458 36.3 615 90Commodity contracts 1.9 59 2.1 58 15Loan commitments measured at FVTPL 0.0 1 0.0 11Unsettled purchases of non-derivative financial instruments3 0.3 29 0.3 26Unsettled sales of non-derivative financial instruments3 0.3 39 0.4 23Total derivative financial instruments, based on IFRS netting4 121.6 4,708 121.7 4,569 10,024Further netting potential not recognized on the balance sheet5 (107.5) (106.8)
of which: netting of recognized financial liabilities / assets (86.8) (86.8)of which: netting with collateral received / pledged (20.6) (20.0)
Total derivative financial instruments, after consideration of further netting potential 14.2 14.9
As of 31.3.21, USD billionDerivative financial instrumentsInterest rate contracts 39.9 991 34.0 901 11,707Credit derivative contracts 2.3 65 2.5 62 0Foreign exchange contracts 70.7 3,283 67.6 3,067 2Equity / index contracts 32.2 468 38.7 599 97Commodity contracts 2.2 62 2.0 54 12Loan commitments measured at FVTPL 0.0 1 0.0 9Unsettled purchases of non-derivative financial instruments3 0.6 26 0.3 32Unsettled sales of non-derivative financial instruments3 0.4 42 0.8 21Total derivative financial instruments, based on IFRS netting4 148.3 4,938 146.0 4,745 11,817Further netting potential not recognized on the balance sheet5 (130.1) (127.5)
of which: netting of recognized financial liabilities / assets (105.1) (105.1)of which: netting with collateral received / pledged (25.0) (22.5)
Total derivative financial instruments, after consideration of further netting potential 18.2 18.5As of 31.12.20, USD billionDerivative financial instrumentsInterest rate contracts 50.9 928 43.9 880 11,292Credit derivative contracts 2.4 58 2.9 65 0Foreign exchange contracts 68.7 2,951 70.5 2,820 1Equity / index contracts 34.8 450 41.2 581 91Commodity contracts 2.2 58 2.0 50 10Loan commitments measured at FVTPL 0.0 10Unsettled purchases of non-derivative financial instruments3 0.3 18 0.2 10Unsettled sales of non-derivative financial instruments3 0.2 17 0.3 13Total derivative financial instruments, based on IFRS netting4 159.6 4,480 161.1 4,430 11,394Further netting potential not recognized on the balance sheet5 (144.4) (141.2)
of which: netting of recognized financial liabilities / assets (117.2) (117.2)of which: netting with collateral received / pledged (27.2) (23.9)
Total derivative financial instruments, after consideration of further netting potential 15.2 19.91 In cases where derivative financial instruments are presented on a net basis on the balance sheet, the respective notional values of the netted derivative financial instruments are still presented on a gross basis. Notional amounts of exchange-traded agency transactions and OTC-cleared transactions entered into on behalf of clients are not disclosed, as they have a significantly different risk profile. 2 Other notional values relate to derivatives that are cleared through either a central counterparty or an exchange. The fair value of these derivatives is presented on the balance sheet net of the corresponding cash margin under Cash collateral receivables on derivative instruments and Cash collateral payables on derivative instruments and was not material for all periods presented. 3 Changes in the fair value of purchased and sold non-derivative financial instruments between trade date and settlement date are recognized as derivative financial instruments. 4 Financial assets and liabilities are presented net on the balance sheet if UBS AG has the unconditional and legally enforceable right to offset the recognized amounts, both in the normal course of business and in the event of default, bankruptcy or insolvency of UBS AG or its counterparties, and intends either to settle on a net basis or to realize the asset and settle the liability simultaneously. 5 Reflects the netting potential in accordance with enforceable master netting and similar arrangements where not all criteria for a net presentation on the balance sheet have been met. Refer to “Note 22 Offsetting financial assets and financial liabilities” in the “Consolidated financial statements” section of the Annual Report 2020 for more information.

Notes to the UBS AG interim consolidated financial statements (unaudited)
48
Note 11 Derivative instruments (continued)
b) Cash collateral on derivative instruments
USD billionReceivables
30.6.21Payables30.6.21
Receivables31.3.21
Payables31.3.21
Receivables31.12.20
Payables31.12.20
Cash collateral on derivative instruments, based on IFRS netting1 29.8 32.2 35.0 36.6 32.7 37.3Further netting potential not recognized on the balance sheet2 (18.3) (16.9) (21.1) (20.7) (21.1) (21.6)
of which: netting of recognized financial liabilities / assets (15.9) (14.4) (18.2) (18.3) (19.6) (19.6)of which: netting with collateral received / pledged (2.4) (2.5) (2.9) (2.3) (1.5) (2.1)
Cash collateral on derivative instruments, after consideration of further netting potential 11.5 15.3 14.0 15.9 11.6 15.71 Financial assets and liabilities are presented net on the balance sheet if UBS AG has the unconditional and legally enforceable right to offset the recognized amounts, both in the normal course of business and in the event of default, bankruptcy or insolvency of UBS AG or its counterparties, and intends either to settle on a net basis or to realize the asset and settle the liability simultaneously. 2 Reflects the netting potential in accordance with enforceable master netting and similar arrangements where not all criteria for a net presentation on the balance sheet have been met. Refer to “Note 22 Offsetting financial assets and financial liabilities” in the “Consolidated financial statements” section of the Annual Report 2020 for more information.
Note 12 Other assets and liabilities
a) Other financial assets measured at amortized cost
USD million 30.6.21 31.3.21 31.12.20Debt securities 18,484 18,533 18,801
of which: government bills / bonds 9,531 9,664 9,789Loans to financial advisors 2,415 2,473 2,569Fee- and commission-related receivables 1,980 2,069 2,014Finance lease receivables 1,363 1,344 1,447Settlement and clearing accounts 1,225 564 614Accrued interest income 532 522 592Other 1,202 1,333 1,182Total other financial assets measured at amortized cost 27,201 26,837 27,219
b) Other non-financial assets
USD million 30.6.21 31.3.21 31.12.20Precious metals and other physical commodities 5,470 5,709 6,264Bail deposit1 1,382 1,364 1,418Prepaid expenses 746 743 731VAT and other tax receivables 395 317 392Properties and other non-current assets held for sale 68 248 246Other 542 372 323Total other non-financial assets 8,603 8,755 9,3741 Refer to item 1 in Note 16b for more information.
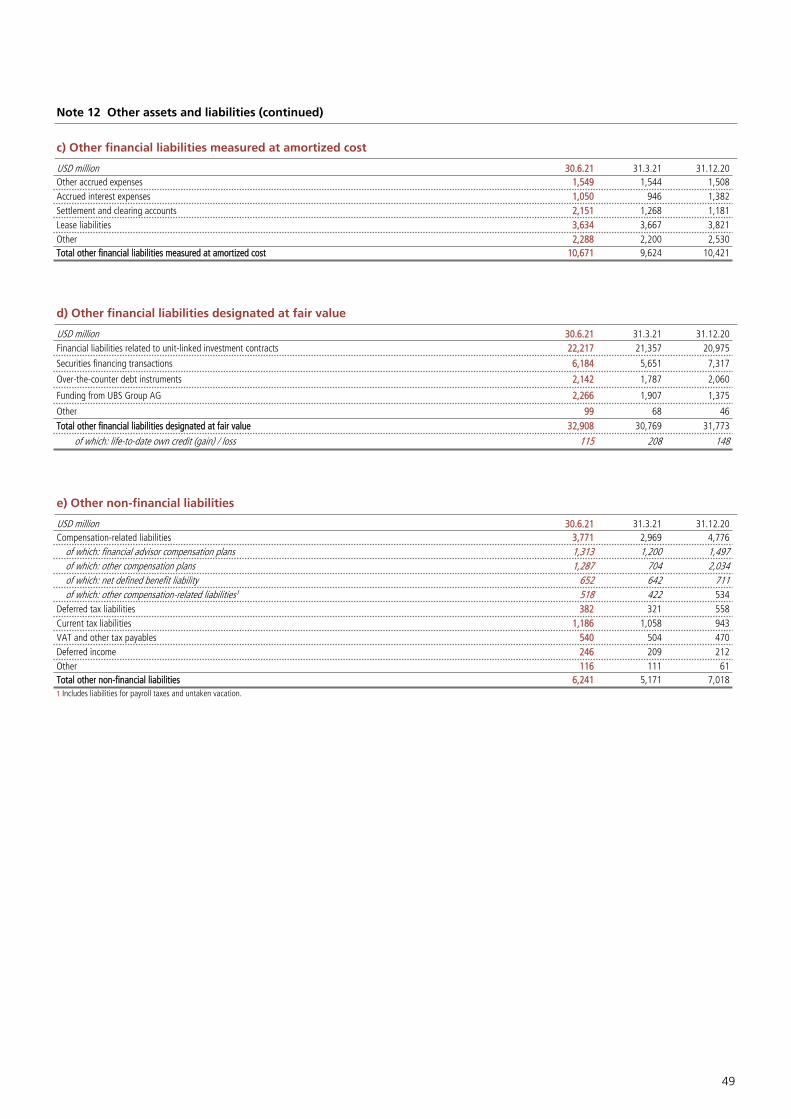
49
Note 12 Other assets and liabilities (continued)
c) Other financial liabilities measured at amortized cost
USD million 30.6.21 31.3.21 31.12.20Other accrued expenses 1,549 1,544 1,508Accrued interest expenses 1,050 946 1,382Settlement and clearing accounts 2,151 1,268 1,181Lease liabilities 3,634 3,667 3,821Other 2,288 2,200 2,530Total other financial liabilities measured at amortized cost 10,671 9,624 10,421
d) Other financial liabilities designated at fair value
USD million 30.6.21 31.3.21 31.12.20Financial liabilities related to unit-linked investment contracts 22,217 21,357 20,975
Securities financing transactions 6,184 5,651 7,317
Over-the-counter debt instruments 2,142 1,787 2,060
Funding from UBS Group AG 2,266 1,907 1,375
Other 99 68 46Total other financial liabilities designated at fair value 32,908 30,769 31,773
of which: life-to-date own credit (gain) / loss 115 208 148
e) Other non-financial liabilities
USD million 30.6.21 31.3.21 31.12.20Compensation-related liabilities 3,771 2,969 4,776
of which: financial advisor compensation plans 1,313 1,200 1,497of which: other compensation plans 1,287 704 2,034of which: net defined benefit liability 652 642 711of which: other compensation-related liabilities1 518 422 534
Deferred tax liabilities 382 321 558Current tax liabilities 1,186 1,058 943VAT and other tax payables 540 504 470Deferred income 246 209 212Other 116 111 61Total other non-financial liabilities 6,241 5,171 7,0181 Includes liabilities for payroll taxes and untaken vacation.

Notes to the UBS AG interim consolidated financial statements (unaudited)
50
Note 13 Debt issued designated at fair value
USD million 30.6.21 31.3.21 31.12.20
Issued debt instruments
Equity-linked1 49,157 44,615 41,069
Rates-linked 16,397 12,668 11,038
Credit-linked 1,826 1,804 1,933
Fixed-rate 2,883 3,343 3,604
Commodity-linked 1,961 1,564 1,497
Other 575 640 726
Total debt issued designated at fair value 72,799 64,635 59,868
of which: issued by UBS AG with original maturity greater than one year2 51,830 47,348 46,427
of which: life-to-date own credit (gain) / loss 164 193 2331 Includes investment fund unit-linked instruments issued. 2 Issued by the legal entity UBS AG. Based on original contractual maturity without considering any early redemption features. As of 30 June 2021, more than 99% of the balance was unsecured (31 March 2021: 100%; 31 December 2020: 100%).
Note 14 Debt issued measured at amortized cost
USD million 30.6.21 31.3.21 31.12.20
Certificates of deposit 12,193 14,723 15,680
Commercial paper 25,304 26,591 25,472
Other short-term debt 5,219 6,080 5,515
Short-term debt1 42,716 47,394 46,666
Senior unsecured debt 26,130 23,330 18,483
of which: issued by UBS AG with original maturity greater than one year2 26,109 23,309 18,464
Covered bonds 1,449 2,606 2,796
Subordinated debt 5,232 5,253 7,744
of which: low-trigger loss-absorbing tier 2 capital instruments 4,686 4,709 7,201
of which: non-Basel III-compliant tier 2 capital instruments 547 544 543
Debt issued through the Swiss central mortgage institutions 8,963 8,911 9,660
Other long-term debt 0 2 3
Long-term debt3 41,775 40,101 38,685
Total debt issued measured at amortized cost4 84,491 87,495 85,3511 Debt with an original contractual maturity of less than one year. 2 Issued by the legal entity UBS AG. Based on original contractual maturity without considering any early redemption features. As of 30 June 2021, 100% of the balance was unsecured (31 March 2021: 100%; 31 December 2020: 100%). 3 Debt with an original contractual maturity greater than or equal to one year. The classification of debt issued into short-term and long-term does not consider any early redemption features. 4 Net of bifurcated embedded derivatives, the fair value of which was not material for the periods presented.

51
Note 15 Interest rate benchmark reform
BackgroundA market-wide reform of major interest rate benchmarks is being undertaken globally, with the Financial Conduct Authority (the FCA) announcing in March 2021 that the publication of London Interbank Offered Rates (LIBORs) will cease for all non-US dollar LIBORs, as well as for one-week and two-month USD LIBOR, after 31 December 2021. Publication of the remaining USD LIBOR tenors will cease immediately after 30 June 2023.
The majority of UBS AG’s Interbank Offered Rate (IBOR) exposure is to CHF LIBOR and USD LIBOR. The alternative reference rate (ARR) for CHF LIBOR is the Swiss Average Rate Overnight (SARON). The ARR for USD LIBOR is the Secured Overnight Financing Rate (SOFR); in addition, there are recommended ARRs for GBP LIBOR, JPY LIBOR and EUR LIBOR. For certain products in the US, UBS AG is considering the use of credit-sensitive rates as an alternative to SOFR.
As of 30 June 2021, transition uncertainty with respect to significant interest rate benchmarks remains, with the exception of the Euro Interbank Offered Rate (Euribor). The reform of Euribor is now complete and consisted of a change in the underlying calculation method.
The transition to ARRs includes a number of active steps that will also benefit from the support of associated regulatory activities. There may be some contracts, known as “tough legacy contracts,” that cannot be practically transitioned or amended from IBORs to ARRs. The FCA continues to consult market participants about requiring the ICE Benchmark Administration to continue publishing certain LIBOR settings (i.e., one-, three- and six-month settings for the GBP, JPY and USD LIBORs) on a “synthetic” basis, which are not representative of the underlying financial markets, for a certain duration after 31 December 2021. However, these synthetic LIBORs will not be available for use in new contracts, given that they are non-representative, and are instead intended to help reduce disruption where resolution has not been agreed for certain tough legacy contracts. Furthermore, in February 2021, the EU Benchmarks Regulation was amended to enable the European Commission to designate a statutory replacement rate for tough legacy LIBOR contracts that are governed by the laws of EU Member States and remain outstanding after LIBOR cessation. On 6 April 2021, New York State LIBOR legislation was enacted with the intention of minimizing legal uncertainty and adverse economic effects associated with USD LIBOR transition for tough legacy contracts governed by New York law. For USD LIBOR contracts not governed by New York law, a bill has been introduced in Congress with similar objectives.
In October 2020, the International Swaps and Derivatives Association (ISDA) released the IBOR Fallbacks Supplement and IBOR Fallbacks Protocol, amending ISDA standard definitions for interest-rate derivatives to incorporate fallbacks for derivatives linked to certain IBORs. The changes came into effect on 25 January 2021 and, from that date, all newly cleared and non-cleared derivatives between adhering parties that reference ISDA standard definitions now include these fallbacks. UBS AG adhered to the protocol in November 2020.
UBS AG is focused on transitioning existing contracts via bi-lateral and multi-lateral agreements, leveraging industry solutions (e.g., the use of fallback provisions) and through third-party actions (clearing houses, agents, etc.). Furthermore, in line with regulatory guidance UBS AG has implemented a framework to limit entry into new contracts referencing IBORs.
Governance over the transition to alternative benchmark ratesUBS AG has established a global cross-divisional, cross-functional governance structure and change program to address the scale and complexity of the transition. This global program is sponsored by the Group CFO and led by senior representatives from the business divisions and UBS AG’s control and support functions. The program includes governance and execution structures within each business division, together with cross-divisional teams from each control and support function. Progress is overseen centrally via a monthly operating committee and a monthly steering committee, as well as quarterly updates to the joint Audit and Risk committees.
RisksA core part of UBS AG’s change program is the identification, management and monitoring of the risks associated with IBOR reform and transition. These risks include, but are not limited to, the following:– economic risks to UBS AG and its clients, through the
repricing of existing contracts, reduced transparency and / or liquidity of pricing information, market uncertainty or disruption;
– accounting risks, where the transition affects the accounting treatment, including hedge accounting and consequential income statement volatility;
– valuation risks arising from the variation between benchmarks that will cease and ARRs, affecting the risk profile of financial instruments;
– operational risks arising from changes to UBS AG’s front-to-back processes and systems to accommodate the transition, as well as the revision of operational controls related to the reform; and
– legal and conduct risks relating to UBS AG’s engagement with clients and market counterparties around new benchmark products and amendments required for existing contracts referencing benchmarks that will cease.

Notes to the UBS AG interim consolidated financial statements (unaudited)
52
Note 15 Interest rate benchmark reform (continued)
In some cases, contracts may contain provisions intended to provide a fallback interest rate in the event of a brief unavailability of the relevant IBOR. These provisions may not be effective or may produce arbitrary results in the event of a permanent cessation of the relevant IBOR. While efforts to transition outstanding transactions from IBORs to ARRs have made substantial progress, including through industry-wide protocols, such as the ISDA IBOR Fallbacks Supplement and IBOR Fallbacks Protocol, there are still substantial volumes of transactions that require modification to effectively transition to ARRs.
UBS AG remains confident that it has the transparency, oversight and operational preparedness to progress with the IBOR transition consistent with market timelines. UBS AG does not expect changes to its risk management approach and strategy as a result of interest rate benchmark reform.
Progress made during 2020 and the first half of 2021Approaches to transition vary by product type. During 2020, UBS AG transitioned most of its CHF LIBOR-linked deposits to SARON and launched SARON-based mortgages and corporate loans based on all major ARRs in the Swiss market, as well as SOFR-based mortgages in the US market. By the end of the second quarter of 2021, UBS AG had successfully transitioned its GBP LIBOR- and EUR LIBOR-based private and commercial real estate mortgages in the UK and Monaco to the Sterling Overnight Index Average (SONIA) and Euribor, respectively. UBS AG has detailed plans in place to deliver the required changes for all other IBOR exposures, predominantly during 2021.
Financial instruments yet to transition to alternative benchmarksThe amounts included in the table below relate to financial instrument contracts across UBS AG’s business divisions where
UBS AG has material exposures subject to IBOR reform that have not yet transitioned to ARRs, and that:– contractually reference an interest rate benchmark that will
transition to an alternative benchmark; and– have a contractual maturity date (including open-ended
contracts) after the agreed cessation dates.
Contracts where penalty terms reference IBORs, or where exposure to an IBOR is not the primary purpose of the contract, have not been included, as these contracts do not have a material impact on the transition process. In addition, contracts that have been changed to incorporate ARR-based interest rates before the relevant cessation date have been excluded from the table below, because UBS AG expects no further transition work to implement the reform.
In line with information provided to management and external parties monitoring UBS AG’s transition progress, the table below includes the following financial metrics for instruments subject to interest rate benchmark reform:– gross carrying value / exposure for non-derivative financial
instruments; and – total trade count for derivative financial instruments.
The exposures included in the table below represent the maximum IBOR exposure, with the actual IBOR exposure being dependent upon client preferences and investment decisions. Overall, the effort required to transition is affected by multiple factors, including whether negotiations need to take place with multiple stakeholders (as is the case for syndicated loans or certain listed securities), market readiness – such as liquidity in ARR equivalent products – and a client’s technical readiness to handle ARR market conventions.
As significant IBOR exposures transition to ARRs during 2021, the values and trade count disclosed are expected to decrease.
30.6.21LIBOR benchmark rates1
Measure CHF USD GBP EUR2 JPY XCCY
Carrying value of non-derivative financial instruments
Total non-derivative financial assets USD million 31,423 77,502 1,829 6,587 3,070 3,7963
Total non-derivative financial liabilities USD million 2,029 9,834 566 1,919 1,060 0Trade count of derivative financial instrumentsTotal derivative financial instruments Trade count 9,519 42,566 12,513 9,626 4,247 5,9484
Off-balance sheet exposuresTotal irrevocable loan commitments USD million 1 4,433 0 0 0 15,7675
31.3.21LIBOR benchmark rates1
Measure CHF USD GBP EUR2 JPY XCCY
Carrying value of non-derivative financial instruments
Total non-derivative financial assets USD million 36,046 72,185 5,399 8,253 3,060 4,4693
Total non-derivative financial liabilities USD million 2,612 13,142 1,429 2,252 1,460 0Trade count of derivative financial instrumentsTotal derivative financial instruments Trade count 9,749 40,080 13,006 9,613 3,961 5,2064
Off-balance sheet exposuresTotal irrevocable loan commitments USD million 106 4,656 167 0 0 15,1885
1 Contracts have been disclosed without regard to early termination rights. Instead, it is assumed that such contracts will transition away from IBORs without such rights being exercised. 2 Includes primarily EUR LIBOR positions. 3 Includes loans related to revolving multi-currency credit lines. 4 Includes cross-currency swaps where either leg or both legs are indexed to an IBOR. 5 Includes loan commitments that can be drawn in different currencies at the client‘s discretion.
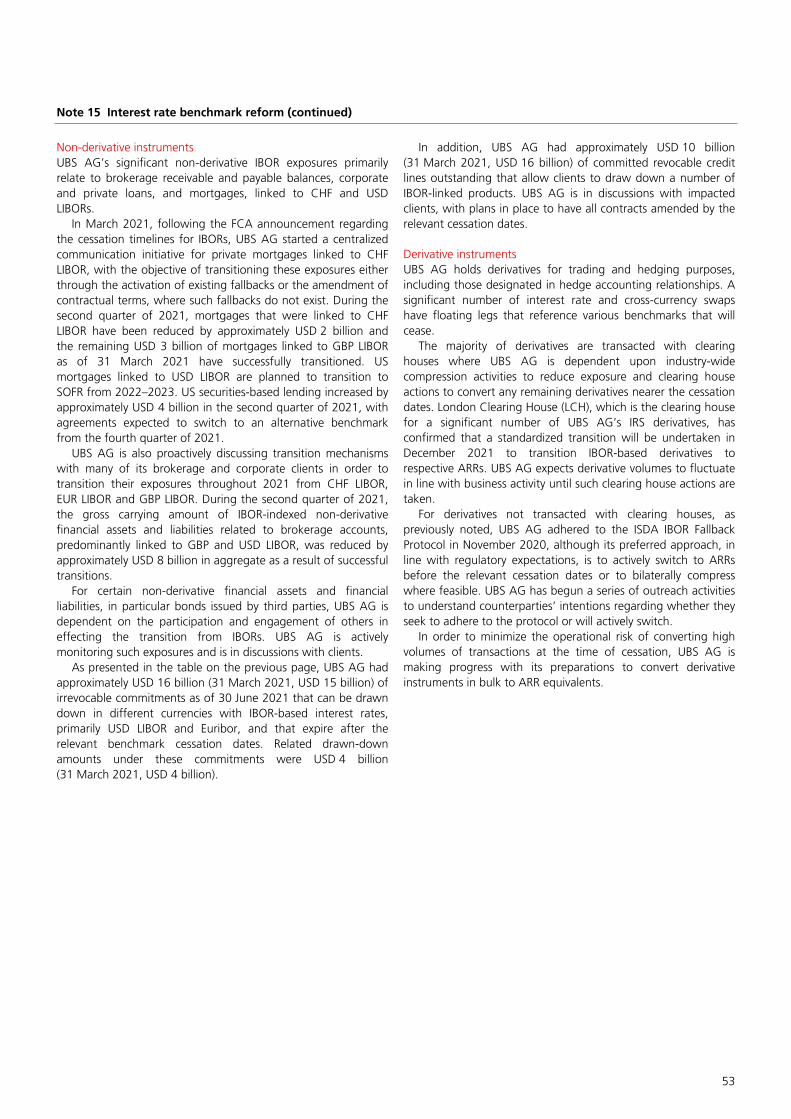
53
Note 15 Interest rate benchmark reform (continued)
Non-derivative instrumentsUBS AG’s significant non-derivative IBOR exposures primarily relate to brokerage receivable and payable balances, corporate and private loans, and mortgages, linked to CHF and USD LIBORs.
In March 2021, following the FCA announcement regarding the cessation timelines for IBORs, UBS AG started a centralized communication initiative for private mortgages linked to CHF LIBOR, with the objective of transitioning these exposures either through the activation of existing fallbacks or the amendment of contractual terms, where such fallbacks do not exist. During the second quarter of 2021, mortgages that were linked to CHF LIBOR have been reduced by approximately USD 2 billion and the remaining USD 3 billion of mortgages linked to GBP LIBOR as of 31 March 2021 have successfully transitioned. US mortgages linked to USD LIBOR are planned to transition to SOFR from 2022–2023. US securities-based lending increased by approximately USD 4 billion in the second quarter of 2021, with agreements expected to switch to an alternative benchmark from the fourth quarter of 2021.
UBS AG is also proactively discussing transition mechanisms with many of its brokerage and corporate clients in order to transition their exposures throughout 2021 from CHF LIBOR, EUR LIBOR and GBP LIBOR. During the second quarter of 2021, the gross carrying amount of IBOR-indexed non-derivative financial assets and liabilities related to brokerage accounts, predominantly linked to GBP and USD LIBOR, was reduced by approximately USD 8 billion in aggregate as a result of successful transitions.
For certain non-derivative financial assets and financial liabilities, in particular bonds issued by third parties, UBS AG is dependent on the participation and engagement of others in effecting the transition from IBORs. UBS AG is actively monitoring such exposures and is in discussions with clients.
As presented in the table on the previous page, UBS AG had approximately USD 16 billion (31 March 2021, USD 15 billion) of irrevocable commitments as of 30 June 2021 that can be drawn down in different currencies with IBOR-based interest rates, primarily USD LIBOR and Euribor, and that expire after the relevant benchmark cessation dates. Related drawn-down amounts under these commitments were USD 4 billion (31 March 2021, USD 4 billion).
In addition, UBS AG had approximately USD 10 billion (31 March 2021, USD 16 billion) of committed revocable credit lines outstanding that allow clients to draw down a number of IBOR-linked products. UBS AG is in discussions with impacted clients, with plans in place to have all contracts amended by the relevant cessation dates.
Derivative instruments UBS AG holds derivatives for trading and hedging purposes, including those designated in hedge accounting relationships. A significant number of interest rate and cross-currency swaps have floating legs that reference various benchmarks that will cease.
The majority of derivatives are transacted with clearing houses where UBS AG is dependent upon industry-wide compression activities to reduce exposure and clearing house actions to convert any remaining derivatives nearer the cessation dates. London Clearing House (LCH), which is the clearing house for a significant number of UBS AG’s IRS derivatives, has confirmed that a standardized transition will be undertaken in December 2021 to transition IBOR-based derivatives to respective ARRs. UBS AG expects derivative volumes to fluctuate in line with business activity until such clearing house actions are taken.
For derivatives not transacted with clearing houses, as previously noted, UBS AG adhered to the ISDA IBOR Fallback Protocol in November 2020, although its preferred approach, in line with regulatory expectations, is to actively switch to ARRs before the relevant cessation dates or to bilaterally compress where feasible. UBS AG has begun a series of outreach activities to understand counterparties’ intentions regarding whether they seek to adhere to the protocol or will actively switch.
In order to minimize the operational risk of converting high volumes of transactions at the time of cessation, UBS AG is making progress with its preparations to convert derivative instruments in bulk to ARR equivalents.
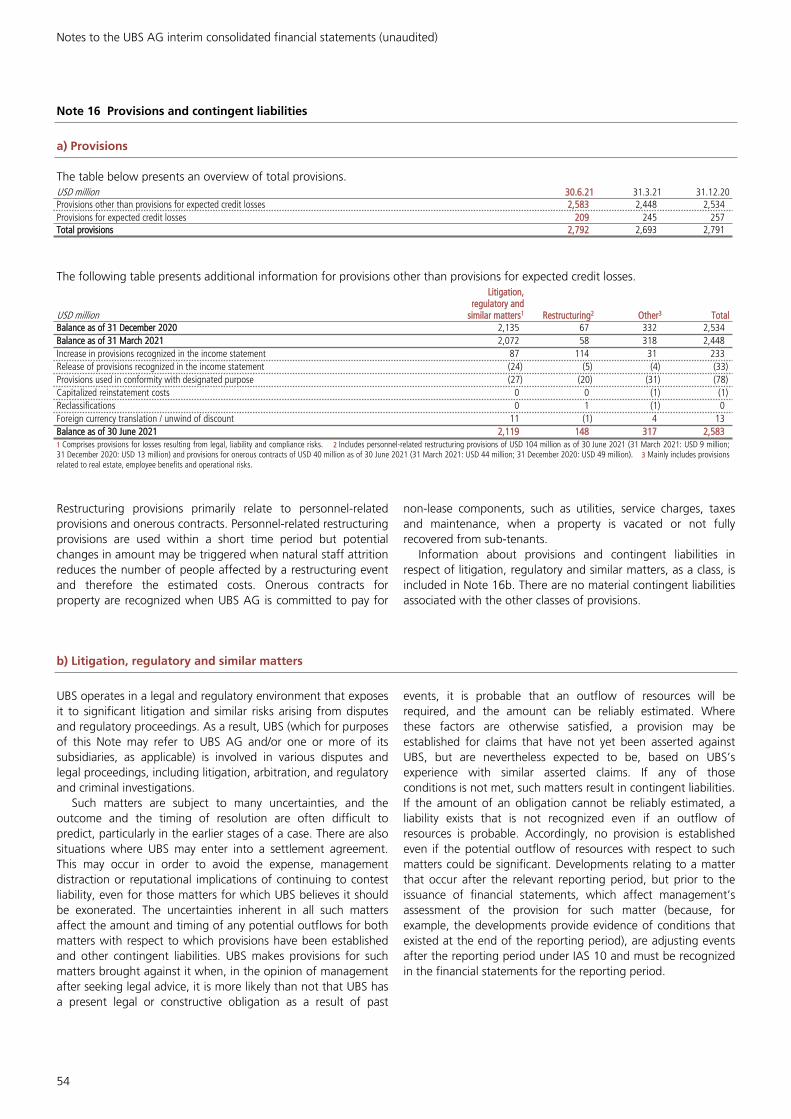
Notes to the UBS AG interim consolidated financial statements (unaudited)
54
Note 16 Provisions and contingent liabilities
a) Provisions
The table below presents an overview of total provisions.USD million 30.6.21 31.3.21 31.12.20Provisions other than provisions for expected credit losses 2,583 2,448 2,534Provisions for expected credit losses 209 245 257Total provisions 2,792 2,693 2,791
The following table presents additional information for provisions other than provisions for expected credit losses.
USD million
Litigation, regulatory and
similar matters1 Restructuring2 Other3 TotalBalance as of 31 December 2020 2,135 67 332 2,534Balance as of 31 March 2021 2,072 58 318 2,448Increase in provisions recognized in the income statement 87 114 31 233Release of provisions recognized in the income statement (24) (5) (4) (33)Provisions used in conformity with designated purpose (27) (20) (31) (78)Capitalized reinstatement costs 0 0 (1) (1)Reclassifications 0 1 (1) 0Foreign currency translation / unwind of discount 11 (1) 4 13Balance as of 30 June 2021 2,119 148 317 2,5831 Comprises provisions for losses resulting from legal, liability and compliance risks. 2 Includes personnel-related restructuring provisions of USD 104 million as of 30 June 2021 (31 March 2021: USD 9 million; 31 December 2020: USD 13 million) and provisions for onerous contracts of USD 40 million as of 30 June 2021 (31 March 2021: USD 44 million; 31 December 2020: USD 49 million). 3 Mainly includes provisions related to real estate, employee benefits and operational risks.
Restructuring provisions primarily relate to personnel-related provisions and onerous contracts. Personnel-related restructuring provisions are used within a short time period but potential changes in amount may be triggered when natural staff attrition reduces the number of people affected by a restructuring event and therefore the estimated costs. Onerous contracts for property are recognized when UBS AG is committed to pay for
non-lease components, such as utilities, service charges, taxes and maintenance, when a property is vacated or not fully recovered from sub-tenants.
Information about provisions and contingent liabilities in respect of litigation, regulatory and similar matters, as a class, is included in Note 16b. There are no material contingent liabilities associated with the other classes of provisions.
b) Litigation, regulatory and similar matters
UBS operates in a legal and regulatory environment that exposes it to significant litigation and similar risks arising from disputes and regulatory proceedings. As a result, UBS (which for purposes of this Note may refer to UBS AG and/or one or more of its subsidiaries, as applicable) is involved in various disputes and legal proceedings, including litigation, arbitration, and regulatory and criminal investigations.
Such matters are subject to many uncertainties, and the outcome and the timing of resolution are often difficult to predict, particularly in the earlier stages of a case. There are also situations where UBS may enter into a settlement agreement. This may occur in order to avoid the expense, management distraction or reputational implications of continuing to contest liability, even for those matters for which UBS believes it should be exonerated. The uncertainties inherent in all such matters affect the amount and timing of any potential outflows for both matters with respect to which provisions have been established and other contingent liabilities. UBS makes provisions for such matters brought against it when, in the opinion of management after seeking legal advice, it is more likely than not that UBS has a present legal or constructive obligation as a result of past
events, it is probable that an outflow of resources will be required, and the amount can be reliably estimated. Where these factors are otherwise satisfied, a provision may be established for claims that have not yet been asserted against UBS, but are nevertheless expected to be, based on UBS’s experience with similar asserted claims. If any of those conditions is not met, such matters result in contingent liabilities. If the amount of an obligation cannot be reliably estimated, a liability exists that is not recognized even if an outflow of resources is probable. Accordingly, no provision is established even if the potential outflow of resources with respect to such matters could be significant. Developments relating to a matter that occur after the relevant reporting period, but prior to the issuance of financial statements, which affect management’s assessment of the provision for such matter (because, for example, the developments provide evidence of conditions that existed at the end of the reporting period), are adjusting events after the reporting period under IAS 10 and must be recognized in the financial statements for the reporting period.

55
Note 16 Provisions and contingent liabilities (continued)
Specific litigation, regulatory and other matters are described below, including all such matters that management considers to be material and others that management believes to be of significance due to potential financial, reputational and other effects. The amount of damages claimed, the size of a transaction or other information is provided where available and appropriate in order to assist users in considering the magnitude of potential exposures.
In the case of certain matters below, we state that we have established a provision, and for the other matters, we make no such statement. When we make this statement and we expect disclosure of the amount of a provision to prejudice seriously our position with other parties in the matter because it would reveal what UBS believes to be the probable and reliably estimable outflow, we do not disclose that amount. In some cases we are subject to confidentiality obligations that preclude such disclosure. With respect to the matters for which we do not state whether we have established a provision, either: (a) we have not established a provision, in which case the matter is treated as a contingent liability under the applicable accounting standard; or (b) we have established a provision but expect disclosure of that fact to prejudice seriously our position with other parties in the matter because it would reveal the fact that UBS believes an outflow of resources to be probable and reliably estimable.
With respect to certain litigation, regulatory and similar matters for which we have established provisions, we are able to estimate the expected timing of outflows. However, the aggregate amount of the expected outflows for those matters for which we are able to estimate expected timing is immaterial relative to our current and expected levels of liquidity over the relevant time periods.
The aggregate amount provisioned for litigation, regulatory and similar matters as a class is disclosed in the “Provisions” table in Note 16a above. It is not practicable to provide an aggregate estimate of liability for our litigation, regulatory and similar matters as a class of contingent liabilities. Doing so would require UBS to provide speculative legal assessments as to claims and proceedings that involve unique fact patterns or novel legal theories, that have not yet been initiated or are at early stages of adjudication, or as to which alleged damages have not been quantified by the claimants. Although UBS therefore cannot provide a numerical estimate of the future losses that could arise from litigation, regulatory and similar matters, UBS believes that the aggregate amount of possible future losses from this class that are more than remote substantially exceeds the level of current provisions.
Litigation, regulatory and similar matters may also result in non-monetary penalties and consequences. For example, the non-prosecution agreement UBS entered into with the US Department of Justice (DOJ), Criminal Division, Fraud Section in connection with submissions of benchmark interest rates, including, among others, the British Bankers’ Association London Interbank Offered Rate (LIBOR), was terminated by the DOJ based on its determination that UBS had committed a US crime in relation to foreign exchange matters. As a consequence, UBS AG pleaded guilty to one count of wire fraud for conduct in the LIBOR matter, paid a fine and was subject to probation, which ended in January 2020.
A guilty plea to, or conviction of, a crime could have material consequences for UBS. Resolution of regulatory proceedings may require UBS to obtain waivers of regulatory disqualifications to maintain certain operations, may entitle regulatory authorities to limit, suspend or terminate licenses and regulatory authorizations, and may permit financial market utilities to limit, suspend or terminate UBS’s participation in such utilities. Failure to obtain such waivers, or any limitation, suspension or termination of licenses, authorizations or participations, could have material consequences for UBS.
The risk of loss associated with litigation, regulatory and similar matters is a component of operational risk for purposes of determining capital requirements. Information concerning our capital requirements and the calculation of operational risk for this purpose is included in the “Capital management” section of the UBS Group second quarter 2021 report.
Provisions for litigation, regulatory and similar matters by business division and in Group Functions1
USD million
Global WealthManage-
ment
Personal & Corporate
Banking
AssetManage-
mentInvestment
BankGroup
Functions TotalBalance as of 31 December 2020 861 115 0 227 932 2,135
Balance as of 31 March 2021 810 109 1 217 935 2,072
Increase in provisions recognized in the income statement 20 0 0 66 1 87
Release of provisions recognized in the income statement (11) (11) 0 (2) 0 (24)
Provisions used in conformity with designated purpose (27) 0 0 0 0 (27)
Foreign currency translation / unwind of discount 8 2 0 1 0 11
Balance as of 30 June 2021 800 100 1 282 936 2,1191 Provisions, if any, for matters described in this Note are recorded in Global Wealth Management (item 3 and item 4) and Group Functions (item 2). Provisions, if any, for the matters described in items 1 and 6 of this Note are allocated between Global Wealth Management and Personal & Corporate Banking, and provisions, if any, for the matters described in this Note in item 5 are allocated between the Investment Bank and Group Functions.

Notes to the UBS AG interim consolidated financial statements (unaudited)
56
Note 16 Provisions and contingent liabilities (continued)
1. Inquiries regarding cross-border wealth management businesses Tax and regulatory authorities in a number of countries have made inquiries, served requests for information or examined employees located in their respective jurisdictions relating to the cross-border wealth management services provided by UBS and other financial institutions. It is possible that the implementation of automatic tax information exchange and other measures relating to cross-border provision of financial services could give rise to further inquiries in the future. UBS has received disclosure orders from the Swiss Federal Tax Administration (FTA) to transfer information based on requests for international administrative assistance in tax matters. The requests concern a number of UBS account numbers pertaining to current and former clients and are based on data from 2006 and 2008. UBS has taken steps to inform affected clients about the administrative assistance proceedings and their procedural rights, including the right to appeal. The requests are based on data received from the German authorities, who seized certain data related to UBS clients booked in Switzerland during their investigations and have apparently shared this data with other European countries. UBS expects additional countries to file similar requests.
Since 2013, UBS (France) S.A., UBS AG and certain former employees have been under investigation in France for alleged complicity in unlawful solicitation of clients on French territory, regarding the laundering of proceeds of tax fraud, and banking and financial solicitation by unauthorized persons. In connection with this investigation, the investigating judges ordered UBS AG to provide bail (“caution”) of EUR 1.1 billion and UBS (France) S.A. to post bail of EUR 40 million, which was reduced on appeal to EUR 10 million.
A trial in the court of first instance took place from 8 October 2018 until 15 November 2018. On 20 February 2019, the court announced a verdict finding UBS AG guilty of unlawful solicitation of clients on French territory and aggravated laundering of the proceeds of tax fraud, and UBS (France) S.A. guilty of aiding and abetting unlawful solicitation and laundering the proceeds of tax fraud. The court imposed fines aggregating EUR 3.7 billion on UBS AG and UBS (France) S.A. and awarded EUR 800 million of civil damages to the French state. UBS has appealed the decision. Under French law, the judgment is suspended while the appeal is pending. The trial in the Court of
Appeal took place between 8-24 March 2021. At the conclusion of the trial, the prosecutor asserted that the maximum penalty was EUR 2.2 billion and requested the court to award a penalty of at least EUR 2 billion. The French state asked for civil damages of EUR 1 billion. The judgment on the merits of the case is currently set for 27 September 2021. A subsequent appeal to the Cour de Cassation, France’s highest court, is possible with respect to questions of law.
UBS believes that based on both the law and the facts the judgment of the court of first instance should be reversed. UBS believes it followed its obligations under Swiss and French law as well as the European Savings Tax Directive. Even assuming liability, which it contests, UBS believes the penalties and damage amounts awarded greatly exceed the amounts that could be supported by the law and the facts. In particular, UBS believes the court incorrectly based the penalty on the total regularized assets rather than on any unpaid taxes on those assets for which a fraud has been characterized and further incorrectly awarded damages based on costs that were not proven by the civil party. Notwithstanding that UBS believes it should be acquitted, our balance sheet at 30 June 2021 reflected provisions with respect to this matter in an amount of EUR 450 million (USD 534 million at 30 June 2021). The wide range of possible outcomes in this case contributes to a high degree of estimation uncertainty. The provision reflected on our balance sheet at 30 June 2021 reflects our best estimate of possible financial implications, although it is reasonably possible that actual penalties and civil damages could exceed the provision amount.
In 2016, UBS was notified by the Belgian investigating judge that it is under formal investigation (“inculpé”) regarding the laundering of proceeds of tax fraud, of banking and financial solicitation by unauthorized persons, and of serious tax fraud.
Our balance sheet at 30 June 2021 reflected provisions with respect to matters described in this item 1 in an amount that UBS believes to be appropriate under the applicable accounting standard. As in the case of other matters for which we have established provisions, the future outflow of resources in respect of such matters cannot be determined with certainty based on currently available information and accordingly may ultimately prove to be substantially greater (or may be less) than the provision that we have recognized.

57
Note 16 Provisions and contingent liabilities (continued)
2. Claims related to sales of residential mortgage-backed securities and mortgagesFrom 2002 through 2007, prior to the crisis in the US residential loan market, UBS was a substantial issuer and underwriter of US residential mortgage-backed securities (RMBS) and was a purchaser and seller of US residential mortgages.
In November 2018, the DOJ filed a civil complaint in the District Court for the Eastern District of New York. The complaint seeks unspecified civil monetary penalties under the Financial Institutions Reform, Recovery and Enforcement Act of 1989 related to UBS’s issuance, underwriting and sale of 40 RMBS transactions in 2006 and 2007. UBS moved to dismiss the civil complaint on 6 February 2019. On 10 December 2019, the district court denied UBS’s motion to dismiss.
Our balance sheet at 30 June 2021 reflected a provision with respect to matters described in this item 2 in an amount that UBS believes to be appropriate under the applicable accounting standard. As in the case of other matters for which we have established provisions, the future outflow of resources in respect of this matter cannot be determined with certainty based on currently available information and accordingly may ultimately prove to be substantially greater (or may be less) than the provision that we have recognized.
3. MadoffIn relation to the Bernard L. Madoff Investment Securities LLC (BMIS) investment fraud, UBS AG, UBS (Luxembourg) S.A. (now UBS Europe SE, Luxembourg branch) and certain other UBS subsidiaries have been subject to inquiries by a number of regulators, including the Swiss Financial Market Supervisory Authority (FINMA) and the Luxembourg Commission de Surveillance du Secteur Financier. Those inquiries concerned two third-party funds established under Luxembourg law, substantially all assets of which were with BMIS, as well as certain funds established in offshore jurisdictions with either direct or indirect exposure to BMIS. These funds faced severe losses, and the Luxembourg funds are in liquidation. The documentation establishing both funds identifies UBS entities in various roles, including custodian, administrator, manager, distributor and promoter, and indicates that UBS employees serve as board members.
In 2009 and 2010, the liquidators of the two Luxembourg funds filed claims against UBS entities, non-UBS entities and certain individuals, including current and former UBS employees, seeking amounts totaling approximately EUR 2.1 billion, which includes amounts that the funds may be held liable to pay the trustee for the liquidation of BMIS (BMIS Trustee).
A large number of alleged beneficiaries have filed claims against UBS entities (and non-UBS entities) for purported losses relating to the Madoff fraud. The majority of these cases have been filed in Luxembourg, where decisions that the claims in eight test cases were inadmissible have been affirmed by the Luxembourg Court of Appeal, and the Luxembourg Supreme Court has dismissed a further appeal in one of the test cases.
In the US, the BMIS Trustee filed claims against UBS entities, among others, in relation to the two Luxembourg funds and one of the offshore funds. The total amount claimed against all defendants in these actions was not less than USD 2 billion. In 2014, the US Supreme Court rejected the BMIS Trustee’s motion for leave to appeal decisions dismissing all claims except those for the recovery of approximately USD 125 million of payments alleged to be fraudulent conveyances and preference payments. In 2016, the bankruptcy court dismissed these claims against the UBS entities. In February 2019, the Court of Appeals reversed the dismissal of the BMIS Trustee’s remaining claims, and the US Supreme Court subsequently denied a petition seeking review of the Court of Appeals’ decision. The case has been remanded to the Bankruptcy Court for further proceedings.
4. Puerto RicoDeclines since 2013 in the market prices of Puerto Rico municipal bonds and of closed-end funds (funds) that are sole-managed and co-managed by UBS Trust Company of Puerto Rico and distributed by UBS Financial Services Incorporated of Puerto Rico (UBS PR) led to multiple regulatory inquiries, which in 2014 and 2015, led to settlements with the Office of the Commissioner of Financial Institutions for the Commonwealth of Puerto Rico, the US Securities and Exchange Commission (SEC) and the Financial Industry Regulatory Authority.
Since then UBS clients in Puerto Rico who own the funds or Puerto Rico municipal bonds and/or who used their UBS account assets as collateral for UBS non-purpose loans filed customer complaints and arbitration demands. Allegations include fraud, misrepresentation and unsuitability of the funds and of the loans seeking aggregate damages of USD 3.4 billion, of which USD 2.9 billion have been resolved through settlements, arbitration or withdrawal of claims.
A shareholder derivative action was filed in 2014 against various UBS entities and current and certain former directors of the funds, alleging hundreds of millions of US dollars in losses in the funds. In 2015, defendants’ motion to dismiss was denied.
In 2011, a purported derivative action was filed on behalf of the Employee Retirement System of the Commonwealth of Puerto Rico (System) against over 40 defendants, including UBS PR, which was named in connection with its underwriting and consulting services. Plaintiffs alleged that defendants violated their purported fiduciary duties and contractual obligations in connection with the issuance and underwriting of USD 3 billion of bonds by the System in 2008 and sought damages of over USD 800 million. In 2016, the court granted the System’s request to join the action as a plaintiff. In 2017, the court denied defendants’ motion to dismiss the complaint. In 2020, the court denied plaintiffs’ motion for summary judgment.
Notes to the UBS AG interim consolidated financial statements (unaudited)
58
Note 16 Provisions and contingent liabilities (continued)
Beginning in 2015, certain agencies and public corporations of the Commonwealth of Puerto Rico (Commonwealth) defaulted on certain interest payments on Puerto Rico bonds. In 2016, US federal legislation created an oversight board with power to oversee Puerto Rico’s finances and to restructure its debt. The oversight board has imposed a stay on the exercise of certain creditors’ rights. In 2017, the oversight board placed certain of the bonds into a bankruptcy-like proceeding under the supervision of a Federal District Judge.
In May 2019, the oversight board filed complaints in Puerto Rico federal district court bringing claims against financial, legal and accounting firms that had participated in Puerto Rico municipal bond offerings, including UBS, seeking a return of underwriting and swap fees paid in connection with those offerings. UBS estimates that it received approximately USD 125 million in fees in the relevant offerings.
In August 2019, and February and November 2020, four US insurance companies that insured issues of Puerto Rico municipal bonds sued UBS and several other underwriters of Puerto Rico municipal bonds in three separate cases. The actions collectively seek recovery of an aggregate of USD 955 million in damages from the defendants. The plaintiffs in these cases claim that defendants failed to reasonably investigate financial statements in the offering materials for the insured Puerto Rico bonds issued between 2002 and 2007, which plaintiffs argue they relied upon in agreeing to insure the bonds notwithstanding that they had no contractual relationship with the underwriters. In June 2021 the court in the first of the three cases denied defendants’ motion to dismiss; defendants are seeking leave to appeal that decision. In July 2021, the court in another of these cases granted defendants’ motion to dismiss. A motion to dismiss is pending in the remaining case.
Our balance sheet at 30 June 2021 reflected provisions with respect to matters described in this item 4 in amounts that UBS believes to be appropriate under the applicable accounting standard. As in the case of other matters for which we have established provisions, the future outflow of resources in respect of such matters cannot be determined with certainty based on currently available information and accordingly may ultimately prove to be substantially greater (or may be less) than the provisions that we have recognized.
5. Foreign exchange, LIBOR and benchmark rates, and other trading practicesForeign exchange-related regulatory matters: Beginning in 2013, numerous authorities commenced investigations concerning possible manipulation of foreign exchange markets and precious metals prices. As a result of these investigations, UBS entered into resolutions with the UK Financial Conduct Authority (FCA), the US Commodity Futures Trading Commission (CFTC), FINMA, the Board of Governors of the Federal Reserve System (Federal Reserve Board) and the Connecticut Department of Banking, the DOJ’s Criminal Division and the European Commission. UBS has ongoing obligations under the Cease and Desist Order of the Federal Reserve Board and the Office of the Comptroller of the
Currency (as successor to the Connecticut Department of Banking), and to cooperate with relevant authorities and to undertake certain remediation measures. UBS has also been granted conditional immunity by the Antitrust Division of the DOJ and by authorities in other jurisdictions in connection with potential competition law violations relating to foreign exchange and precious metals businesses. Investigations relating to foreign exchange matters by certain authorities remain ongoing notwithstanding these resolutions.
Foreign exchange-related civil litigation: Putative class actions have been filed since 2013 in US federal courts and in other jurisdictions against UBS and other banks on behalf of putative classes of persons who engaged in foreign currency transactions with any of the defendant banks. UBS has resolved US federal court class actions relating to foreign currency transactions with the defendant banks and persons who transacted in foreign exchange futures contracts and options on such futures under a settlement agreement that provides for UBS to pay an aggregate of USD 141 million and provide cooperation to the settlement classes. Certain class members have excluded themselves from that settlement and have filed individual actions in US and English courts against UBS and other banks, alleging violations of US and European competition laws and unjust enrichment.
In 2015, a putative class action was filed in federal court against UBS and numerous other banks on behalf of persons and businesses in the US who directly purchased foreign currency from the defendants and alleged co-conspirators for their own end use. In March 2017, the court granted UBS’s (and the other banks’) motions to dismiss the complaint. The plaintiffs filed an amended complaint in August 2017. In March 2018, the court denied the defendants’ motions to dismiss the amended complaint.
LIBOR and other benchmark-related regulatory matters: Numerous government agencies, including the SEC, the CFTC, the DOJ, the FCA, the UK Serious Fraud Office, the Monetary Authority of Singapore, the Hong Kong Monetary Authority, FINMA, various state attorneys general in the US and competition authorities in various jurisdictions, have conducted investigations regarding potential improper attempts by UBS, among others, to manipulate LIBOR and other benchmark rates at certain times. UBS reached settlements or otherwise concluded investigations relating to benchmark interest rates with the investigating authorities. UBS has ongoing obligations to cooperate with the authorities with whom we have reached resolutions and to undertake certain remediation measures with respect to benchmark interest rate submissions. UBS has been granted conditional leniency or conditional immunity from authorities in certain jurisdictions, including the Antitrust Division of the DOJ and the Swiss Competition Commission (WEKO), in connection with potential antitrust or competition law violations related to certain rates. However, UBS has not reached a final settlement with WEKO, as the Secretariat of WEKO has asserted that UBS does not qualify for full immunity.

59
Note 16 Provisions and contingent liabilities (continued)
LIBOR and other benchmark-related civil litigation: A number of putative class actions and other actions are pending in the federal courts in New York against UBS and numerous other banks on behalf of parties who transacted in certain interest rate benchmark-based derivatives. Also pending in the US and in other jurisdictions are a number of other actions asserting losses related to various products whose interest rates were linked to LIBOR and other benchmarks, including adjustable rate mortgages, preferred and debt securities, bonds pledged as collateral, loans, depository accounts, investments and other interest-bearing instruments. The complaints allege manipulation, through various means, of certain benchmark interest rates, including USD LIBOR, Euroyen TIBOR, Yen LIBOR, EURIBOR, CHF LIBOR, GBP LIBOR, SGD SIBOR and SOR and Australian BBSW, and seek unspecified compensatory and other damages under varying legal theories.
USD LIBOR class and individual actions in the US: In 2013 and 2015, the district court in the USD LIBOR actions dismissed, in whole or in part, certain plaintiffs’ antitrust claims, federal racketeering claims, CEA claims, and state common law claims. Although the Second Circuit vacated the district court’s judgment dismissing antitrust claims, the district court again dismissed antitrust claims against UBS in 2016. Certain plaintiffs have appealed that decision to the Second Circuit. Separately, in 2018, the Second Circuit reversed in part the district court’s 2015 decision dismissing certain individual plaintiffs’ claims and certain of these actions are now proceeding. UBS entered into an agreement in 2016 with representatives of a class of bondholders to settle their USD LIBOR class action. The agreement has received final court approval. In 2018, the district court denied plaintiffs’ motions for class certification in the USD class actions for claims pending against UBS, and plaintiffs sought permission to appeal that ruling to the Second Circuit. In July 2018, the Second Circuit denied the petition to appeal of the class of USD lenders and in November 2018 denied the petition of the USD exchange class. In December 2019, UBS entered into an agreement with representatives of the class of USD lenders to settle their USD LIBOR class action. The agreement has received final court approval. In January 2019, a putative class action was filed in the District Court for the Southern District of New York against UBS and numerous other banks on behalf of US residents who, since 1 February 2014, directly transacted with a defendant bank in USD LIBOR instruments. The complaint asserts antitrust claims. The defendants moved to dismiss the complaint in August 2019. On 26 March 2020 the court granted defendants’ motion to dismiss the complaint in its entirety. Plaintiffs have appealed the dismissal. In August 2020, an individual action was filed in the Northern District of California against UBS and numerous other banks alleging that the defendants conspired to fix the interest rate used as the basis for loans to consumers by jointly setting the USD LIBOR rate and monopolized the market for LIBOR-based consumer loans and credit cards.
Other benchmark class actions in the US: In 2014, 2015 and 2017, the court in one of the Euroyen TIBOR lawsuits dismissed certain of the plaintiffs’ claims, including plaintiffs’ federal antitrust and racketeering claims. In August 2020, the court granted defendants’ motion for judgment on the pleadings and dismissed the lone remaining claim in the action as impermissibly
extraterritorial. Plaintiffs have appealed. In 2017, the court dismissed the other Yen LIBOR / Euroyen TIBOR action in its entirety on standing grounds. In April 2020, the appeals court reversed the dismissal and in August 2020 plaintiffs in that action filed an amended complaint. Defendants moved to dismiss the amended complaint in October 2020. In 2017, the court dismissed the CHF LIBOR action on standing grounds and failure to state a claim. Plaintiffs filed an amended complaint following the dismissal, and the court granted a renewed motion to dismiss in September 2019. Plaintiffs have appealed. Also in 2017, the court in the EURIBOR lawsuit dismissed the case as to UBS and certain other foreign defendants for lack of personal jurisdiction. Plaintiffs have appealed. In October 2018, the court in the SIBOR / SOR action dismissed all but one of plaintiffs’ claims against UBS. Plaintiffs filed an amended complaint following the dismissal, and the court granted a renewed motion to dismiss in July 2019. Plaintiffs appealed. In March 2021, the Second Circuit reversed the dismissal. In November 2018, the court in the BBSW lawsuit dismissed the case as to UBS and certain other foreign defendants for lack of personal jurisdiction. Following that dismissal, plaintiffs filed an amended complaint in April 2019, which UBS and other defendants named in the amended complaint moved to dismiss. In February 2020, the court in the BBSW action granted in part and denied in part defendants’ motions to dismiss the amended complaint. In August 2020, UBS and other BBSW defendants joined a motion for judgment on the pleadings. The court dismissed the GBP LIBOR action in August 2019. Plaintiffs have appealed.
Government bonds: Putative class actions have been filed since 2015 in US federal courts against UBS and other banks on behalf of persons who participated in markets for US Treasury securities since 2007. A consolidated complaint was filed in 2017 in the US District Court for the Southern District of New York alleging that the banks colluded with respect to, and manipulated prices of, US Treasury securities sold at auction and in the secondary market and asserting claims under the antitrust laws and for unjust enrichment. Defendants’ motions to dismiss the consolidated complaint was granted on 31 March 2021. Plaintiffs filed an amended complaint, which defendants moved to dismiss in June 2021. Similar class actions have been filed concerning European government bonds and other government bonds.
In May 2021, the European Commission issued a decision finding that UBS and six other banks breached European Union antitrust rules in 2007-2011 relating to European government bonds. The European Commission fined UBS EUR 172 million. UBS is appealing the amount of the fine.
With respect to additional matters and jurisdictions not encompassed by the settlements and orders referred to above, our balance sheet at 30 June 2021 reflected a provision in an amount that UBS believes to be appropriate under the applicable accounting standard. As in the case of other matters for which we have established provisions, the future outflow of resources in respect of such matters cannot be determined with certainty based on currently available information and accordingly may ultimately prove to be substantially greater (or may be less) than the provision that we have recognized.

Notes to the UBS AG interim consolidated financial statements (unaudited)
60
Note 16 Provisions and contingent liabilities (continued)
6. Swiss retrocessionsThe Federal Supreme Court of Switzerland ruled in 2012, in a test case against UBS, that distribution fees paid to a firm for distributing third-party and intra-group investment funds and structured products must be disclosed and surrendered to clients who have entered into a discretionary mandate agreement with the firm, absent a valid waiver. FINMA issued a supervisory note to all Swiss banks in response to the Supreme Court decision. UBS has met the FINMA requirements and has notified all potentially affected clients.
The Supreme Court decision has resulted, and may continue to result, in a number of client requests for UBS to disclose and potentially surrender retrocessions. Client requests are assessed on a case-by-case basis. Considerations taken into account when assessing these cases include, among other things, the existence
of a discretionary mandate and whether or not the client documentation contained a valid waiver with respect to distribution fees.
Our balance sheet at 30 June 2021 reflected a provision with respect to matters described in this item 6 in an amount that UBS believes to be appropriate under the applicable accounting standard. The ultimate exposure will depend on client requests and the resolution thereof, factors that are difficult to predict and assess. Hence, as in the case of other matters for which we have established provisions, the future outflow of resources in respect of such matters cannot be determined with certainty based on currently available information and accordingly may ultimately prove to be substantially greater (or may be less) than the provision that we have recognized.
Note 17 Currency translation rates
The following table shows the rates of the main currencies used to translate the financial information of UBS AG’s operations with a functional currency other than the US dollar into US dollars.
Closing exchange rate Average rate1
As of For the quarter ended Year-to-date
30.6.21 31.3.21 31.12.20 30.6.20 30.6.21 31.3.21 30.6.20 30.6.21 30.6.20
1 CHF 1.08 1.06 1.13 1.06 1.10 1.09 1.04 1.09 1.04
1 EUR 1.19 1.17 1.22 1.12 1.20 1.20 1.11 1.20 1.11
1 GBP 1.38 1.38 1.37 1.24 1.39 1.38 1.24 1.39 1.26
100 JPY 0.90 0.90 0.97 0.93 0.91 0.93 0.93 0.92 0.931 Monthly income statement items of operations with a functional currency other than the US dollar are translated into US dollars using month-end rates. Disclosed average rates for a quarter represent an average of three month-end rates, weighted according to the income and expense volumes of all operations of UBS AG with the same functional currency for each month. Weighted average rates for individual business divisions may deviate from the weighted average rates for UBS AG.

61
Note 18 Supplemental guarantor information required under SEC regulations
Joint liability of UBS Switzerland AG
In 2015, the Personal & Corporate Banking and Wealth Management businesses booked in Switzerland were transferred from UBS AG to UBS Switzerland AG through an asset transfer in accordance with the Swiss Merger Act. Under the terms of the asset transfer agreement, UBS Switzerland AG assumed joint liability for contractual obligations of UBS AG existing on the asset transfer date, including the full and unconditional
guarantee of certain registered debt securities issued by UBS AG. To reflect this joint liability, UBS Switzerland AG is presented in a separate column as a subsidiary co-guarantor.
The joint liability of UBS Switzerland AG for contractual obligations of UBS AG decreased by USD 2.5 billion in the first half of 2021 to USD 7.6 billion as of 30 June 2021, mainly related to derivative financial instruments.
Supplemental guarantor consolidated income statement
USD million
For the six months ended 30 June 2021UBS AG
(standalone)1
UBSSwitzerland AG
(standalone)1Other
subsidiaries2Elimination
entriesUBS AG
(consolidated)Operating incomeInterest income from financial instruments measured at amortized cost and fair value through other comprehensive income 1,521 1,812 1,228 (356) 4,205Interest expense from financial instruments measured at amortized cost (1,441) (276) (517) 515 (1,719)Net interest income from financial instruments measured at fair value through profit or loss 619 114 110 (133) 710Net interest income 699 1,650 820 26 3,196Other net income from financial instruments measured at fair value through profit or loss 1,757 417 720 (109) 2,785Credit loss (expense) / release 47 80 3 (23) 108Fee and commission income 2,064 2,571 7,996 (387) 12,244
Fee and commission expense (412) (239) (690) 380 (962)
Net fee and commission income 1,652 2,331 7,306 (7) 11,282
Other income 3,231 118 519 (3,333) 535
Total operating income 7,387 4,596 9,367 (3,445) 17,906
Operating expenses
Personnel expenses 1,915 1,116 5,125 1 8,158
General and administrative expenses 1,722 1,710 2,152 (1,373) 4,211
Depreciation and impairment of property, equipment and software 453 141 351 (58) 887Amortization and impairment of goodwill and intangible assets 4 0 13 0 17
Total operating expenses 4,095 2,967 7,641 (1,429) 13,274
Operating profit / (loss) before tax 3,293 1,629 1,726 (2,016) 4,632
Tax expense / (benefit) 222 299 493 (13) 1,001
Net profit / (loss) 3,070 1,331 1,233 (2,003) 3,631
Net profit / (loss) attributable to non-controlling interests 0 0 9 0 9
Net profit / (loss) attributable to shareholders 3,070 1,331 1,224 (2,003) 3,6231 Amounts presented for UBS AG standalone and UBS Switzerland AG standalone represent IFRS standalone information. Refer to the UBS AG standalone and UBS Switzerland AG standalone financial statements, available under “Complementary financial information” at ubs.com/investors, for information prepared in accordance with Swiss GAAP. 2 The ”Other subsidiaries“ column includes consolidated information for the UBS Americas Holding LLC, UBS Europe SE and UBS Asset Management AG significant sub-groups, as well as standalone information for other subsidiaries.

Notes to the UBS AG interim consolidated financial statements (unaudited)
62
Note 18 Supplemental guarantor information required under SEC regulations (continued)
Supplemental guarantor consolidated statement of comprehensive income
USD million
For the six months ended 30 June 2021UBS AG
(standalone)1
UBSSwitzerland AG
(standalone)1Other
subsidiaries2Elimination
entriesUBS AG
(consolidated)
Comprehensive income attributable to shareholders
Net profit / (loss) 3,070 1,331 1,224 (2,003) 3,623
Other comprehensive income
Other comprehensive income that may be reclassified to the income statement
Foreign currency translation, net of tax (38) (641) (287) 515 (452)
Financial assets measured at fair value through other comprehensive income, net of tax 0 0 (88) 0 (88)
Cash flow hedges, net of tax (662) (159) (110) (5) (937)
Cost of hedging, net of tax (23) (23)
Total other comprehensive income that may be reclassified to the income statement, net of tax (723) (801) (485) 509 (1,500)
Other comprehensive income that will not be reclassified to the income statement
Defined benefit plans, net of tax 41 (123) 50 0 (31)
Own credit on financial liabilities designated at fair value, net of tax 89 89
Total other comprehensive income that will not be reclassified to the income statement, net of tax 131 (123) 50 0 58
Total other comprehensive income (592) (924) (435) 509 (1,442)
Total comprehensive income attributable to shareholders 2,478 407 790 (1,494) 2,181
Total comprehensive income attributable to non-controlling interests 10 10Total comprehensive income 2,478 407 800 (1,494) 2,1921 Amounts presented for UBS AG standalone and UBS Switzerland AG standalone represent IFRS standalone information. Refer to the UBS AG standalone and UBS Switzerland AG standalone financial statements, available under “Complementary financial information” at ubs.com/investors, for information prepared in accordance with Swiss GAAP. 2 The ”Other subsidiaries“ column includes consolidated information for the UBS Americas Holding LLC, UBS Europe SE and UBS Asset Management AG significant sub-groups, as well as standalone information for other subsidiaries.
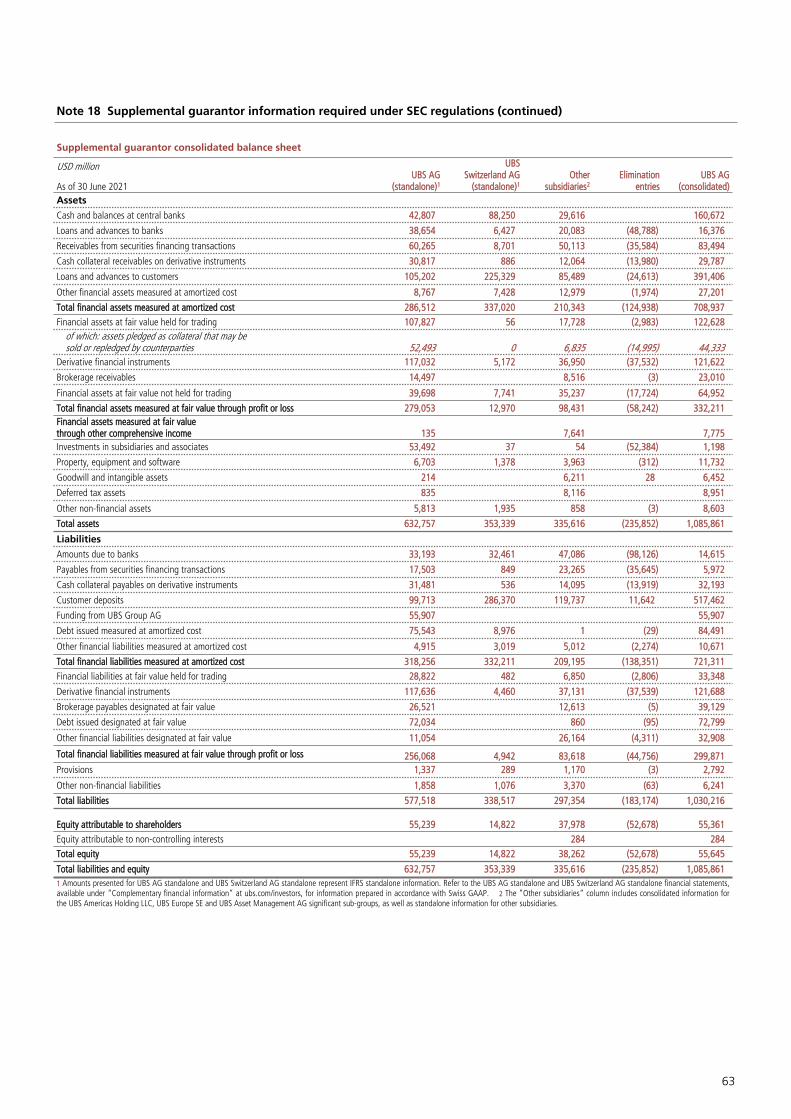
63
Note 18 Supplemental guarantor information required under SEC regulations (continued)
Supplemental guarantor consolidated balance sheet
USD million
As of 30 June 2021UBS AG
(standalone)1
UBSSwitzerland AG
(standalone)1Other
subsidiaries2Elimination
entriesUBS AG
(consolidated)Assets
Cash and balances at central banks 42,807 88,250 29,616 160,672
Loans and advances to banks 38,654 6,427 20,083 (48,788) 16,376
Receivables from securities financing transactions 60,265 8,701 50,113 (35,584) 83,494
Cash collateral receivables on derivative instruments 30,817 886 12,064 (13,980) 29,787
Loans and advances to customers 105,202 225,329 85,489 (24,613) 391,406
Other financial assets measured at amortized cost 8,767 7,428 12,979 (1,974) 27,201
Total financial assets measured at amortized cost 286,512 337,020 210,343 (124,938) 708,937Financial assets at fair value held for trading 107,827 56 17,728 (2,983) 122,628
of which: assets pledged as collateral that may besold or repledged by counterparties 52,493 0 6,835 (14,995) 44,333
Derivative financial instruments 117,032 5,172 36,950 (37,532) 121,622
Brokerage receivables 14,497 8,516 (3) 23,010
Financial assets at fair value not held for trading 39,698 7,741 35,237 (17,724) 64,952
Total financial assets measured at fair value through profit or loss 279,053 12,970 98,431 (58,242) 332,211Financial assets measured at fair value through other comprehensive income 135 7,641 7,775Investments in subsidiaries and associates 53,492 37 54 (52,384) 1,198
Property, equipment and software 6,703 1,378 3,963 (312) 11,732
Goodwill and intangible assets 214 6,211 28 6,452
Deferred tax assets 835 8,116 8,951
Other non-financial assets 5,813 1,935 858 (3) 8,603
Total assets 632,757 353,339 335,616 (235,852) 1,085,861
Liabilities
Amounts due to banks 33,193 32,461 47,086 (98,126) 14,615
Payables from securities financing transactions 17,503 849 23,265 (35,645) 5,972
Cash collateral payables on derivative instruments 31,481 536 14,095 (13,919) 32,193
Customer deposits 99,713 286,370 119,737 11,642 517,462
Funding from UBS Group AG 55,907 55,907
Debt issued measured at amortized cost 75,543 8,976 1 (29) 84,491
Other financial liabilities measured at amortized cost 4,915 3,019 5,012 (2,274) 10,671
Total financial liabilities measured at amortized cost 318,256 332,211 209,195 (138,351) 721,311Financial liabilities at fair value held for trading 28,822 482 6,850 (2,806) 33,348
Derivative financial instruments 117,636 4,460 37,131 (37,539) 121,688
Brokerage payables designated at fair value 26,521 12,613 (5) 39,129
Debt issued designated at fair value 72,034 860 (95) 72,799
Other financial liabilities designated at fair value 11,054 26,164 (4,311) 32,908
Total financial liabilities measured at fair value through profit or loss 256,068 4,942 83,618 (44,756) 299,871Provisions 1,337 289 1,170 (3) 2,792
Other non-financial liabilities 1,858 1,076 3,370 (63) 6,241
Total liabilities 577,518 338,517 297,354 (183,174) 1,030,216
Equity attributable to shareholders 55,239 14,822 37,978 (52,678) 55,361Equity attributable to non-controlling interests 284 284Total equity 55,239 14,822 38,262 (52,678) 55,645
Total liabilities and equity 632,757 353,339 335,616 (235,852) 1,085,8611 Amounts presented for UBS AG standalone and UBS Switzerland AG standalone represent IFRS standalone information. Refer to the UBS AG standalone and UBS Switzerland AG standalone financial statements, available under “Complementary financial information” at ubs.com/investors, for information prepared in accordance with Swiss GAAP. 2 The ”Other subsidiaries“ column includes consolidated information for the UBS Americas Holding LLC, UBS Europe SE and UBS Asset Management AG significant sub-groups, as well as standalone information for other subsidiaries.
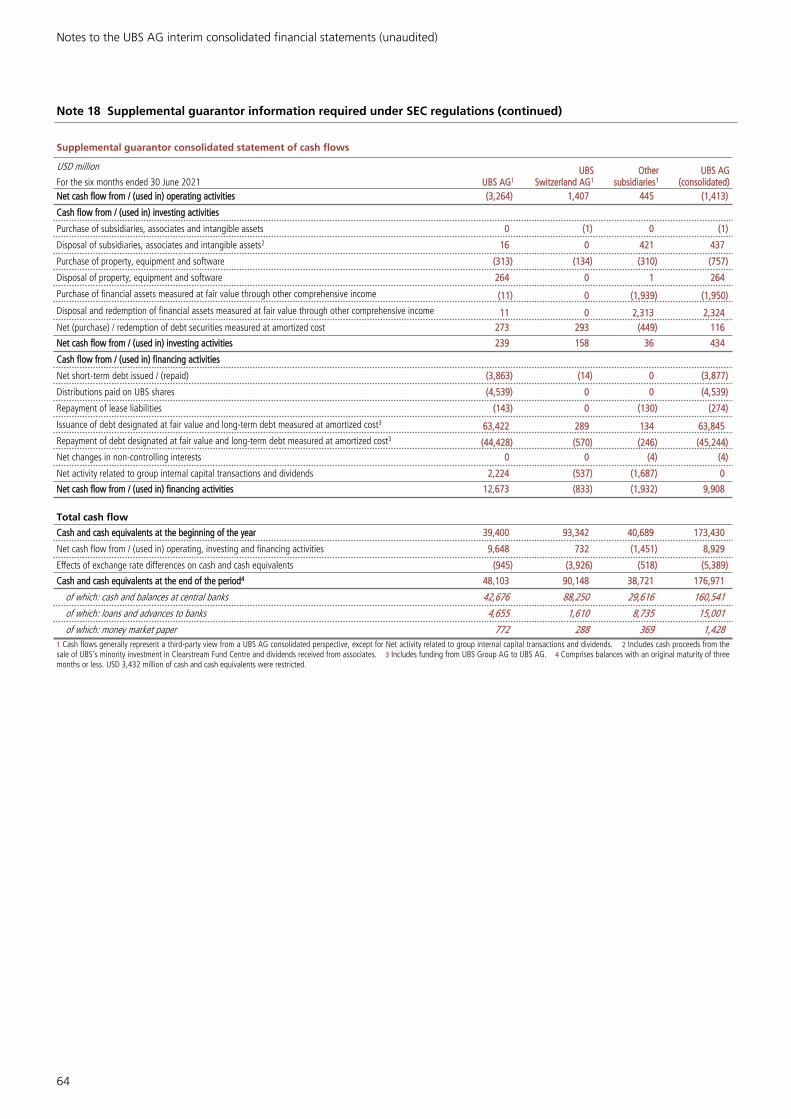
Notes to the UBS AG interim consolidated financial statements (unaudited)
64
Note 18 Supplemental guarantor information required under SEC regulations (continued)
Supplemental guarantor consolidated statement of cash flows
USD million
For the six months ended 30 June 2021 UBS AG1UBS
Switzerland AG1Other
subsidiaries1UBS AG
(consolidated)Net cash flow from / (used in) operating activities (3,264) 1,407 445 (1,413)
Cash flow from / (used in) investing activities
Purchase of subsidiaries, associates and intangible assets 0 (1) 0 (1)
Disposal of subsidiaries, associates and intangible assets2 16 0 421 437
Purchase of property, equipment and software (313) (134) (310) (757)
Disposal of property, equipment and software 264 0 1 264
Purchase of financial assets measured at fair value through other comprehensive income (11) 0 (1,939) (1,950)
Disposal and redemption of financial assets measured at fair value through other comprehensive income 11 0 2,313 2,324Net (purchase) / redemption of debt securities measured at amortized cost 273 293 (449) 116
Net cash flow from / (used in) investing activities 239 158 36 434
Cash flow from / (used in) financing activities
Net short-term debt issued / (repaid) (3,863) (14) 0 (3,877)
Distributions paid on UBS shares (4,539) 0 0 (4,539)
Repayment of lease liabilities (143) 0 (130) (274)
Issuance of debt designated at fair value and long-term debt measured at amortized cost3 63,422 289 134 63,845Repayment of debt designated at fair value and long-term debt measured at amortized cost3 (44,428) (570) (246) (45,244)Net changes in non-controlling interests 0 0 (4) (4)
Net activity related to group internal capital transactions and dividends 2,224 (537) (1,687) 0
Net cash flow from / (used in) financing activities 12,673 (833) (1,932) 9,908
Total cash flow
Cash and cash equivalents at the beginning of the year 39,400 93,342 40,689 173,430
Net cash flow from / (used in) operating, investing and financing activities 9,648 732 (1,451) 8,929
Effects of exchange rate differences on cash and cash equivalents (945) (3,926) (518) (5,389)
Cash and cash equivalents at the end of the period4 48,103 90,148 38,721 176,971
of which: cash and balances at central banks 42,676 88,250 29,616 160,541
of which: loans and advances to banks 4,655 1,610 8,735 15,001
of which: money market paper 772 288 369 1,4281 Cash flows generally represent a third-party view from a UBS AG consolidated perspective, except for Net activity related to group internal capital transactions and dividends. 2 Includes cash proceeds from the sale of UBS’s minority investment in Clearstream Fund Centre and dividends received from associates. 3 Includes funding from UBS Group AG to UBS AG. 4 Comprises balances with an original maturity of three months or less. USD 3,432 million of cash and cash equivalents were restricted.
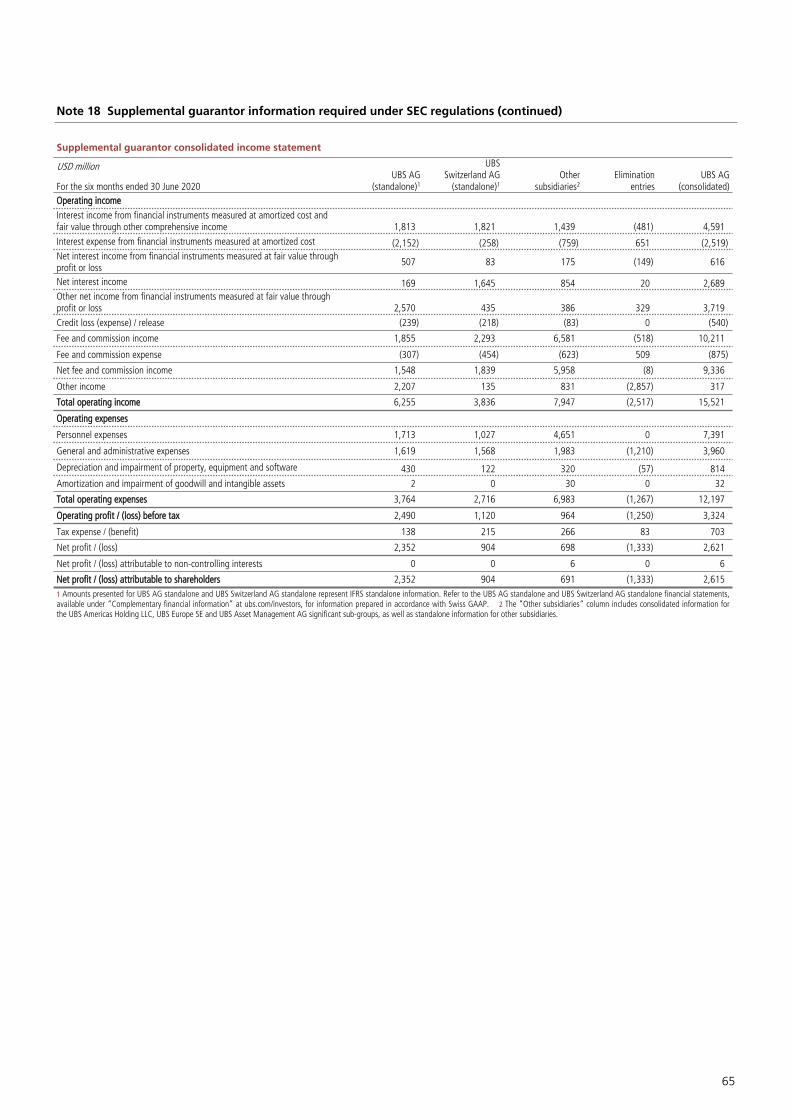
65
Note 18 Supplemental guarantor information required under SEC regulations (continued)
Supplemental guarantor consolidated income statement
USD million
For the six months ended 30 June 2020UBS AG
(standalone)1
UBSSwitzerland AG
(standalone)1Other
subsidiaries2Elimination
entriesUBS AG
(consolidated)Operating incomeInterest income from financial instruments measured at amortized cost and fair value through other comprehensive income 1,813 1,821 1,439 (481) 4,591Interest expense from financial instruments measured at amortized cost (2,152) (258) (759) 651 (2,519)Net interest income from financial instruments measured at fair value through profit or loss 507 83 175 (149) 616
Net interest income 169 1,645 854 20 2,689Other net income from financial instruments measured at fair value through profit or loss 2,570 435 386 329 3,719Credit loss (expense) / release (239) (218) (83) 0 (540)
Fee and commission income 1,855 2,293 6,581 (518) 10,211
Fee and commission expense (307) (454) (623) 509 (875)
Net fee and commission income 1,548 1,839 5,958 (8) 9,336
Other income 2,207 135 831 (2,857) 317
Total operating income 6,255 3,836 7,947 (2,517) 15,521
Operating expenses
Personnel expenses 1,713 1,027 4,651 0 7,391
General and administrative expenses 1,619 1,568 1,983 (1,210) 3,960
Depreciation and impairment of property, equipment and software 430 122 320 (57) 814Amortization and impairment of goodwill and intangible assets 2 0 30 0 32
Total operating expenses 3,764 2,716 6,983 (1,267) 12,197
Operating profit / (loss) before tax 2,490 1,120 964 (1,250) 3,324
Tax expense / (benefit) 138 215 266 83 703
Net profit / (loss) 2,352 904 698 (1,333) 2,621
Net profit / (loss) attributable to non-controlling interests 0 0 6 0 6
Net profit / (loss) attributable to shareholders 2,352 904 691 (1,333) 2,6151 Amounts presented for UBS AG standalone and UBS Switzerland AG standalone represent IFRS standalone information. Refer to the UBS AG standalone and UBS Switzerland AG standalone financial statements, available under “Complementary financial information” at ubs.com/investors, for information prepared in accordance with Swiss GAAP. 2 The ”Other subsidiaries“ column includes consolidated information for the UBS Americas Holding LLC, UBS Europe SE and UBS Asset Management AG significant sub-groups, as well as standalone information for other subsidiaries.

Notes to the UBS AG interim consolidated financial statements (unaudited)
66
Note 18 Supplemental guarantor information required under SEC regulations (continued)
Supplemental guarantor consolidated statement of comprehensive income
USD million
For the six months ended 30 June 2020UBS AG
(standalone)1
UBSSwitzerland AG
(standalone)1Other
subsidiaries2Elimination
entriesUBS AG
(consolidated)
Comprehensive income attributable to shareholders
Net profit / (loss) 2,352 904 691 (1,333) 2,615
Other comprehensive income
Other comprehensive income that may be reclassified to the income statement
Foreign currency translation, net of tax 7 278 (111) (72) 103
Financial assets measured at fair value through other comprehensive income, net of tax 0 0 149 0 149
Cash flow hedges, net of tax 1,348 84 176 (8) 1,600
Cost of hedging, net of tax 9 0 (13) 0 (4)
Total other comprehensive income that may be reclassified to the income statement, net of tax 1,364 362 201 (80) 1,847
Other comprehensive income that will not be reclassified to the income statement
Defined benefit plans, net of tax (131) (97) (42) 0 (270)
Own credit on financial liabilities designated at fair value, net of tax 62 62
Total other comprehensive income that will not be reclassified to the income statement, net of tax (69) (97) (42) 0 (208)
Total other comprehensive income 1,295 265 160 (80) 1,639
Total comprehensive income attributable to shareholders 3,647 1,169 851 (1,413) 4,254
Total comprehensive income attributable to non-controlling interests 3 3
Total comprehensive income 3,647 1,169 854 (1,413) 4,2561 Amounts presented for UBS AG standalone and UBS Switzerland AG standalone represent IFRS standalone information. Refer to the UBS AG standalone and UBS Switzerland AG standalone financial statements, available under “Complementary financial information” at ubs.com/investors, for information prepared in accordance with Swiss GAAP. 2 The ”Other subsidiaries“ column includes consolidated information for the UBS Americas Holding LLC, UBS Europe SE and UBS Asset Management AG significant sub-groups, as well as standalone information for other subsidiaries.

67
Note 18 Supplemental guarantor information required under SEC regulations (continued)
Supplemental guarantor consolidated balance sheet
USD million
As of 31 December 2020UBS AG
(standalone)1
UBSSwitzerland AG
(standalone)1Other
subsidiaries2Elimination
entriesUBS AG
(consolidated)Assets
Cash and balances at central banks 34,426 91,638 32,167 158,231
Loans and advances to banks 40,171 6,385 19,465 (50,678) 15,344
Receivables from securities financing transactions 56,568 4,026 43,350 (29,735) 74,210
Cash collateral receivables on derivative instruments 32,771 1,543 10,093 (11,671) 32,737
Loans and advances to customers 99,952 228,279 73,513 (20,767) 380,977
Other financial assets measured at amortized cost 8,411 8,084 13,368 (2,644) 27,219
Total financial assets measured at amortized cost 272,299 339,956 191,957 (115,495) 688,717Financial assets at fair value held for trading 110,812 55 16,260 (1,634) 125,492
of which: assets pledged as collateral that may be sold or repledged by counterparties 54,468 1 6,247 (13,617) 47,098
Derivative financial instruments 154,313 6,342 44,005 (45,041) 159,618
Brokerage receivables 16,898 7,763 (2) 24,659
Financial assets at fair value not held for trading 46,198 13,068 36,444 (15,672) 80,038
Total financial assets measured at fair value through profit or loss 328,221 19,464 104,473 (62,350) 389,808Financial assets measured at fair value through other comprehensive income 187 8,072 8,258Investments in subsidiaries and associates 53,606 38 439 (52,526) 1,557
Property, equipment and software 6,999 1,335 3,975 (350) 11,958
Goodwill and intangible assets 217 6,234 28 6,480
Deferred tax assets 840 1 8,334 (1) 9,174
Other non-financial assets 6,641 2,063 854 (183) 9,374
Total assets 669,010 362,857 324,337 (230,878) 1,125,327
Liabilities
Amounts due to banks 41,414 34,096 43,066 (107,527) 11,050
Payables from securities financing transactions 17,247 566 18,407 (29,899) 6,321
Cash collateral payables on derivative instruments 35,875 561 12,495 (11,618) 37,313
Customer deposits 98,441 293,371 112,372 23,745 527,929
Funding from UBS Group AG 53,979 53,979
Debt issued measured at amortized cost 75,658 9,687 3 3 85,351
Other financial liabilities measured at amortized cost 5,285 2,567 5,745 (3,175) 10,421
Total financial liabilities measured at amortized cost 327,898 340,848 192,088 (128,470) 732,364Financial liabilities at fair value held for trading 28,800 335 5,989 (1,529) 33,595
Derivative financial instruments 156,192 5,593 44,359 (45,043) 161,102
Brokerage payables designated at fair value 25,045 13,704 (7) 38,742
Debt issued designated at fair value 58,986 935 (54) 59,868
Other financial liabilities designated at fair value 11,255 23,445 (2,927) 31,773
Total financial liabilities measured at fair value through profit or loss 280,279 5,927 88,433 (49,559) 325,080Provisions 1,293 301 1,197 2,791
Other non-financial liabilities 2,173 987 3,907 (49) 7,018
Total liabilities 611,643 348,063 285,625 (178,078) 1,067,254
Equity attributable to shareholders 57,367 14,794 38,393 (52,800) 57,754Equity attributable to non-controlling interests 319 319Total equity 57,367 14,794 38,712 (52,800) 58,073
Total liabilities and equity 669,010 362,857 324,337 (230,878) 1,125,3271 Amounts presented for UBS AG standalone and UBS Switzerland AG standalone represent IFRS standalone information. Refer to the UBS AG standalone and UBS Switzerland AG standalone financial statements, available under “Complementary financial information” at ubs.com/investors, for information prepared in accordance with Swiss GAAP. 2 The ”Other subsidiaries“ column includes consolidated information for the UBS Americas Holding LLC, UBS Europe SE and UBS Asset Management AG significant sub-groups, as well as standalone information for other subsidiaries.

Notes to the UBS AG interim consolidated financial statements (unaudited)
68
Note 18 Supplemental guarantor information required under SEC regulations (continued)
Supplemental guarantor consolidated statement of cash flows
USD million
For the six months ended 30 June 2020 UBS AG1UBS
Switzerland AG1Other
subsidiaries1UBS AG
(consolidated)Net cash flow from / (used in) operating activities 7,484 16,765 16,811 41,060
Cash flow from / (used in) investing activities
Purchase of subsidiaries, associates and intangible assets 0 (1) 0 (1)
Disposal of subsidiaries, associates and intangible assets 14 0 0 14
Purchase of property, equipment and software (277) (139) (309) (725)
Disposal of property, equipment and software 1 0 3 4
Purchase of financial assets measured at fair value through other comprehensive income (77) 0 (4,055) (4,132)
Disposal and redemption of financial assets measured at fair value through other comprehensive income 27 0 1,917 1,944
Net (purchase) / redemption of debt securities measured at amortized cost (3,126) (373) (1,318) (4,817)
Net cash flow from / (used in) investing activities (3,437) (513) (3,762) (7,713)
Cash flow from / (used in) financing activities
Net short-term debt issued / (repaid) 14,916 (3) (1) 14,912
Distributions paid on UBS shares (2,550) 0 0 (2,550)
Repayment of lease liabilities (133) 0 (129) (262)
Issuance of debt designated at fair value and long-term debt measured at amortized cost2 45,597 336 68 46,001Repayment of debt designated at fair value and long-term debt measured at amortized cost2 (45,770) (306) (62) (46,137)
Net changes in non-controlling interests 0 0 (4) (4)
Net activity related to group internal capital transactions and dividends 1,513 (749) (763) 0
Net cash flow from / (used in) financing activities 13,573 (723) (890) 11,960
Total cash flow
Cash and cash equivalents at the beginning of the year 39,598 62,551 17,655 119,804
Net cash flow from / (used in) operating, investing and financing activities 17,620 15,529 12,160 45,308
Effects of exchange rate differences on cash and cash equivalents 48 1,549 (30) 1,567
Cash and cash equivalents at the end of the period3 57,266 79,629 29,784 166,679
of which: cash and balances at central banks 51,139 77,212 21,078 149,430
of which: loans and advances to banks 4,492 1,979 7,867 14,339
of which: money market paper 1,635 437 839 2,9111 Cash flows generally represent a third-party view from a UBS AG consolidated perspective, except for Net activity related to group internal capital transactions and dividends. 2 Incudes funding from UBS Group AG to UBS AG. 3 Comprises balances with an original maturity of three months or less. USD 5,393 million of cash and cash equivalents were restricted.

UBS AG standalone financial informationUnaudited

Table of contents
UBS AG interim standalone financialinformation (unaudited)
71 Income statement72 Balance sheet73 Basis of accounting and items impacting
comparability
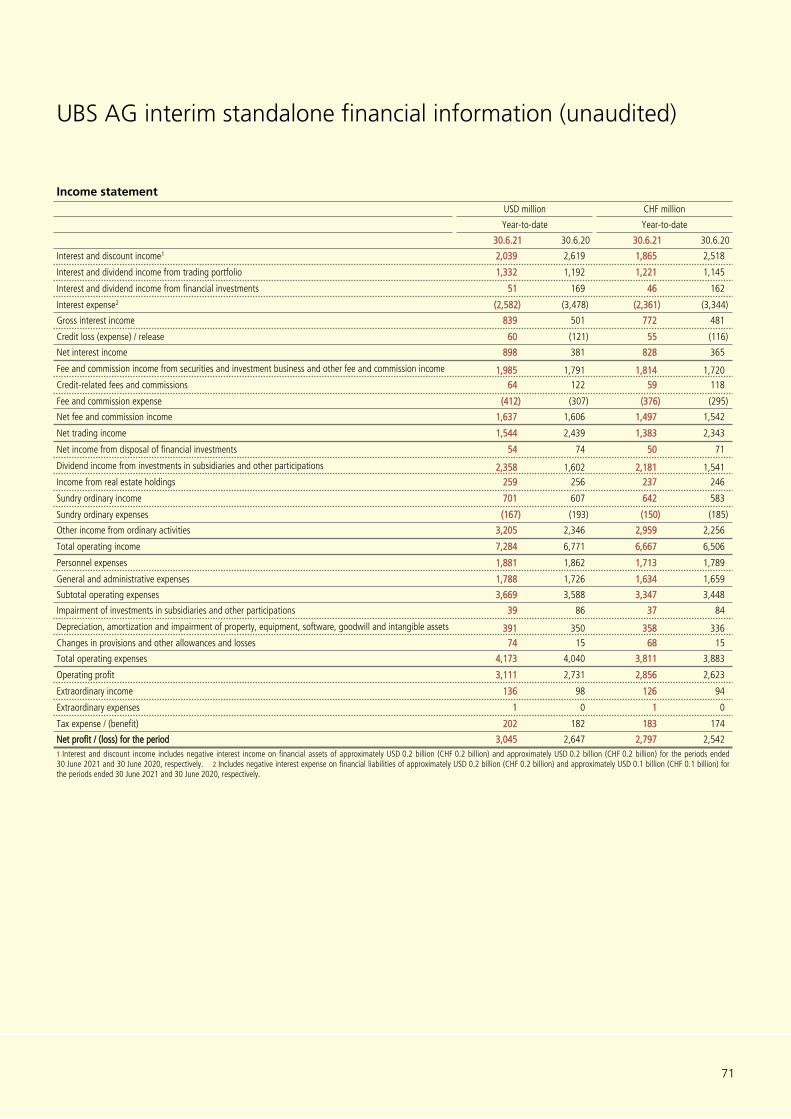
71
UBS AG interim standalone financial information (unaudited)
Income statementUSD million CHF million
Year-to-date Year-to-date
30.6.21 30.6.20 30.6.21 30.6.20
Interest and discount income1 2,039 2,619 1,865 2,518
Interest and dividend income from trading portfolio 1,332 1,192 1,221 1,145
Interest and dividend income from financial investments 51 169 46 162
Interest expense2 (2,582) (3,478) (2,361) (3,344)
Gross interest income 839 501 772 481
Credit loss (expense) / release 60 (121) 55 (116)
Net interest income 898 381 828 365
Fee and commission income from securities and investment business and other fee and commission income 1,985 1,791 1,814 1,720Credit-related fees and commissions 64 122 59 118
Fee and commission expense (412) (307) (376) (295)
Net fee and commission income 1,637 1,606 1,497 1,542
Net trading income 1,544 2,439 1,383 2,343
Net income from disposal of financial investments 54 74 50 71
Dividend income from investments in subsidiaries and other participations 2,358 1,602 2,181 1,541Income from real estate holdings 259 256 237 246
Sundry ordinary income 701 607 642 583
Sundry ordinary expenses (167) (193) (150) (185)
Other income from ordinary activities 3,205 2,346 2,959 2,256
Total operating income 7,284 6,771 6,667 6,506
Personnel expenses 1,881 1,862 1,713 1,789
General and administrative expenses 1,788 1,726 1,634 1,659
Subtotal operating expenses 3,669 3,588 3,347 3,448
Impairment of investments in subsidiaries and other participations 39 86 37 84
Depreciation, amortization and impairment of property, equipment, software, goodwill and intangible assets 391 350 358 336Changes in provisions and other allowances and losses 74 15 68 15
Total operating expenses 4,173 4,040 3,811 3,883
Operating profit 3,111 2,731 2,856 2,623
Extraordinary income 136 98 126 94
Extraordinary expenses 1 0 1 0
Tax expense / (benefit) 202 182 183 174
Net profit / (loss) for the period 3,045 2,647 2,797 2,5421 Interest and discount income includes negative interest income on financial assets of approximately USD 0.2 billion (CHF 0.2 billion) and approximately USD 0.2 billion (CHF 0.2 billion) for the periods ended 30 June 2021 and 30 June 2020, respectively. 2 Includes negative interest expense on financial liabilities of approximately USD 0.2 billion (CHF 0.2 billion) and approximately USD 0.1 billion (CHF 0.1 billion) for the periods ended 30 June 2021 and 30 June 2020, respectively.

UBS AG interim standalone financial information (unaudited)
72
Balance sheet USD million CHF million
30.6.21 31.12.20 30.6.21 31.12.20
AssetsCash and balances at central banks 42,734 34,148 39,529 30,239Due from banks 36,114 38,357 33,405 33,966Receivables from securities financing transactions 67,067 63,305 62,038 56,058Due from customers 126,688 124,596 117,188 110,334Funding provided to significant regulated subsidiaries eligible as total loss-absorbing capacity1 26,995 26,354 24,972 23,337Mortgage loans 5,389 5,406 4,985 4,787Trading portfolio assets 111,525 115,164 103,163 101,981Derivative financial instruments 16,160 17,203 14,949 15,234Financial investments 17,932 23,852 16,588 21,122Accrued income and prepaid expenses 1,388 1,414 1,284 1,253Investments in subsidiaries and other participations 50,801 50,444 46,992 44,670Property, equipment and software 5,693 6,091 5,266 5,394Other assets 3,488 2,690 3,225 2,381Total assets 511,973 509,024 473,583 450,756
of which: subordinated assets 19,308 19,999 17,860 17,710of which: subject to mandatory conversion and / or debt waiver 17,576 18,067 16,259 15,998
LiabilitiesDue to banks 41,083 49,655 38,003 43,971Payables from securities financing transactions 23,635 24,407 21,863 21,613Due to customers 136,036 132,747 125,835 117,553Funding received from UBS Group AG eligible as total loss-absorbing capacity at UBS AG level measured at amortized cost1 55,011 53,585 50,887 47,451Trading portfolio liabilities 28,822 28,806 26,660 25,509Derivative financial instruments 17,343 21,918 16,043 19,409Financial liabilities designated at fair value 74,331 58,737 68,758 52,014
of which: funding received from UBS Group AG eligible as total loss-absorbing capacity at UBS AG level1 2,112 0 1,954 0Bonds issued 76,266 76,490 70,547 67,734
of which: total loss-absorbing capacity eligible at UBS AG level1 5,044 7,480 4,666 6,624Accrued expenses and deferred income 2,692 3,282 2,490 2,906Other liabilities 4,391 5,591 4,061 4,951Provisions 1,461 1,411 1,351 1,250Total liabilities 461,071 456,628 426,498 404,359
EquityShare capital 393 393 386 386General reserve 36,326 36,326 35,649 35,649
of which: statutory capital reserve 36,326 36,326 35,649 35,649of which: capital contribution reserve 36,326 36,326 35,649 35,649
Voluntary earnings reserve 11,138 11,138 8,253 6,098Net profit / (loss) for the period 3,045 4,539 2,797 4,265Total equity 50,902 52,396 47,085 46,397Total liabilities and equity 511,973 509,024 473,583 450,756
of which: subordinated liabilities 63,019 62,053 58,294 54,950of which: subject to mandatory conversion and / or debt waiver 62,448 61,486 57,766 54,448
1 Represents the Swiss GAAP carrying amount of instruments qualifying as total loss-absorbing capital.
73
Basis of accounting and items impacting comparability
UBS AG standalone financial statements are prepared in accordance with Swiss GAAP (the FINMA Accounting Ordinance, FINMA Circular 2020/1 “Accounting – banks” and the Banking Ordinance).
The accounting policies are principally the same as the IFRS-based accounting policies for the consolidated financial statements outlined in Note 1 to the consolidated financial statements of UBS AG included in the UBS Group AG and UBS AG Annual Report 2020. Major differences between the Swiss GAAP requirements and International Financial Reporting Standards are described in Note 35 to the consolidated financial statements of UBS AG. Further information on the accounting policies applied for the standalone financial statements of UBS AG is provided in Note 2 to the UBS AG standalone financial statements as of 31 December 2020.
In preparing the interim financial information for UBS AG, the same accounting policies and methods of computation have
been applied as in the annual standalone financial statements as of 31 December 2020.
This interim financial information is unaudited and should be read in conjunction with the audited 2020 standalone financial statements of UBS AG, available under “Holding company and significant regulated subsidiaries and sub-groups” under complementary financial information at ubs.com/investors.
In the fourth quarter of 2020, UBS decided not to proceed with the transfer of a portion of the Global Wealth Management business booked in Switzerland from UBS Switzerland AG to UBS AG. As a result of this decision, the beneficial ownership of that business was re-transferred from UBS AG to UBS Switzerland AG with effective date 31 December 2020. UBS AG’s share of the profits for the first six months of 2020 of USD 221 million (CHF 213 million) is reflected in Fee and commission income from securities and investment business and other fee and commission income.
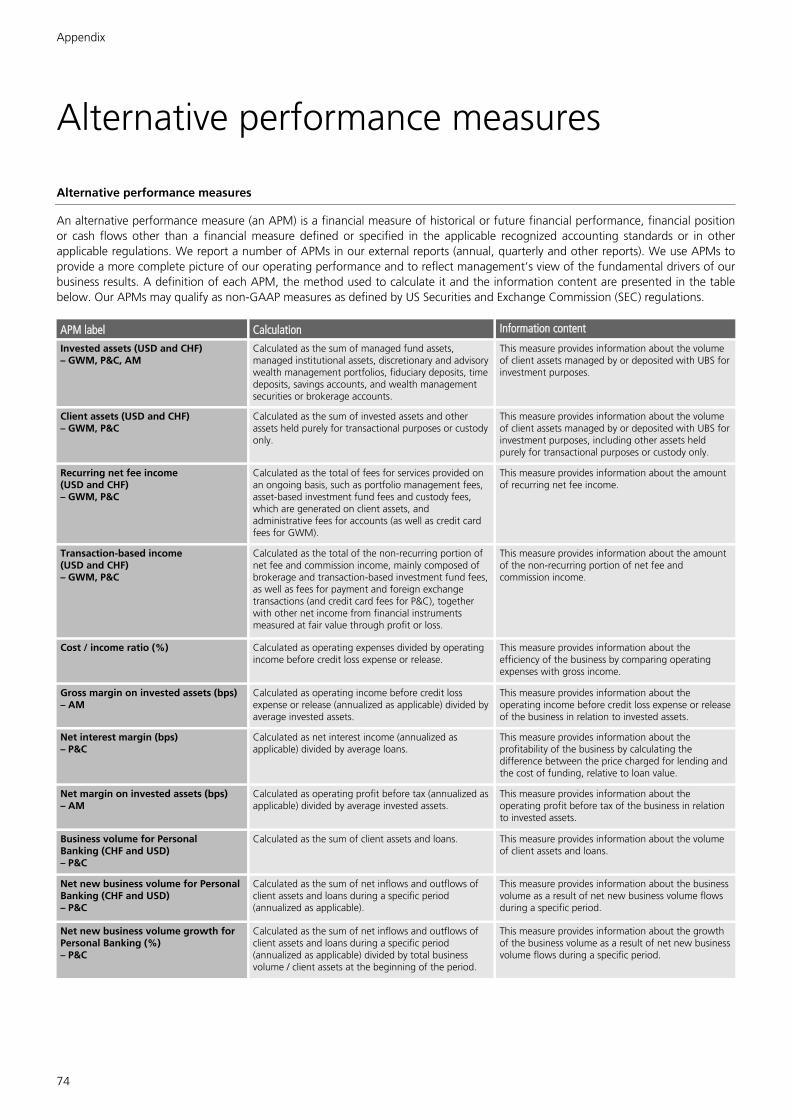
Appendix
74
Alternative performance measures
Alternative performance measures
An alternative performance measure (an APM) is a financial measure of historical or future financial performance, financial position or cash flows other than a financial measure defined or specified in the applicable recognized accounting standards or in other applicable regulations. We report a number of APMs in our external reports (annual, quarterly and other reports). We use APMs to provide a more complete picture of our operating performance and to reflect management’s view of the fundamental drivers of our business results. A definition of each APM, the method used to calculate it and the information content are presented in the table below. Our APMs may qualify as non-GAAP measures as defined by US Securities and Exchange Commission (SEC) regulations.
APM label Calculation Information content
Invested assets (USD and CHF)– GWM, P&C, AM
Calculated as the sum of managed fund assets, managed institutional assets, discretionary and advisory wealth management portfolios, fiduciary deposits, time deposits, savings accounts, and wealth management securities or brokerage accounts.
This measure provides information about the volume of client assets managed by or deposited with UBS for investment purposes.
Client assets (USD and CHF)– GWM, P&C
Calculated as the sum of invested assets and other assets held purely for transactional purposes or custody only.
This measure provides information about the volume of client assets managed by or deposited with UBS for investment purposes, including other assets held purely for transactional purposes or custody only.
Recurring net fee income(USD and CHF)– GWM, P&C
Calculated as the total of fees for services provided on an ongoing basis, such as portfolio management fees, asset-based investment fund fees and custody fees, which are generated on client assets, and administrative fees for accounts (as well as credit card fees for GWM).
This measure provides information about the amount of recurring net fee income.
Transaction-based income (USD and CHF)– GWM, P&C
Calculated as the total of the non-recurring portion of net fee and commission income, mainly composed of brokerage and transaction-based investment fund fees, as well as fees for payment and foreign exchange transactions (and credit card fees for P&C), together with other net income from financial instruments measured at fair value through profit or loss.
This measure provides information about the amount of the non-recurring portion of net fee and commission income.
Cost / income ratio (%) Calculated as operating expenses divided by operating income before credit loss expense or release.
This measure provides information about the efficiency of the business by comparing operating expenses with gross income.
Gross margin on invested assets (bps)– AM
Calculated as operating income before credit loss expense or release (annualized as applicable) divided by average invested assets.
This measure provides information about the operating income before credit loss expense or release of the business in relation to invested assets.
Net interest margin (bps)– P&C
Calculated as net interest income (annualized as applicable) divided by average loans.
This measure provides information about the profitability of the business by calculating the difference between the price charged for lending and the cost of funding, relative to loan value.
Net margin on invested assets (bps)– AM
Calculated as operating profit before tax (annualized as applicable) divided by average invested assets.
This measure provides information about the operating profit before tax of the business in relation to invested assets.
Business volume for Personal Banking (CHF and USD)– P&C
Calculated as the sum of client assets and loans. This measure provides information about the volume of client assets and loans.
Net new business volume for Personal Banking (CHF and USD)– P&C
Calculated as the sum of net inflows and outflows of client assets and loans during a specific period (annualized as applicable).
This measure provides information about the business volume as a result of net new business volume flows during a specific period.
Net new business volume growth for Personal Banking (%)– P&C
Calculated as the sum of net inflows and outflows of client assets and loans during a specific period (annualized as applicable) divided by total business volume / client assets at the beginning of the period.
This measure provides information about the growth of the business volume as a result of net new business volume flows during a specific period.
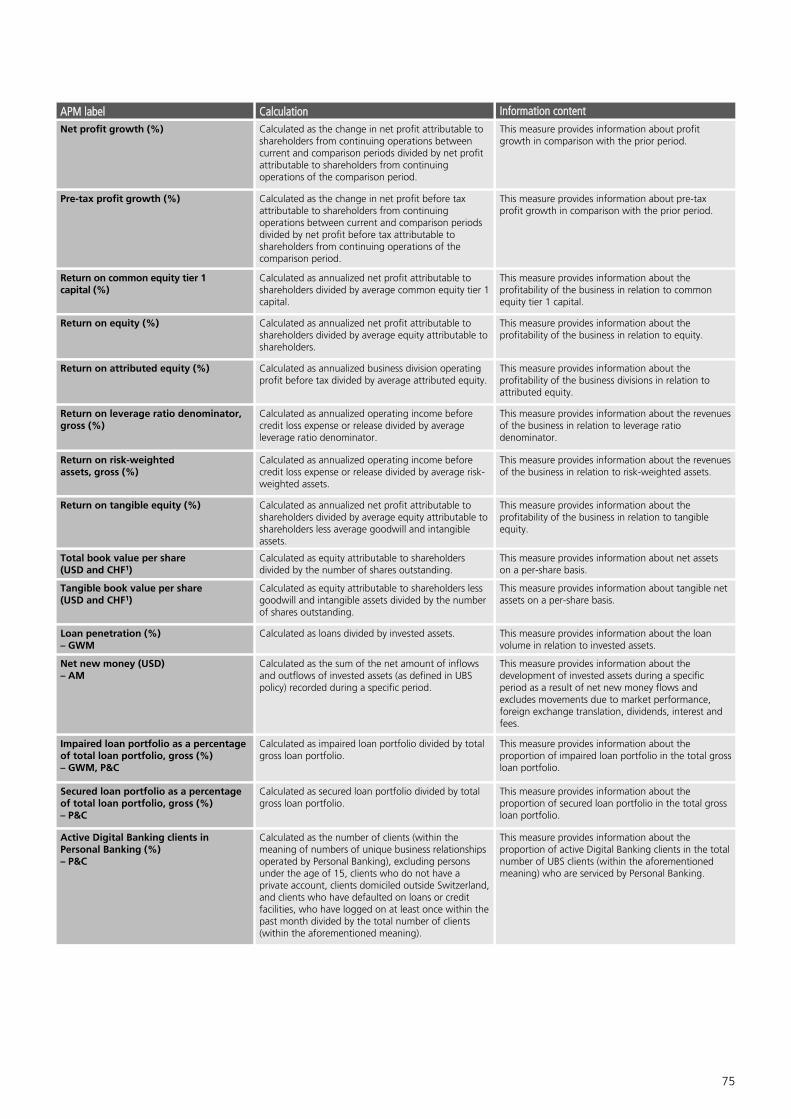
75
APM label Calculation Information contentNet profit growth (%) Calculated as the change in net profit attributable to
shareholders from continuing operations between current and comparison periods divided by net profit attributable to shareholders from continuing operations of the comparison period.
This measure provides information about profit growth in comparison with the prior period.
Pre-tax profit growth (%) Calculated as the change in net profit before tax attributable to shareholders from continuing operations between current and comparison periods divided by net profit before tax attributable to shareholders from continuing operations of the comparison period.
This measure provides information about pre-tax profit growth in comparison with the prior period.
Return on common equity tier 1 capital (%)
Calculated as annualized net profit attributable to shareholders divided by average common equity tier 1 capital.
This measure provides information about the profitability of the business in relation to common equity tier 1 capital.
Return on equity (%) Calculated as annualized net profit attributable to shareholders divided by average equity attributable to shareholders.
This measure provides information about the profitability of the business in relation to equity.
Return on attributed equity (%) Calculated as annualized business division operating profit before tax divided by average attributed equity.
This measure provides information about the profitability of the business divisions in relation to attributed equity.
Return on leverage ratio denominator, gross (%)
Calculated as annualized operating income before credit loss expense or release divided by average leverage ratio denominator.
This measure provides information about the revenues of the business in relation to leverage ratio denominator.
Return on risk-weighted assets, gross (%)
Calculated as annualized operating income before credit loss expense or release divided by average risk-weighted assets.
This measure provides information about the revenues of the business in relation to risk-weighted assets.
Return on tangible equity (%) Calculated as annualized net profit attributable to shareholders divided by average equity attributable to shareholders less average goodwill and intangible assets.
This measure provides information about the profitability of the business in relation to tangible equity.
Total book value per share (USD and CHF1)
Calculated as equity attributable to shareholders divided by the number of shares outstanding.
This measure provides information about net assets on a per-share basis.
Tangible book value per share(USD and CHF1)
Calculated as equity attributable to shareholders less goodwill and intangible assets divided by the number of shares outstanding.
This measure provides information about tangible net assets on a per-share basis.
Loan penetration (%)– GWM
Calculated as loans divided by invested assets. This measure provides information about the loan volume in relation to invested assets.
Net new money (USD)– AM
Calculated as the sum of the net amount of inflows and outflows of invested assets (as defined in UBS policy) recorded during a specific period.
This measure provides information about the development of invested assets during a specific period as a result of net new money flows and excludes movements due to market performance, foreign exchange translation, dividends, interest and fees.
Impaired loan portfolio as a percentage of total loan portfolio, gross (%)– GWM, P&C
Calculated as impaired loan portfolio divided by total gross loan portfolio.
This measure provides information about the proportion of impaired loan portfolio in the total gross loan portfolio.
Secured loan portfolio as a percentage of total loan portfolio, gross (%)– P&C
Calculated as secured loan portfolio divided by total gross loan portfolio.
This measure provides information about the proportion of secured loan portfolio in the total gross loan portfolio.
Active Digital Banking clients in Personal Banking (%)– P&C
Calculated as the number of clients (within the meaning of numbers of unique business relationships operated by Personal Banking), excluding persons under the age of 15, clients who do not have a private account, clients domiciled outside Switzerland, and clients who have defaulted on loans or credit facilities, who have logged on at least once within the past month divided by the total number of clients (within the aforementioned meaning).
This measure provides information about the proportion of active Digital Banking clients in the total number of UBS clients (within the aforementioned meaning) who are serviced by Personal Banking.
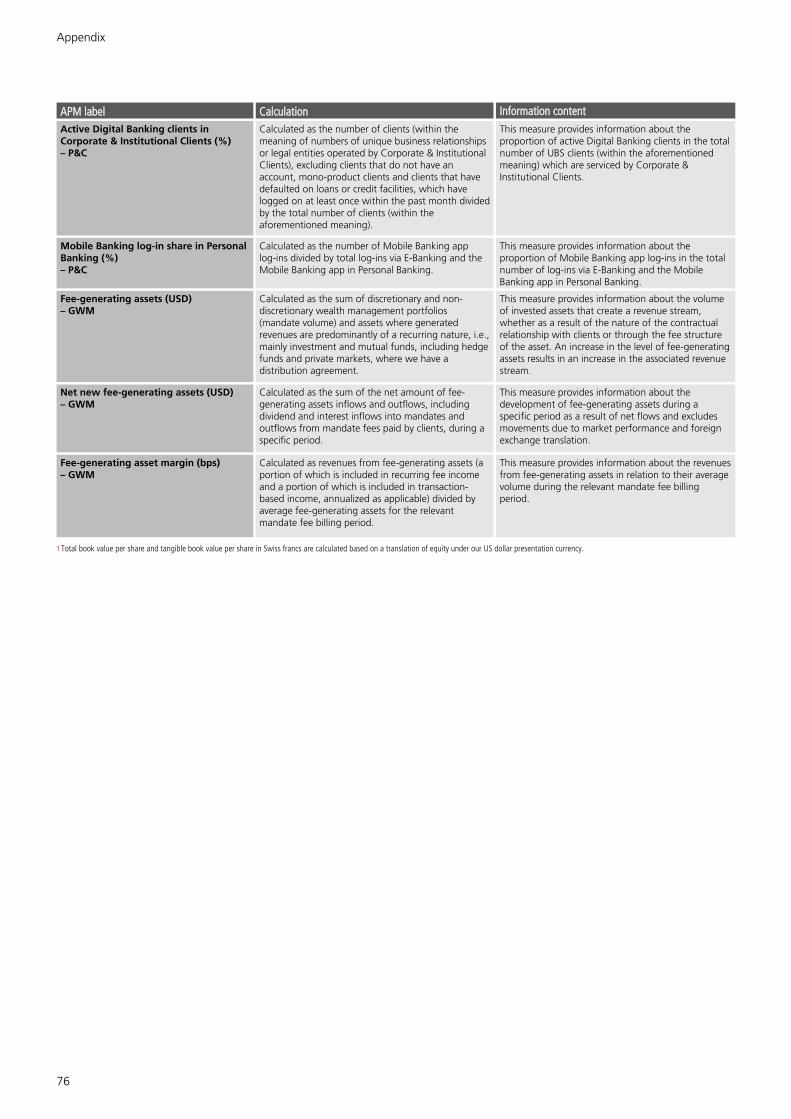
Appendix
76
APM label Calculation Information contentActive Digital Banking clients in Corporate & Institutional Clients (%)– P&C
Calculated as the number of clients (within the meaning of numbers of unique business relationships or legal entities operated by Corporate & Institutional Clients), excluding clients that do not have an account, mono-product clients and clients that have defaulted on loans or credit facilities, which have logged on at least once within the past month divided by the total number of clients (within the aforementioned meaning).
This measure provides information about the proportion of active Digital Banking clients in the total number of UBS clients (within the aforementioned meaning) which are serviced by Corporate & Institutional Clients.
Mobile Banking log-in share in Personal Banking (%)– P&C
Calculated as the number of Mobile Banking app log-ins divided by total log-ins via E-Banking and the Mobile Banking app in Personal Banking.
This measure provides information about the proportion of Mobile Banking app log-ins in the total number of log-ins via E-Banking and the Mobile Banking app in Personal Banking.
Fee-generating assets (USD)– GWM
Calculated as the sum of discretionary and non-discretionary wealth management portfolios (mandate volume) and assets where generated revenues are predominantly of a recurring nature, i.e., mainly investment and mutual funds, including hedge funds and private markets, where we have a distribution agreement.
This measure provides information about the volume of invested assets that create a revenue stream, whether as a result of the nature of the contractual relationship with clients or through the fee structure of the asset. An increase in the level of fee-generating assets results in an increase in the associated revenue stream.
Net new fee-generating assets (USD)– GWM
Calculated as the sum of the net amount of fee-generating assets inflows and outflows, including dividend and interest inflows into mandates and outflows from mandate fees paid by clients, during a specific period.
This measure provides information about the development of fee-generating assets during a specific period as a result of net flows and excludes movements due to market performance and foreign exchange translation.
Fee-generating asset margin (bps)– GWM
Calculated as revenues from fee-generating assets (a portion of which is included in recurring fee income and a portion of which is included in transaction-based income, annualized as applicable) divided by average fee-generating assets for the relevant mandate fee billing period.
This measure provides information about the revenues from fee-generating assets in relation to their average volume during the relevant mandate fee billing period.
1 Total book value per share and tangible book value per share in Swiss francs are calculated based on a translation of equity under our US dollar presentation currency.
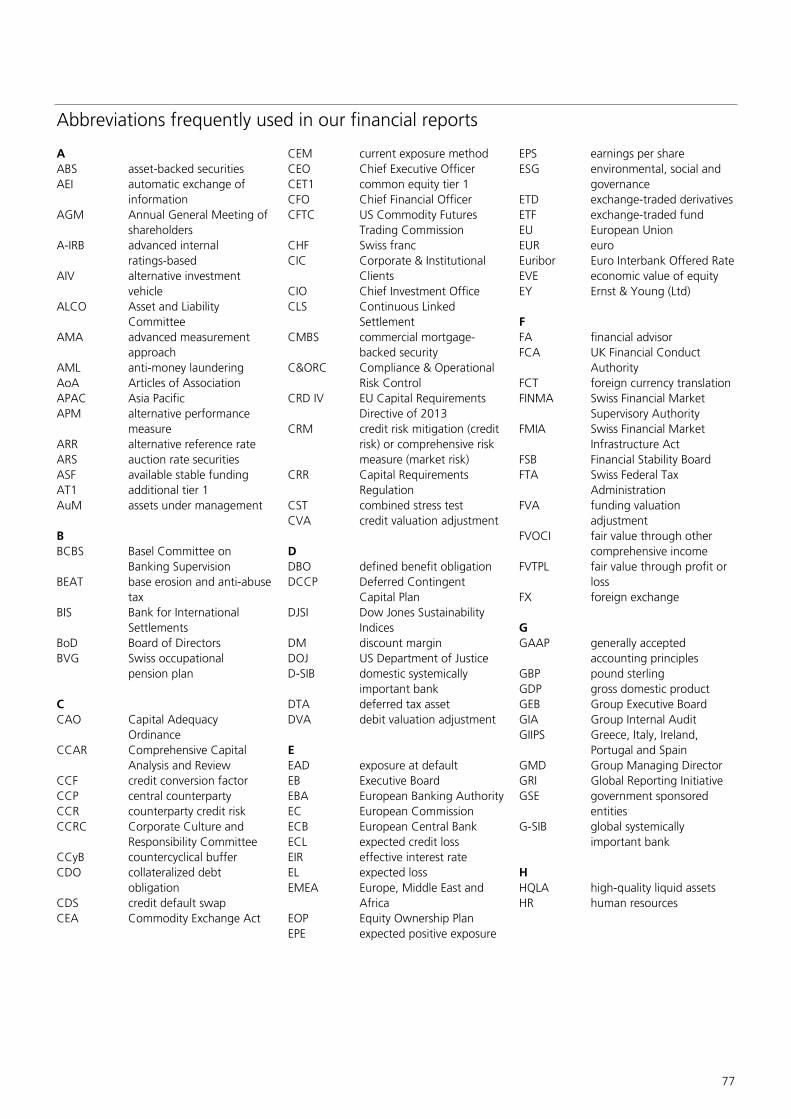
77
Abbreviations frequently used in our financial reports
AABS asset-backed securitiesAEI automatic exchange of
informationAGM Annual General Meeting of
shareholdersA-IRB advanced internal
ratings-basedAIV alternative investment
vehicleALCO Asset and Liability
CommitteeAMA advanced measurement
approachAML anti-money launderingAoA Articles of AssociationAPAC Asia PacificAPM alternative performance
measureARR alternative reference rateARS auction rate securitiesASF available stable fundingAT1 additional tier 1AuM assets under management
BBCBS Basel Committee on
Banking SupervisionBEAT base erosion and anti-abuse
taxBIS Bank for International
SettlementsBoD Board of DirectorsBVG Swiss occupational
pension plan
CCAO Capital Adequacy
OrdinanceCCAR Comprehensive Capital
Analysis and ReviewCCF credit conversion factorCCP central counterpartyCCR counterparty credit riskCCRC Corporate Culture and
Responsibility CommitteeCCyB countercyclical bufferCDO collateralized debt
obligationCDS credit default swapCEA Commodity Exchange Act
CEM current exposure methodCEO Chief Executive OfficerCET1 common equity tier 1CFO Chief Financial OfficerCFTC US Commodity Futures
Trading CommissionCHF Swiss francCIC Corporate & Institutional
ClientsCIO Chief Investment OfficeCLS Continuous Linked
SettlementCMBS commercial mortgage-
backed securityC&ORC Compliance & Operational
Risk ControlCRD IV EU Capital Requirements
Directive of 2013CRM credit risk mitigation (credit
risk) or comprehensive risk measure (market risk)
CRR Capital Requirements Regulation
CST combined stress testCVA credit valuation adjustment
DDBO defined benefit obligationDCCP Deferred Contingent
Capital Plan DJSI Dow Jones Sustainability
Indices DM discount marginDOJ US Department of JusticeD-SIB domestic systemically
important bankDTA deferred tax assetDVA debit valuation adjustment
EEAD exposure at defaultEB Executive BoardEBA European Banking AuthorityEC European CommissionECB European Central BankECL expected credit lossEIR effective interest rateEL expected lossEMEA Europe, Middle East and
AfricaEOP Equity Ownership PlanEPE expected positive exposure
EPS earnings per shareESG environmental, social and
governanceETD exchange-traded derivativesETF exchange-traded fundEU European UnionEUR euroEuribor Euro Interbank Offered RateEVE economic value of equityEY Ernst & Young (Ltd)
FFA financial advisorFCA UK Financial Conduct
AuthorityFCT foreign currency translationFINMA Swiss Financial Market
Supervisory AuthorityFMIA Swiss Financial Market
Infrastructure ActFSB Financial Stability BoardFTA Swiss Federal Tax
AdministrationFVA funding valuation
adjustmentFVOCI fair value through other
comprehensive incomeFVTPL fair value through profit or
lossFX foreign exchange
GGAAP generally accepted
accounting principlesGBP pound sterlingGDP gross domestic productGEB Group Executive BoardGIA Group Internal AuditGIIPS Greece, Italy, Ireland,
Portugal and Spain GMD Group Managing DirectorGRI Global Reporting InitiativeGSE government sponsored
entitiesG-SIB global systemically
important bank
HHQLA high-quality liquid assetsHR human resources

Appendix
78
Abbreviations frequently used in our financial reports (continued)
IIAA internal assessment
approachIAS International Accounting
StandardsIASB International Accounting
Standards BoardIBOR Interbank Offered RateIFRIC International Financial
Reporting Interpretations Committee
IFRS International Financial Reporting Standards
IHC intermediate holding company
IMA internal models approachIMM internal model methodIRB internal ratings-basedIRC incremental risk chargeIRRBB interest rate risk in the
banking bookISDA International Swaps and
Derivatives Association
KKRT Key Risk Taker
LLAS liquidity-adjusted stressLCR liquidity coverage ratioLGD loss given defaultLIBOR London Interbank Offered
RateLLC limited liability companyLRD leverage ratio denominatorLTIP Long-Term Incentive PlanLTV loan-to-value
MM&A mergers and acquisitionsMiFID II Markets in Financial
Instruments Directive IIMRT Material Risk Taker
NNAV net asset valueNCL Non-core and Legacy
Portfolio
NII net interest incomeNRV negative replacement valueNSFR net stable funding ratioNYSE New York Stock Exchange
OOCA own credit adjustmentOCI other comprehensive
incomeOTC over-the-counter
PPD probability of defaultPFE potential future exposurePIT point in timeP&L profit or lossPOCI purchased or originated
credit-impairedPRA UK Prudential Regulation
Authority PRV positive replacement value
QQCCP qualifying central
counterpartyQRRE qualifying revolving retail
exposures
RRBA role-based allowancesRBC risk-based capitalRbM risk-based monitoringRMBS residential mortgage-
backed securitiesRniV risks not in VaRRoAE return on attributed equityRoCET1 return on CET1 capitalRoTE return on tangible equityRoU right-of-useRV replacement valueRW risk weightRWA risk-weighted assets
SSA standardized approachSA-CCR standardized approach for
counterparty credit risk
SAR stock appreciation right or Special Administrative Region
SBC Swiss Bank CorporationSDG Sustainable Development
GoalSE structured entitySEC US Securities and Exchange
CommissionSEEOP Senior Executive Equity
Ownership Plan SFT securities financing
transactionSI sustainable investingSICR significant increase in credit
riskSIX SIX Swiss ExchangeSME small and medium-sized
entitySMF Senior Management
FunctionSNB Swiss National BankSPPI solely payments of principal
and interestSRB systemically relevant bankSRM specific risk measureSVaR stressed value-at-risk
TTBTF too big to failTCJA US Tax Cuts and Jobs ActTLAC total loss-absorbing capacityTTC through-the-cycle
UUBS RESI UBS Real Estate Securities
Inc.UoM units of measure USD US dollar
VVaR value-at-riskVAT value added tax
WWEKO Swiss Competition
Commission
This is a general list of the abbreviations frequently used in our financial reporting. Not all of the listed abbreviations may appear in this particular report.

79
Information sources
Reporting publications
Annual publicationsAnnual Report (SAP No. 80531): Published in English, this single-volume report provides descriptions of: our Group strategy and performance; the strategy and performance of the business divisions and Group Functions; risk, treasury and capital management; corporate governance, corporate responsibility and our compensation framework, including information about compensation for the Board of Directors and the Group Executive Board members; and financial information, including the financial statements. Geschäftsbericht (SAP No. 80531): This publication provides a German translation of selected sections of our Annual Report. Annual Review (SAP No. 80530): This booklet contains key information about our strategy and performance, with a focus on corporate responsibility at UBS. It is published in English, German, French and Italian. Compensation Report (SAP No. 82307): This report discusses our compensation framework and provides information about compensation for the Board of Directors and the Group Executive Board members. It is available in English and German.
Quarterly publications The quarterly financial report provides an update on our strategy and performance for the respective quarter. It is available in English.
How to order publicationsThe annual and quarterly publications are available in .pdf format at ubs.com/investors, under “Financial information,” and printed copies can be requested from UBS free of charge. For annual publications, refer to the “Investor services” section at ubs.com/investors. Alternatively, they can be ordered by quoting the SAP number and the language preference, where applicable, from UBS AG, F4UK–AUL, P.O. Box, CH-8098 Zurich, Switzerland.
Other information
WebsiteThe “Investor Relations” website at ubs.com/investors provides the following information about UBS: news releases; financial information, including results-related filings with the US Securities and Exchange Commission; information for shareholders, including UBS share price charts, as well as data and dividend information, and for bondholders; the UBS corporate calendar; and presentations by management for investors and financial analysts. Information is available online in English, with some information also available in German.
Results presentationsOur quarterly results presentations are webcast live. Recordings of most presentations can be downloaded from ubs.com/presentations.
Messaging serviceEmail alerts to news about UBS can be subscribed for under “UBS News Alert” at ubs.com/global/en/investor-relations/contact/investor-services.html. Messages are sent in English, German, French or Italian, with an option to select theme preferences for such alerts.
Form 20-F and other submissions to the US Securities and Exchange CommissionWe file periodic reports and submit other information about UBS to the US Securities and Exchange Commission (the SEC). Principal among these filings is the annual report on Form 20-F, filed pursuant to the US Securities Exchange Act of 1934. The filing of Form 20-F is structured as a wrap-around document. Most sections of the filing can be satisfied by referring to the combined UBS Group AG and UBS AG annual report. However, there is a small amount of additional information in Form 20-F that is not presented elsewhere and is particularly targeted at readers in the US. Readers are encouraged to refer to this additional disclosure. Any document that we file with the SEC is available on the SEC’s website: sec.gov. Refer to ubs.com/investors for more information.

Appendix
80
Cautionary Statement Regarding Forward-Looking Statements | This report contains statements that constitute “forward-looking statements,” including but not limited to management’s outlook for UBS’s financial performance, statements relating to the anticipated effect of transactions and strategic initiatives on UBS’s business and future development and goals or intentions to achieve climate, sustainability and other social objectives. While these forward-looking statements represent UBS’s judgments, expectations and objectives concerning the matters described, a number of risks, uncertainties and other important factors could cause actual developments and results to differ materially from UBS’s expectations. The outbreak of COVID-19 and the measures taken in response to the pandemic have had and may continue to have a significant adverse effect on global economic activity, and an adverse effect on the credit profile of some of our clients and other market participants, which has resulted in and may continue to increase credit loss expense and credit impairments. In addition, we face heightened operational risks due to remote working arrangements, including risks to supervisory and surveillance controls, as well as increased fraud and data security risks. The unprecedented scale of the measures taken to respond to the pandemic as well as the uncertainty surrounding vaccine supply, distribution, and efficacy against mutated virus strains create significantly greater uncertainty about forward-looking statements. Factors that may affect our performance and ability to achieve our plans, outlook and other objectives also include, but are not limited to: (i) the degree to which UBS is successful in the ongoing execution of its strategic plans, including its cost reduction and efficiency initiatives and its ability to manage its levels of risk-weighted assets (RWA) and leverage ratio denominator (LRD), liquidity coverage ratio and other financial resources, including changes in RWA assets and liabilities arising from higher market volatility; (ii) the degree to which UBS is successful in implementing changes to its businesses to meet changing market, regulatory and other conditions; (iii) the continuing low or negative interest rate environment in Switzerland and other jurisdictions; (iv) developments (including as a result of the COVID-19 pandemic) in the macroeconomic climate and in the markets in which UBS operates or to which it is exposed, including movements in securities prices or liquidity, credit spreads, and currency exchange rates, and the effects of economic conditions, market developments, and geopolitical tensions, and changes to national trade policies on the financial position or creditworthiness of UBS’s clients and counterparties as well as on client sentiment and levels of activity; (v) changes in the availability of capital and funding, including any changes in UBS’s credit spreads and ratings, as well as availability and cost of funding to meet requirements for debt eligible for total loss-absorbing capacity (TLAC); (vi) changes in or the implementation of financial legislation and regulation in Switzerland, the US, the UK, the European Union and other financial centers that have imposed, or resulted in, or may do so in the future, more stringent or entity-specific capital, TLAC, leverage ratio, net stable funding ratio, liquidity and funding requirements, heightened operational resilience requirements, incremental tax requirements, additional levies, limitations on permitted activities, constraints on remuneration, constraints on transfers of capital and liquidity and sharing of operational costs across the Group or other measures, and the effect these will or would have on UBS’s business activities; (vii) UBS’s ability to successfully implement resolvability and related regulatory requirements and the potential need to make further changes to the legal structure or booking model of UBS Group in response to legal and regulatory requirements, proposals in Switzerland and other jurisdictions for mandatory structural reform of banks or systemically important institutions or to other external developments; (viii) UBS’s ability to maintain and improve its systems and controls for the detection and prevention of money laundering and compliance with sanctions to meet evolving regulatory requirements and expectations, in particular in the US; (ix) the uncertainty arising from the UK’s exit from the EU; (x) changes in UBS’s competitive position, including whether differences in regulatory capital and other requirements among the major financial centers will adversely affect UBS’s ability to compete in certain lines of business; (xi) changes in the standards of conduct applicable to our businesses that may result from new regulations or new enforcement of existing standards, including measures to impose new and enhanced duties when interacting with customers and in the execution and handling of customer transactions; (xii) the liability to which UBS may be exposed, or possible constraints or sanctions that regulatory authorities might impose on UBS, due to litigation, contractual claims and regulatory investigations, including the potential for disqualification from certain businesses, potentially large fines or monetary penalties, or the loss of licenses or privileges as a result of regulatory or other governmental sanctions, as well as the effect that litigation, regulatory and similar matters have on the operational risk component of our RWA as well as the amount of capital available for return to shareholders; (xiii) the effects on UBS’s cross-border banking business of tax or regulatory developments and of possible changes in UBS’s policies and practices relating to this business; (xiv) UBS’s ability to retain and attract the employees necessary to generate revenues and to manage, support and control its businesses, which may be affected by competitive factors; (xv) changes in accounting or tax standards or policies, and determinations or interpretations affecting the recognition of gain or loss, the valuation of goodwill, the recognition of deferred tax assets and other matters; (xvi) UBS’s ability to implement new technologies and business methods, including digital services and technologies, and ability to successfully compete with both existing and new financial service providers, some of which may not be regulated to the same extent; (xvii) limitations on the effectiveness of UBS’s internal processes for risk management, risk control, measurement and modeling, and of financial models generally; (xviii) the occurrence of operational failures, such as fraud, misconduct, unauthorized trading, financial crime, cyberattacks and systems failures, the risk of which is increased while COVID-19 control measures require large portions of the staff of both UBS and its service providers to work remotely; (xix) restrictions on the ability of UBS Group AG to make payments or distributions, including due to restrictions on the ability of its subsidiaries to make loans or distributions, directly or indirectly, or, in the case of financial difficulties, due to the exercise by FINMA or the regulators of UBS’s operations in other countries of their broad statutory powers in relation to protective measures, restructuring and liquidation proceedings; (xx) the degree to which changes in regulation, capital or legal structure, financial results or other factors may affect UBS’s ability to maintain its stated capital return objective; (xxi) uncertainty over the scope of actions that may be required by UBS, governments and others to achieve goals relating to climate, environmental and social matters as well as the evolving nature of underlying science and industry and governmental standards; and (xxii) the effect that these or other factors or unanticipated events may have on our reputation and the additional consequences that this may have on our business and performance. The sequence in which the factors above are presented is not indicative of their likelihood of occurrence or the potential magnitude of their consequences. Our business and financial performance could be affected by other factors identified in our past and future filings and reports, including those filed with the SEC. More detailed information about those factors is set forth in documents furnished by UBS and filings made by UBS with the SEC, including UBS’s Annual Report on Form 20-F for the year ended 31 December 2020 and UBS’s First Quarter 2021 Report on Form 6K. UBS is not under any obligation to (and expressly disclaims any obligation to) update or alter its forward-looking statements, whether as a result of new information, future events, or otherwise.
Rounding | Numbers presented throughout this report may not add up precisely to the totals provided in the tables and text. Percentages and percent changes disclosed in text and tables are calculated on the basis of unrounded figures. Absolute changes between reporting periods disclosed in the text, which can be derived from numbers presented in related tables, are calculated on a rounded basis.
Tables | Within tables, blank fields generally indicate non-applicability or that presentation of any content would not be meaningful, or that information is not available as of the relevant date or for the relevant period. Zero values generally indicate that the respective figure is zero on an actual or rounded basis. Values that are zero on a rounded basis can be either negative or positive on an actual basis.


