21
Eurobrand Challenge Team Captain Crunch Chen Hou / House Zhang / Rudy Tjong / Samuel Sutanto / Yvonne Baker
| Date post: | 21-Jul-2015 |
| Category: |
Documents |
| Upload: | samuel-sutanto |
| View: | 88 times |
| Download: | 0 times |
Eurobrand Challenge
Team Captain Crunch
Chen Hou / House Zhang / Rudy Tjong / Samuel Sutanto / Yvonne Baker
Background
100 years old company
Over $9 Billion of Sales Worldwide
European Industry Structure
Compound Annual Growth Rate (CAGR):
3.50% in the past 5 years
Ready to eat segment is the most
lucrative: 87% of total market overall
UC European Operations
More than 50 years (since 1952)
UC established national subsidiaries, led
by Country Manager (CM) – ‘Mini UC’
Customer Oriented
UC owns 20% of the European market:
$1.8 Billion
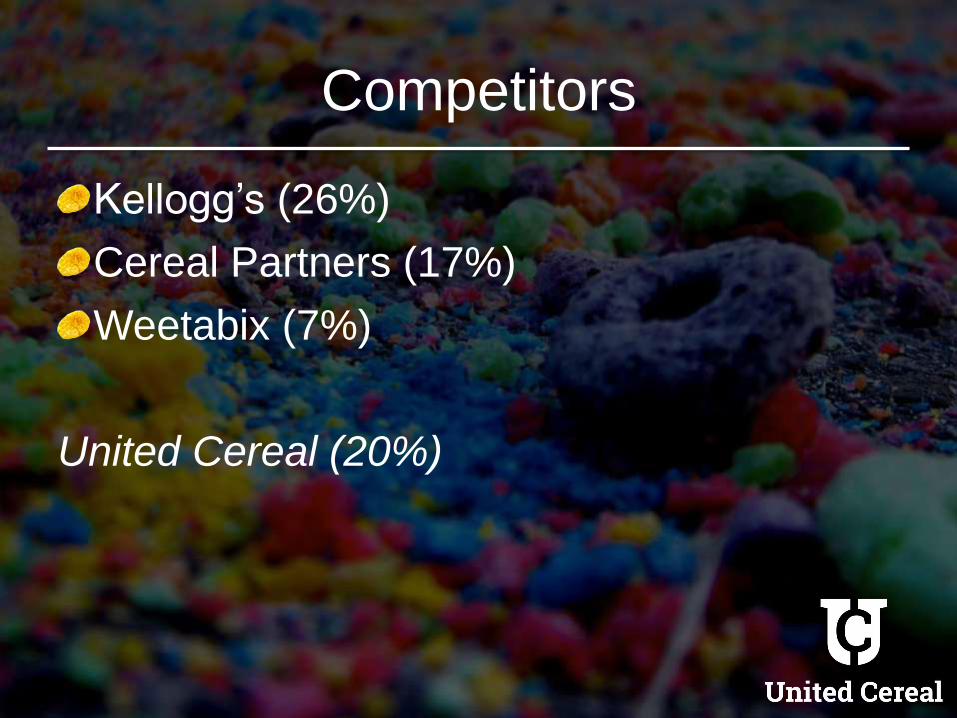
Competitors
Kellogg’s (26%)
Cereal Partners (17%)
Weetabix (7%)
United Cereal (20%)
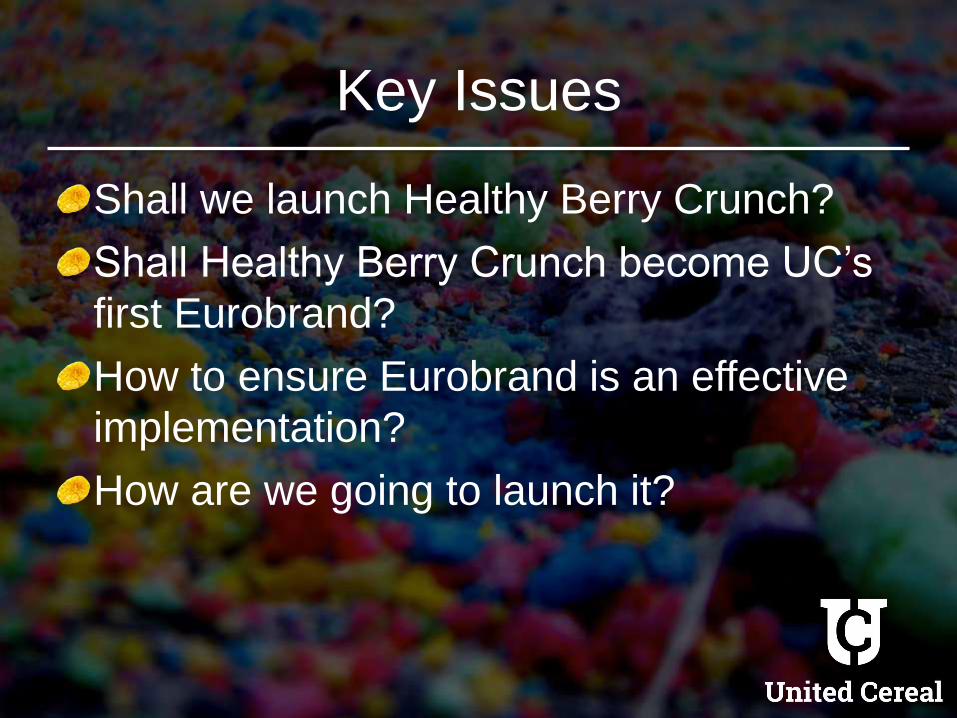
Key Issues
Shall we launch Healthy Berry Crunch?
Shall Healthy Berry Crunch become UC’s
first Eurobrand?
How to ensure Eurobrand is an effective
implementation?
How are we going to launch it?
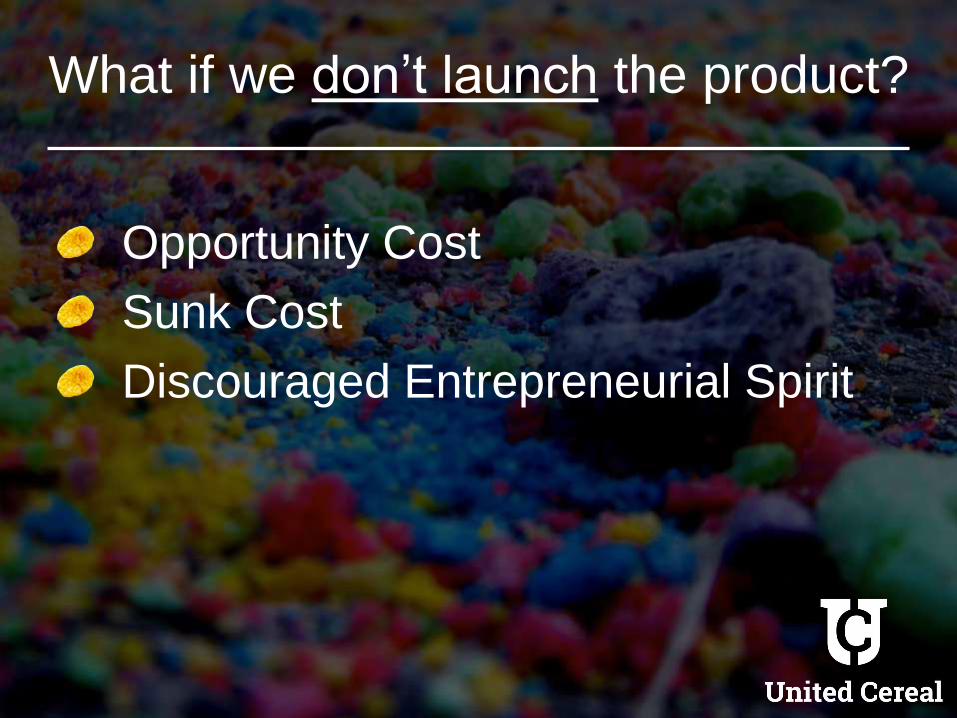
What if we don’t launch the product?
Opportunity Cost
Sunk Cost
Discouraged Entrepreneurial Spirit
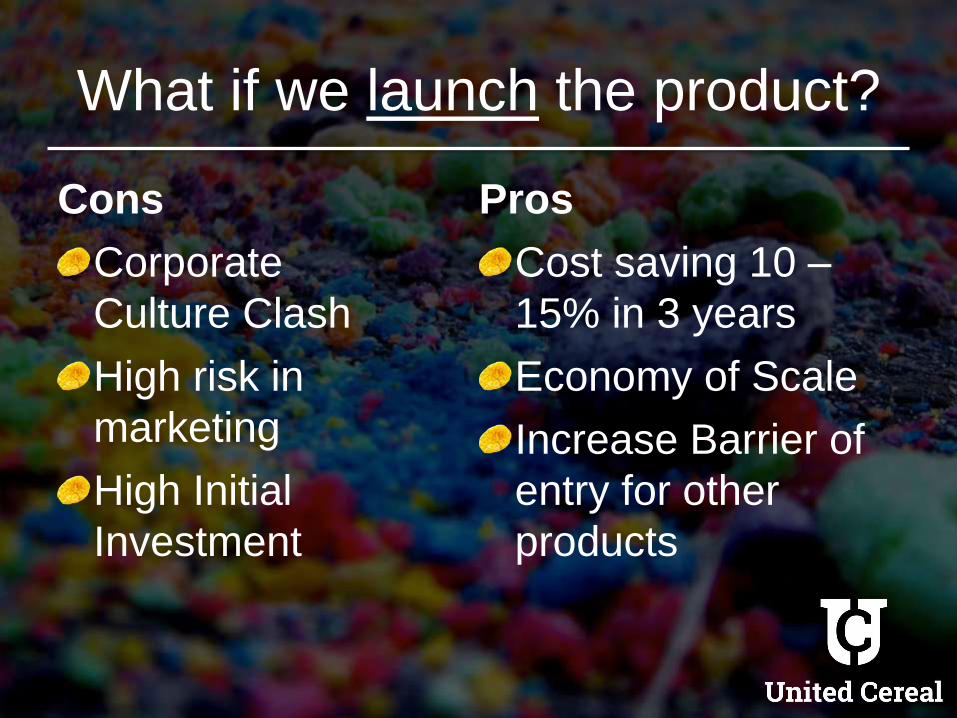
What if we launch the product?
Cons
Corporate
Culture Clash
High risk in
marketing
High Initial
Investment
Pros
Cost saving 10 –
15% in 3 years
Economy of Scale
Increase Barrier of
entry for other
products
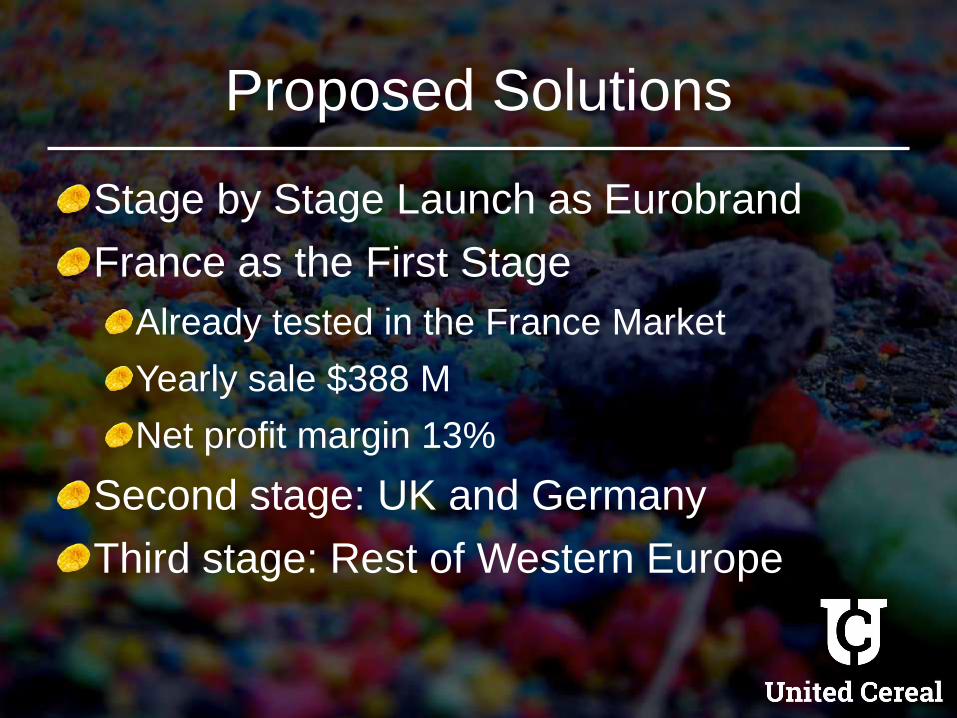
Proposed Solutions
Stage by Stage Launch as Eurobrand
France as the First Stage
Already tested in the France Market
Yearly sale $388 M
Net profit margin 13%
Second stage: UK and Germany
Third stage: Rest of Western Europe
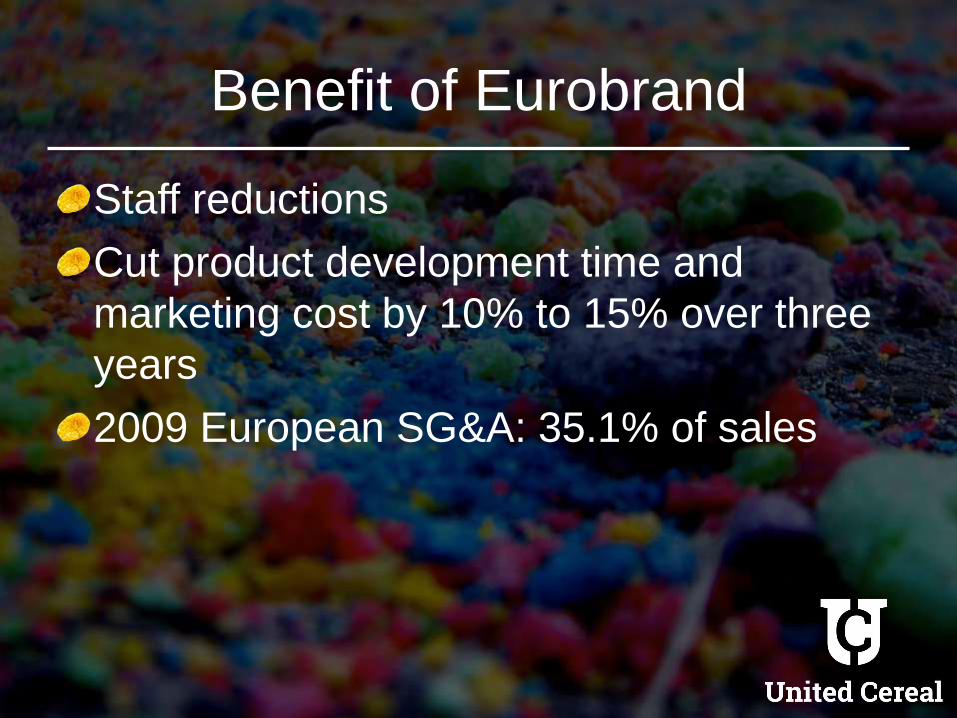
Benefit of Eurobrand
Staff reductions
Cut product development time and
marketing cost by 10% to 15% over three
years
2009 European SG&A: 35.1% of sales
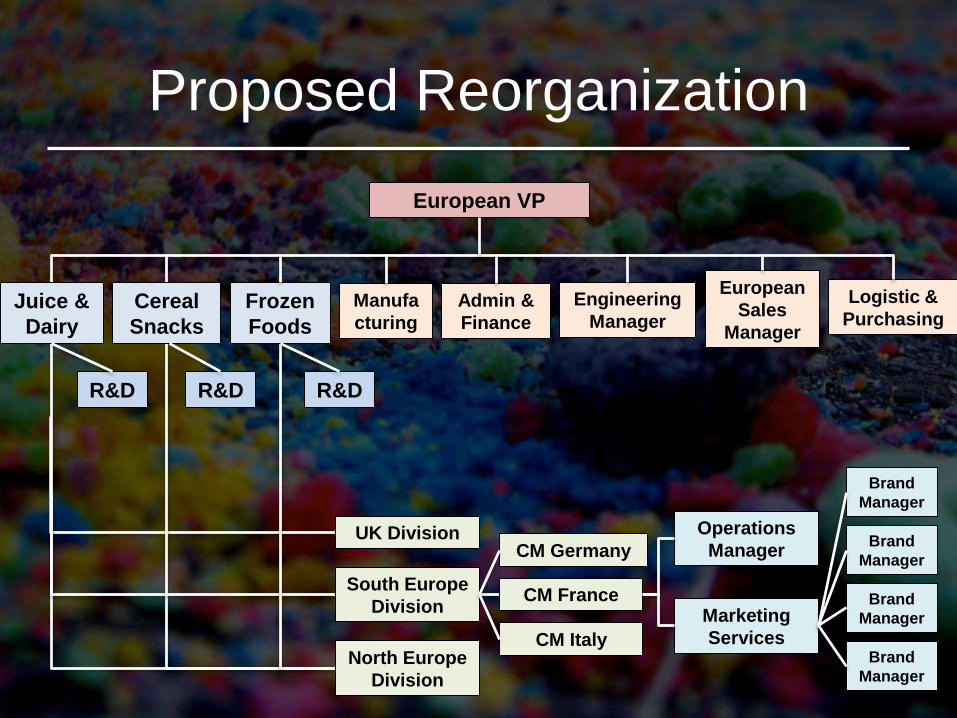
Proposed Reorganization
European VP
Admin &
Finance
Engineering
Manager
European
Sales
Manager
R&D
Manufa
cturing
Marketing
Services
Logistic &
Purchasing
Brand
Manager
Brand
Manager
Brand
Manager
Brand
Manager
Operations
ManagerUK Division
South Europe
Division
North Europe
Division
CM France
CM Germany
CM Italy
Juice &
Dairy
Cereal
Snacks
Frozen
Foods
R&D R&D
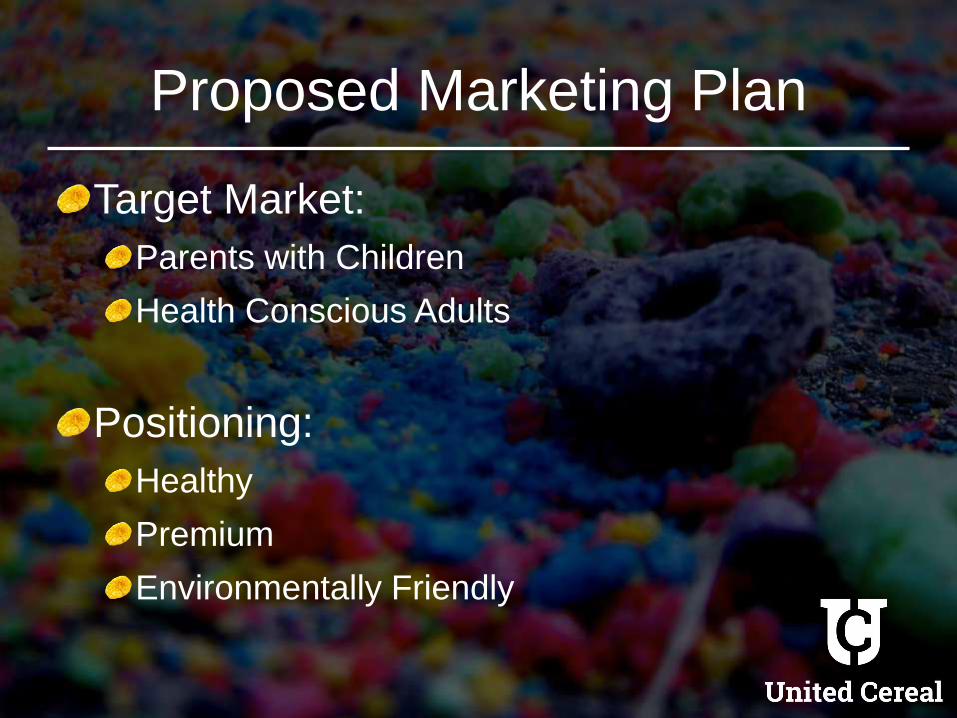
Proposed Marketing Plan
Target Market:
Parents with Children
Health Conscious Adults
Positioning:
Healthy
Premium
Environmentally Friendly
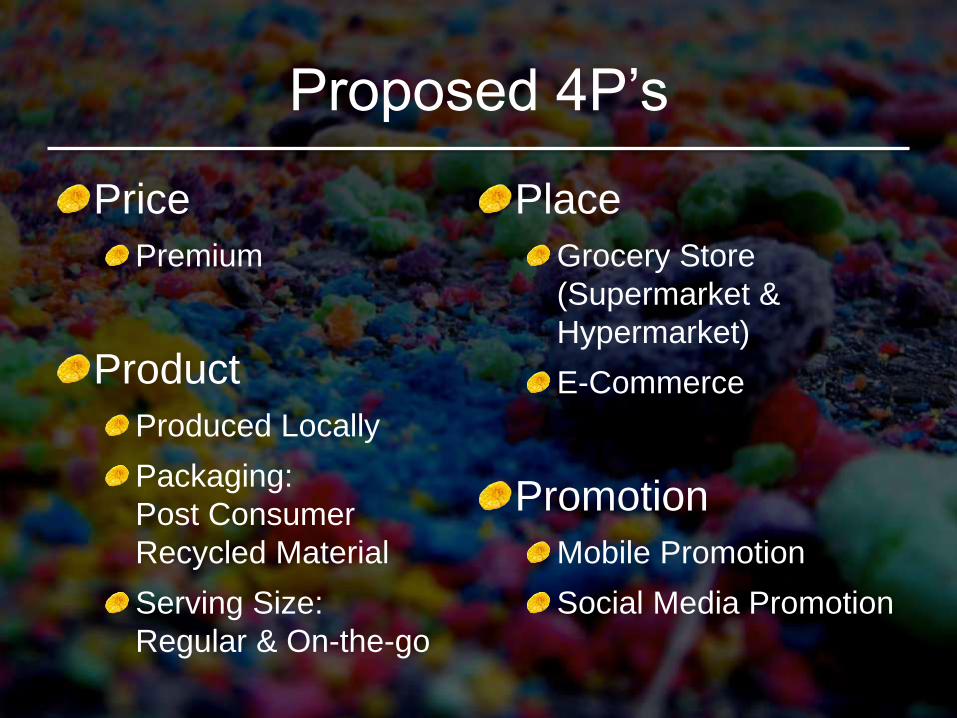
Proposed 4P’s
Price
Premium
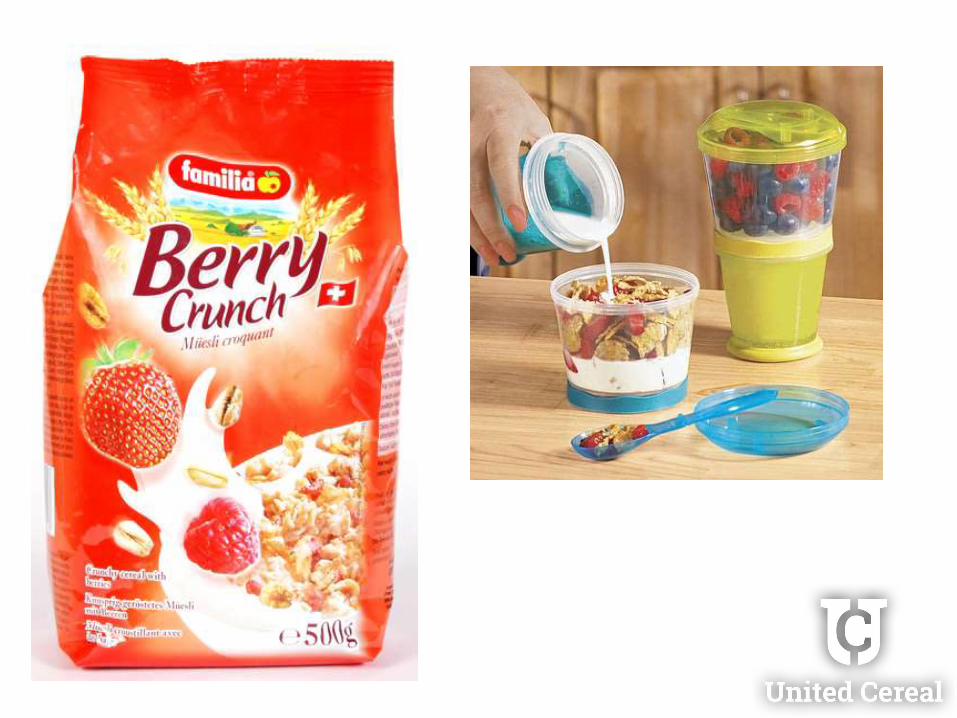
Product
Produced Locally
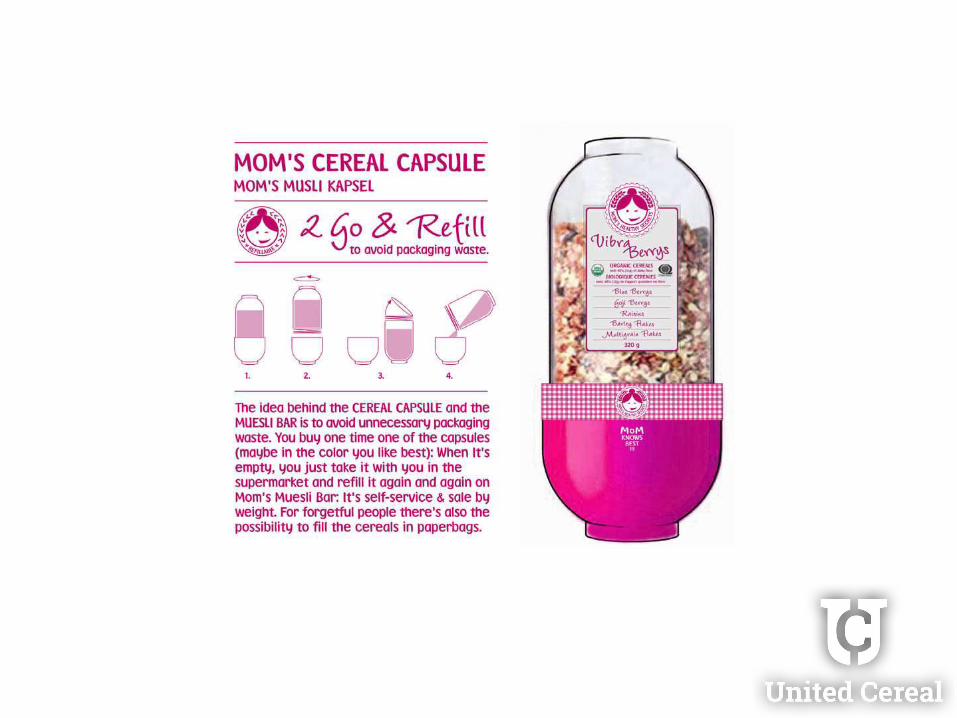
Packaging:
Post Consumer
Recycled Material
Serving Size:
Regular & On-the-go
Place
Grocery Store
(Supermarket &
Hypermarket)
E-Commerce
Promotion
Mobile Promotion
Social Media Promotion
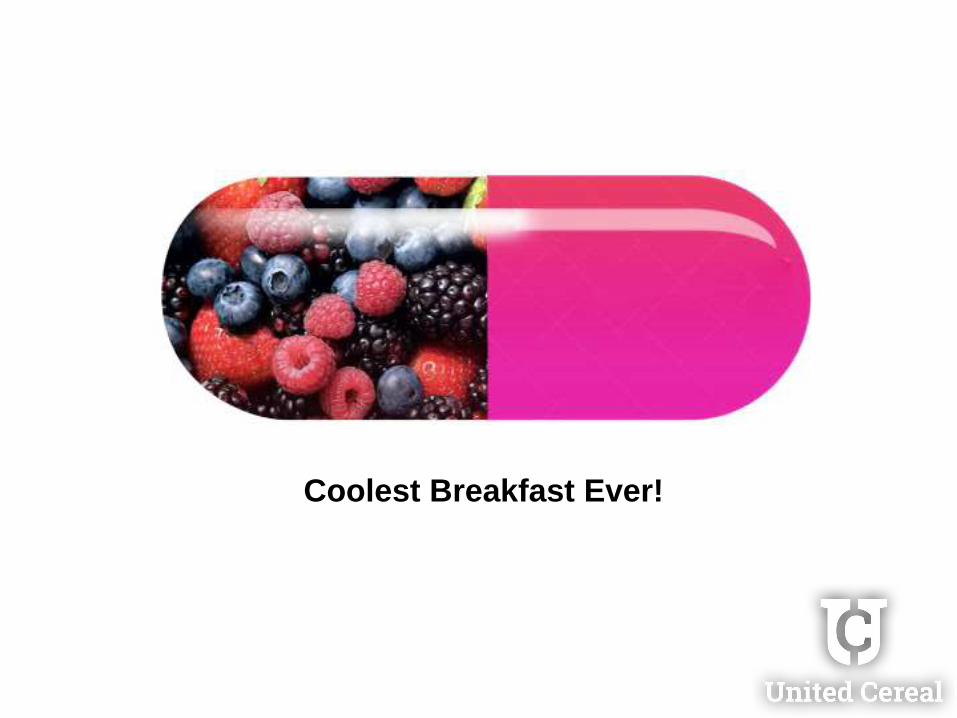
Coolest Breakfast Ever!
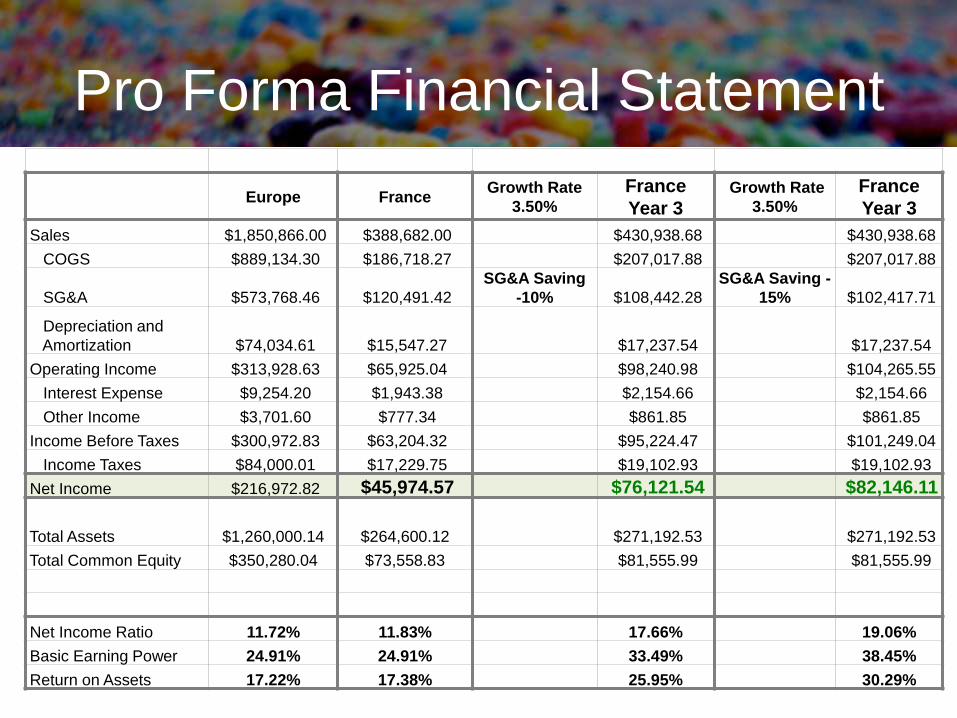
Pro Forma Financial Statement
Europe FranceGrowth Rate
3.50%
France
Year 3Growth Rate
3.50%
France
Year 3
Sales $1,850,866.00 $388,682.00 $430,938.68 $430,938.68
COGS $889,134.30 $186,718.27 $207,017.88 $207,017.88
SG&A $573,768.46 $120,491.42
SG&A Saving
-10% $108,442.28
SG&A Saving -
15% $102,417.71
Depreciation and
Amortization $74,034.61 $15,547.27 $17,237.54 $17,237.54
Operating Income $313,928.63 $65,925.04 $98,240.98 $104,265.55
Interest Expense $9,254.20 $1,943.38 $2,154.66 $2,154.66
Other Income $3,701.60 $777.34 $861.85 $861.85
Income Before Taxes $300,972.83 $63,204.32 $95,224.47 $101,249.04
Income Taxes $84,000.01 $17,229.75 $19,102.93 $19,102.93
Net Income $216,972.82 $45,974.57 $76,121.54 $82,146.11
Total Assets $1,260,000.14 $264,600.12 $271,192.53 $271,192.53
Total Common Equity $350,280.04 $73,558.83 $81,555.99 $81,555.99
Net Income Ratio 11.72% 11.83% 17.66% 19.06%
Basic Earning Power 24.91% 24.91% 33.49% 38.45%
Return on Assets 17.22% 17.38% 25.95% 30.29%
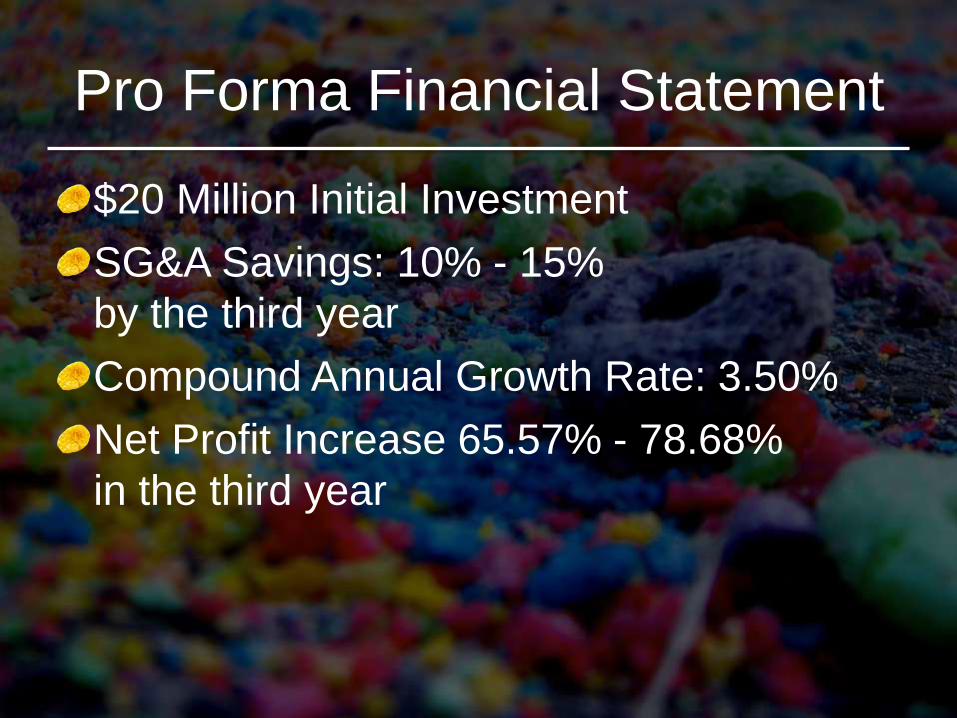
Pro Forma Financial Statement
$20 Million Initial Investment
SG&A Savings: 10% - 15%
by the third year
Compound Annual Growth Rate: 3.50%
Net Profit Increase 65.57% - 78.68%
in the third year
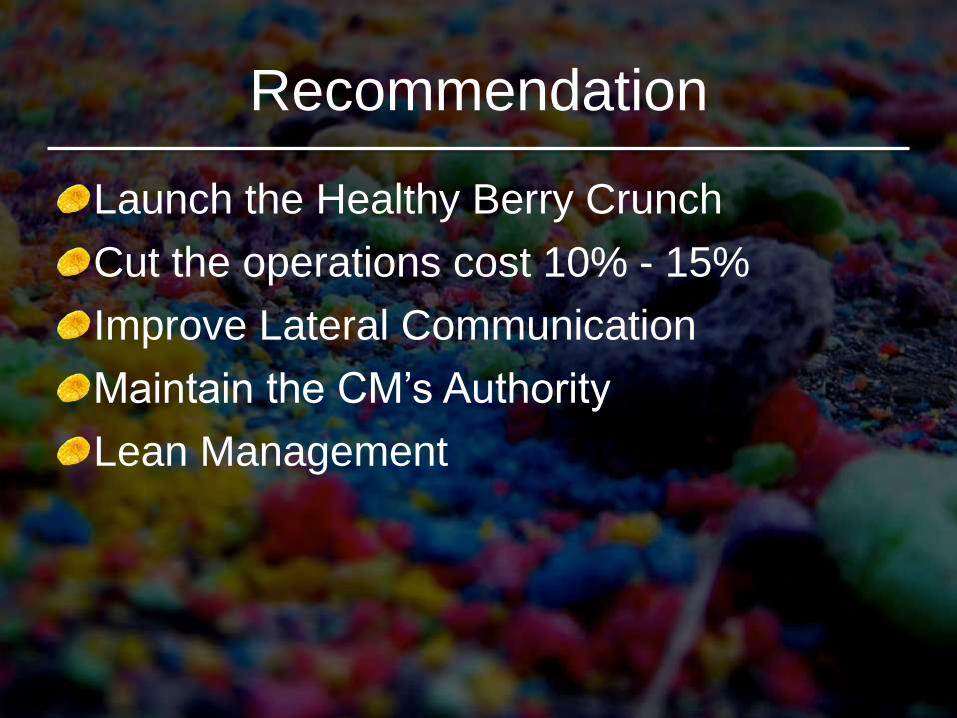
Recommendation
Launch the Healthy Berry Crunch
Cut the operations cost 10% - 15%
Improve Lateral Communication
Maintain the CM’s Authority
Lean Management
Thank You Berry Much!
Team Captain Crunch