VOLUME 14 - ISSUE 2 - DECEMBER, 2012 SCIENTIFIC JOURNAL OF SPORT AND PHYSICAL EDUCATION UDC 796.011 FACULTY OF SPORT AND PHYSICAL EDUCATION UNIVERSITY OF SARAJEVO FACULTY OF SPORT AND PHYSICAL EDUCATION UNIVERSITY OF SARAJEVO
Transcript
VOLUME 14 - ISSUE 2 - DECEMBER, 2012
SCIENTIFIC JOURNAL OF SPORT AND PHYSICAL EDUCATION
UDC 796.011
FACULTY OF SPORT ANDPHYSICAL EDUCATIONUNIVERSITY OF SARAJEVO
FACULTY OF SPORT ANDPHYSICAL EDUCATIONUNIVERSITY OF SARAJEVO
FACULTY OF SPORT ANDPHYSICAL EDUCATIONUNIVERSITY OF SARAJEVO
Saša KrstulovićPREDICTORS OF JUDO PERFORMANCE IN MALE ATHLETES
Džubur Amela, Džubur Alen, Hasanbegović Ilvana and Pepić EsadRELATIONSHIP BETWEEN QUALITY OF LIFE AND PHYSICAL ACTIVITIES IN RELATION TO THE TOBACCO SMOKING HABITS
Munir Talović, Eldin Jelešković and Haris AlićMORPHOLOGICAL PROFILE OF FOOTBALL PLAYERS IN JUNIOR CATEGORY
Josipa Bradić, Erol Kovačević and Asim BradićDORSIFLEXION RANGE OF MOTION DOES NOT SIGNIFICANTLY INFLUENCE BALANCE IN PHYSICALLY ACTIVE YOUNG WOMEN
Damira Vranešić-Hadžimehmedović, Ifet Mahmutović and Izet BajramovićTRANSFORMATION PROCESSES OF YOUNG CHILDRENS BASICMOTOR ABILITIES AFFECTED BY SPECIFIC SWIMMING PROGRAM
Edin MirvićTHE LEVEL OF TRANSFORMATIONAL CHANGE IN MOTOR SKILLS UNDER THE INFLUENCE OF SWIMMING PROGRAM
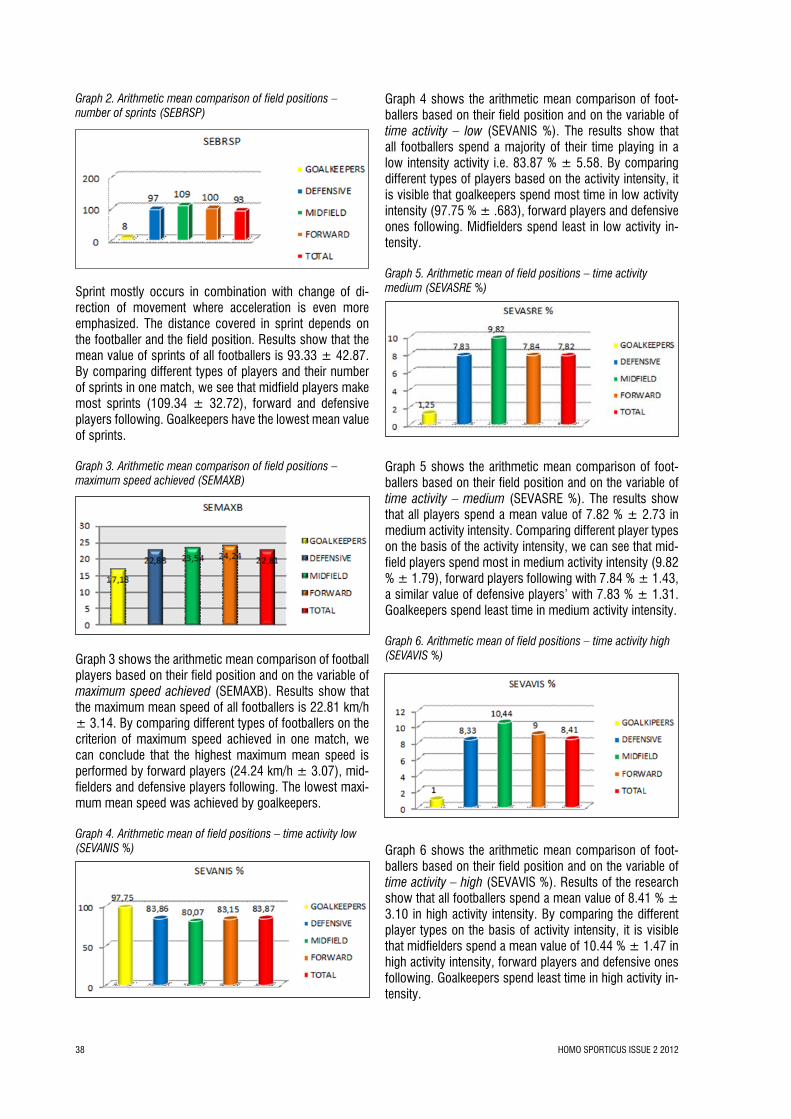
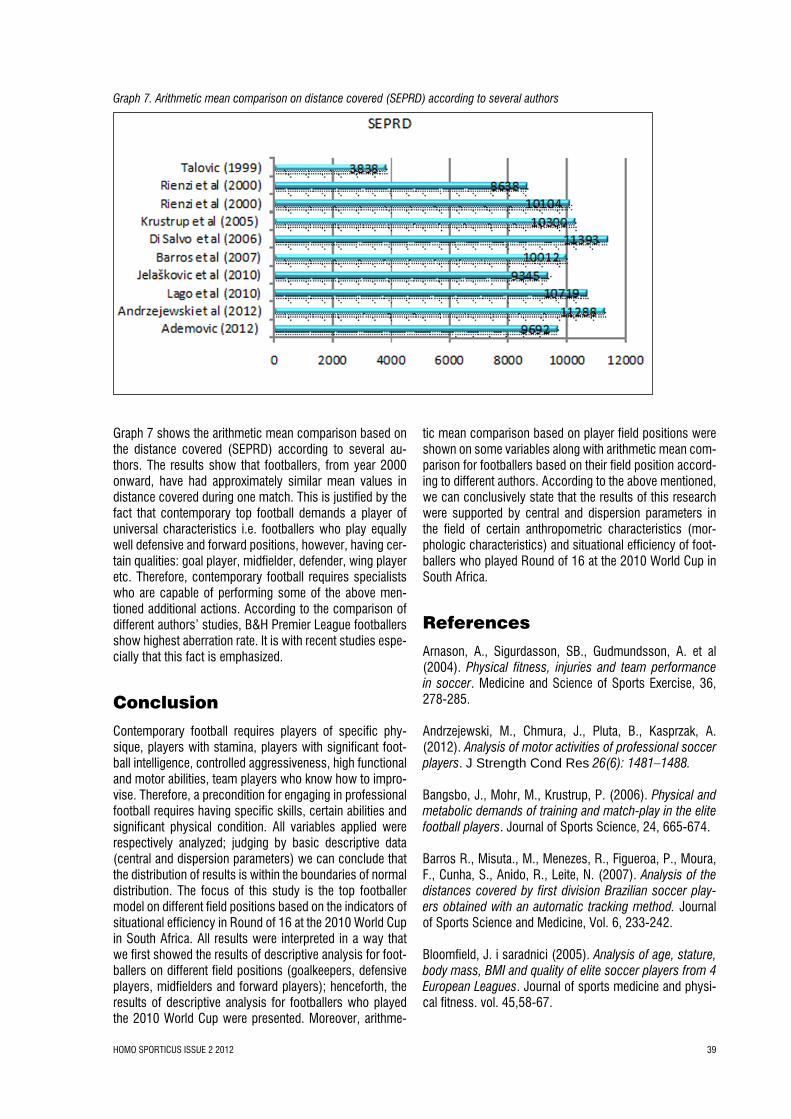
Adnan Ademović, Ekrem Čolakhodžić, Munir Talović and Husnija KajmovićTOP FOOTBALLER MODEL BASED ON INDICATORS OF SITUATIONAL EFFICIENCY IN ROUND OF 16 AT THE 2010 FIFA WORLD CUP
Damira Vranešić-Hadžimehmedović, Ifet Mahmutović, Izet Bajramović and Eldin JeleškovićTHE PARTIAL QUANTITATIVE CHANGES IN SWIMMING PREFORMANCE AND BASIC MOTOR ABILITIES OF YOUNG GIRLS UNDER THE INFLUENCE OF THE EXPERIMEN-TAL PROGRAM
Ensar Abazović, Siniša Kovač, Muhamed Tabaković, Mensur Vrcić and Erol KovačevićISOKINETIC PROFILE OF KNEE FLEXORS AND EXTENSORS STRENGTH OF THE FACULTY OF SPORT AND PHYSICAL EDUCATION FEMALE STUDENTS
Instructions for Autors
5
11
15
19
23
28
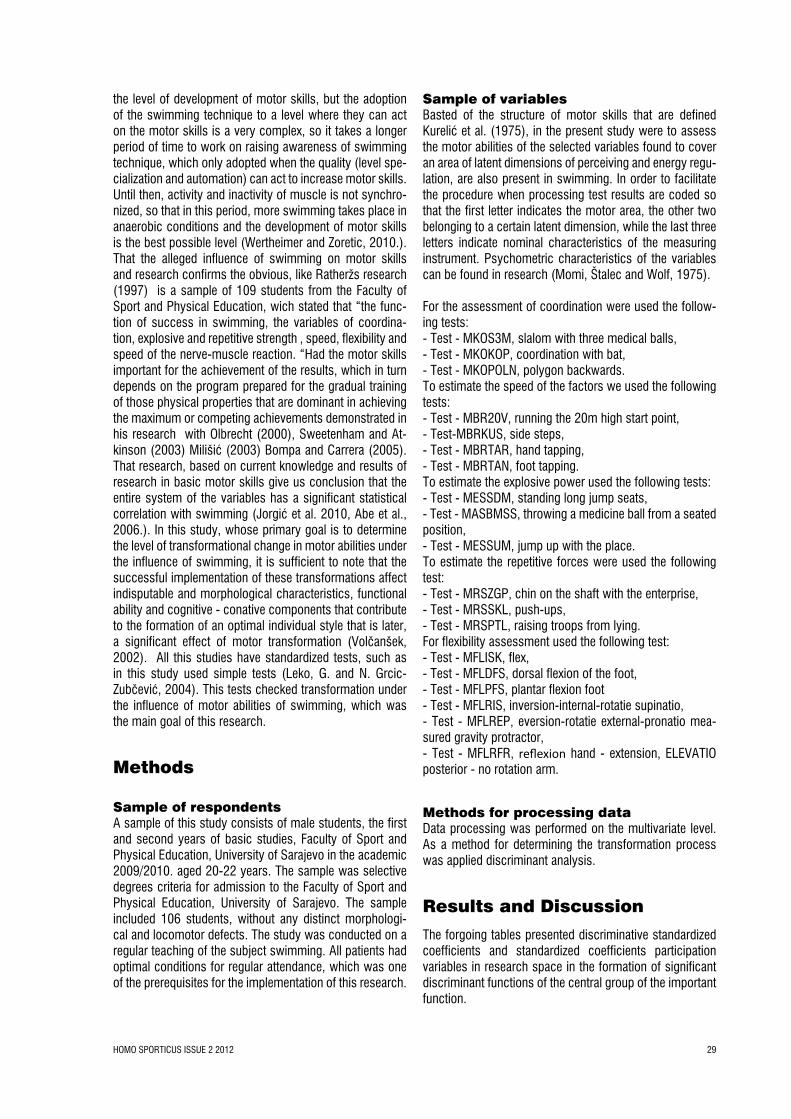
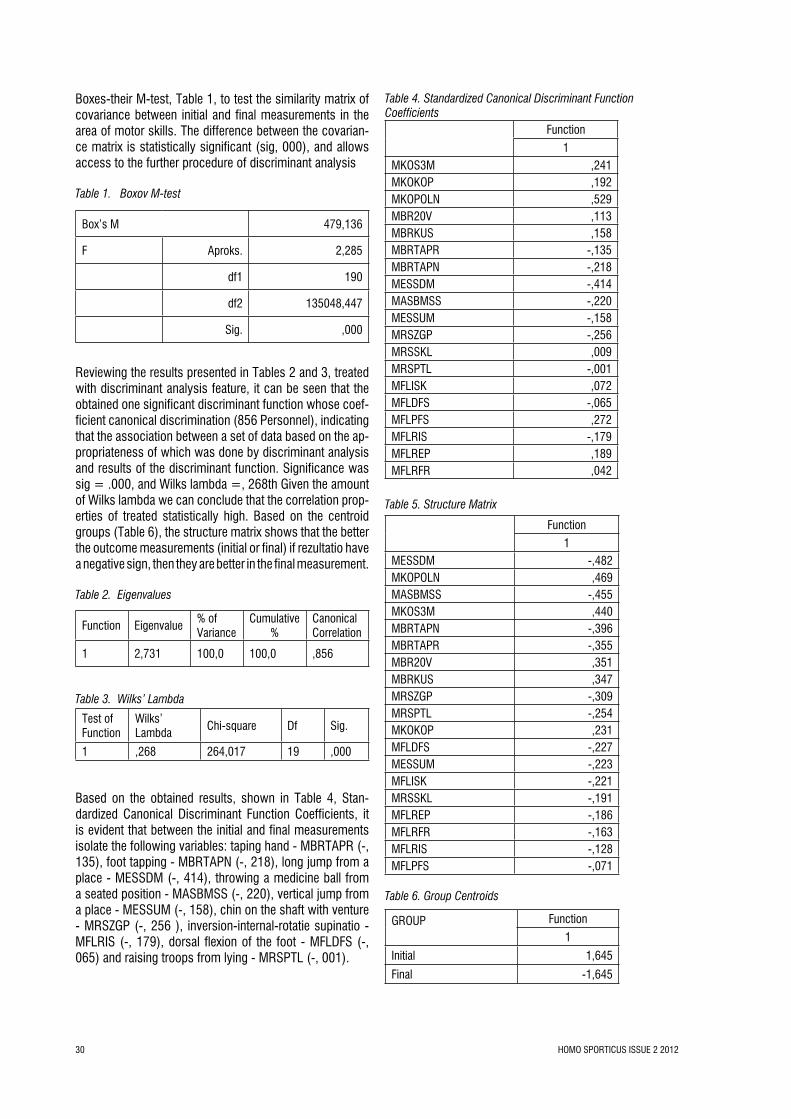
33
41
45
56
Volume 14 – Issue 2 – December, 2012
HOMO SPORTICUS ISSUE 2 20124
HOMO SPORTICUS ISSUE 2 2012 5
Saša Krstulović1
Predictors of Judo Performance in Male Athletes1 University of Split, Faculty of Kinesiology, Croatia
Original scientific paper
AbstractMain goal of this research was to identify and rank the predic-tors of athletic performance for male judo athletes. We have in-terviewed 18 top-level European judo coaches, and asked them to rank the importance of different general physical fitness, motor abilities and specific strength variables in the success of judo athletes for three weight groups: lightweight (< 66 kg), middle-weight (67 – 90 kg), and heavyweight (> 90 kg) athletes. We have established coefficients of concordance to assess agree-ment among judo coaches about judo achievement predictors. To establish the differences among the three weight groups a non-parametric Z-test was done. Among the general factors, coaches ranked physical fitness and technical and tactical knowledge, as the most important factors for success in judo with no major dif-ferences in the hierarchical structures among weight categories. Heavyweight athletes benefit most from maximal strength, while motor-skill speed and power were judged as the most important factors in lightweighters. Muscular and cardiovascular endurance are significant predictors of judo success regardless of weight category.
Key words: combat sport, questionnaire, motor abilities, weight categories
SažetakOsnovni cilj ovog istraživanja bio je identificirati i rangirati pre-diktore uspješnosti judaša muškaraca. Anketiralo se 18 vrhun-skih Evropskih judo trenera, koji su trebali rangirati po važnosti za uspjeh u judu općenito antropološke karakteristike, različite motoričke sposobnosti i specifične varijable snage za tri različite težinske skupine: niže težinske skupine (< 66 kg), srednje težin-ske skupine (67 – 90 kg) i više težinske skupine (> 90 kg). Da bi se utvrdio stupanj slaganja između anketiranih trenera izraču-nat je Kendall Tau koeficijent. Za utvrđivanje razlika u rezultatima između tri težinske skupine primijenjen je neparametrijski Z test. Promatrajući općenita obilježja, treneri su rangirali motoričke sposobnosti i tehničko-taktičko znanje kao najvažnije faktore uspješnosti u judu bez znatnih razlika u redoslijedu između te-žinskih skupina. Kod viših težinskih kategorija maksimalna sna-ga determinira uspješnost dok je kod nižih težinskih kategorija najvažnija brzina i eksplozivna snaga. Mišićna i kardiovaskularna izdržljivost je značajan prediktor uspješnosti u judu bez obzira na težinsku kategoriju.
For top results in the area of sport it is necessary to dis-pose with current scientific cognitions about the influence of anthropological characteristics on performance and success. Judo is a complex sport, involving a considerable number of dimensions (abilities, characteristics, and skills) that influence the final combat result. The volume and in-tensity of the judo combat classifies judo as an anaero-bic-aerobic sport (Franchini et al. 2007, Almansba et al. 2007, Sbriccoli et al. 2007). Previous studies found stron-ger and mesomorphic judoists to have an advantage over their opponents of comparable technical skills (Krstulovic et al. 2005, Krstulovic et al. 2006, Franchini et al. 2005). Since judo basically consists of two fighters outsmarting each other, judo experts consider specific intellectual ca-pabilities as highly important for a successful judo athlete (Filaire et al. 2001a, Filaire et al 2001b). Finally, athletes with a low level of the anxiety, and high ego and self-con-fidence are judged as potentially more successful (Filaire et al 2001b, Gimeno et al. 2007, Gernigon and Le Bars 2000). In defining the characteristic relationships among
the physical, morphological, and/or personal characteris-tics of judoists as predictors and judo achievement crite-ria, some specific problems need to be addressed. First, the investigator has to observe a relatively large number of high-class (elite) subjects from each of seven weight cat-egories and test them with great number of different tests. Second, to make certain that all athletes are observed in the same period of the competitive season and in a similar phase of the sport form, it is crucial to ensure the testing of all subjects involved during a relatively short testing period. Third, achievement in judo cannot be simply quantified as in some other sports like track and field, rowing, cross country skiing and/or swimming. Therefore, all previously mentioned studies investigated only the partial influence of a few dimensions potentially related to judo performance. In other words, we have found no recent study in which authors observed a wide spectrum of abilities and/or char-acteristics that could influence judo achievement. In this study, we have tried to avoid the aforementioned problems while using a relatively original approach in studying the influence of different dimensions on sport achievement and performance. The idea was to outline the hierarchy of the
HOMO SPORTICUS ISSUE 2 20126
abilities, characteristics, and skills important in the sport of judo by interviewing judo experts. Feltz and Lirgg (1998), Yeung et al. (2001) and Magyar et al. (2004) applied such approach for hockey, marathon, and rowing, respectively. However, in the literature we have found that only van Ros-sum et al. (1994, 1996) studied judo in the similar manner. However, in both Dutch studies, authors observed different sports while including a relatively small number of specific dimensions potentially related to success in one particular sport (e.g., dimensions potentially important only in judo). In this paper, we have studied the problem more specifi-cally while analyzing the abilities and characteristics (fac-tors) considered particularly important in judo. Therefore, the aim of the study was to identify and rank the predictors of athletic performance for male judo athletes observed in three weight groups.
Materials and Methods
Subjects: The sample of respondents (interviewed sub-jects) consisted of 18 top-level European coaches and national team managers from 14 countries. The subjects were 35 to 56 years of age, and coached and/or managed in judo for at least 11 years. Most of them were highly educated in the field of sport science.
Instruments: Although subjects were interviewed using a long questionnaire, in this paper we have analyzed only the responses on three hierarchically designed factors. In the first and most general factor, coaches were asked to rank the importance of five predictors: (1) physical fit-ness (motor abilities), (2) body constitution (body build), (3) technical-tactical readiness (motor skills and tactical knowledge), (4) psychic profile (competitiveness, persis-tence, etc.), and (5) sport-specific intelligence. The sec-ond factor was designed to rank physical fitness capacities potentially related to judo performance, and subjects were asked to rank the significance of (1) strength capacities,
(2) judo specific endurance, (3) speed, (4) flexibility, (5) balance, and (6) coordination. In the third and most spe-cific factor, subjects ranked three strength dimensions: (1) maximal strength, (2) muscular endurance, and (3) power (explosive strength).
Coaches were asked to assign rank 1 to the predictor judged most important, rank 2 to the second most impor-tant dimension, and so on. The assigning was done for each factor separately, and we accepted equal ranks for two dimensions within the each factor. It must be noted that respondents judged the importance of predictors separately for three weight groups: lightweight (<66 kg), middleweight (67–90 kg), and heavyweight group (>90 kg) of male judo athletes.
Statistical analysis: The coefficients of concordance (Ken-dall Tau coefficients) were calculated to assess agreement among respondents (judo coaches). Using descriptive statistics (means and standard deviations), we ranked the dimensions within each of the observed factors. Finally, to establish the differences among the three weight groups in terms of the mean score of each predictor within the three observed factors, a nonparametric Z-test was done. A level of significance of 95% was applied.
Results
Average Kendall Tau coefficient of 0.59 showed high agreement among coaches in their rankings of the factors influencing judo performance.
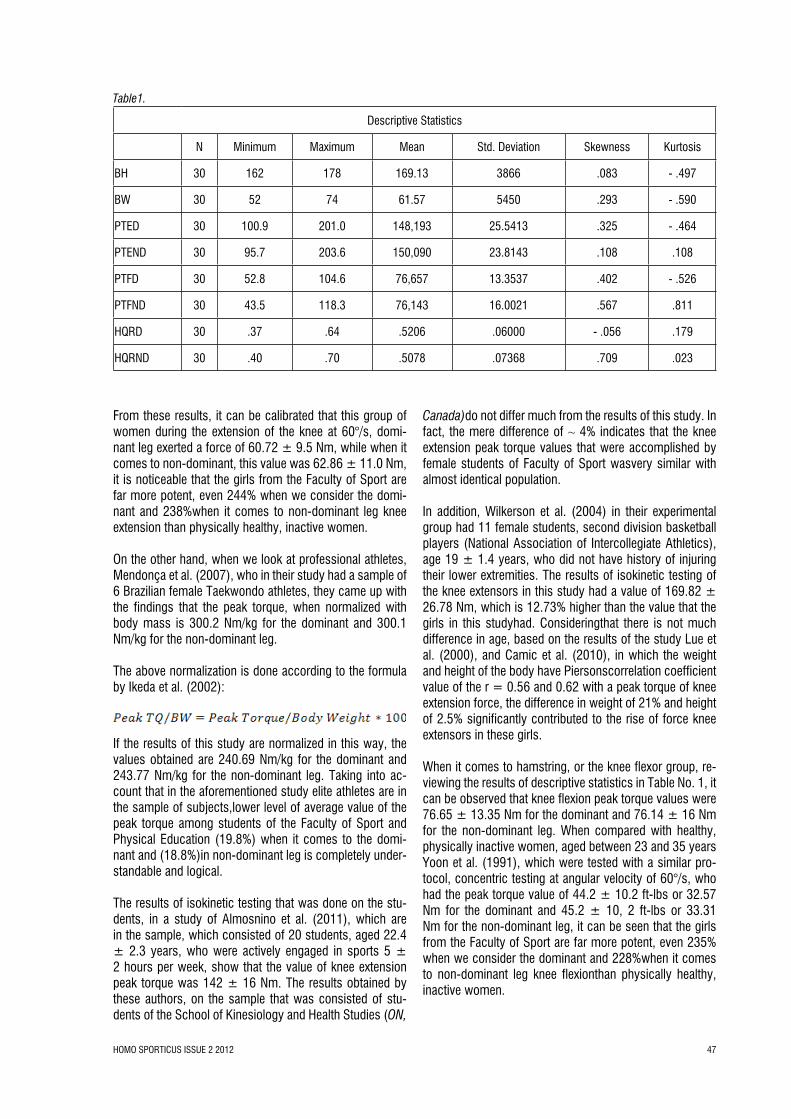
As presented in Table 1, within the most general dimen-sions in light weight and middle weight categories physical fitness capacities were ranked as most important, followed by TE-TA readiness, psychic profile, sport-specific intel-ligence, and body constitution. In heavy weight category TE-TA readiness is ranged as first, followed by physical fit-
Table 1.
Descriptive statistics (M - Mean; SD – Standard Deviation), overall ranking (bracketed numbers), and Z-test significance of the differences between weight groups for general judo performance predictors
Sport specific intelligence 3.28±1.20 (4) 3.30±1.20 (4) 3.28±1.36 (3)
LEGEND: a indicates significant difference between Light and Middle weight; b indicates significant difference between Middle and Heavy weight; c indicates significant difference between Light and Heavy weight
HOMO SPORTICUS ISSUE 2 2012 7
ness, sport specific intelligence, psychic profile and body constitution as the last factor. Significant differences in the mean scores for each dimension were found only for physical fitness when comparing their importance for light-weight and heavyweight athletes and body constitution, when comparing their importance for middleweight and heavyweight athletes. Briefly, body constitution received a relatively higher mean score in middleweight athletes, while coaches gave physical fitness a higher mean score for athletes in the lightweight category.
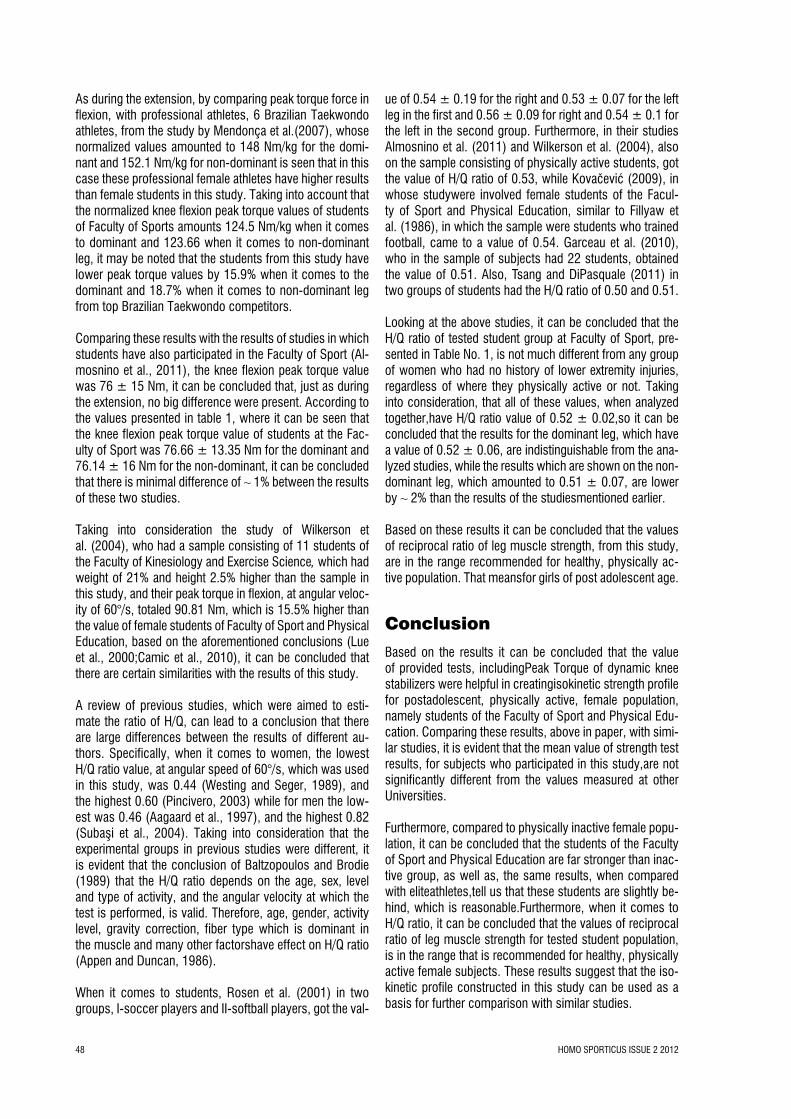
The hierarchy of specific physical fitness capacities in judo athletes is evidently different when comparing the three observed weight categories (Table 2). In lightweight judo athletes, coaches ranked speed as the most important fit-ness capacity, followed by judo specific endurance, coor-dination, strength, balance and flexibility. For middleweight athletes, endurance is ranked first and strength is placed as second, followed by speed, coordination, balance and flex-ibility. Strength is judged as the most important physical
fitness dimension in heavyweight male athletes, followed by judo specific endurance, balance, speed, coordination and flexibility. Logically, such discrepancies in the relative importance of physical fitness dimensions for each weight category are followed by numerous significant differences in the mean scores for each dimension among weight cat-egories.
The most interesting are the variations in the scores for strength capacities and speed (significantly different among weight categories in all comparisons). At the same time, the mean scores for flexibility balance and coordina-tion did not differ significantly among weight categories.
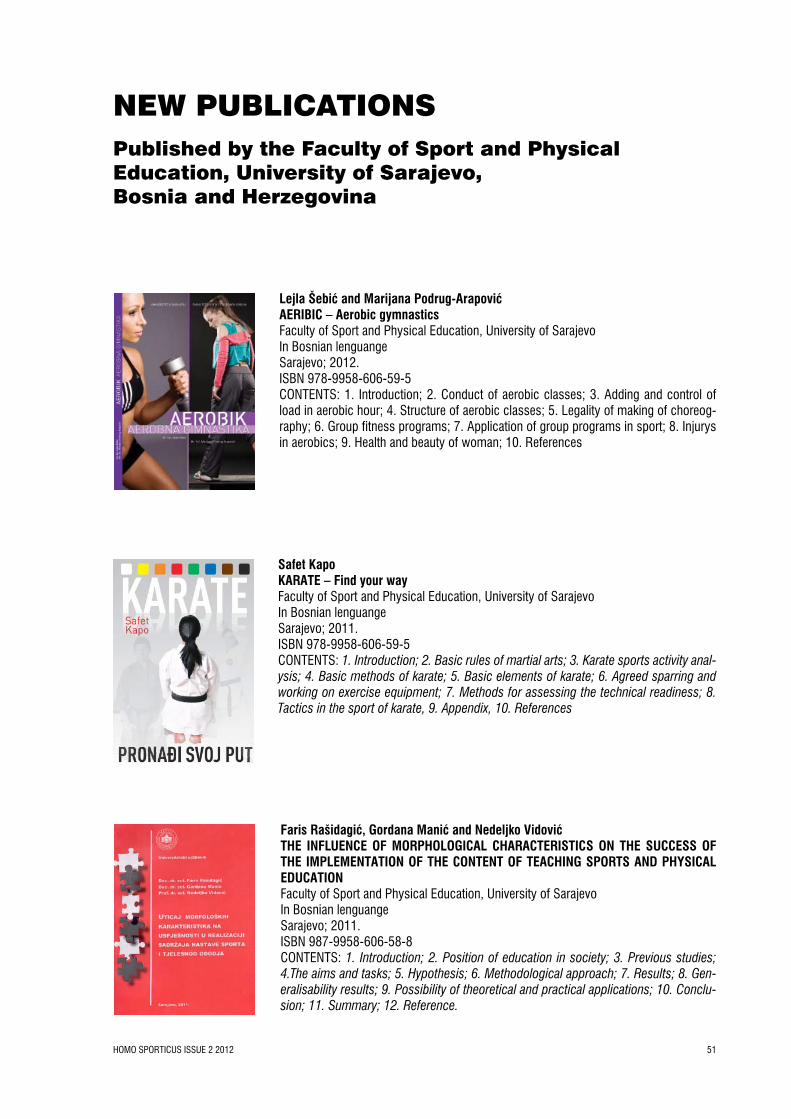
The importance of explosive strength decreases with the weight of the athletes, while the value of maximum strength is more evident in heavyweight athletes (Table 3). Such trend is followed by significant differences in mean scores. Muscular endurance is a highly ranked strength dimension for middleweight judoists.
Table 2.
Descriptive statistics (M - Mean; SD – Standard Deviation), overall ranking (bracketed numbers), and Z-test significance of the differences between weight groups for physical fitness judo performance predictors
PREDICTORLight weight
M ± SDMiddle weight
M ± SDHeavy weight
M ± SD
Strength capacities a b c 3.79±1.39 (4) 2.78±1.30 (2) 1.10±0.25 (1)
LEGEND: a indicates significant difference between Light and Middle weight; b indicates significant difference between Middle and Heavy weight; c indicates significant difference between Light and Heavy weight
Table 3.
Descriptive statistics (M - Mean; SD – Standard Deviation), overall ranking (bracketed numbers), and Z-test significance of the differences between weight groups for strength-type judo performance predictors
PREDICTORLight weight
M ± SDMiddle weight
M ± SDHeavy weight
M ± SD
Maximal strength b c 2.85±0.39 (3) 2.79±0.47 (3) 1.50±0.79 (1)
Muscular endurance a b 1.71±0.70 (2) 1.22±0.55 (1) 1.81±0.59 (2)
Power (explosive strength) a b c 1.32±0.61 (1) 2.06±0.54 (2) 2.60±0.44 (3)
LEGEND: a indicates significant difference between Light and Middle weight; b indicates significant difference between Middle and Heavy weight; c indicates significant difference between Light and Heavy weight
HOMO SPORTICUS ISSUE 2 20128
Discussion
It is interesting to note that, when van Rossum and as-sociates (1994) studied judo predictors, they found only 0.36 concordance among judo experts. On the other hand, our analysis showed far better agreement (0.59) among respondents. Most probably, the higher expertise of the judges we have sampled led to the higher correlation in their evaluation of the judo predictors. Also, van Rossum and his associates (1994) studied judo in general, while we divided judo athletes into three weight groups. Almost cer-tainly, such differentiation allowed judges to interpret the judo predictors in our study more specifically. We consid-ered intriguing the fact that the results evidenced a similar hierarchy of the general dimensions (Table 1) potentially related to judo success in each weight category, especially when compared to dissimilarities in the hierarchy of physi-cal fitness (Table 2) and strength dimensions (Table 3). Most probably, the hierarchy of the general dimensions differentiates judo athletes from participants in other sports and/or distinguish generally more successful judo athletes from their less successful peers, while physical fitness and strength factors define the judo performance predictors in the different weight categories of judo athletes. We discuss this more specifically in the following sections.
General hierarchy of factors potentially related to judo performance in females
Comparing gained results with the investigation of van Rossum et al. (1994), significant differences are notice-able in the importance of some factors on judo success. Briefly, the Dutch study ranked physical fitness as fourth and tactical ability as sixth most important out of eight explored factors, while the same dimensions emerged as the most important factors out of the five dimensions ob-served in our study. Since 1994 (the year the Dutch study was published) the rules of the judo match have changed significantly. The change is mainly related to the fact that modern judo directly “penalizes” passive fights. The logi-cal consequence of such a ruling in judo is a high-intensity match, and accordingly, the requirement of a high level of (1) physical fitness and (2) tactical knowledge for the ath-letes. In the last decade, there is probably no published paper in which the importance of physical fitness in judo is not highlighted (Franchini et al. 2007, Krstulovic et al. 2005, Krstulovic et al. 2006, Franchini et al. 2005, Mon-teiro et al. 2007, Almansba et al. 2008) directly supporting our findings and previous discussion regarding physical fitness status. On the other hand, studies by Calmet and Ahmaidi (2004) and Franchini et al.(2008), in which judo athletes of high rankings were shown to be more techni-cally and tactically skilled than their less successful rivals, validate our findings about the relative importance of tech-nical-tactical skills in judo. Based on our results, body build does not influence judo performance considerably, which was already suggested in experimental studies in which body build was related to judo performance (Krstulovic
et al. 2005, Krstulovic et al. 2006, Monteiro et al. 2007). However, this interpretation must not be oversimplified. Briefly, judo athletes are known to be among the most mesomorphic athletes (Gualdi-Russo and Graziani 1993, Krawczyk 1997). In other words, appropriate body build (athletic physique, mesomorphic build) is highly important in judo, but judo athletes do not differ within their competi-tive group in the body-build dimensions because: (1) the ranges of the weight categories are relatively narrow (6 to 10 kg, excluding an absolute category 100+ kg) and (2) each top-class athlete (practically judged by coaches in this study) tends to reach the highest possible body weight in a specific weight category. These two factors narrow the variance of body composition status in judo athletes, Hence, (1) correlation analysis did not show a significant relationship between body-build dimensions and judo per-formance and (2) the coaches can’t recognize body-build measures as important factors in judo performance (here presented results).
Relative importance of physical fi tness factors in judo athletes
Based on our observations, the hierarchy of physical fit-ness variables potentially related to judo performance differs significantly among weight groups. However, the judo specific endurance is recognized as very important in each weight group (ranked as the first or second physical fitness factor in all three weight groups). Although in the questionnaire we have used there was no distinction be-tween aerobic and anaerobic endurance, we have no doubt that coaches practically considered anaerobic endurance in their rankings. This is mostly attributed to the fact that recent studies performed on judo athletes noted relatively low levels of aerobic endurance capacities (less than 50 ml/kg – Franchini et al. 2007, Sbriccoli et al. 2007) and high levels of anaerobic endurance capacities in judo ath-letes (12 to 17 W/kg; 273 - 320 J/kg – Almansba et al. 2007, Sbriccoli et al. 2007). Additionally, these findings probably support our views regarding the high intensity of the judo match (see the first section of Discussion). The importance of motor-skill speed is widely accepted in lightweight judo. Lightweight athletes are mostly relatively shorter and, consequently, quicker than their colleagues competing in the higher weight categories (Almansba et al. 2008). Since quickness ensures a proper and efficient technique not only in the attack but also in the counterat-tack, coaches perceive motor-skill speed as essential in lightweight athletes. At the same time, strength evidently prevails as a more important physical fitness dimension in heavyweight categories. The main reason for recognizing strength as the most distinctive physical fitness dimension in heavier athletes, which is most probably correct, can be found in biomechanical and functional theories. Briefly, experiments demonstrated that human strength scales al-lometrically to the body weight of the subjects (Markovic and Sekulic 2006). Although this is a complex theory, in judo it practically means that heavier athletes vary in their
HOMO SPORTICUS ISSUE 2 2012 9
strength capacities more than their “lighter” colleagues do. Also, judo performance in higher weight categories is more static, accentuating strength capacities more significantly in heavier than in lighter athletes. Therefore, it is logical that coaches considered strength as more important in the middleweight and heavyweight categories than in light-weight judo. Coaches do not consider balance (stability) as an important parameter in judo, although judo is gener-ally known as a “balance sport”. Briefly, a judo combat practically consists of constant attempts to disrupt the op-ponent’s balance, which allows for the efficient application of throwing techniques (Krstulovic et al. 2006). The expla-nation for the low ranking of this physical fitness variable is probably very much the same as that for the previously discussed low hierarchical position of body build in the first (general) factor. In short, studies demonstrated a strong positive influence of judo on the balance status (Perrin et al. 2002), but variations in balance among judo athletes are relatively small and, therefore, probably not related to judo performance. We are of the opinion that the same logic of explanation should be followed as well for coordination.
Strength in judo athletes
Previous studies demonstrated strong relationships be-tween muscular endurance and anaerobic endurance in athletes. Such interrelationships are essentially physiologi-cally explained and relate to the fact that both capabilities depend of the same energetic process – anaerobic glycoli-sis (Willmore and Costill 2002). It did not surprise us that the interviewed coaches considered muscular endurance as a highly important strength factor in all weight catego-ries. Basically, even if they did not have knowledge of the complex physiological and biochemical background of the relation between these two variables, coaches would surely be familiar with the fact that successful judo athletes are simultaneously dominant in both muscular and cardio-vascular endurance. As in the case of endurance capaci-ties (see previous paragraph), the high ranking of explosive strength in lightweight judoists is also physiologically de-scribed. In the Discussion section, we have explained the importance of speed in lightweight athletes. Both explosive strength (power) and speed are directly related to the quan-tity (proportion) of fast twitch muscle fibers of each athlete (Willmore and Costill 2002). Therefore, the quickness of lightweight athletes simultaneously means a high level of explosive strength (power). Both of these fitness capacities allow athletes to apply efficient techniques and to perform better. In support of our discussion in the previous section, in which we emphasized the allometrical relationship be-tween human body weight and strength, the highest rank-ing of maximal strength exclusively in heavyweight athletes should be considered as an expected result.
Conclusion
The following can be concluded: (1) Observation of three separate weight groups proved to be justified because hier-archies of specific physical fitness capacities and strength capacities in judo athletes differ significantly when com-paring the three observed weight categories; (2) Among the general factors, coaches ranked physical fitness and technical and tactical knowledge as the most important factor of success in judo; (3) Strength capacities, judo specific endurance and speed fall into a category of more important abilities, and balance, coordination and flexibil-ity less important abilities for success in judo; (4) motor-skill speed and power are significant predictors of sport success in lighter judo athletes, while maximal strength is more closely related to performance in heavier judo ath-letes, while muscular and cardiovascular endurance is rec-ognized as very important in each weight group.
References
Franchini E, Nunes AV, Moraes JM, Del Vecchio FB. Physi-cal Fitness and Anthropometrical Profile of the Brazilian Male Judo Team. J Physiol Anthropol 2007;26:59-67.
Almansba R, Franchini E, Sterkowicz S. An uchi-komi with load, a physiological approach of a new special judo test proposal. Sci. sports 2007;22:216-223.
Sbriccoli P, Bazzucchi I, Di Mario A, Marzattinocci G, Felici F. Assessment of maximal cardiorespiratory performance and muscle power in the Italian Olympic judoka. J Strength Cond Res 2007;21:738-744.
Krstulovic S, Sekulic D, Sertic H. Anthropological De-terminants of Success in Young Judoists. Coll Antropol 2005;29:697-703.
Krstulovic S, Zuvela F, Katic R. Biomotor systems in elite junior judoka. Coll Antropol 2006;30:845-851.
Franchini E, Takito MY, Kiss MAPDM, Sterkowicz S. Physi-cal fitness and anthropometric differences between elite and nonelite judo players. Biol Sport 2005;22:315-328.
Filaire E, Maso L, Sagnol M, Ferrand C, Lac G. Anxiety, hormonal responses, and coping during a judo competi-tion. Aggress Behav 2001a;27:55-63.
Filaire E, Sagnol M, Ferrand C, Maso L, Lac G. Psycho-physiological stress in judo athletes during competitions. J Sports Med Phys Fitness 2001b;41:263-268.
Gimeno F, Buceta JM, Perez-Llantada MC. The influence of psychological variables on sports performance: Assess-ment with the questionnaire of sports performance-related psychological characteristics. Psicothema 2007;19:667-672.
HOMO SPORTICUS ISSUE 2 201210
Gernigon C, Le Bars H. Achievement Goals in Aï kido and Judo: A Comparative Study among Beginner and Experi-enced Practitioners. J Appl Sport Psychol 2000;12:168-179.
Feltz DL, Lirg CD. Perceived team and player efficacy in hockey. J Appl Psychol 1998;83:557-564.
Yeung SS, Yeung EW, Wong TW. Marathon finishers and non-finishers characteristics: A preamble to success. J Sports Med Phys Fitness 2001;41:170-176.
Magyar TM, Feltz DL, Simpson IP. Individual and Crew Lev-el Determinants of Collective Efficacy in Rowing. J Sport Exerc Psychol 2004;26:136-153.
Van Rossum JHA. Psychological characteristics of elite athletes according to top level coaches. High ability stud-ies 1996;7:15-23.
Van Rossum JHA, Gagne F. Rankings of predictors of ath-letic performance by top level coaches. European journal for high ability 1994;5:68-78.
Monteiro L, Peixoto R, Proenca J, editors. Physical Fitness of Elite Judokas - Medalists and Non-Medalists. Proceed-ings of the 2nd International Judo Federation World Judo Conference; 2001 July 24; Munich, Germany. 2001.
Calmet M, Ahmaidi S. Survey of Advantages Obtained by Judoka in Competition by Level of Practice. Percept Mot Skills 2004;99:284-290.
Franchini E, Sterkowics S, Meira Jr. CM, Gomes FRV, Tani G. Technical variation in a sample of high level judo play-ers. Percept Mot Skills 2008;106:859-869.
Gualdi-Russo E, Graziani I. Anthropometric Somatotype of Italian Sport Participants. J Sports Med Phys Fitness 1993;33:282-291.
Krawczyk B, Sklad M, Jackiewicz A. Heath-Carter Somato-types of Athletes Representing Various Sports. Biol Sport 1997;14:305-310.
Almansba R, Franchini E, Sterkowicz S, Imamura R, Calmet M, Ahmaidi S. A comparative study of speed expressed by the number of throws between heavier and lighter catego-ries in judo. Sci. sports 2008;23:186-188.
Markovic G, Sekulic D. Modeling the influence of body size on weightlifting and powerlifting performance. Coll Antrop-ol 2006;30:607-613.
Perrin P, Deviterne D, Hugel F, Perrot C. Judo, better than dance, develops sensorimotor adaptabilities involved in balance control. Gait Posture 2002;15:187-194.
Willmore J, Costill D. Physiology of Sport and Exercise. Champaign Il 4th edition: Human Kinetics; 2002.
Džubur Amela1, Džubur Alen2, Hasanbegović Ilvana3 and Pepić Esad4
Relationship between Quality of Life and Physical Activities in Relation to the Tobacco Smoking Habits1 Department of Public Health Faculty of Medicine, University of Sarajevo, Bosnia and Herzegovina2 Clinic for Hart Disease and Rheumatismus, Clinical Center University of Sarajevo, Bosnia and Herzegovina3 Department of Anatomy, Faculty of Medicine University of Sarajevo, Bosnia and Herzegovina4 Department of Pathofiziology, Faculty of Medicine, University of Sarajevo, Bosnia and Herzegovina
Original scientific paper
AbstractThe goal of this paper is to examine the quality of life of respon-dents in comparison to their physical activities and their smoking status. The study was conducted on a sample of 200 respondents, of which 100 (50%) were smokers and 100 (50%) non-smokers. In both groups half of them have regular physical activity (walking for 60 minutes a day, running up to 30 minutes a day, exercise at the gym more than 2 times a week, or involved in sport activi-ties at least once a week). The study included respondents aged 18-49 years. The study used a questionnaire that was designed for this study based on the SF-36 questionnaire to test the quality of life, and EUROQOL questionnaire to examine socioeconomic status. There was a statistically significant association between physical activity and quality of life. People engaged in physical activity showed higher average scores in quality of life compared to those who are not physically active, this difference was statisti-cally significant on all subscales of quality of life questionnaire. With increasing age reduces the quality of life scores but people who are physically active continue to have higher scores than those who are not physically active. Tobacco smoking is recog-nized as a factor that reduces the average scores on all subscales of quality of life, but people who are dealing with physical activi-ties have a higher quality of life scores both in group of smokers and non-smokers.
Key words: quality of life, physical activities, tobacco smoking
SažetakCilj rada je ispitati kvalitet života kod ispitanika u odnosu na bav-ljenje fizičkim aktivnostima i njihov pušački status. Istraživanje je izvršeno na uzorku od 200 ispitanika od kojih je 100 (50%) bilo pušača a 100 (50%) nepušača. U obje skupine ispitanika polovina njih se bavila redovnim fizičkim aktivnostima (hodanje u trajanju od 60 minuta dnevno, trčanje do 30 minuta dnevno, vježbanje u teretani više od 2 puta sedmično ili treniranje nekog sporta najmanje jedanput sedmično). U istraživanje su uključeni ispitanici starosne dobi od 18 do 49 godina. U istraživanju se ko-ristio anketni upitnik koji je dizajniran za potrebe ovog istraživanja a na osnovu SF-36 anketnog upitnika za ispitivanje kvaliteta živo-ta, te EUROQOL anketnog upitnika za ispitivanje socioekonom-skog statusa. Utvrđena je statistički značajna povezanost između bavljenja fizičkim aktivnostima i kvaliteta života. Osobe koje se bave fizičkim aktivnostima pokazuju veće prosječne skorove kva-liteta života i u odnosu na one koji nisu fizički aktivni ta razlika je statistički značajna na svim subskalama kvaliteta života. Sa pove-ćanjem starosne dobi smanjuje se skor kvaliteta života ali osobe koje su fizički aktivne i dalje imaju veće skorove u odnosu na one koji nisu fizički aktivni. Pušenje duhana se prepoznaje kao factor koji smanjuje prosječne skorove na svim subskalama kvaliteta života ali osobe koje se bave fizičkim aktivnostima imaju veće skorove kvaliteta života i kod pušača i kod nepušača.
Ključne riječi: Kvalitet života, fizičke aktivnosti, pušenje duhana
Introduction
Quality of life is a concept that has changed its content extensively during the last century, depending on the per-spective of the scientific discipline and the goals of soci-ety and humans. Now we can say that are generally rec-ognized fields and indicators of quality of life, based on which can be determined the current level of life quality (1). The quality of life is a very complicated concept and its definition depends on who’s discussing it, who defines it. Some define it as the ability to perform social and per-sonal tasks appropriate to the age, gender, intelligence and
membership to a particular class. Another in the quality of life includes individual perceptions of their own wellbeing or absence of these perceptions (2,3).
Its definition depends on many factors: financial, physi-cal, safety, social, health, etc. We live in time and space, so everything around us positively or negatively affect the quality of life (2).
Economists estimate the quality of life based on economic standards according to the distribution of national income. For ecologists quality of life depends on the preservation
HOMO SPORTICUS ISSUE 2 201212
of the natural environment. Sociologists explain the quality of life as a good understanding of the different groups of people. Theologians under the quality recognize the life that does not denies its metaphysical source. Doctors believe that quality is the life in which health is preserved, and as we know, „health is not merely the absence of disease and exhaustion, but a state of complete physical, mental and social well-being“ (2,3,4).
Quality of life can be defined as an individual’s personal perception of one’s own position in life compared to its goals, within the value system that is accepted and incor-porated into their own decision making (5,6).
In a broader context, we can say that the quality of life is the complex overall satisfaction or dissatisfaction with own lives. It is a subjective experience of every human, which clearly depends on the objective circumstances in which someone lives (social, financial, professional, environmen-tal, etc.), but also the personality of the individual, its percep-tion of the actual situation in which he/she lives, its system of values, expectations and aspirations (2,6).The goal of this paper is to examine the quality of life of respondents in com-parison to their physical activities and their smoking status.
Material and methods
The study was conducted on a sample of 200 respon-dents, of which 100 (50%) were smokers and 100 (50%) non-smokers. In both groups half of them have regular physical activity (walking for 60 minutes a day, running
up to 30 minutes a day, exercise at the gym more than 2 times a week, or involved in sport activities at least once a week). The study included respondents aged 18-49 years. The study used a questionnaire that was designed for this study based on the SF-36 questionnaire to test the quality of life, and EUROQOL questionnaire to examine socioeco-nomic status. The SF-36 measures eight subscales (di-mensions) of quality of life:• Physical functioning• Physical role• Bodily pain• General health• Vitality• Social functioning• Emotional role• Mental healthThe research was conducted in the Sarajevo Canton and the inclusion criteria were that the subjects without chronic disease and which do not use any medications or opiates. All research data were entered into a database and ana-lyzed using the SPSS statistical program. From the statisti-cal analysis, in the study are used methods to assess the significance of difference (X2 test, Student’s t-test, univari-ate analysis of variance, Mann - Whitney U test and Krus-kal-Wallis analysis of the variance), as well as methods to assess the significance of correlations (Pearson’s linear correlations coefficient). To assess the impact of physical activity on quality of life the Cox model of univariate and multivariate analyzes were used.
Results
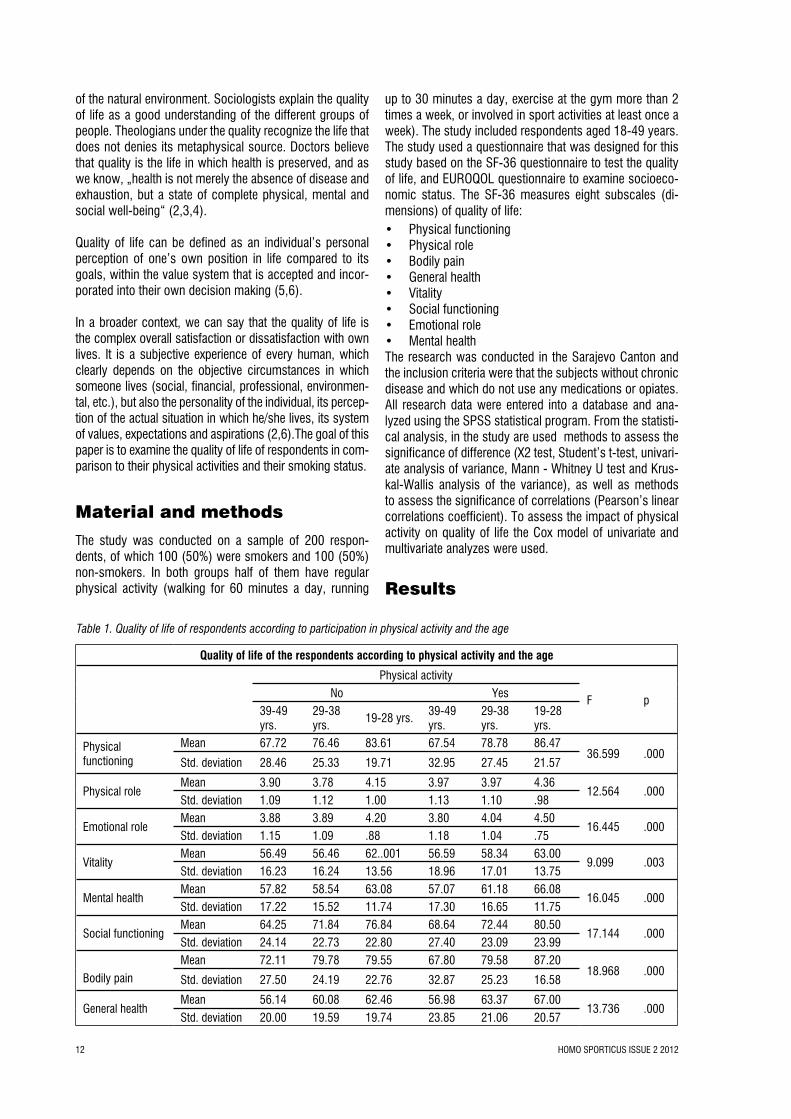
Table 1. Quality of life of respondents according to participation in physical activity and the age
Quality of life of the respondents according to physical activity and the age
Physical activity
F pNo Yes
39-49 yrs.
29-38 yrs.
19-28 yrs.39-49 yrs.
29-38 yrs.
19-28 yrs.
Physical functioning
Mean 67.72 76.46 83.61 67.54 78.78 86.4736.599 .000
Aalyzing the average quality of life scores of respondents in relation to their age and physical activities, we find that respondents who had any kind of physical activity have higher average scores on all subscales of quality of life than those who are not physically active and that differ-
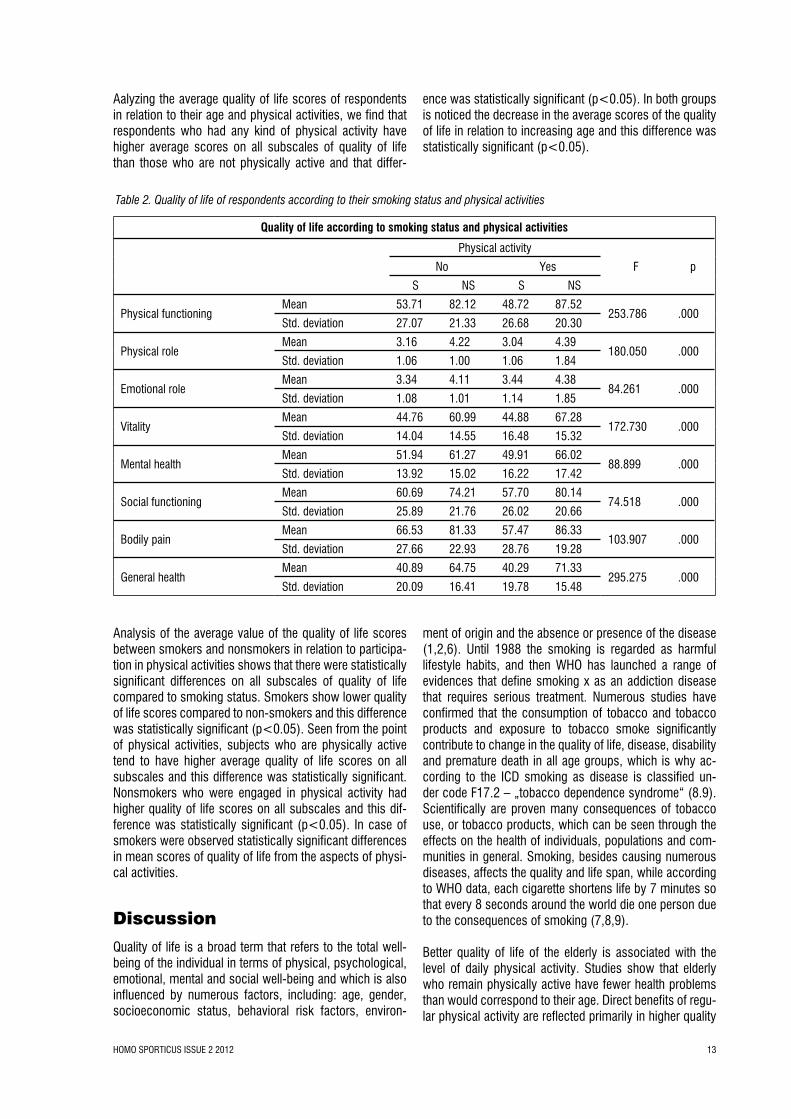
Table 2. Quality of life of respondents according to their smoking status and physical activities
Quality of life according to smoking status and physical activities
ence was statistically significant (p<0.05). In both groups is noticed the decrease in the average scores of the quality of life in relation to increasing age and this difference was statistically significant (p<0.05).
Analysis of the average value of the quality of life scores between smokers and nonsmokers in relation to participa-tion in physical activities shows that there were statistically significant differences on all subscales of quality of life compared to smoking status. Smokers show lower quality of life scores compared to non-smokers and this difference was statistically significant (p<0.05). Seen from the point of physical activities, subjects who are physically active tend to have higher average quality of life scores on all subscales and this difference was statistically significant. Nonsmokers who were engaged in physical activity had higher quality of life scores on all subscales and this dif-ference was statistically significant (p<0.05). In case of smokers were observed statistically significant differences in mean scores of quality of life from the aspects of physi-cal activities.
Discussion
Quality of life is a broad term that refers to the total well-being of the individual in terms of physical, psychological, emotional, mental and social well-being and which is also influenced by numerous factors, including: age, gender, socioeconomic status, behavioral risk factors, environ-
ment of origin and the absence or presence of the disease (1,2,6). Until 1988 the smoking is regarded as harmful lifestyle habits, and then WHO has launched a range of evidences that define smoking x as an addiction disease that requires serious treatment. Numerous studies have confirmed that the consumption of tobacco and tobacco products and exposure to tobacco smoke significantly contribute to change in the quality of life, disease, disability and premature death in all age groups, which is why ac-cording to the ICD smoking as disease is classified un-der code F17.2 – „tobacco dependence syndrome“ (8.9). Scientifically are proven many consequences of tobacco use, or tobacco products, which can be seen through the effects on the health of individuals, populations and com-munities in general. Smoking, besides causing numerous diseases, affects the quality and life span, while according to WHO data, each cigarette shortens life by 7 minutes so that every 8 seconds around the world die one person due to the consequences of smoking (7,8,9).
Better quality of life of the elderly is associated with the level of daily physical activity. Studies show that elderly who remain physically active have fewer health problems than would correspond to their age. Direct benefits of regu-lar physical activity are reflected primarily in higher quality
HOMO SPORTICUS ISSUE 2 201214
and longer life, stronger and more resilient bones, less pain in joints and muscles, increasing and maintaining mobility and balance, reducing the risk of fractures and slower loss of muscle mass. Physical inactivity, along with inadequate nutrition is the second (after smoking) cause of death in the United States (1,2,3).
Most of the studies that were conducted in populations involved in certain types of physical activities shows that there is a significant correlation between the average scores of the quality of life and the physical activity, as has been proven in our study (2,6,7). Tobacco smoking is a factor that reduces the quality of life scores particularly in those who are not engaged in physical activities, as confirmed by most of the studies that have linked quality of life, on the one hand, with tobacco smoking and physical activity, on the other hand, as a style of life that largely determine health and the health status of the individuals (2,6,13).
Conclusions
There was a statistically significant association between physical activity and quality of life. People engaged in physical activity showed higher average scores in quality of life compared to those who are not physically active, this difference was statistically significant on all subscales of quality of life questionnaire. With increasing age reduces the quality of life scores but people who are physically ac-tive continue to have higher scores than those who are not physically active. Tobacco smoking is recognized as a factor that reduces the average scores on all subscales of quality of life, but people who are dealing with physical activities have a higher quality of life scores both in group of smokers and non-smokers.
References
Groff, D.G., Lundberg, N.R., Zabriskie, R.B. (2009). In-fluence of adapted sport on quality of life: perceptions of athletes with cerebral palsy. Disabil Rehabil. 31(4):318-26.
Bize, R., Johnson, J.A., Plotnikoff, R.C. (2007). Physical activity level and health-related quality of life in the general adult population: a systematic review. Prev Med 45:401-415.
Friedenreich, C.M., Orenstein, M.R. (2002). Physical activ-ity and cancer prevention: etiologic evidence and biological mechanisms. J Nutr ,132:3456S-3464S.
Harding, A.H., Wareham, N.J., Bingham, S.A., Khaw, K,, Luben, R., Welch, A., Forouhi, N.G. (2008). Plasma vi-tamin C level, fruit and vegetable consumption, and the risk of new-onset type 2 diabetes mellitus: the European prospective investigation of cancer--Norfolk prospective study. Arch Intern Med, 168:1493-1499.
Ness, A.R., Powles, J.W. (1997). Fruit and vegetables, and cardiovascular disease: a review. Int J Epidemiol, 26:1-13 Peto, J. (2001). Cancer epidemiology in the last century and the next decade. Nature, 411:390-395.
Barnes, P. (2007). Physical activity among adults: United States, 2000 and 2005. Hyattsville, MD: US Department of Heath and Human Services, CDC.
Rejeski, W.J., Brawley, L.R., Shumaker, S.A. (1996). Physical activity and health-related quality of life. Exerc Sport Sci Rev, 24:71-108.
Courneya, K.S., Friedenreich, C.M. (1999). Physical exer-cise and quality of life following cancer diagnosis: a litera-ture review. Ann Behav Med, 21:171-179.
Pakiz, B., Flatt, S.W., Mills, K.C., Jordan, L.J., Carethers, J.M., Rock, C.L. (2005). Quality of life and diet intervention in individuals at risk for recurrence of colorectal adenomas. Psychooncology, 14:85-93
Toobert, D.J., Glasgow, R.E., Strycker, L.A., Barrera, M. Jr., Radcliffe, J.L., Wander, R.C., Bagdade, J.D. (2003). Biologic and quality-of-life outcomes from the Mediterra-nean Lifestyle Program: a randomized clinical trial. Diabe-tes Care, 26:2288-2293.
Plaisted, C.S., Lin, P.H., Ard, J.D., McClure, M.L., Svetkey, L.P. (1999). The effects of dietary patterns on quality of life: a substudy of the Dietary Approaches to Stop Hyper-tension trial. J Am Diet Assoc, 99:S84-89.
Correspondence to:Amela Džubur, MD, PhDDepartment of Public Health, Faculty of Medicine, Univer-sity of SarajevoČekaluša 90, 71000 SarajevoBosnia and HerzegovinaPhone: +38762 056-059e-mail: [email protected]
HOMO SPORTICUS ISSUE 2 2012 15
Munir Talović1, Eldin Jelešković1 and Haris Alić1
Morphological Profi le of Football Players in Junior Category1 Faculty of Sport and Physical Education, University of Sarajevo, Bosnia and Herzegovina
Original scientific paper
AbstractResearch was conducted with the aim to determine related ty-pological categories of football players related to morphological profile. For measuring anthropometrical characteristics 12 vari-ables were used, which estimate longitudinal and transversal di-mensionality of skeleton, volume and body mass and under skin adipose tissue. By applying hierarchical procedure three groups of examinees were isolated according to affinity of structures of variable correlations of morphological characteristics. Discrimi-nant analysis determined that there are quantitative differences between examinees groups. Authors conclude that football can be played successfully by football players with different morphologi-cal profiles, and that it does not require specific body structure.
Key words: morphological profiles, quantitative differences, junior football players
SažetakIstraživanje je rađeno sa ciljem utvrđivanja srodnih tipskih skupina nogometaša u odnosu na morfološki profil. Za mjerenje atropo-metrijskih karakteristika korišteno je 12 varijabli koje procjenjuju longitudinalnu i transverzalnu dimenzionalnost skeleta, volumen i masu tijela te potkožno masno tkivo. Hijerarhijskom procedurom izdvojene su tri grupe ispitanika prema srodnosti struktura me-đuodnosa varijabli morfoloških karakteristika. Diskriminativnom analizom utvrđene su kvantitativne razlike između tipskih skupina ispitanika. Autori zaključuju da nogomet mogu uspješno igrati ra-zličiti morfološki profili nogometaša, te da nogomet ne zahtijeva izrazito specifičnu tjelesnu građu.
Morphological characteristics are used for determining construction type, which is most frequently defined by method Heath i Cartera iz 1967 (Bajramović, 2011.). By this method soma type of professional sportsmen is de-termined. Football, differing from greater number of other team sports (basketball and volleyball), does not require sportsmen with specific body structure (Marković i Bradić, 2009.). Some examinations of relations between anthropo-metric dimensions and success in play (Jerković, 1986.) confirm that there is no significant relation between struc-ture of locomotor system and effectiveness in playing foot-ball. Based on that, it can be concluded that morphological factors do not have prime importance in football, except with goalkeepers. Previous anthropometric measures of football players height (Mekić, 1985.), considering posi-tion on the field, have showed that tallest players were goalkeepers, followed by defensive midfielders, while the shortest were right and left backs (external defenders) and right and left midfielders (central field players).
Some researches (Barišić, 1996.) isolate two groups of soccer players: goalkeepers and players on the field, who differ in morphological area (longitudinal and transversal dimensionality of skeleton). Today’s players are slightly taller than before. The tallest are still goalkeepers, with av-erage height and mass of: 187 kg and 83 kg, which is
justified because of their function in play, while that values for right and left midfielders are average: 184 cm and 78 kg (Marković i Bradić, 2009.). Differences in height of soccer players in certain lines are reduced, which can be interpreted by the fact that today’s players are more univer-sal, and they are equalized in their ability and constitution. Goal of the research is determining soccer player groups relative to morphological profile.
Method of research
Sample of examineesThe research includes a sample of 149 junior football play-ers, who are members of following football clubs of Canton Sarajevo:
„Željezničar“ (N=34), „Sarajevo“ (N=32), SAŠK „Napre-dak“ (N=28), „Radnik“ (N=29) and „Olimpik“ (N=26).All players met conditions for measuring. Because of their specific rule on the field, goalkeepers were not involved in the research.
Sample of variablesMeasuring of anthropometrical characteristics are per-formed according to instructions of IBP „International Biological Program“(Weiner & Lourie, 1969.). Measures of longitudinal dimensionality of skeleton: body height -
HOMO SPORTICUS ISSUE 2 201216
ALVT, leg length - ALDN and feet length - ALDS; Measures of transversal dimensionality of skeleton: diameter of knee - ATDIK and diameter of ankle joint–ATDSZ; measures of volume and body mass: body mass - AVTT, amplitude of thigh - AVONAT, amplitude of lower leg – AVOPOT and amplitude of upper arm - AVONAD;. Measures of body skin curves: abdominal curve – ANTRB, curve of thigh- ANNAT, and curve of lower leg- ANPOT.
Methods for analysing resultsBy applying hierarhical procedure (Hierarchical Cluster Analysis) taxonomization of examinees has been con-ducted, according to structure of correlations between variables of morphological characteristics. For classifying entities in groups, Wards method has been used (Ward, 1963.) Bajramović (2011), based on euclidean distances. Determining related groups was main precondition for applying K-means algorithms. Discriminant analysis de-termined quantitative differences between related groups of examinees. For all related groups, measures of aver-ages and variability of used variables have been calculated (Rađo, Wolf, 2002.)
Results
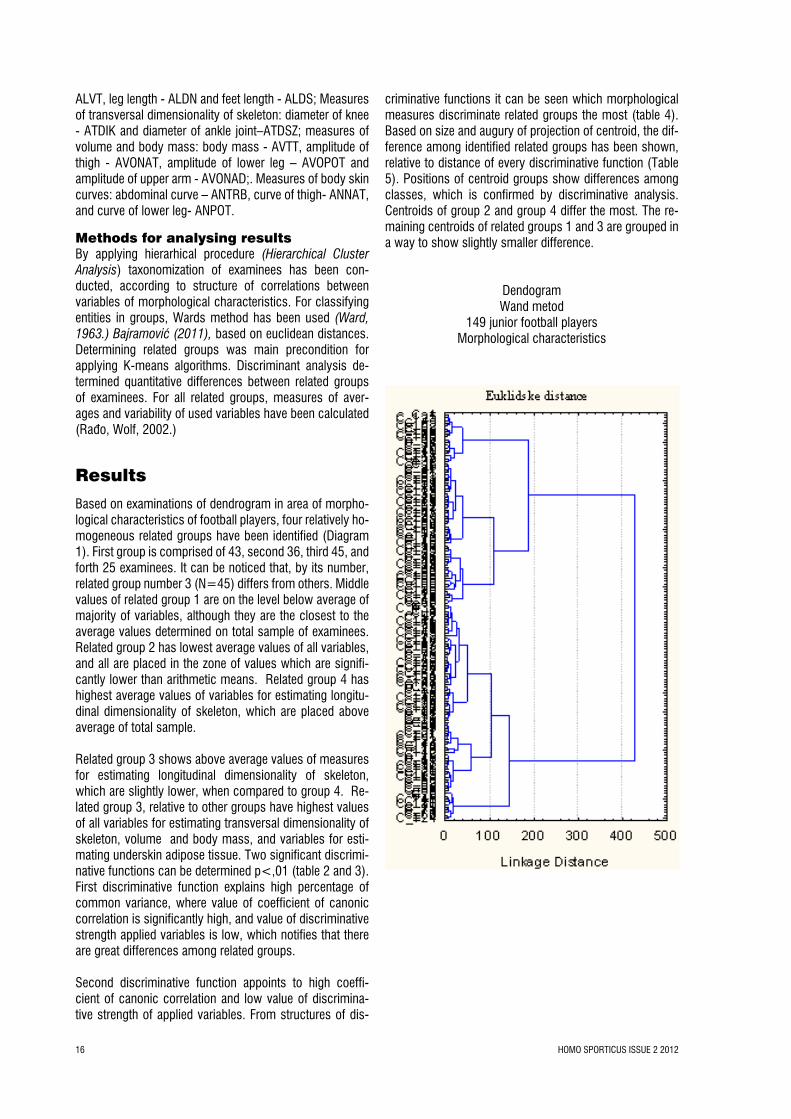
Based on examinations of dendrogram in area of morpho-logical characteristics of football players, four relatively ho-mogeneous related groups have been identified (Diagram 1). First group is comprised of 43, second 36, third 45, and forth 25 examinees. It can be noticed that, by its number, related group number 3 (N=45) differs from others. Middle values of related group 1 are on the level below average of majority of variables, although they are the closest to the average values determined on total sample of examinees. Related group 2 has lowest average values of all variables, and all are placed in the zone of values which are signifi-cantly lower than arithmetic means. Related group 4 has highest average values of variables for estimating longitu-dinal dimensionality of skeleton, which are placed above average of total sample.
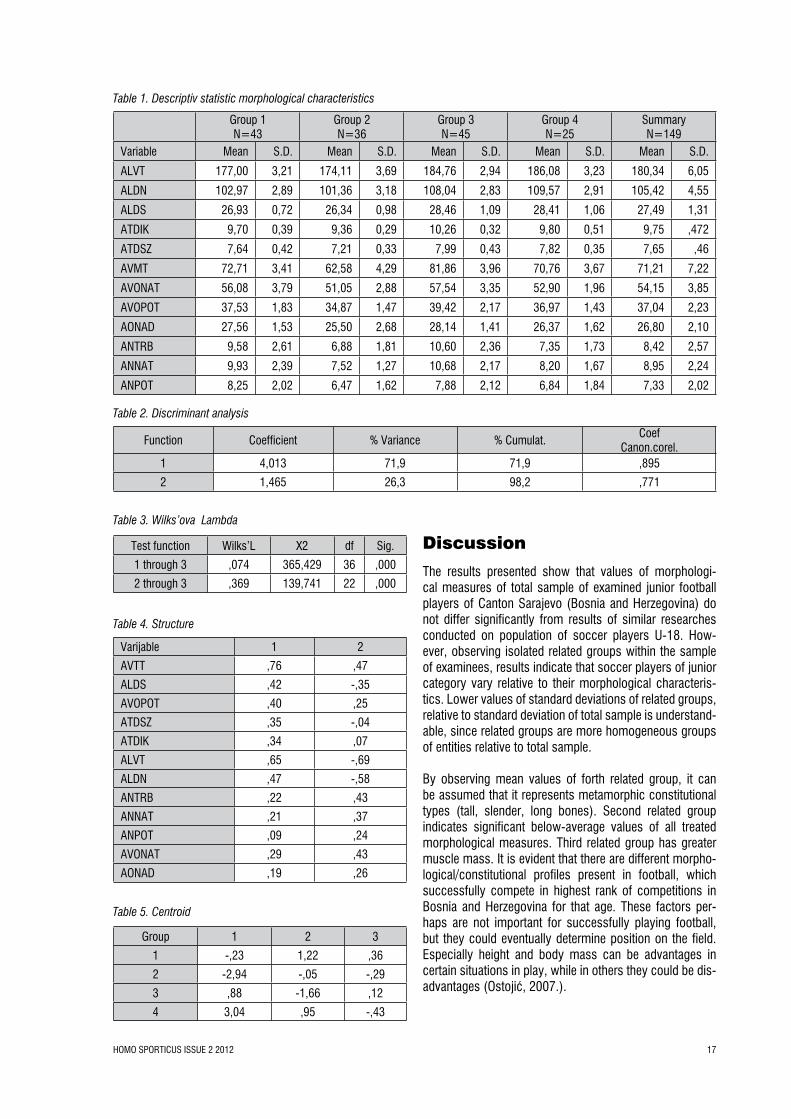
Related group 3 shows above average values of measures for estimating longitudinal dimensionality of skeleton, which are slightly lower, when compared to group 4. Re-lated group 3, relative to other groups have highest values of all variables for estimating transversal dimensionality of skeleton, volume and body mass, and variables for esti-mating underskin adipose tissue. Two significant discrimi-native functions can be determined p<,01 (table 2 and 3). First discriminative function explains high percentage of common variance, where value of coefficient of canonic correlation is significantly high, and value of discriminative strength applied variables is low, which notifies that there are great differences among related groups.
Second discriminative function appoints to high coeffi-cient of canonic correlation and low value of discrimina-tive strength of applied variables. From structures of dis-
criminative functions it can be seen which morphological measures discriminate related groups the most (table 4). Based on size and augury of projection of centroid, the dif-ference among identified related groups has been shown, relative to distance of every discriminative function (Table 5). Positions of centroid groups show differences among classes, which is confirmed by discriminative analysis. Centroids of group 2 and group 4 differ the most. The re-maining centroids of related groups 1 and 3 are grouped in a way to show slightly smaller difference.
DendogramWand metod
149 junior football playersMorphological characteristics
HOMO SPORTICUS ISSUE 2 2012 17
Discussion
The results presented show that values of morphologi-cal measures of total sample of examined junior football players of Canton Sarajevo (Bosnia and Herzegovina) do not differ significantly from results of similar researches conducted on population of soccer players U-18. How-ever, observing isolated related groups within the sample of examinees, results indicate that soccer players of junior category vary relative to their morphological characteris-tics. Lower values of standard deviations of related groups, relative to standard deviation of total sample is understand-able, since related groups are more homogeneous groups of entities relative to total sample.
By observing mean values of forth related group, it can be assumed that it represents metamorphic constitutional types (tall, slender, long bones). Second related group indicates significant below-average values of all treated morphological measures. Third related group has greater muscle mass. It is evident that there are different morpho-logical/constitutional profiles present in football, which successfully compete in highest rank of competitions in Bosnia and Herzegovina for that age. These factors per-haps are not important for successfully playing football, but they could eventually determine position on the field. Especially height and body mass can be advantages in certain situations in play, while in others they could be dis-advantages (Ostojić, 2007.).
Evident differences in treated measures of morphological variables could be ascribed to different factor. Constitu-tional type and individual specificity certainly plays impor-tant rule in grouping entities, which could be main cause of statistically significant differences. The reason of these differences between variables of entities placed in relative-ly similar groups can be found in biological age (Glinder, 1994). Biological age explains that some individuals grow up faster, while this process is slower and longer for oth-ers, which certainly could cause morphological differences (Malacko, Rađo, 2004).
Conclusion
Based on presented results of the research, it can be con-cluded that values of morphological measures of junior football players vary. Considering that related groups com-prise soccer players whose values treated morphological measures appoint to similar values inside, and different values between groups, which is tested by multivariate statistical methods, it can be concluded that football can be successfully played by different morphological profiles or constitution types (Matković, 1993), and it can be con-firmed that football does not demand specific body struc-ture (Puga, 1993).
Also, it is evident that morphological measures of football players sample (longitudinal and transversal dimension-ality of skeleton, volume and body mass, and underskin adipose tissue) are within optimal values range for this population (Ozoner, B., (2007). Certainly, results of this and similar resources can be used when selecting football players.
References
Bajramović, I. (2011.). Hierarchical structure of levels of anthropological characteristics and situational parameters of soccer players (PhD research). Sarajevo: Faculty of Sport and Physical education.
Barišić, V. (1996). Structural analysis of soccer play based on anthropological characteristics (Master Research Pa-per). Zagreb: FFK.
Glinder i sur. (1994) Fusball – Praxis, zweite teil. Numberg: Spritta – Veri.
Jerković, S. (1986). Relations between antropometric, dy-namometric and specific-motoric dimensions and success in soccer game (PhD Research). Zagreb: FFK.
Malacko,J., Rađo, I. (2004). Technology of sport and sport treining, sarajevo, faculty of Sport and Physical education, Sarajevo.
Marković, G. i Bradić, A. (2009). Football- integral condi-tional trening. Sarajevo: Foto Art d.o.o.
Matković, B.R. i sar. (1994) Physiological profile of top soccer players. In Science Football II. T. Reilly, J., Clarus and A. Stibbe, eds. London: E& FN Spon, pp.37-39
Mekić, M. (1985.). Canonic relation between morphologi-cal, motoric and conative characteristic with results of situ-ational tests in fotball. Kranjska Gora: Zbornik del, 209-221.Ostojić,S. (2007). Current trends in analysis of body struc-ture of sportsmen. Belgrade: Institute for medicine of sportOzener, B., Duyar, Y. and Atamturk, D. (2007) Body Com-position of Young soccer: The results of a Bioelectrical Impedance Analysis. Coll Antropol 31 (2007) 4:949-954
Puga, N., Ramos, J., Agostinho, J., Lomba I., Costa, O., and De Freitas, F. (1993) Physical profile of a first division Portuguese professional soccer team. In : Science and Football II., T. Reilly, J. Clarys and A.Stibbe, eds. London : E&FN Spon, pp. 40-42
Rađo, I., Wolf, B. (2002) Methods for qualification in sport, Faculty of Sport and Physical culture, Sarajevo
Correspondence to:Aldin JeleškovićFaculty of Sport and Physical Education, University of Sa-rajevoPatriotske lige 41, 71 000 SarajevoBosnia and HerzegovinaPhone: +387 33 668-768E-mail: [email protected]
HOMO SPORTICUS ISSUE 2 2012 19
Josipa Bradić1, Erol Kovačević2 and Asim Bradić11
Dorsifl exion range of motion does not signifi cantly infl uence balance in physically active young women1 Faculty of Kinesiology, University of Zagreb; Croatia2 Faculty of Sport and Physical Education, University of Sarajevo, Bosnia and Herzegovina
Original scientific paper
AbstractDorsiflexion range of motion is a measure offlexibility ofthe ankle joint. The amount of influence of ankle range of motion on bal-ance performance is still not clear. It is known that ankle injuries couldaffect reduced ankle range of motion, that inflexible ankles have nearly five times greater risk of ankle sprain, and that leg with history of ankle injury has a worse proprioceptive ability. The objective of this study was to examine the relationship between ankle flexibility and unilateral balance. Fourteen healthy young women (age: 21,00 ± 2,50 years, height 167,285 ± 4,496 cm, weight 61,071 ± 5,827 kg, body fat 26,514 ± 4,214 %, students of kinesiology), participated in this study. The sample of variables included three tests of unilateral balance abilities (Overall, Ante-rior-Posterior and Medio-Lateral Stability Index), and one ankle flexibility measure (maximal dorsiflexion range of motion) esti-mated by performing Weight Bearing Lunge Test. There was no significant correlation between the Overall (mean: 2.04 ± 0.60; r=0.38, R2=0.14, p=0.18), Anterior-Posterior (mean: 1.66 ± 0.56; r=0.28, R2=0.08, p=0.33) and Medio-Lateral Stability Index (mean: 14,32 ± 3,4; r=0,11, R2=0,01, p=0,71) with the maximal dorsiflexion range of motion. Based on these find-ings it could be concluded that better results of unilateral balance measured on Biodex Stability System, among young, healthy physically active women, does not depend on greater dorsiflexion range of motion.
SažetakOpseg pokreta skočnog zgloba ne utječe značajno na ravnote-žu kod tjelesno aktivnih ženaOpseg pokreta pri dorzalnoj fleksiji jedna je od mjera fleksibilno-sti skočnog zgloba. Utjecaj opsega pokreta pri dorzalnoj fleksiji u skočnom zglobu na ravnotežu još nije do kraja poznat. Naime, poznato je da ozljede skočnog zgloba utječu na smanjenje opsega pokreta, da nefleksibilni skočni zglobovi imaju pet puta veći rizik od uganuća, te da skočni zglobovi s poviješću ozljeđivanja ima-ju lošije proprioceptivne sposobnosti. Namjera ove studije bila je utvrditi povezanost između fleksibilnosti skočnog zgloba i unilate-ralne ravnoteže. U studiji je sudjelovalo četrnaest zdravih, mladih, tjelesno aktivnih žena, studentica kineziologije (dob 21,00 ± 2,50 godina, visina 167,285 ± 4,496 cm, masa 61,071 ± 5,827 kg, masno tkivo 26,514 ± 4,214 %). Uzorak varijabli sastojao se od tri testa za procjenu unilateralne ravnoteže na BiodexStability su-stavu (ukupni indeks stabilnosti, indeks stabilnosti u smjeru napri-jed-natrag, indeks stabilnosti u smjeru lijevo-desno) i jednog testa za procjenu maksimalne fleksibilnosti skočnog zgloba (WeightBe-aringLunge Test). Rezultati istraživanja su pokazali kako nema statistički značajnih korelacija između ukupnog indeksa stabilnosti (2.04 ± 0.60; r=0.38, R2=0.14, p=0.18), indeksa stabilnosti naprijed-natrag (1.66 ± 0.56; r=0.28, R2=0.08, p=0.33) i in-deksa stabilnosti lijevo-desno (14,32 ± 3,4; r=0,11, R2=0,01, p=0,71) s maksimalnim opsegom pokreta u skočnom zglobu. Na temelju rezultata ovog istraživanja može se zaključiti kako kod mlade, zdrave, tjelesno aktivne ženske populacije veći opseg po-kreta u skočnom zglobu ne utječe statistički značajno na bolji re-zultat u unilateralnoj ravnoteži mjerenoj na BiodexStability sustavu.
There are lots of different considerations for maintaining joint stability. Joint stability could depends onleg strength muscle, core strength muscle, proprioceptive abilities, age, sex, body high, body mass etc., and of course, dorsiflexion range of motion (DROM), as a measure offlexibility ofthe ankle joint,is one of them. There are fewstudies (Gribble &Hertel, 2003; Hoch, Staton& McKeon, 2011) thathave examinedthe impact of DROM on unilateral balance per-formance, but there is still limited evidence regarding the
relationship between DROM and performance on clini-cal assessments of balance measures such as the Star Excursion Balance Test (SEBT) (Hoch, et al., 2011.), or Biodex Stability System (BSS) etc.. Dorsiflexion range of motioncould be particularly important for understanding lower extremity injury mechanisms. Namely, the amount of influence of ankle range of motion on dynamic balance per-formance is still not clear. The reason for this is probably multifaceted. First off all, period of last 15 years of studying dynamic postural stability probably is not enough to get the final conclusion. Furthermore Y balance test (YBT) or SEBT
HOMO SPORTICUS ISSUE 2 201220
test measures across all domains of movement (range of motion, strength, proprioception, core stability, etc.), one faulty component of any of these systems will cause a positive test (Cook, Burton, Kiesel, Rose & Bryant, 2010).
It is well known that ankle injuries couldaffect reduced ankle ROM. For example, during jogging, individuals with the chronic ankle instability (CAI) have significantly less DROM (~5%) when compared with individuals without CAI (Drewes, McKeon, Kerrigan &Hertel, 2009). Also, 59% of athletes with history of ankle sprain, complained on some residual problems, including the stiffness (15%) (Yeung, Chan, So MPhil & Yuan, 1994).Furthermore, inflexible an-kles have nearly five times greater risk of ankle sprain than the people with an average flexibility (Noronha, Refshauge, Herbert &Kilbreath, 2006).
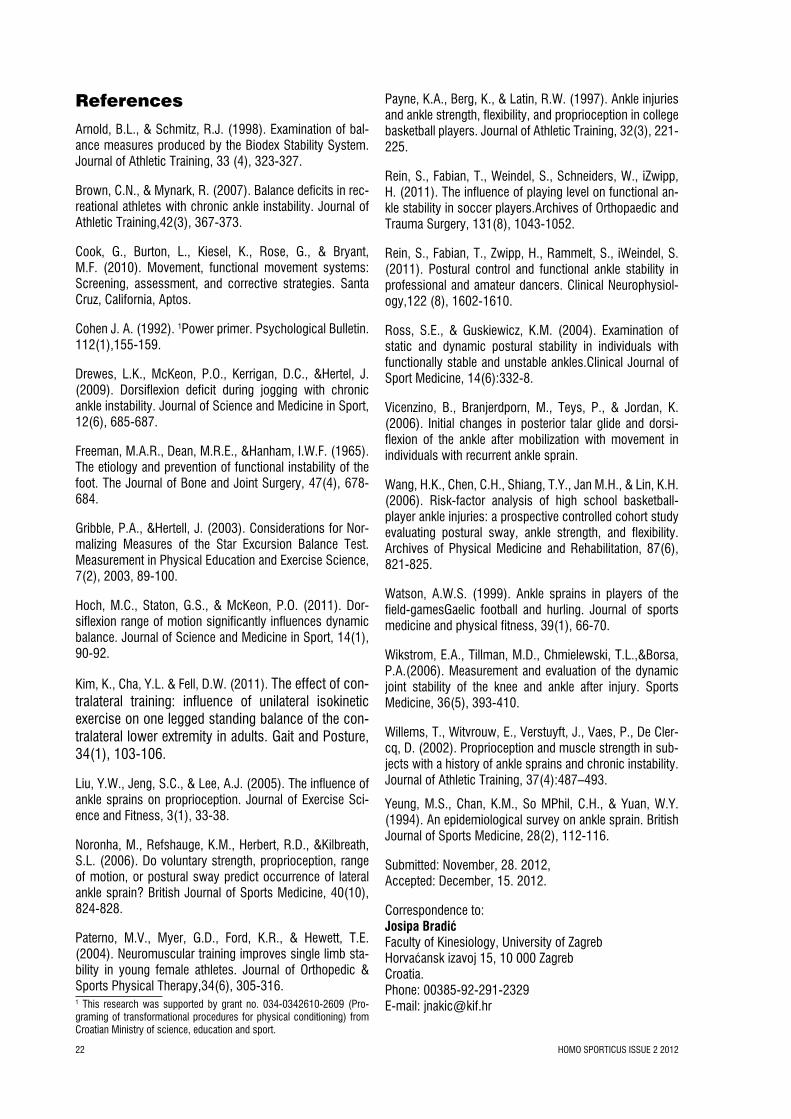
It is knownthat leg with history of ankle injury has a worse proprioceptive ability than the leg without history of leg injury (Freeman, Dean &Hanham, 1965.; Watson, 1999.; Liu, Jeng& Lee, 2005.; Ross & Guskiewicz, 2004). Also, the previous studies showed that specific proprioception deficits (Payne, Berg & Latin, 1997), postural sway deficits (Wang, Chen, Shiang, Jan & Lin, 2006) or balance deficits (Brown&Mynark, 2007) could be identified as the predic-tors in ankle injury. Still, it doesn’t means that the balance of uninvolved leg is not impared after acute contralateral ankle sprain (Wikstrom, Naik, Lodha and Caraugh, 2010). Figure 1 presents hypothetic closed circle.
Reduced ankle flexibility correlates with balance deficits (Hoch, et al., 2011),balance deficits could be identified as an ankle injury predictor (Payne, et al., 1997; Wang, et al., 2006), injury affects reduced DROM (Yeung, et al., 1994; Drewes, et al.,2009) - OR - inflexible ankles have nearly five times bigger risk of ankle injury (Noronha, et al., 2006), ankle injury has a worse balance ability (Freeman,et al., 1965.; Watson, 1999.; Liu, et al., 2005).
Based on these findings, it was assumed that greater ankle flexibility is related with better dynamic balance measured on BSS. Analyzingthe results ofthe BSSandankleflexibilitymea-surescouldadvanceour knowledgeof their relationship.
Methods
Fourteen healthy, physically active (current or former-athletes) young women(age 21,00 ±2,50 years, height 167,285 ± 4,496 cm, weight 61,071 ± 5,827 kg, body fat 26,514 ± 4,214 %, students of kinesiology, Univer-sity of Sarajevo, Bosnia and Herzegovina),participated in this study, with no history oflower extremity surgery, or any others lower extremity injuries in the last two years.InvestigationofWillems,et al. (2002) showedno statistical-lysignificant differencesbetweengroups of subjectswith no history ofleginjuryin the last twoand lastthree to five year-sinstrengthandbalance. Therefore,it is assumedthat the periodof two yearswithoutleginjury isappropriatefor this study. Our Institutional Review Board approved this study and all subjects provided a written informed consent.
All subjects reported to the research laboratory on a single occasion and performed all tests. They made a standard warm up (5 minutes of bicycle an 3 to 5 minutes of dy-namic stretching). The sample of variables included one ankle flexibility measure, and three tests of unilateral bal-ance abilities.
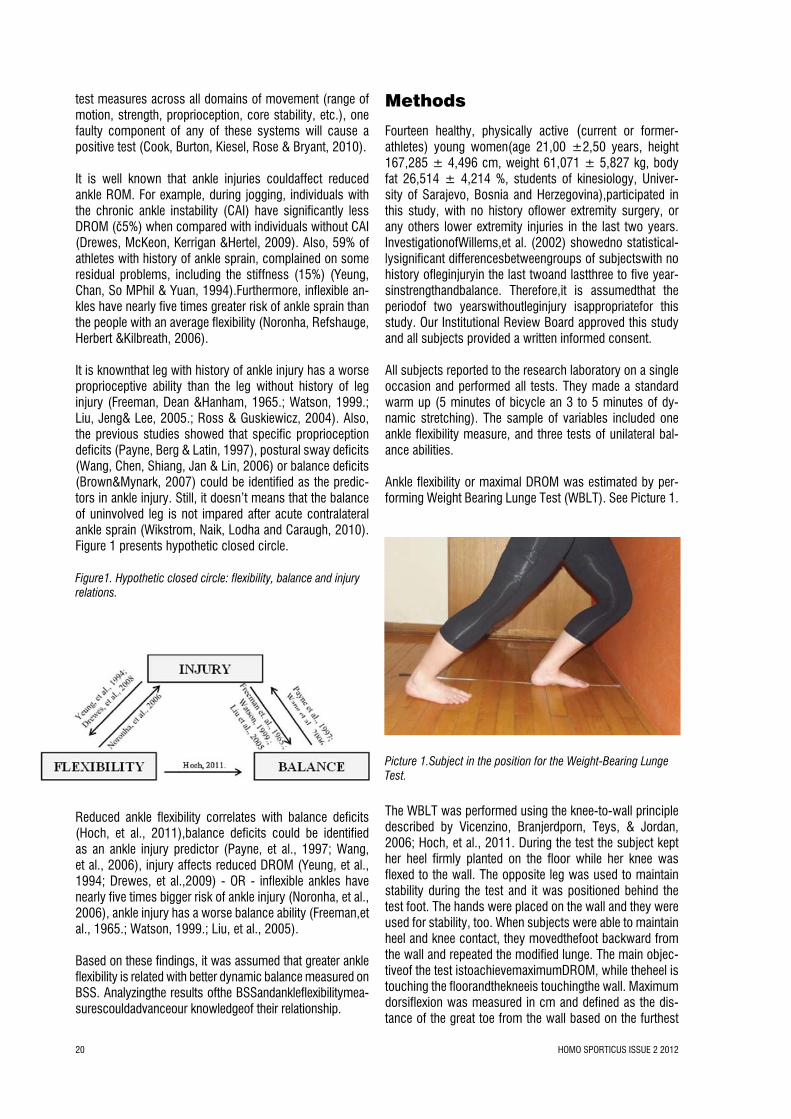
Ankle flexibility or maximal DROM was estimated by per-forming Weight Bearing Lunge Test (WBLT). See Picture 1.
Picture 1.Subject in the position for the Weight-Bearing Lunge Test.
The WBLT was performed using the knee-to-wall principle described by Vicenzino, Branjerdporn, Teys, & Jordan, 2006; Hoch, et al., 2011. During the test the subject kept her heel firmly planted on the floor while her knee was flexed to the wall. The opposite leg was used to maintain stability during the test and it was positioned behind the test foot. The hands were placed on the wall and they were used for stability, too. When subjects were able to maintain heel and knee contact, they movedthefoot backward from the wall and repeated the modified lunge. The main objec-tiveof the test istoachievemaximumDROM, while theheel is touching the floorandthekneeis touchingthe wall. Maximum dorsiflexion was measured in cm and defined as the dis-tance of the great toe from the wall based on the furthest
Figure1. Hypothetic closed circle: flexibility, balance and injury relations.
HOMO SPORTICUS ISSUE 2 2012 21
distance the foot was able to be placed, without the heel lifting off the ground, while the knee was able to touch the wall (Vicenzino, et al., 2006). Three trials were collected on each limb, averaged, and used for analysis.
Balance abilities or single-limb postural stability was as-sessed on a Biodex Stability System (BSS) (Biodex, Shir-ley, New York, USA). System reliability (coefficient of variations) is 5%. The tests of balance performance on BSS were: Overall Stability Index (OSI), Anterior–Posterior Stability Index (APSI), and Medio-Lateral Stability Index (MLSI). BSS was used in a numerous of studies before (Arnold & Schmitz, 1998; Paterno, Myer, Ford& Hewett, 2004; Rein, Fabian, Weindel, Schneiders, &Zwipp, 2011; Rein, Fabian, Zwipp, Rammelt&Weindel, 2011; Kim, Cha & Fell, 2011).
In sports shoes, with open eyes and visual feedback each subject performed 3 practice trials for each leg, alternately. All together balance testing for one subject lasted for 3 to 5 minutes. Level of stability was set at 5.The trials were collected, averaged, and used for analysis.
OSI, APSI, MLSI and the mean of the WBLT for each limb were dependent variables. To determine the presence of limb differences for each dependent measure were con-ducted dependent t-test. SimpleLinear Regression analysis was used to examine the correlation (r) and proportion of variance (r2) explained among the 4 dependent variables. Alpha level was set a priori at p<0.05.
Also, the number of 14 subjects is actually 28 entitiesbe-cause each subject tested both legs. Population off young, healthy, physically active women is large population. For alarge population, and for a significance tests of a sample r at α = 0,05, the necessary sample size = 28. So, the 28 is the minimum number of entities for medium effects size at Power 0,80 (Cohen, 1992).
Results
The MLSI variablesof the BSS (mean: 1,4 ± 0,49) was not significantly correlated to the WBLT (mean: 14,32 ± 3,4; r=0,11, R2=0,01, p=0,71). There was no significant cor-relation between the WBLT and APSI variables(mean: 1.66 ± 0.56; r=0.28, R2=0.08, p=0.33). Also there were no significant correlations between the WBLT and OSI vari-ables (mean: 2.04 ± 0.60; r=0.38, R2=0.14, p=0.18).
Discussion
The main findings of this investigation showed that greater DROM does not significantly influence balance measured on BSSin the population with no history ofankle injury in the last two years.The authorsare not familiarwith research on therelationship between ankle DROM and balance ability measured on BSS. There are few studies which investigat-
ed correlations between ankle DROM and dynamic balance measured with SEBT test (Gribble &Hertell, 2003., Hoch, et al., 2011), andtheir findings are similar with ours.
Both of these investigations made a normalizations excur-sion data to the leg length. In our study correlation between height and ankle DROM measured by WBLT was not sig-nificant (0,066), and therefore any kind of normalization was not applied.
Gribble andHertell (2003) investigated correlation between DROM (measured by goniometer) and distance in SEBT test. There was no significant relation between the ankle DROM and excursion distance. In other words, there is no significant correlation between DROM and balance abili-ties. Our study showed the same.
Similar findings had a Hoch, et al. (2011). They investigat-ed relationship between the DROM (measured by WBLT) and excursion distance. The result showed that WBLT ex-plained a significant proportion of the variance only within the anterior reach distance. In posteromedial and postero-lateral directions there were no significant correlations with the result in WBLT. Their findings are contradicted to the findings off Gribble and Hertell (2003) only in the part of anterior reach distance. Our study showed that DROM does not significantly influence balance performance on BSS in any direction. The reason for these contradictory results of correlation DROM and balance in anterior reach distance may be in the facts that balance was measured in different ways. SEBT test uses a solid base (ground) and BSS use a circular platform that is free to move around the anterior-posterior and medial-lateral axes simultaneously.
Conclusion
The samples of entities in this studywerehealthy,physicallyactiveyoungwomen with no history ofleg injuries in the last two years, so it is assumed that their DROM was not decreased. Based on these findings it could be concluded that better results of unilateral balance measured on Biodex Stability System, among young, healthy physically active women, does not depend on greater dorsiflexion range of motion. And opposite, greater DROM does not significantly influence balance in physically active young women.
The future investigations should examine the relationship between DROM and balance performance, especially in the part of anterior reach distance, among different popula-tion. This especially refers to the population with history of leg surgery or injuries. It is important to find out does decreased DROM influence balance performance and in witch directions.
HOMO SPORTICUS ISSUE 2 201222
References
Arnold, B.L., & Schmitz, R.J. (1998). Examination of bal-ance measures produced by the Biodex Stability System. Journal of Athletic Training, 33 (4), 323-327.
Brown, C.N., & Mynark, R. (2007). Balance deficits in rec-reational athletes with chronic ankle instability. Journal of Athletic Training,42(3), 367-373.
Cook, G., Burton, L., Kiesel, K., Rose, G., & Bryant, M.F. (2010). Movement, functional movement systems: Screening, assessment, and corrective strategies. Santa Cruz, California, Aptos.
Cohen J. A. (1992). 1Power primer. Psychological Bulletin. 112(1),155-159.
Drewes, L.K., McKeon, P.O., Kerrigan, D.C., &Hertel, J. (2009). Dorsiflexion deficit during jogging with chronic ankle instability. Journal of Science and Medicine in Sport, 12(6), 685-687.
Freeman, M.A.R., Dean, M.R.E., &Hanham, I.W.F. (1965). The etiology and prevention of functional instability of the foot. The Journal of Bone and Joint Surgery, 47(4), 678-684.
Gribble, P.A., &Hertell, J. (2003). Considerations for Nor-malizing Measures of the Star Excursion Balance Test. Measurement in Physical Education and Exercise Science, 7(2), 2003, 89-100.
Hoch, M.C., Staton, G.S., & McKeon, P.O. (2011). Dor-siflexion range of motion significantly influences dynamic balance. Journal of Science and Medicine in Sport, 14(1), 90-92.
Kim, K., Cha, Y.L. & Fell, D.W. (2011). The effect of con-tralateral training: influence of unilateral isokinetic exercise on one legged standing balance of the con-tralateral lower extremity in adults. Gait and Posture, 34(1), 103-106.
Liu, Y.W., Jeng, S.C., & Lee, A.J. (2005). The influence of ankle sprains on proprioception. Journal of Exercise Sci-ence and Fitness, 3(1), 33-38.
Noronha, M., Refshauge, K.M., Herbert, R.D., &Kilbreath, S.L. (2006). Do voluntary strength, proprioception, range of motion, or postural sway predict occurrence of lateral ankle sprain? British Journal of Sports Medicine, 40(10), 824-828.
Paterno, M.V., Myer, G.D., Ford, K.R., & Hewett, T.E. (2004). Neuromuscular training improves single limb sta-bility in young female athletes. Journal of Orthopedic & Sports Physical Therapy,34(6), 305-316.
Payne, K.A., Berg, K., & Latin, R.W. (1997). Ankle injuries and ankle strength, flexibility, and proprioception in college basketball players. Journal of Athletic Training, 32(3), 221-225.
Rein, S., Fabian, T., Weindel, S., Schneiders, W., iZwipp, H. (2011). The influence of playing level on functional an-kle stability in soccer players.Archives of Orthopaedic and Trauma Surgery, 131(8), 1043-1052.
Rein, S., Fabian, T., Zwipp, H., Rammelt, S., iWeindel, S. (2011). Postural control and functional ankle stability in professional and amateur dancers. Clinical Neurophysiol-ogy,122 (8), 1602-1610.
Ross, S.E., & Guskiewicz, K.M. (2004). Examination of static and dynamic postural stability in individuals with functionally stable and unstable ankles.Clinical Journal of Sport Medicine, 14(6):332-8.
Vicenzino, B., Branjerdporn, M., Teys, P., & Jordan, K. (2006). Initial changes in posterior talar glide and dorsi-flexion of the ankle after mobilization with movement in individuals with recurrent ankle sprain.
Wang, H.K., Chen, C.H., Shiang, T.Y., Jan M.H., & Lin, K.H. (2006). Risk-factor analysis of high school basketball-player ankle injuries: a prospective controlled cohort study evaluating postural sway, ankle strength, and flexibility. Archives of Physical Medicine and Rehabilitation, 87(6), 821-825.
Watson, A.W.S. (1999). Ankle sprains in players of the field-gamesGaelic football and hurling. Journal of sports medicine and physical fitness, 39(1), 66-70.
Wikstrom, E.A., Tillman, M.D., Chmielewski, T.L.,&Borsa, P.A.(2006). Measurement and evaluation of the dynamic joint stability of the knee and ankle after injury. Sports Medicine, 36(5), 393-410.
Willems, T., Witvrouw, E., Verstuyft, J., Vaes, P., De Cler-cq, D. (2002). Proprioception and muscle strength in sub-jects with a history of ankle sprains and chronic instability. Journal of Athletic Training, 37(4):487–493.
Yeung, M.S., Chan, K.M., So MPhil, C.H., & Yuan, W.Y. (1994). An epidemiological survey on ankle sprain. British Journal of Sports Medicine, 28(2), 112-116.
Correspondence to:Josipa BradićFaculty of Kinesiology, University of ZagrebHorvaćansk izavoj 15, 10 000 ZagrebCroatia. Phone: 00385-92-291-2329E-mail: [email protected] This research was supported by grant no. 034-0342610-2609 (Pro-
graming of transformational procedures for physical conditioning) from Croatian Ministry of science, education and sport.
HOMO SPORTICUS ISSUE 2 2012 23
Damira Vranešić-Hadžimehmedović1, Ifet Mahmutović1 and Izet Bajramović1
Transformation Processes of Young Childrens Basicmotor Abilities, Affected by Specifi c Swimming program1 Faculty of Sport and Physical Education, University of Sarajevo, Bosnia and Herzegovina
Original scientific paper
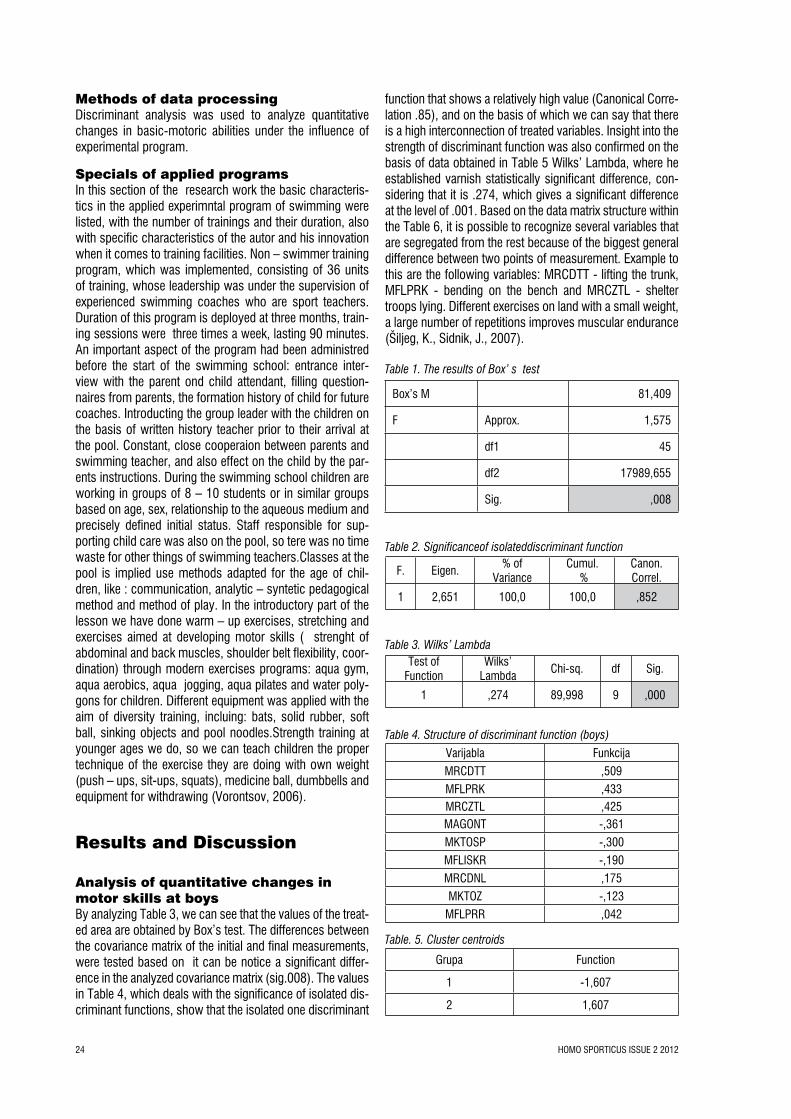
AbstractThe aim of the research is to determine the level of change in basic motor abilities of non-swimmers, under the influence of the experimental swimming program The study was conducted on a sample of 70 entities, age of 6-9 years, boys and girls, divided into two separate groups according to gender. Basic aim of the swimming program was learning and development of tehnical knowledge in swimming tehniques, breaststroke, freestyle and backstroke. Duration of the experimental swimming program was 90 days. To monitor motor abilities we choose simple and well known tests: agility on the ground, agility in the air, coordination with bat, lifting the trunk, lying hull lift, lying leg lift, flex with stick, straddle bend forward, forward bend on the bench. The study data of the initial and final measurements were subjected to discriminant analysis, with the aim of determining significant difference between the two points of measurement. The variables of basic motor skills that have sustained change are the variables that assessed flexibility and strength.
Key words: Transformation processes, basic motor abilities, specific swimming program, discriminative analysis.
Introduction
Managing the training process requires knowledge of the factors that correlate with positive changes under the in-fluence of kinesiology operators. More studies tends to the solution of this task , treating different indicators of sport effects , apllying different statistical analyzes. Sci-entists, swimming coaches and teachers of physical edu-cation and health, which are involved in swimming train-ing, should permanently strive to improve new swimming teaching methods . Trainers task should be to affects with a very designed basic training,on development of multidi-mensional swimmer (Faccioni, 2006). Constant by using identical methods of teaching and coaching swimming, the assumption is that you will receive identical results. Any person who is involved in swimming can create innovative strategies that can in some way contribute to the qualitative effects of training. Swimming is an activity that involves the ability of a man to keep his place or to be moving on the water surface with his own movements of his own lo-comotion (Rađo,I.., 1998). Recent scientific research has been done on the territory of Bosnia and Herzegovina, sug-gest that different swimming programs, in addition to im-proving swimming techniques, can greatly affect the motor potential respondents of different populations (Rađo,I., I., 1998.; Solaković, E., 2007.; Popo, A. 2006, \edović, D., 2006.). The aim of of this study is to determine the level of change in basic motor abilities of non-swimmers, under the influence of the experimental swimming program.
Methods
The sample of respondentsThe study was conducted on a sample of 70 young boys and girls of school age (6 – 9 years old), attends school swimming in the water sports club association „Dami“. Girls and boys were clinically healthy with no psycho – physical disorder. Participiants of the program, did not have any motor information on the tehiques of swimming, so they all belonged to the category of non – simmers.
Sample of variablesSample of variables for assessing the basic motor skills.Variables to evaluate coordination:
1.Agility on the ground (MAGONT)2.Agility in the air (MKTOZ)3.Coordination with the bat (MKTOSP)
Variables to evaluate repetitive strength:1.Lifting the trunk (MRCDTT)2.Shelter troops lying (MRCZTL)3.Lifting the leg lying (MRCDNL)
Variables for assessing the flexibility:1.Flex with stick (MFLISKR)2.Straddle forward bend (MFLPRR)3.Lean forward on the bench (MFLPRK)
HOMO SPORTICUS ISSUE 2 201224
Methods of data processingDiscriminant analysis was used to analyze quantitative changes in basic-motoric abilities under the influence of experimental program.
Specials of applied programsIn this section of the research work the basic characteris-tics in the applied experimntal program of swimming were listed, with the number of trainings and their duration, also with specific characteristics of the autor and his innovation when it comes to training facilities. Non – swimmer training program, which was implemented, consisting of 36 units of training, whose leadership was under the supervision of experienced swimming coaches who are sport teachers. Duration of this program is deployed at three months, train-ing sessions were three times a week, lasting 90 minutes. An important aspect of the program had been administred before the start of the swimming school: entrance inter-view with the parent ond child attendant, filling question-naires from parents, the formation history of child for future coaches. Introducting the group leader with the children on the basis of written history teacher prior to their arrival at the pool. Constant, close cooperaion between parents and swimming teacher, and also effect on the child by the par-ents instructions. During the swimming school children are working in groups of 8 – 10 students or in similar groups based on age, sex, relationship to the aqueous medium and precisely defined initial status. Staff responsible for sup-porting child care was also on the pool, so tere was no time waste for other things of swimming teachers.Classes at the pool is implied use methods adapted for the age of chil-dren, like : communication, analytic – syntetic pedagogical method and method of play. In the introductory part of the lesson we have done warm – up exercises, stretching and exercises aimed at developing motor skills ( strenght of abdominal and back muscles, shoulder belt flexibility, coor-dination) through modern exercises programs: aqua gym, aqua aerobics, aqua jogging, aqua pilates and water poly-gons for children. Different equipment was applied with the aim of diversity training, incluing: bats, solid rubber, soft ball, sinking objects and pool noodles.Strength training at younger ages we do, so we can teach children the proper technique of the exercise they are doing with own weight (push – ups, sit-ups, squats), medicine ball, dumbbells and equipment for withdrawing (Vorontsov, 2006).
Results and Discussion
Analysis of quantitative changes in motor skills at boysBy analyzing Table 3, we can see that the values of the treat-ed area are obtained by Box’s test. The differences between the covariance matrix of the initial and final measurements, were tested based on it can be notice a significant differ-ence in the analyzed covariance matrix (sig.008). The values in Table 4, which deals with the significance of isolated dis-criminant functions, show that the isolated one discriminant
function that shows a relatively high value (Canonical Corre-lation .85), and on the basis of which we can say that there is a high interconnection of treated variables. Insight into the strength of discriminant function was also confirmed on the basis of data obtained in Table 5 Wilks’ Lambda, where he established varnish statistically significant difference, con-sidering that it is .274, which gives a significant difference at the level of .001. Based on the data matrix structure within the Table 6, it is possible to recognize several variables that are segregated from the rest because of the biggest general difference between two points of measurement. Example to this are the following variables: MRCDTT - lifting the trunk, MFLPRK - bending on the bench and MRCZTL - shelter troops lying. Different exercises on land with a small weight, a large number of repetitions improves muscular endurance (Šiljeg, K., Sidnik, J., 2007).
Table 1. The results of Box’ s test
Table 2. Significanceof isolateddiscriminant function
Table 3. Wilks’ Lambda
Table 4. Structure of discriminant function (boys)
Table. 5. Cluster centroids
Box’s M 81,409
F Approx. 1,575
df1 45
df2 17989,655
Sig. ,008
F. Eigen.% of
VarianceCumul.
%Canon.Correl.
1 2,651 100,0 100,0 ,852
Test of Function
Wilks’ Lambda
Chi-sq. df Sig.
1 ,274 89,998 9 ,000
Varijabla Funkcija
MRCDTT ,509
MFLPRK ,433 MRCZTL ,425 MAGONT -,361
MKTOSP -,300
MFLISKR -,190
MRCDNL ,175
MKTOZ -,123
MFLPRR ,042
Grupa Function
1 -1,607
2 1,607
HOMO SPORTICUS ISSUE 2 2012 25
After a global analyzing of boys results in quantitative changes , it can be concluded that the program and with its facilities and duration primarily affected the variable strength of the hull, the flexibility of the lower back and the back of the upper leg. The existing result can be explained by the fact that the entire swimming program pervaded material intend-ed for improving and developing strength of respondents. In fact, in the introductory part of the training- activities that have been realized were water polygons, shaping exercises, aqua aerobics, water gymnastics. All these activities have been focused on preparing the body for the upcoming ef-forts, and of course for the specifics of this experimental swimming program, strengthening the muscles that support the spinal column (stomach and spinal muscles). In the fur-ther of the training swimming elements were adopting,also components of three basic swimming techniques for free-style, backstroke and breaststroke. Therefore it can be as-sumed that a large number of praticular movements was realized, with hands, feet, isolated on land and in water, as well as a lot of swimming in the pool with diferent swim-ming tehniques, especially near the end of the program implementation. Thinking of the period after the children had mastered most of the content of the training process of swimming. Constant repetition of movement with their own weight has certainly left its mark on the increase of strength, especially the functional strenght. In his research of the transformation process in swimming with the popula-tion of students, Rađo (1998) presents the obtained results and explain relevant items related to the process of testing and its impact on the ultimate outcome of the testing. Based on these results, it can be determined that there was a sig-nificant shift in the global test of motor ability in the interval which included swimming program. The largest contribution to the discriminant function have tests that are a measure of coordination, repetitive strength and flexibility. Contribution to these changes probably can be overwritten to the experi-ence gained by the participants during the first measure-ment, in which they introduced complexity and structure of movement - a collection of activities covered by the appli-cable measuring instruments. The global improvement of the results, which was achieved in the second measure-ment , is probably a result of reducing the time required to understand and remember the order of the tasks in the tests, which is always present, at the first encounter with the com-plex motor functions. It is also important to emphasize that the assumption is been present how many respondents at the start swam over to “force”, because they did not know the technique of swimming. At the end of training, in the final part of every training units Pilates exercises, stretching and relaxation exercises appropriate to the age of young chil-dren have been done. The aim was to stretch the muscles, increase spinal mobility, range of motion in the joints and relax. All the exercises were designed to be easy to adopt, not to be too hard for the heterogenous group of children participants of the program, to be dynamic and interesting because of , the absence of attention to children in this age. Variable MFLPRR - straddle forward bend is the one with the least significant transformation. The explanation can be
found in the fact that the exercises to increase the flexibility of the inguinal were realized only through passive stretching in the final part of the lesson, while during the adoption train-ing of swimming techniques, did not paid much attention to the same, it also did not specially permeated through the swimming program. Based of the table 7.centroidi group, was confirmed that the transformation occurred in favor of the final measurement, in the first three variables with the highest projection in the discriminant functions, and also at coordination variables with slightly lower projection. In fact, inverse scaling, based on the negative, it is clear that the young swimmers needed less time to realize the out the tests in this area as the part of the final measurement.
Analysis of quantitative changes in motor skills at girlsBoxes test (Table 8) confirmed the statistical significance (p = .001), there with terms were acquired for entry into further mechanical processing of data obtained for girls. Based on the value of the canonical correlation .66, presented in Table 7, it is possible to conclude that there is a significant connection and that in further analysis larger number of variables will ac-qired, which have a high contribution to the discriminant func-tion.Values of discriminant strength was expressed over ’Wilk lambda test (Table 10), and in this case is relatively high .560.
Table 6. The results of Box’ s test
Table 7. Significanceof isolateddiscriminant function
Table 8.Wilks’ Lambda
Table 9. Structure of discriminant function (girls)
Box’s M 203,144
F Approx. 3,895
df1 45
df2 16097,390
Sig. ,000
F. Eigen.% of
VarianceCumul.
%Canon.Correl.
1 ,786 100,0 100,0 ,663
Test of Funct.
Wilks’ Lambda
Chi-sq. df Sig.
1 ,560 37,975 9 ,000
Varijabla Funkcija
MFLRK ,711
MRCZTL ,452
MRCDNL ,393
MRCDTT ,316
MKTOSP -,287
MAGONT -,253
MFLISKR -,248
MKTOZ -,245
MFLPRR ,146
HOMO SPORTICUS ISSUE 2 201226
Table 10. Cluster centroids
Based on previous research, it is well known that girls have a higher elasticity compared to boys. This knowledge could be linked to the final result and assume that girls have a better starting point compared to boys at the initial testing, and that the extra work through the implementation of the content experimental swimming program did really great progress. Taking the general size of the numerical values of variables tested as the part of discriminant func-tion in boys and girls, we can see the difference in favor of girls. In a study from 1988., where training was realized with adult non-swimmers, the authors have demonstrated the dominance of training results of girls . It is surprising that at the end of training the girls were most success-ful, although they at the beginning of the experiment had _ most modest results and they showed the most mod-est background. Is obvious that girls have the ability to quickly acquire motor movements in the water,it can be because of some disposition of the constitutional charac-ter (higher percentage of body fat, the lighter bones ) and as previously observed being relaxed in performing some of tasks. Next to the varijables of flexibility,in the analysis of Table 11, other variables with high projections on iso-lated discriminant function have variable MRCZTL - shelter troops lying down, MRCDNL - lying leg lift. Development of specific strength in young athletes strength in water is an important factor in the good-establishment swimming techniques (Vorontsov, 2006). Based on the correlation applied to the first discriminant function, with variables which are different in first from the the second test, it can be concluded as by boys, variables that dominate were re-petitive strength of the hull and flexibility. The difference compared to boys is a variable with a maximum projec-tion. In girls it is flexibility, which represents the forward bend on the bench, while in boys that is strength of the abdominal muscles, which is represent by lifting the trunk. Comparing the results from the below table with the con-clusions reached by Rađo (1998.)the similarities can be recognized . Rađo in his work discuss that maybe swim-ming program with his specific content situational type and also volume increased workload favorable impact in the first place affect growing of agility, strength and flexibility. The variable with the lowest projection in both boys and girls is the same, and it is a variable straddle forward bend. Even girls has a higher projection, compared to the other variables in the presented structures discriminant function, it can be underline that in this part of the program not so much importance was given to stretching this part of body which subjects passed Explanation of larger projections mentioned variables for girls, it is possible to find in the fact that girls have had a more pronounced body flexibility
compared to boys in the beginnig. High numerical value of the variable shelter troops lying in girls and boys, indicating a significant increase in strength of thoracic back muscles. Knowing well the program which was implemented in three months, it can be conclude that this increase is a result of the dominant practicing breaststroke and backstroke crawl technique during the training. To make conclusions about the effectiveness of the program, it is possible to under-line, that the quarterly cycle primarily positive effect on increasing flexibility, also to a large extent on the strength of the hull. Group centroid analysis was confirmed that the numerical values of the variables are in favor of the final measurement
Conclusion
Based on the results obtained by discriminant analysis, there is a reasonable possibility discuss that occurred significant quantitative changes in motor abilities of boys and girls are present after three months of practicing an experimental training program for non-swimmers younger adolescents. Very important is that these changes oc-curred in motor skills coordination, which is known from previous studies, to be the best, most development in this younger age . Authors Malacko and Rađo (2004.) state that innateness for coordination is around 80%, so that the development of this capability should also commence in early childhood , in sensibility periods or “critical” stage, when they can be most optimal reaction on body to the coordinating of applied training facilities. Also, at increase abdominal strength and back muscles, then the flexibility that have a dominant role in the proper growth and devel-opment of children of this age. Authors Hadžikadunić and Balta (2000.) in their book about correcting posture of chil-dren note that the backspine is the wearer of body weight, and most of the load. Today’s youth grows faster, bio-logical evolution is accelerating, but their muscle strength does not follow the rapid rast. Low mobility and modern lifestyles affect the development of a weak muscle. For children with underdeveloped musculature a inhently bad posture is formed. Specific activities implemented in the above-mentioned program, surely could contribute to the positive transformation of motor skills program participants and providing quality adoption planned records, and finally promoting swimming as a fun and interesting program and also different accompanying exercise that were done in the water. The importance of knowledge of swimming as a basic psycho-physical skill, is not falling, it is growing. Knowledge of swimming as a form of human activity which the people actively engaged in the developed countries, taking the lead among the sports and recreational activi-ties. Seems to be a evolutionary process that is inevitable and that is being developed with the increase of civilization. In the developed countries of Western and Eastern Euro-pean non-swimmer swimming training is an obligatory part of the educational process of education (Sink, I. 1988).
Gruop Function
1 -,874
2 ,874
HOMO SPORTICUS ISSUE 2 2012 27
References
Faccioni, A. (2006) Speed and Condtioning Consultant; Young Athlete Conditioning. www.coachesinfo.com-arti-cle-295.
\edović, D. (2006) Effects twenty-five hours of non - swimmers training of junior school age, Graduate work. Faculty of Sport and Physical Education, University of Sa-rajevo.
Hadžikadunić, M. Balta, S. (2000). Corrects posture in children of preschool age. Faculty of Sport and Physical Education, Sarajevo.
Malacko, J., Rađo, I. (2004). Technology of sport and sports training. Faculty of Sport and Physical Education, University of Sarajevo.
Popo, A. (2006) Effects twenty-five hours of non - swim-mers training of junior school age, Graduate work. Faculty of Sport and Physical Education, University of Sarajevo.graduate work
Radjo, I. (1998). Transformation processes of motor and functional skills and various aspects of swimming. The doctor thesis. Faculty of Physical Education, Sarajevo.
Solaković, E. (2007). Effects of programmed swimming to improve swimming efficiency and success in performance swimming technique of students. Master’s thesis. Faculty of Physical Education, Sarajevo.
Šiljeg, K., Sidnik, J. (2007). Goals and methodical bench-marks conception of inicial training cycle by 14 years swimmers, Conditioning prepering of athletes, Zagreb.
Šink, I. (1987). The current state of training non-swim-mers and further directions, Proceedings of the Second Conference of Yugoslavien Swimming education Training Pančevo.
Vorontsov, A. (2006). Development of Basic and Special Endurance in Age-Group Swimmers. www.coacesinfo.com-article-295.
Vranešić-Hadžimehmedović, D. (2011). Transformation processes of basic motor abilities and morphological char-acteristics of programmed swimming program. Master’s thesis. Faculty of Sport and Physical Education, Sarajevo.
Correspondence to:Damira Vranešić - HadžimehmedovićFaculty of Sport and Physical Education, University of Sa-rajevoPatriotske lige 41, 71 000 SarajevoBosnia and HerzegovinaPhone: +387 33 668-768E-mail: [email protected]
HOMO SPORTICUS ISSUE 2 201228
Edin Mirvić1
The Level of Transformational change in Motor Skills Under the Infl uence of Swimming Program1 Faculty of Sport and Physical Education, University of Sarajevo, Bosnia and Herzegovina
Original scientific paper
AbstractThe main goal of this research is to determine the level of trans-formational change in motor abilities influenced by swimming program. The Sample of study were male students of the first and second years of primary studies, Faculty of Sport and Physical Education, University of Sarajevo, the academic year 2009/2010, age 20-22. In this study were tested 106 students, and study was conducted on a regular teaching of the subject swimming. The variables used to assess motor skills are the following: to assess coordinate (slalom with three medical ball, coordination with bat, backward polygon), to assess the factors speed (running at 20 meters high running start, side steps, hand tapping, foot tapping), to assess explosive strength (standing long jump seats, throwing a medicine ball from a seated position, jump up with spaces), to evaluate repetitive strength (chin-venture with the shaft, push-ups, lifting troops from lying), to assess the flexibility (flex, dorsal flexion of the foot, foot plantar flexion, inversion-internal-rotation supinatio, eversion-rotation, external-pronatio measured gravity protractor, retoflecsion hand - extension, elevation posterior - no rotation of the upper arm). Application of discriminative analy-sis, it was concluded that the research program in this content, a favorable impact on the treated properties. The greatest impact of swimming with the student population in relation to other vari-ables was the variable long jump. Also, there was concluded that when implementing the techniques of swimming there was a gen-eral development of motor skills..
Key words: transformation, motoric skills, the swim, discrimi-native analysis
SažetakNivo transformacionih promjena motoričkih sposobnosti pod utjecajem programa plivanjaOsnovni cilj ovog istraživanja je utvrđivanje nivoa transformaci-onih promjena motoričkih sposobnosti pod utjecajem programa plivanja. Uzorak ispitanika činili su studenti prve i druge godine osnovnog studija Fakulteta sporta i tjelesnog odgoja, Univerzite-ta u Sarajevu, akademske 2009/2010. godine, starosti 20 – 22 godina, muškog spola. Uzorak je predstavljao 106 studenata, a istraživanje je provedeno na redovnoj nastavi iz nastavnog pred-meta plivanje. Korištene varijable za procjenu motoričkih sposob-nosti su sljedeće: za procjenu koordinacije (slalom sa tri medi-cinke, koordinacija sa palicom, poligon natraške), za procjenu faktora brzine (trčanje na 20m visokim startom, koraci u stranu, taping rukom, taping nogom), za procjenu eksplozivne snage (skok u dalj iz mjesta, bacanje medicinke iz sjedećeg stava, skok uvis s mjesta), za procjenu repetitivne snage (zgibovi na vratilu sa pothvatom, sklekovi, podizanje trupa iz ležanja), za procjenu gipkosti (iskret, dorzalna fleksija stopala, plantarna fleksija sto-pala, inverzija-rotatio interna-supinatio, everzija-rotatio externa-pronatio mjerena je gravitacionim uglomjerom, retofleksija ruku - extensio, elevatio posterior - bez rotacije nadlaktice). Primje-nom diskriminativne analize došlo se do zaključka da je program istraživanja svojim sadržajem, povoljno djelovao na tretirane karakteristike. Najveći utjecaj programa plivanja kod studentske populacije u odnosu na druge varijable bio je na varijablu skok u dalj. Prilikom realizacije programa plivačke tehnike došlo je i do općeg razvoja motoričkih sposobnosti.
Ključne riječi: transformacija, motoričke sposobnosti, program plivanja, diskrininativna analiza
Introduction
The anthropological characteristics include anthropological variables, that variables describe human beings and there-fore it follows that the state vector, obtained a description of a subject at a meeting of anthropological variables, a vector that defines the anthropological status of the entity. If the need arises and to determine the status of anthropo-logical specified, it is understood that the team is defined with at least six different sets of variables and anthropo-logical status: morphological characteristics, functional characteristics of organ systems, motoric skills, cognitive characteristics, conative characteristics and health sta-
tus of the individual. In sports and physical education are taught that motor skills were multidimensional, because one tends to round development of their potential. Motor skills, as a prerequisite for quality performance sports tech-nique, are so important for other daily living needs. Thanks to the development of mathematical and statistical meth-ods, algorithms, especially computer technology, it has al-lowed a detailed study of the emergence of a large number of elements in the interaction. All phenomena can be seen as multilateral including motor skills and other changes re-lated to the development of science and contributed to a different approach to the classification and systematization of human movement. Swimming, can also be affected by
HOMO SPORTICUS ISSUE 2 2012 29
the level of development of motor skills, but the adoption of the swimming technique to a level where they can act on the motor skills is a very complex, so it takes a longer period of time to work on raising awareness of swimming technique, which only adopted when the quality (level spe-cialization and automation) can act to increase motor skills. Until then, activity and inactivity of muscle is not synchro-nized, so that in this period, more swimming takes place in anaerobic conditions and the development of motor skills is the best possible level (Wertheimer and Zoretic, 2010.). That the alleged influence of swimming on motor skills and research confirms the obvious, like Rather‘s research (1997) is a sample of 109 students from the Faculty of Sport and Physical Education, wich stated that “the func-tion of success in swimming, the variables of coordina-tion, explosive and repetitive strength , speed, flexibility and speed of the nerve-muscle reaction. “Had the motor skills important for the achievement of the results, which in turn depends on the program prepared for the gradual training of those physical properties that are dominant in achieving the maximum or competing achievements demonstrated in his research with Olbrecht (2000), Sweetenham and At-kinson (2003) Milišić (2003) Bompa and Carrera (2005). That research, based on current knowledge and results of research in basic motor skills give us conclusion that the entire system of the variables has a significant statistical correlation with swimming (Jorgić et al. 2010, Abe et al., 2006.). In this study, whose primary goal is to determine the level of transformational change in motor abilities under the influence of swimming, it is sufficient to note that the successful implementation of these transformations affect indisputable and morphological characteristics, functional ability and cognitive - conative components that contribute to the formation of an optimal individual style that is later, a significant effect of motor transformation (Volčanšek, 2002). All this studies have standardized tests, such as in this study used simple tests (Leko, G. and N. Grcic-Zubčević, 2004). This tests checked transformation under the influence of motor abilities of swimming, which was the main goal of this research.
Methods
Sample of respondentsA sample of this study consists of male students, the first and second years of basic studies, Faculty of Sport and Physical Education, University of Sarajevo in the academic 2009/2010. aged 20-22 years. The sample was selective degrees criteria for admission to the Faculty of Sport and Physical Education, University of Sarajevo. The sample included 106 students, without any distinct morphologi-cal and locomotor defects. The study was conducted on a regular teaching of the subject swimming. All patients had optimal conditions for regular attendance, which was one of the prerequisites for the implementation of this research.
Sample of variablesBasted of the structure of motor skills that are defined Kurelić et al. (1975), in the present study were to assess the motor abilities of the selected variables found to cover an area of latent dimensions of perceiving and energy regu-lation, are also present in swimming. In order to facilitate the procedure when processing test results are coded so that the first letter indicates the motor area, the other two belonging to a certain latent dimension, while the last three letters indicate nominal characteristics of the measuring instrument. Psychometric characteristics of the variables can be found in research (Momi, Štalec and Wolf, 1975).
For the assessment of coordination were used the follow-ing tests:- Test - MKOS3M, slalom with three medical balls,- Test - MKOKOP, coordination with bat,- Test - MKOPOLN, polygon backwards.To estimate the speed of the factors we used the following tests:- Test - MBR20V, running the 20m high start point,- Test-MBRKUS, side steps,- Test - MBRTAR, hand tapping,- Test - MBRTAN, foot tapping.To estimate the explosive power used the following tests:- Test - MESSDM, standing long jump seats,- Test - MASBMSS, throwing a medicine ball from a seated position,- Test - MESSUM, jump up with the place.To estimate the repetitive forces were used the following test:- Test - MRSZGP, chin on the shaft with the enterprise,- Test - MRSSKL, push-ups,- Test - MRSPTL, raising troops from lying.For flexibility assessment used the following test:- Test - MFLISK, flex,- Test - MFLDFS, dorsal flexion of the foot,- Test - MFLPFS, plantar flexion foot- Test - MFLRIS, inversion-internal-rotatie supinatio,- Test - MFLREP, eversion-rotatie external-pronatio mea-sured gravity protractor,- Test - MFLRFR, refl exion hand - extension, ELEVATIO posterior - no rotation arm.
Methods for processing dataData processing was performed on the multivariate level. As a method for determining the transformation process was applied discriminant analysis.
Results and Discussion
The forgoing tables presented discriminative standardized coefficients and standardized coefficients participation variables in research space in the formation of significant discriminant functions of the central group of the important function.
HOMO SPORTICUS ISSUE 2 201230
Boxes-their M-test, Table 1, to test the similarity matrix of covariance between initial and final measurements in the area of motor skills. The difference between the covarian-ce matrix is statistically significant (sig, 000), and allows access to the further procedure of discriminant analysis
Table 1. Boxov M-test
Reviewing the results presented in Tables 2 and 3, treated with discriminant analysis feature, it can be seen that the obtained one significant discriminant function whose coef-ficient canonical discrimination (856 Personnel), indicating that the association between a set of data based on the ap-propriateness of which was done by discriminant analysis and results of the discriminant function. Significance was sig = .000, and Wilks lambda =, 268th Given the amount of Wilks lambda we can conclude that the correlation prop-erties of treated statistically high. Based on the centroid groups (Table 6), the structure matrix shows that the better the outcome measurements (initial or final) if rezultatio have a negative sign, then they are better in the final measurement. Table 2. Eigenvalues
Table 3. Wilks’ Lambda
Based on the obtained results, shown in Table 4, Stan-dardized Canonical Discriminant Function Coefficients, it is evident that between the initial and final measurements isolate the following variables: taping hand - MBRTAPR (-, 135), foot tapping - MBRTAPN (-, 218), long jump from a place - MESSDM (-, 414), throwing a medicine ball from a seated position - MASBMSS (-, 220), vertical jump from a place - MESSUM (-, 158), chin on the shaft with venture - MRSZGP (-, 256 ), inversion-internal-rotatie supinatio - MFLRIS (-, 179), dorsal flexion of the foot - MFLDFS (-, 065) and raising troops from lying - MRSPTL (-, 001).
Table 4. Standardized Canonical Discriminant Function Coefficients
Based on correlation by discriminative function (Struc-ture Matrix) Table 5, we find the variables that indicate the maximum difference between the initial and final measure-ments of motor skills. These are the tests: standing long jump seats - MESSDM (-, 482); backward polygon - MKO-POLN (, 469), throwing a medicine ball from a seated po-sition - MASBMSS (-, 455); slalom with three medicine ball - MKOS3M (, 440); foot tapping - MBRTAPN (-, 396); hand tapping - MBRTAPR (-, 355), running on a 20m high start - MBR20V (, 351), side steps - MBRKUS (, 347); chin on the shaft with the venture - MRSZGP (-, 309), to raise troops from lying - MRSPTL (-, 254); coordination with bat - MKOKOP (, 231); dorsal flexion of the foot - MFLDFS (-, 227), vertical jump from a place - MESSUM (-, 223) , flex - MFLISK (-, 221); pushups - MRSSKL (-, 191); eversion-rotatie external-pronatio measured gravity protractor - MFLREP (-, 186); reflex hand - extension, EL-EVATIO posterior - no rotation arm - MFLRFR (-, 163), in-verse-rotatie internationalized supinatio - MFLRIS (-, 128), and the foot plantar flexion - MFLPFS (-, 071). According to Okičić (1999) at the age of 8-12 years children are best overcome all kinds of movement and fastest swimming acquire motor skills.
The data obtained in this study can be divided into three basic levels: results of which proved to be of high, medium and low statistical value. When the impact of swimming on motor skills are with high statistical value then includes the following motor areas: coordination, speed factor and the most explosive strength. It says that the program to be applied to the Faculty of Sport and Physical Education, when it comes to swimming has the greatest impact on the explosive force. By the results of the statistical mean value, the swim has affected to a complete set motor areas which already shows that swimming has a positive effect on the entire motor system. Also, the results with low statistical value are mainly from space flexibility, and it is known that the pliability is not genetically innate, but must acquire by training, so it can be concluded that in addition to swim-ming and partly other subjects had their effect on these results.
Based on the information, the data shows that the results given for the right to conclude the following: students in the final measurements have better results, which means that the program of swimming classes are giving results. The results obtained through this program are similar to the experimental results in the study conducted (Born, 1997). Studies have shown that there has been a significant trans-formation of motor skills in students affected by swim programs. Also, the other researchers (Majcekova, YI et al 2008, Silic, Grcic-Zubčević, Brekalo, 2007) have come up with similar findings on the transformation and scale - the relationship between motor skills and coordination skills in swimming younger swimmers with different knowledge and skills of swimming.
Conclusion
The main objective of this study was to determine the influ-ence of the level of transformational change in motor abili-ties influenced swim programs. The study was conducted with students of the first and second years of primary stud-ies, Faculty of Sport and Physical Education, University of Sarajevo, the academic 2009/2010, aged 20-22 years, male. In the sample of 106 students, with doesn’t have a distinct morphological or locomotor defects, in this study was conducted that the research program in this content, which was structured on the basis of such a favorable impact on the characteristics of the treated. The greatest impact of swimming with the student population in rela-tion to other variables was the variable long jump, which means that the program has a positive impact on the ex-plosive force. When implementing the techniques of swim-ming there was a broad development of motor skills. Also, a part of achieving progress in raising motor skills belong to the realization of practical instruction in other subjects at the Faculty of Sport and Physical Education. Variables which manifested a positive result are: backward polygon, throwing a medicine ball from a seated position, foot tap-ping, hand tapping, chin on the shaft with the venture. All this leads to the conclusion that this swimming program positively affected the entire musculature Faculty of sport and physical education. This is another proof that swim-ming has a positive effect on the entire musculature of a man and that definitely, when you stay in the water and practicing the techniques of swimming, there is equal de-velopment of complete motor skills man. Swimming is a basic sport that has the best impact on the entire man’s muscular.
References
Abe, D., Tokumaru, H., Niihata, S., Muraki, S., Fukuoka, Y., Usui, S. i Yoshida, T. (2006).
The Assessment of short-distance Breaststroke Swimming Performance with Critical Speed. Journal of Sports Science and Medicine No. 5, 340-348, an electronic magazine.
Bompa, T., Carrera, M. (2005) Periodization training for sports (Sec. Ed.), Human Kinetics, Champaign, IL.
Jorgić, B., Okičić, T., Aleksandrović, M., i Madić, D. (2010). The Influence of Basic and Specific Motor Abilities on Swimming Performance. Acta Kinesiology 4/2: 73-77
Kurelić N., Momirović K., Stojanović M., Šturm J., Radojević \., Viskić-Štalec N. (1975). The Structure and Evolution of Morphological and Motor Dimensions of youngs. Institute for Scientific Research, Faculty of Physical Education of the University of Belgrade.
HOMO SPORTICUS ISSUE 2 201232
Leko G, Grčić-Zubčević N. (2004). The selection of chil-dren for the school swimming sports in the Republic of Croatia. Kinesiology. Vol. 36. No.2.
Macejkova,Y.,I, Viczayova., D, Masarykova (2008). The Researchs of swimming coordination. 5th International Scientific Conference in Physical Education. Kinesiology. University of Zagreb.
Milišić, B. (2003) Management training, SIP - Publikum, Belgrade
Momirović, Štalec i Wolf, Kinesiology. 1975., Vol. 5, br. 1-2, str. 160-192
Okičić, T. (1999). The Influence of Training on Swimming Speed and to Change Some of the Aspects of Anthropo-logical Characteristics of Young Swimmers Categories. MA thesis. Niš: Faculty of Physical Education.
Olbrecht, J. (2000) The Science of Winning: Planing, Pe-riodizing and Optimizing Swimm Training, Swimshop, Lu-ton, England.
Sweetenham, B., Atkinson, J. (2003). Championship Swimm Training, Human Kinetics, Champaign, IL.
Šilić, N.; Grčić-Zubčević, N. i Brekalo, M. (2007). The Con-struction and validation of specific tests to assess explo-sive strength of athletes. 2 International Congress of mod-ern kinesiology, Mostar
Rađo, I. (1997). Transformation processes of motor and functional abilities and various of swimming aspects, dis-sertation, FPE, Sarajevo
Volčanšek, B. (2002.) The Swimming. Kineziološki fakultet Sveučilišta u Zagrebu.
Wertheimer, V. i Zoretić, D. (2010). The Application of ex-ercises- speed, agility and explosive power in swimming. Condition Training of Athletes. 2010. Zagreb, Croatia.
Correspondence to:Edin MirvićFaculty of Sport and Physical Education, University of Sa-rajevoPatriotske lige 41, 71 000 SarajevoBosnia and HerzegovinaPhone: +387 33 668-768E-mail:[email protected]
HOMO SPORTICUS ISSUE 2 2012 33
Adnan Ademović1, Ekrem Čolakhodžić1, Munir Talović2 and Husnija Kajmović2
Top Footballer Model Based on Indicators of Situational Effi ciency in Round of 16 at the 2010 Fifa World Cup1 Teacher Training Faculty, Džemal Bijedić University of Mostar, Bosnia and Herzegovina2 Faculty of Sport and Physical Education, University of Sarajevo, Bosnia and Herzegovina
Original scientific paper
AbstractThe aim of this research is to determine the model of top footballers on different field positions based on the indicator of situational efficiency. The research was carried out on a sample of 167 top footballers aged 19 to 39 who played the full 90-minute match length in the Round of 16 at the 2010 FIFA World Cup in South Africa. Both central and dispersion parameters were used to determine the top footballer model. Based on the results of the research, we can conclude that contemporary footballers have a mean age of 26.70 ± 3.73, a mean height of 180.29 cm ± 6.38, and that they covered a mean distance of 9,692 m ± 2,579. When their team was in ball possession players covered 3,742 m ± 1,137, and when they were not in ball possession players covered 3,917 m ± 1,197. The average number of sprints the footballers achieved was 93.33 ± 42.87 whereas the mean velocity was at 22.81 km/h ± 3.14. Based on the intensity of their activities, we can notice that footballers, on average, spend 83.87% ± 5.58 (most of their in-game time) in low intensity, 7.82% ± 2.73 in medium intensity activities and 8.41% ± 3.10 in high intensity activities. Footballers achieved 31.65 ± 15.80 successful passes, whereas there was a significantly higher mean indicator of unsuccessful passes i.e. 45.65 ± 18.15.
Key words: football, top footballers, movement, situational efficiency
Introduction
Exhibiting specific football skills and an individual’s char-acteristics as well as cooperation of team members have a significant impact on the achievement of positive results in a football match. Football consists of explosive move-ments like ball shots, turns, jumps, and sprints, all happen-ing with an average heart frequency of 80 to 90 per cent (Arnason et al, 2004). In the evolution of football, game models have often changed. Speaking of contemporary models of football today, it ought to be necessarily em-phasized that the game itself has become more dynamic, faster and harsher. Along with this, the pressure onto footballers has increased both in training and in matches. Great improvements in football along with new training methods have contributed to an overall development of the footballer’s physique (Bangsbo et al, 2006). There are two activities footballer performs in a match: activities with the ball and activities without the ball (Bangsbo et al, 2006). Taking into account the total number of players in a match and the pitch dimension, it doesn’t come as a surprise that individual player’s activities without the ball account for 95% (on average) of the effective match time. Even the total physical activity of a footballer includes a variety of different activities, the majority of that total is walking and running in different speeds and directions. Therefore,
the distance covered in a match is a global indicator of the physical demands of a football match (as well as the footballer’s total physical activity). Nowadays, top football players cover a distance of 10 to 13 km on average in a match; midfield players cover most of all players, whereas goalkeepers achieve 4km (Verheijen, 1997; Moher et al, 2003; Krusturp et al, 2005; Lago et al, 2010; Andrzejewski et al, 2012). Since players constantly change their speed during a match, it is necessary that the total distance cov-ered be divided into categories based on the velocity (in-tensity) of movement (Di Salvo et al, 2006; Barros et al, 2007; Lago et al, 2010). A majority of researchers in the world have so far managed to divide into categories the distance footballers cover in a match. However, the de-fined categories of activities differ from author to author which adds difficulty to comparing them. Moreover, latest results from Champions League analysis clearly suggest that top players, on average, of their overall time in the game (i.e. 58%) spend standing (15%) and walking (43%), about 30% running to and fro (7 to 14 km/h), about 8% run in average speed (15 to 19 km/h), about 3% of the time players run a fast speed (20 to 25 km/h), and only 1% of the time on maximum speed sprint (Moher et al, 2003). If we convert these time percentages into distances covered then we can conclude that professional players walk a dis-tance of about 4km (span: 3.2 to 4.7 km), run to and fro
HOMO SPORTICUS ISSUE 2 201234
about 4.5km (span: 3.4 to 6.1km), run in medium speed about 1.8km (span: 1.2 to 2.7km), run fast about 0.7km (span: 0.4 to 1.0km), and sprint about 0.3km (span: 0.2 to 0.4km) (Moher et al, 2003). One interesting note is to be made i.e. about 50% of the total covered distance fall onto running in a straight line, whereas the rest falls onto back-ward movement, side movement, zigzag and movement in a circle etc. (Marković and Bradić, 2008). A professional footballer performs about 30 to 35 sprints during a match, each sprint lasting 2 seconds on average.
Methodology
Sample of subjects The research was conducted on a sample of 167 top foot-ball players aged 19 to 39 who played the full 90-minute match length in the Round of 16 at the 2010 FIFA World Cup in South Africa. The sample consists of the starting lineups of the following national teams: Uruguay, South Korea, USA, Ghana, Germany, England, Argentina, Mexi-co, Holland, Slovakia, Brazil, Chile, Paraguay, Japan, Spain and Portugal.
Sample of variables The data was taken from the official FIFA web page (www.fifa.com) where we can find all parameters related to team success and situational efficiency of all players played at the 2010 FIFA World Cup in South Africa. To assess the situational efficiency of top footballers we used the follow-ing variables: AGE – age, AVIS – height, SEPRD – distance covered, SEPRDPL – distance covered in possession of ball, SEPRDBPL – distance covered without ball, SE-BRSP – number of sprints, SEMAXB – maximum speed,
SEVANIS –time activities (low), SEVASRE –time activities (medium), SEVAVIS – time activities (high) SEBUDO – number of successful passes, SEBNDO – number of un-successful passes.
Data processing methodology The data processing was conducted in SPSS 12.0 soft-ware package for Windows. Both central and dispersion parameters were measured for each variable applied. The normality of result distribution was tested based on the Skewness coefficient and the coefficient of Kurtosis.
Results and discussion
Table 1 shows the results of central and dispersion param-eters for 167 footballers who played in the Round of 16 at the 2010 World Cup. The normality of the distribution curve of the tested variables on each position (tables 1 to 5) operates in a way that we can tell that neither of them significantly deviates from normal distribution. This, more-over, shows the pervasive nature of the results and a good sensibility to applied values in this research. For a majority of the variables the Skewness and Kurtosis values range from -1 to +1.
The research includes footballers who played the full 90-minute match length in the Round of 16 of the 2010 World Cup. The average player age was 26.70 ± 3.73, whereas the average height was 180.29 cm ± 6.38. Ac-cording to studies (\urašković, Joksimović; Joksimović 2004) conducted with footballers who took part in the 2002 World Cup the average age was 27.49 ± 3.87, whereas the average height was 180.90 cm ± 6.13. Ac-cording to studies (Joksimović, Smajić, Molnar; Stanković
Table 1 – Central and dispersion parameters (all footballers)
Variable N Range Min. Max. Mean Std. Variance Skew. Kurt.
AGE 167 20.00 19.00 39.00 26.70 3.73410 13.944 .136 -.410
2009) conducted with footballers who took part in the UEFA EURO 2008 the mean age was 27.57 ± 3.98 with an average height of 182.97 cm ± 6.59. Top players’ mean age was between 25 and 27 with an age variation of about two years; in Croatia and Serbia the average is about 23 ± 3 years of age (Jerković, Jerković, Sporiš 2006). Studies of Bloomfield et al (2005) show that, out of four European football leagues, players in the German football league (Bundesliga) are tallest with a mean height value of 1.83 cm ± 0.06, whereas footballers in the Spanish La Liga are shortest with a mean height of 1.80 cm ± 0.06. Top footballers in Croatia have a mean height of 178.73 cm ± 5.81 (Jerković, Jerković, Sporiš 2006), and Serbian play-ers 181.9 cm ± 5.7. Footballers in Bosnia and Herzegov-ina, on average, age between 24.5 ± 5.7 with a height of 182.2 cm ± 6.63 (Čolakhodžić, Fazlagić, Vidović, 2010). Players covered an average distance of 9,692 m ± 2,579. When the team was in ball possession footballers covered a distance of 3,742 m ± 1,137 and when the team was not in ball possession they covered 3,917 m ± 1,197. The mean value of sprints the footballers achieved was 93.33 ± 42.87 whereas the average speed was 22.81 km/h ± 3.14. Judging by the intensity of activities we can see that footballers spent most time playing in low intensity mode i.e. 83.87% ± 5.58; in medium intensity they spent 7.82% ± 2.73 and in high activity they spent 8.41% ± 3.10 of the total match time. The players had 31.65 ± 15.80 success-ful passes on average, and 45.65 ± 18.15 unsuccessful passes.
Table 2 shows central and dispersion parameters for each goalkeeper who took part in the Round of 16 at the 2010 World Cup. The research includes 16 goalkeep-ers with a mean age of 28.25 ± 4.05, mean height of 187.12 cm ± 5.96. According to studies (Cigrovski, Kros; Martinčević 2010) conducted on goalkeepers of five na-tional leagues (Italy, Germany, France, Spain, England) in season 2008/2009, the mean goalkeeper age was 29.98 ± 4.75 with a mean height of 188.87 cm ± 3.95. Studies (Joksimović, Smajić, Molnar; Stanković 2009) which ana-lyzed goalkeepers who played the UEFA EURO 2008 had a mean age of 29.42 ± 4.76 and a mean height of 189.06 cm ± 4.54. According to studies (\urašković, Joksimović; Joksimović 2004) conducted with goalkeepers who played the 2002 World Cup, the subjects had a mean age of 29.50 ± 4.34 with a mean height of 186.42 cm ± 3.95. The goalkeepers covered a mean distance of 4,437 m ± 877; when their team was in ball possession, goalkeepers cov-ered a mean distance 1,621 m ± 328, whereas, when their team was not in ball possession goalkeepers covered 1,601 m ± 343. The mean sprint number goalkeepers performed was 8.1 ± 5.58 with a mean velocity of 17.18 km/h ± 2.46. Judging by the intensity of activities, it can be pointed out that goalkeepers, on average, spend most of their time playing in a low intensity activity mode i.e. 97.75% ± .683; medium intensity activity mode made up 1.25% ± .447 whereas 1% ± .632 went on high intensity activity mode. Goalkeepers had a mean successful pass-ing rate of 19.62 ± 8.4 and a mean unsuccessful passing rate of 34.56 ± 8.19.
Table 2. Central and dispersion parameters (goalkeepers)
Variable N Range Min. Max. Mean Std. Variance Skew. Kurt.
AGE 16 16.00 23.00 39.00 28.25 4.05 16.467 1.23 2.04
Table 3 shows central and dispersion parameters for de-fensive players who played the Round of 16 at 2010 FIFA World Cup. The research included 66 defensive players with a mean age of 27.71 ± 3.64, and a mean height of 180.57 cm ± 5.87. According to studies (\urašković, Joksimović; Joksimović 2004) conducted with defensive players who played the 2002 World Cup, defensive players had a mean age of 27.60 ± 3.65 with a mean height of 181.87 cm ± 5.57. Further studies (Joksimović, Smajić, Molnar; Stanković 2009) conducted with defensive players who took part in UEFA EURO 2008 showed that subjects had a mean age of 27.79 ± 3.56 and a mean height of 184.69 cm ± 5.43. Defensive players covered a mean distance of 10,273.42 m ± 1,780; when their team was in ball possession, defensive players covered a distance of 3,833 m ± 843 and when their team was not in ball pos-session subjects covered a distance of 4,276 m ± 826. The mean number of sprints the subjects performed was 97.83 ± 37.69 with a mean speed of 22.88 km/h ± 2.14. Considering the intensity of activities we can point out de-fensive players spent most of their time in a low intensity activity mode i.e. 83.86% ± 2.92; medium intensity activi-ties made up 7.83% ± 1.31 whereas high intensity activi-
ties made up 8.33% ± 2.04 of the overall match duration. The subjects had a mean successful passing rate of 37.30 ± 12.90 and a mean unsuccessful passing rate of 52.43 ± 16.28.
Table 4 shows the central and dispersion parameters for all midfield footballers who played the Round of 16 at the 2010 World Cup. The research includes 52 midfield play-ers with a mean age of 25.76 ± 3.78 and a mean height of 178.59 cm ± 5.84. According to studies (\urašković, Joksimović; Joksimović 2004) conducted with midfield footballers who played the 2002 World Cup, subject had a mean age of 27.28 ± 3.56 and a mean height value of 178.36 cm ± 5.55. Studies show (Joksimović, Smajić, Molnar; Stanković 2009) that midfield players on the 2008 EURO had a mean age of 26.97 ± 3.38 with their mean height value being 179.02 cm ± 5.95. The subjects cov-ered a mean value of 10,952 m ± 2,123; when their team was in possession of the ball, the midfielders covered 4,279 m ± 1,099, whereas when their team was not in ball possession the subjects covered a distance of 4,485 m ± 1,010. The mean sprint value the midfield footballers performed wad 109.34 ± 32.72 with their mean speed be-
Table 3. Central and dispersion position parameters (defensive players)
Variable N Range Min. Max. Mean Std. Variance Skew. Kurt.
AGE 66 16.00 19.00 35.00 27.71 3.64 13.285 -.365 -.653
ing 23.54 km/h ± 2.62. Based on the intensity of their ac-tivities, we can see that midfield players spent most of their time playing in a low intensity activity mode i.e. 80.07% ± 3.04; subjects spent another 9.82% ± 1.79 in a medium intensity activity mode whereas they spent 10.44% ± 1.47
of the overall match duration in a high intensity activity mode. The midfielders had a mean successful passing rate of 36.19 ± 17.56 and a 49.40 ± 19.15 mean rate of un-successful passes.
Table 5. Central and dispersion position parameters (forward players)
Variable N Range Min. Max. Mean Std. Variance Skew. Kurt.
AGE 33 12.00 20.00 32.00 25.42 2.89429 8.377 .404 -.331
Table 5 shows the central and dispersion parameters for all forward position players who took part in the Round of 16 at the 2010 World Cup. The research includes 33 forward players with a mean age of 25.42 ± 2.89 and a mean height of 179.12 cm ± 6.38. According to studies (\urašković, Joksimović; Joksimović 2004) conducted on forward position footballers who played the 2002 World Cup, the subjects aged 26.71 ± 3.82 (mean value) and had a mean height value of 180.27 cm ± 5.76. Studies (Joksimović, Smajić, Molnar, Stanković, 2009) conducted with forward players at the 2008 EURO show that the play-ers have a mean age of 27.06 ± 3.98 with their mean height being 182.60 cm ± 6.42. The subjects covered a mean distance of 9,093 m ± 1,749. When their team was in ball possession, forward players covered a distance of 3,744 m ± 748, whereas when their team was not in ball possession subjects covered a distance of 3,425 m ± 808. The mean value of sprints the forward players per-formed was 100.39 ± 28.15 with the mean speed being 24.24 km/h ± 3.07. Based on their activity intensity, we can point out that forward players spent, on average, the majority of their in-game time in low intensity activity mode i.e. 83.15% ± 3.07; a percentage of 7.84 ± 1.43, forward players spent in a medium intensity activity mode, whereas they spent a percentage of 9 ± 1.80 of their overall in-game time in a high intensity activity mode. The forward players had a mean successful passing rate of 19.06 ± 9.86 and a mean rate of unsuccessful passes of 31.57 ± 13.07.
An arithmetic mean comparison of all footballers, position depending Graph 1 shows the arithmetic mean comparison of foot-ballers in the variable covered distance (SEPRD). Players are divided based on the criterion of their field position. The results show that all footballers covered a distance of 9,692 m ± 2,579. By comparing the types of players on the basis of the distance they covered in one match, it was concluded that midfield players cover the longest distance with a value of 10,952 m ± 2,123; second are the de-fensive players and forward players, whereas goalkeepers cover the shortest distance.
Graph 1. Arithmetic mean comparison of field position – covered distance (SEPRD)
Graph 2 shows the arithmetic mean comparison of football players in the variable number of sprints (SEBRSP). High speed run occur, on average, each 90 seconds in a match and do not last longer than 2 to 4 seconds.
HOMO SPORTICUS ISSUE 2 201238
Graph 2. Arithmetic mean comparison of field positions – number of sprints (SEBRSP)
Sprint mostly occurs in combination with change of di-rection of movement where acceleration is even more emphasized. The distance covered in sprint depends on the footballer and the field position. Results show that the mean value of sprints of all footballers is 93.33 ± 42.87. By comparing different types of players and their number of sprints in one match, we see that midfield players make most sprints (109.34 ± 32.72), forward and defensive players following. Goalkeepers have the lowest mean value of sprints.
Graph 3. Arithmetic mean comparison of field positions – maximum speed achieved (SEMAXB)
Graph 3 shows the arithmetic mean comparison of football players based on their field position and on the variable of maximum speed achieved (SEMAXB). Results show that the maximum mean speed of all footballers is 22.81 km/h ± 3.14. By comparing different types of footballers on the criterion of maximum speed achieved in one match, we can conclude that the highest maximum mean speed is performed by forward players (24.24 km/h ± 3.07), mid-fielders and defensive players following. The lowest maxi-mum mean speed was achieved by goalkeepers.
Graph 4. Arithmetic mean of field positions – time activity low (SEVANIS %)
Graph 4 shows the arithmetic mean comparison of foot-ballers based on their field position and on the variable of time activity – low (SEVANIS %). The results show that all footballers spend a majority of their time playing in a low intensity activity i.e. 83.87 % ± 5.58. By comparing different types of players based on the activity intensity, it is visible that goalkeepers spend most time in low activity intensity (97.75 % ± .683), forward players and defensive ones following. Midfielders spend least in low activity in-tensity.
Graph 5. Arithmetic mean of field positions – time activity medium (SEVASRE %)
Graph 5 shows the arithmetic mean comparison of foot-ballers based on their field position and on the variable of time activity – medium (SEVASRE %). The results show that all players spend a mean value of 7.82 % ± 2.73 in medium activity intensity. Comparing different player types on the basis of the activity intensity, we can see that mid-field players spend most in medium activity intensity (9.82 % ± 1.79), forward players following with 7.84 % ± 1.43, a similar value of defensive players’ with 7.83 % ± 1.31. Goalkeepers spend least time in medium activity intensity. Graph 6. Arithmetic mean of field positions – time activity high (SEVAVIS %)
Graph 6 shows the arithmetic mean comparison of foot-ballers based on their field position and on the variable of time activity – high (SEVAVIS %). Results of the research show that all footballers spend a mean value of 8.41 % ± 3.10 in high activity intensity. By comparing the different player types on the basis of activity intensity, it is visible that midfielders spend a mean value of 10.44 % ± 1.47 in high activity intensity, forward players and defensive ones following. Goalkeepers spend least time in high activity in-tensity.
HOMO SPORTICUS ISSUE 2 2012 39
Graph 7 shows the arithmetic mean comparison based on the distance covered (SEPRD) according to several au-thors. The results show that footballers, from year 2000 onward, have had approximately similar mean values in distance covered during one match. This is justified by the fact that contemporary top football demands a player of universal characteristics i.e. footballers who play equally well defensive and forward positions, however, having cer-tain qualities: goal player, midfielder, defender, wing player etc. Therefore, contemporary football requires specialists who are capable of performing some of the above men-tioned additional actions. According to the comparison of different authors’ studies, B&H Premier League footballers show highest aberration rate. It is with recent studies espe-cially that this fact is emphasized.
Conclusion
Contemporary football requires players of specific phy-sique, players with stamina, players with significant foot-ball intelligence, controlled aggressiveness, high functional and motor abilities, team players who know how to impro-vise. Therefore, a precondition for engaging in professional football requires having specific skills, certain abilities and significant physical condition. All variables applied were respectively analyzed; judging by basic descriptive data (central and dispersion parameters) we can conclude that the distribution of results is within the boundaries of normal distribution. The focus of this study is the top footballer model on different field positions based on the indicators of situational efficiency in Round of 16 at the 2010 World Cup in South Africa. All results were interpreted in a way that we first showed the results of descriptive analysis for foot-ballers on different field positions (goalkeepers, defensive players, midfielders and forward players); henceforth, the results of descriptive analysis for footballers who played the 2010 World Cup were presented. Moreover, arithme-
tic mean comparison based on player field positions were shown on some variables along with arithmetic mean com-parison for footballers based on their field position accord-ing to different authors. According to the above mentioned, we can conclusively state that the results of this research were supported by central and dispersion parameters in the field of certain anthropometric characteristics (mor-phologic characteristics) and situational efficiency of foot-ballers who played Round of 16 at the 2010 World Cup in South Africa.
References
Arnason, A., Sigurdasson, SB., Gudmundsson, A. et al (2004). Physical fitness, injuries and team performance in soccer. Medicine and Science of Sports Exercise, 36, 278-285.
Andrzejewski, M., Chmura, J., Pluta, B., Kasprzak, A. (2012). Analysis of motor activities of professional soccer players. J Strength Cond Res 26(6): 1481–1488.
Bangsbo, J., Mohr, M., Krustrup, P. (2006). Physical and metabolic demands of training and match-play in the elite football players. Journal of Sports Science, 24, 665-674.
Barros R., Misuta., M., Menezes, R., Figueroa, P., Moura, F., Cunha, S., Anido, R., Leite, N. (2007). Analysis of the distances covered by first division Brazilian soccer play-ers obtained with an automatic tracking method. Journal of Sports Science and Medicine, Vol. 6, 233-242.
Bloomfield, J. i saradnici (2005). Analysis of age, stature, body mass, BMI and quality of elite soccer players from 4 European Leagues. Journal of sports medicine and physi-cal fitness. vol. 45,58-67.
Graph 7. Arithmetic mean comparison on distance covered (SEPRD) according to several authors
HOMO SPORTICUS ISSUE 2 201240
Cigrovski, V., Kos, D., Martinčević, I. (2010). Neke morfološke karakteristike vrhunskih nogometnih golmana. Poreč: 19. Ljetnja škola kineziologa Hrvatske.
Di Salvo, V., Collins, A., Mc Neill, B. and Cardinale, M. (2006). Valida tion of Prozone ®: A new video-based per-formance analysis system. International Journal of Perfor-mance Analysis in Sport (serial online) 6 (1), (12 screens/inclusive page), June.
Čolakhodžić, E., Fazlagić, S., Vidović, N. (2010). Changes in body structure of adult football players during one train-ing unit. Sarajevo: Homo Sporticus, vol. 12.
\urašković, R., Joksimović, A., Joksimović, S. (2004). Težinsko visinski pokazatelji nogometera učesnika svetsk-og prvenstva 2002 godine. Physical Education and Sport Vol. 2, No 1, 2004, pp. 13 – 24. University of Niš, Faculty of Physical Education, Serbia.
Joksimović, A., Smajić, M,. Molnar, S., Stanković, D. (2009). An analysis of anthropomorphological character-istics of participants in the 2008 european football cham-pionship. Serbian Jurnal of Sports Sciences, 3 (2): 71-79.
Jerković, S., Jerković, M., Sporiš, G. (2006). Spiroer-gometric parameters of elite soccer players. Spiroer-gometrijski parametri vrhunskih nogometaša. Hrvatski Športskomedicinski vjesnik. Vol. 21, pp.108-112.
Jelašković, E., Jozak, H., Talović, M., Sporiš, G., Ramadanović, M. (2010). Correlation between Fitness profile and situation efficiency in soccer. Homo Sporticus (1512-8822), 12, 2: 11-16.
Krustrup, P., Mohr, M., Ellingsgaard, H. and Bangsbo, J. (2005). Physi cal demands during an elite female soccer game: importance of training status. Medicine and Science in Sports and Exercise 37(7): 1242-1248.
Lago, C., Casais, L., Dominguez, E., Sampaio, J. (2010). The effects of situational variables on distance covered at various speeds in elite soccer. European Jurnal of Sport Science, 10 (2): 103-109.
Mohr, M., Krustrup, P., Bangsbo, J. (2003). Match per-formance of high standard soccer players with special reference to development of fatigue. Journal of Sports Sci-ences, 21, 519-528.
Marković, G., Bradić, A. (2008). Nogomet – Integralni kondicijski trening. Zagreb: Tjelesno vježbanje i zdravlje.
E. Rienzi, B. Drust, T. Reilly, J. E. L. Carter, and A. Mar-tin. (2000). Investigation of anthropometric and work-rate profiles of elite South American International Soccer Play-ers. Journal of Sports Medicine & Physical Fitness 40, 162-169.
Talović, M. (1999). Kvalitativne promjene u strukturi kre-tanja igrača bez lopte u Premijer ligi BiH. M. S. thesis. Sa-rajevo: Fakultet za fizičku kulturu
Verheijen, R. (1997). Condicionig for Soccer. BPF, Ver-sand, Leer.
Correspondence to:Adnan AdemovićTeacher Training Faculty, Džemal Bijedić University of Mo-starURSC “Mithat Hujdur-Hujka“, 88 000 MostarBosnia and HerzegovinaPhone: +387 36 571-216E-mail: [email protected]
HOMO SPORTICUS ISSUE 2 2012 41
Damira Vranešić-Hadžimehmedović1, Ifet Mahmutović1, Izet Bajramović1 and Eldin Jelešković1
The Partial Quantitative Changes in Swimming Preformance and Basic Motor Abilities of Young Girls Under the Infl uence of the Experimental Program1 Faculty of Sport and Physical Education, University of Sarajevo, Bosnia and Herzegovina
Original scientific paper
AbstractThe researche was done in a sample of 35 young school age girls, non-swimmers, with the aim of determining the effects of an experi-mental training swimming program, in a time period of three months. Basic aim of the swimming program was learning and develop-ment of tehnical knowledge in swimming tehniques, breaststroke, freestyle and backstroke. Duration of the experimental swimming program was 90 days. The partial quantitative changes in swimming preformance and basic - motor skills at girls that were attending this program was analysing by applying the pairwise t- test . After conducting the experimental program and monitor of the initial and final measurements, it was found that there have been significant transformations in all processed varijables in both spaces.
Key words: Transformation program, basic motor abilities, success in swimming, specific swimming program, t-test.
Introduction
Swimming is specifically due to changes in body position (transition from vertical to horizontal position, from sup-porting floating positions), different ways of breathing, than the apparent weight loss, what human beings requires not only adapt, but also the learning of movement in the wather as the new environment. So, no matter if the swimmer in the water is stationary or moving, his body behaves differ-ently than on the mainland because there are significant gaps between values and between forces on land and in water (Rađo, 1998). Some studies show that children in age of 7 – 15 years, can during period of 11 days, satisfy the criterion of swimming 25m (Kazazović, Hadžikadunić, 1987). Rađo I. (1998) in the study on a sample of 109 student respondents found quantitative changes that oc-cur under the influence of swimming. Recent scientific research has been done on the territory of Bosnia and Her-zegovina, suggest that different swimming programs, in addition to improving swimming tehniques, can greatly af-fect the motor potetial respondents of different populations ( Rađo, 1998; Solaković, 2007; Popo, 2006; Đedović, 2006). Swimming is one of the most attractive activity for children, and is very effective for the harmonius growth and development of young people. Swimming is also one of the important factors in the prevention of body deformities. Petrič (1987) that swimming is suitable impact on respira-
tory, heart and vessels, the hands and feet, as well as high energy consumption, which is primarily aerobic type,and provides swimming on the first place while strenghtening the entire heath. The aim of this study was to determine the influence of 3 month experimental swimming program, on swimming success from young school age girls.
Methods
The sample of respondentsThe study was conducted on a sample of 35 young girls of school age (6 – 9 years old), attends school swimming in the water sports club association „Dami“. Girls werw clinically healthy with no psycho – physical disorder. Girls, participiant of the program, did not have any motor infor-mation on the tehiques of swimming , so they all belonged to the category of non – simmers.
Sample of variablesSample of variables for assessing the preformance in swimming:1. The tehnique starts freestyle tehnique – TSKS2. Swimming freestyle tehnique – TPKS3. Tehnique turns freestyle tehnique – TOKS4. Backstroke start crawl tehnique – TSLS5. Backstroke swimming tehnique crawl – TPLS
Methods of data processingThe pairwise t – test was used to analyse the preformance of partial quantitative changes in swimming under the influ-ence of experimental swimming program.
Specials of applied programIn this section of the research work the basic characteris-tics in the applied experimntal program of swimming were listed, with the number of trainings and their duration, also with specific characteristics of the autor and his innovation when it comes to training facilities. Non – swimmer training program, which was implemented, consisting of 36 units of training, whose leadership was under the supervision of experienced swimming coaches who are sport teachers. Duration of this program is deployed at three months, train-ing sessions were three times a week, lasting 90 minutes. An important aspect of the program had been administred before the start of the swimming school: entrance inter-view with the parent ond child attendant, filling question-naires from parents, the formation history of child for future coaches. Introducting the group leader with the children on the basis of written history teacher prior to their arrival at the pool. Constant, close cooperaion between parents and swimming teacher, and also effect on the child by the par-ents instructions. During the swimming school children are working in groups of 8 – 10 students or in similar groups based on age, sex, relationship to the aqueous medium and precisely defined initial status. Staff responsible for sup-porting child care was also on the pool, so tere was no time waste for other things of swimming teachers.Classes at the pool is implied use methods adapted for the age of chil-dren, like : communication, analytic – syntetic pedagogical method and method of play. In the introductory part of the lesson we have done warm – up exercises, stretching and exercises aimed at developing motor skills (strenght of ab-dominal and back muscles, shoulder belt flexibility, coor-dination) through modern exercises programs: aqua gym, aqua aerobics, aqua jogging, aqua pilates and water poly-gons for children. Different equipment was applied with the aim of diversity training, incluing: bats, solid rubber, soft ball, sinking objects and pool noodles.Strength training at younger ages we do, so we can teach children the proper technique of the exercise they are doing with own weight (push – ups, sit-ups, squats), medicine ball, dumbbells and equipment for withdrawing (Vorontsov, 2006).
In the main part of the training, facilities were: initial check-ing, looking at the water, plunge the head into the water, breathing in the water, floating with and without props, toys, sliding in water with and without equipment, learning of certain tehniques of swimming legs (breststroke, back-stroke, freestyle), learning of certain swimming techniques hands (breststroke, backstroke, freestyle), coordinates the work of arms and legs, coordinated the work of the arms
and legs with proper breathing techniques, jumps into wa-ter, on head, turns, length resurfacing certain tehniques (breststroke, backstroke,freestyle) with the coordinated work of the arms, legs and breathing (breststroke, back-stroke, freestyle),Transitive checking to predefined us-ing program, correcting common mistakes (in advanced stages). In the final part of the lesson in focus were the games with elements from swimming program which is beeing learned before, as well as ranges of skill and agility in the water and on land, aqua gym, aqua aerobics, group interviews with children in the aquatic environment about what they did and learn on the lesson .
Results and Discussion
To determine the mean differences (at the univariate level) or partial quntitative changes in swimming preformance between initial and final measurements, under the influ-ence of experimental swimming program, we applied t – test for dependent samples. Therefore it was necessery to determine whether the arithmetic mean of the initial and final measurements significantly different. All variables that are treated swimming preformance by girls (tabele 1), pre-sented by the t – test, girls indicate statistical significance at p < 01.
(Tabele 1) Testing differences arithmetic averages sample of variables for assessing the preformance in swimming
Based on the presented results, we see significant chang-es in relation to the presented of initial condition for all variables from treated area. The reason for this can be found in the fact that the respondents were non-swim-mers, which finally enabled major progress. Many previ-ous studies suggest that it is much easier to learn a new completely new movement, than correct the existing, au-tomated movement. Rađo (1998) in his doctoral thesis states that the adoption of new coordinating structures motion a process of balancing information structure of the movement, with the movement of the motor apparatus in particular coordination structure and streotip, it means the
Pair Var. t df Sig.
Pair 1 TPKS -13.3 35 .000
Pair 2 TSKS -23.4 35 .000
Pair 3 TOKS -13.8 35 .000
Pair 4 TPLS -12.9 35 .000
Pair 5 TSLS -12.5 35 .000
Pair 6 TOLS -13.3 35 .000
Pair 7 TPPS -15.7 35 .000
Pair 8 TOPS -17.0 35 .000
Pair 9 TSPS -23.4 35 .000
HOMO SPORTICUS ISSUE 2 2012 43
process by which the motor apparatus gradually trained to express and implement a new rational information on the movement. Significant transformations can be explained by the fact that the contents of the training units were fo-cused primarily adopting swim, that is because parents primarly enrolled their children in swimming lessons, so they mastering the elementary swimming.Also, the mak-ing of groups in accordance with the same age and give a small number of children to one instructor (8), suspect in the very beginning that a high level of quality of work will be present and that it is possible to expect major prog-ress on completion of training. Findak (1987 ) in the second former Yugoslavia Counseling for non-swimmers, in terms of the number of beginners in the group said, that in this respect the progress has been made, but not the same in all regions of the former state. Specifically, in the three re-publics, training non-swimmers performed with up to 12 beginners in the group, the one with up to 15 beginners in the group, while in the two republics and one province Swimming Coaches Training conducted with more than 15 beginners as a group. Taking into account all the objective circumstances, which are usually the main cause of work-ing with too many beginners in the group, should use this opportunity to warn that working in such conditions there can be no guarantee of safety at work, and even less to achieve desired effects. Therefore, the results suggest an optimal dosed program and its suitability for the sample of respondens. Based on the questionnaire that the parents completed when the child and parent came for intrerview , one of the requested information was if their child is cur-rently involved in a training process. Specifically, the high-est percentage of respondents in that moment was not involved in a regular training process, which left a lot of space to make a significant change towards transforma-tion of treated swimming techniques that is the aim of the study. Before the child’s enrollment in the swimming school a interview had been realized to get very signifi-cant initial information about future trainees, based on his experience about water, about his character traits, which school is he going to, which grade, etc. All of that was of crucial in the making of groups, selecting the type of teacher who will operate the program with children or a specific child. Findak (1998) states that these data pro-vide swimming teachers the opportunity to gain insight into the initial picture of the situation before the start of work. Further, there is no doubt that a image of the group made that way, is of great use for swimming teacher and children.In the main part of the training through a compre-hensive training program three swimming technique (free-style, backstroke and breaststroke), then starts and turns of these techniques it could influence the creation of ef-fects on young body and these young girls.Trainers task is a systematic, very well prepared training, affects devel-opment of multidimensional swimmer (Faccioni, 2006).
Conclusion
Transformation of the variables that determine success in swimming, under the influence of the experimental pro-gram, are expected. Program contents were based primar-ily on educating swimming and with an extended scope ap-plied methodical exercises and technical elements. A child of this age is interested to properly preform and corect movements as long as he finaly learn them. A special train-ing program for girls non – swimmers that has been tested through this research, pointed out that it is very important to take time for the adoption of elementary training pro-gram non-swimmers (teachers - professionals who deal with this type of education)but also for the accompanying exercise through beginning and final parts of the training. Specifically, the positive effects that can be projected on the young body, which are the product of a specific pro-gram can be of great importance for the proper growth and development of young school age children, and also cre-ating a better learning of the planned swimming records. Also, the program suggests that the period of three months is quite sufficient to younger students transform their state of non – swimmers into the state of swimming (three ba-sic swimming tehniques breaststroke, freestyle and back-stroke accompanyng them jumps and turns. New exercise programs in water as aqua aerobics, aqua pilates, water polygons, then modern equpment certainly have contribut-ed diversity of training, breaking the monotony, holding the attention of children and the preservation of greater interest for the performance and engagement with the implementa-tion of the specific program. Serious work with the young-est category of school children is possible and it is neces-sary to strive for the implementation of swimming schools from the first grade in primary education. In the developed countries of Western and Eastern European non-swimmer swimming training is an obligatory part of the educational process of education.
References
Faccioni, A. (2006) Speed and Condtioning Consultant; Young Athlete Conditioning. www.coachesinfo.com-arti-cle-295.
Findak, V. (1991). Appendix intensification of training non-swimmers preschool children, Proceedings of the Second Conference of Yugoslavien Swimming education, Pančevo.
Hadžikadunić, M. Balta, S. (2000). Corrects posture in children of preschool age. Faculty of Sport and Physical Education, Sarajevo.
Kazazović, B., \edović, D., A. Popo, Mekic M. (2007). NTS Collected scientific papers. Fac-ulty of Sport and Physical Education, Sarajevo.
Kazazović, B., Hadžikadunić, M. (1987). Regularity and specificity of the training process of swimming children of
HOMO SPORTICUS ISSUE 2 201244
primary school age, Proceedings of the Second Confer-ence of Yugoslavien Swimming education, Pančevo.
Petrič, D. (1987). The place and importance of swimming for health, fitness and sport as a means of recreation, Pro-ceedings of the Second Conference of Yugoslavien Swim-ming education Training Pančevo.
Radjo, I. (1998). Transformation processes of motor and functional skills and various aspects of swimming. The doctor thesis. Faculty of Physical Education, Sarajevo.
Solaković, E. (2007). Effects of programmed swimming to improve swimming efficiency and success in performance swimming technique of students. Master’s thesis. Faculty of Physical Education, Sarajevo.
Vorontsov, A. (2006). Development of Basic and Special Endurance in Age-Group Swimmers. www.coacesinfo.com-article-295.
Vranešić-Hadžimehmedović, D. (2011). Transformation processes of basic motor abilities and morphological char-acteristics of programmed swimming program. Master’s thesis. Faculty of Sport and Physical Education, Sarajevo.
Correspondence to:Damira Vranešić – HadžimehmedovićFaculty of Sport and Physical Education, University of Sa-rajevoPatriotske lige 41, 71 000 SarajevoBosnia and HerzegovinaPhone: +387 33 668-768E-mail: [email protected]
HOMO SPORTICUS ISSUE 2 2012 45
Ensar Abazović1, Siniša Kovač1, Muhamed Tabaković1, Mensur Vrcić1 and Erol Kovačević1
Isokinetic Profi le of Knee Flexors and Extensors Strength of the Faculty of Sport and Physical Education Female Students1 Faculty of Sport and Physical Education, University of Sarajevo, Bosnia and Herzegovina
Original scientific paper
AbstractThe aim of this study was to construct anisokinetic strengthprofile of female students of Faculty of Sport and Physical Education, and identify H/Q ratio, as well as, to determine thepeak torque value given by flexors and extensors of the knee joint. Based on the results of isokinetic testing,isokinetic dynamic knee stabilizers strength profile of physically active women was constructed. Active women were students at the Faculty of Sport and Physical Education. Values of peak torque during the knee extension was 148.19 ± 25.54 Nm for the dominant and 150.09 ± 23.81 for the non-dominant leg, and the knee flexion was 76.65 ± 13.35 Nm for the dominant and 76.14 ± 16 Nm for the non-dominant leg, while the ratio between these two values is 0.52 ± 0.06 for dominant and 0.51 ± 0.07 for the non-dominant leg.
Physical strength is one of the fundamental motor skills in man (Metikoš et al., 1989), and therefore, the evaluation of the actual state and accurate insight into the strength of the muscles have always been the goal of all who are associ-ated with sport, the athletes, coaches, scientists, doctors and others.
There are many definitions of power, but one by Zatsiorsky (1995) according to which, the strength of a man is his ability to overcome external resistance or to act against resistance by muscle strain, is the most popular in the pro-fessional and academic literature.
Of the 230 joints in the human locomotor apparatus, the knee joint (art. genus) is the largest and most complicated joint of them all. Itsability to resist any adverse external factors is poor, and therefore it is most infringing. Most frequent reasons of knee injuries lies in imbalances in power of musclesstabilizing it, that is, the strength ratio of m.quadriceps and m.bicepsfemoris-hamstring. A com-mon cause, beside that could be the existence of so called bilateral deficit, in which, there is an imbalance in power of muscles of two legs. Weaker leg is more prone to injury.
It was the aim of this study to construct the isokinetic strength profile, by determining the peak torque value given by flexors and extensors of the knee joint. Besides that, the goal was to determine whether these values were in the
range recommended for healthy, physically active female population, and in line with previous researches, when it comes to a similar pattern, and to compare these values between the bilateral muscle groups.
Accurate assessment of human muscle performance was the focus of research scholars who have studied the physi-cal exercise through many decades. Scientists who have studied the physical exercise and were interested in com-paring the effects of different programs on strength and stamina, wanted to accurately measure muscle strength and power. Rehabilitation medicine practitioners wanted to document the effectiveness of therapeutic exercise which helped patients who have recovered from musculoskeletal injuries. They wanted to have an insight into pace of recov-eryof strength or power (Kovač, 2010).
Only isokinetic instrumentation provides 1) the possibility of isolated testing of a particular joint and associated muscula-ture in biomechanically correct position, 2) the possibility that the subject applies as much force he himself can produce, 3) amplitude and velocity at which the testing are flexible, which is very important when used for medical purposes, 4) evalu-ation of agonist and antagonist groups participating in the movements of a particular joint can be made along the entire range of motion, and 5) possibility to assess individual muscle group of the contralateral limb so, it could be, if done accord-ing to an identical protocol, used as a basis for comparison.
HOMO SPORTICUS ISSUE 2 201246
Of course, what matters most is the quantification of force, or the fact that only the isokinetic testing can lead to numerical values that provide a detailed insight into the strength of all muscle groups, agonists and antagonists, bilateral comparison, the amplitude of motion, amount of work and endurance expressed via fatigue index (Desnica-Bakrač, 2003).
There are many studies in which theaim was to de-termine the agonist/antagonist ratio of certain muscle groups. Campbell and Glenn (1982), for example, stated that the ratio of hamstring/quadriceps, in assessing mus-cle function, is more important than peak torque, because, according to them, the big difference between these two groups is the most common cause of muscle injuries of the lower extremities. Range within which this value should beare defined by Clanton and Coupe (1998). According to them, the value of H/Q ratios, for healthy physically active female population,should be between 0.50 and 0.60.
Many authors evaluated, and proved accuracy and validity of isokinetic parameters in their studies. Among the first to address this topic were Perrin (1986),Feiring et al.(1990), McCleary and Anderson (1992), and later, Soderberg (2004), Drouin et al. (2004) and Almosnino et al. (2011). It is important to note that all the authors have put special emphasis on peak torque and proved that the results of isokinetic, concentric test give valid indicators of maximum muscle strength.
Besides the validity and reliability of the concentric test-ing, the reason for this was the fact that during eccentric testing,higher axial force are generatedthan in the case of concentric testing, thereby it increases the risk of occur-ring injuries (Dvir, 2004). This is supported by the fact that in the study which had over 687 examinees - football play-ers (Croisiere et al., 2008), 8 of them haven’t success-fully completed eccentric isokinetic testing due to the oc-currence of pain. Also, Orchard et al. (2001) in their case study reported m.bicepsfemoris longhead strain caused by eccentric isokinetic testing, that was proven by magnetic resonance imaging (MRI).
Methods
Sample of subjectsThe sample consists of 30 physically active women, post-adolescentage - students at the Faculty of Sport and Physi-cal Education in Sarajevo, aged between 19 and 23 years, body height 169.13 ± 3.86 and weight 61.57 ± 5.45, with relatively homogeneous characteristics in terms of anthro-pometry.
Sample of variablesFollowing the example of many previous studies (Kazazović, 2009; Kovačević, 2009; Tsang and DiPasquale, 2011; Alić, 2012), and given that many (Kannus and Yasuda, 1992; Al-
angari and Al-Hazzaa, 2004; Jaiyesimi and Jegede, 2005) quote that isokinetic peak torque values parameters are commonly used and valuable to assess the performance of the human muscle, and in the end to construct isokinetic strength profile (Fousekis et al., 2010; Larrat et al., 2007), this study used only the peak torque values.1. BH- Body height2. BW - Body weight3. PTED - Dominant leg, knee extension peak torque 4. PTEND - Non-dominant leg, knee extension peak
strength ratio8. HQRND - Non-dominant leg, knee flexors and exten-
sors strength ratio
Isokinetic testing was conducted according to the follow-ing protocol:1. Musculoskeletal screening2. General warm-up and stretching of the body3. Setting the subject in the optimum stabilization4. Alignment of the joint and the rotation axis at the dy-
namometer 5. Verbal introduction to the concept of isokinetic exer-
cise6. Correction of gravity7. Warming up (3 submaximal and 1 maximal repetition)8. Maximum test at a predefined speed; 60º/s (3 repeti-
tions)9. Testing the contralateral limb
Statistical analysisFollowing the example of previous authors who have dealt with these issues, the study used only descriptive statis-tics.
Results
Table No. 1 presents the central and dispersion parameters for a set of variables of isokinetic testing.
Discussion
Reviewing the results of descriptive statistics from the table 1, it can be observed that the peak torque values during the extension of the knee was 148.19 ± 25.54 Nm for the dom-inant and 150.09 ± 23.81 Nm for the non-dominant leg.
On a sample of 20 healthy physically inactive women, aged between 23 and 35 years, Yoon et al. (1991) obtained re-sults which had value of 82.4 ± 12.9 ft-lbs for the domi-nant and 85.3 ± 15.0 ft-lbs for the non-dominant leg. Ac-cording to Van Vlack (1989):
HOMO SPORTICUS ISSUE 2 2012 47
From these results, it can be calibrated that this group of women during the extension of the knee at 60°/s, domi-nant leg exerted a force of 60.72 ± 9.5 Nm, while when it comes to non-dominant, this value was 62.86 ± 11.0 Nm, it is noticeable that the girls from the Faculty of Sport are far more potent, even 244% when we consider the domi-nant and 238%when it comes to non-dominant leg knee extension than physically healthy, inactive women.
On the other hand, when we look at professional athletes, Mendonça et al. (2007), who in their study had a sample of 6 Brazilian female Taekwondo athletes, they came up with the findings that the peak torque, when normalized with body mass is 300.2 Nm/kg for the dominant and 300.1 Nm/kg for the non-dominant leg.
The above normalization is done according to the formula by Ikeda et al. (2002):
If the results of this study are normalized in this way, the values obtained are 240.69 Nm/kg for the dominant and 243.77 Nm/kg for the non-dominant leg. Taking into ac-count that in the aforementioned study elite athletes are in the sample of subjects,lower level of average value of the peak torque among students of the Faculty of Sport and Physical Education (19.8%) when it comes to the domi-nant and (18.8%)in non-dominant leg is completely under-standable and logical.
The results of isokinetic testing that was done on the stu-dents, in a study of Almosnino et al. (2011), which are in the sample, which consisted of 20 students, aged 22.4 ± 2.3 years, who were actively engaged in sports 5 ± 2 hours per week, show that the value of knee extension peak torque was 142 ± 16 Nm. The results obtained by these authors, on the sample that was consisted of stu-dents of the School of Kinesiology and Health Studies (ON,
Canada)do not differ much from the results of this study. In fact, the mere difference of ~ 4% indicates that the knee extension peak torque values that were accomplished by female students of Faculty of Sport wasvery similar with almost identical population.
In addition, Wilkerson et al. (2004) in their experimental group had 11 female students, second division basketball players (National Association of Intercollegiate Athletics), age 19 ± 1.4 years, who did not have history of injuring their lower extremities. The results of isokinetic testing of the knee extensors in this study had a value of 169.82 ± 26.78 Nm, which is 12.73% higher than the value that the girls in this studyhad. Consideringthat there is not much difference in age, based on the results of the study Lue et al. (2000), and Camic et al. (2010), in which the weight and height of the body have Piersonscorrelation coefficient value of the r = 0.56 and 0.62 with a peak torque of knee extension force, the difference in weight of 21% and height of 2.5% significantly contributed to the rise of force knee extensors in these girls.
When it comes to hamstring, or the knee flexor group, re-viewing the results of descriptive statistics in Table No. 1, it can be observed that knee flexion peak torque values were 76.65 ± 13.35 Nm for the dominant and 76.14 ± 16 Nm for the non-dominant leg. When compared with healthy, physically inactive women, aged between 23 and 35 years Yoon et al. (1991), which were tested with a similar pro-tocol, concentric testing at angular velocity of 60°/s, who had the peak torque value of 44.2 ± 10.2 ft-lbs or 32.57 Nm for the dominant and 45.2 ± 10, 2 ft-lbs or 33.31 Nm for the non-dominant leg, it can be seen that the girls from the Faculty of Sport are far more potent, even 235% when we consider the dominant and 228%when it comes to non-dominant leg knee flexionthan physically healthy, inactive women.
Descriptive Statistics
N Minimum Maximum Mean Std. Deviation Skewness Kurtosis
BH 30 162 178 169.13 3866 .083 - .497
BW 30 52 74 61.57 5450 .293 - .590
PTED 30 100.9 201.0 148,193 25.5413 .325 - .464
PTEND 30 95.7 203.6 150,090 23.8143 .108 .108
PTFD 30 52.8 104.6 76,657 13.3537 .402 - .526
PTFND 30 43.5 118.3 76,143 16.0021 .567 .811
HQRD 30 .37 .64 .5206 .06000 - .056 .179
HQRND 30 .40 .70 .5078 .07368 .709 .023
Table1.
HOMO SPORTICUS ISSUE 2 201248
As during the extension, by comparing peak torque force in flexion, with professional athletes, 6 Brazilian Taekwondo athletes, from the study by Mendonça et al.(2007), whose normalized values amounted to 148 Nm/kg for the domi-nant and 152.1 Nm/kg for non-dominant is seen that in this case these professional female athletes have higher results than female students in this study. Taking into account that the normalized knee flexion peak torque values of students of Faculty of Sports amounts 124.5 Nm/kg when it comes to dominant and 123.66 when it comes to non-dominant leg, it may be noted that the students from this study have lower peak torque values by 15.9% when it comes to the dominant and 18.7% when it comes to non-dominant leg from top Brazilian Taekwondo competitors.
Comparing these results with the results of studies in which students have also participated in the Faculty of Sport (Al-mosnino et al., 2011), the knee flexion peak torque value was 76 ± 15 Nm, it can be concluded that, just as during the extension, no big difference were present. According to the values presented in table 1, where it can be seen that the knee flexion peak torque value of students at the Fac-ulty of Sport was 76.66 ± 13.35 Nm for the dominant and 76.14 ± 16 Nm for the non-dominant, it can be concluded that there is minimal difference of ~ 1% between the results of these two studies.
Taking into consideration the study of Wilkerson et al. (2004), who had a sample consisting of 11 students of the Faculty of Kinesiology and Exercise Science, which had weight of 21% and height 2.5% higher than the sample in this study, and their peak torque in flexion, at angular veloc-ity of 60°/s, totaled 90.81 Nm, which is 15.5% higher than the value of female students of Faculty of Sport and Physical Education, based on the aforementioned conclusions (Lue et al., 2000;Camic et al., 2010), it can be concluded that there are certain similarities with the results of this study.
A review of previous studies, which were aimed to esti-mate the ratio of H/Q, can lead to a conclusion that there are large differences between the results of different au-thors. Specifically, when it comes to women, the lowest H/Q ratio value, at angular speed of 60°/s, which was used in this study, was 0.44 (Westing and Seger, 1989), and the highest 0.60 (Pincivero, 2003) while for men the low-est was 0.46 (Aagaard et al., 1997), and the highest 0.82 (Subaşi et al., 2004). Taking into consideration that the experimental groups in previous studies were different, it is evident that the conclusion of Baltzopoulos and Brodie (1989) that the H/Q ratio depends on the age, sex, level and type of activity, and the angular velocity at which the test is performed, is valid. Therefore, age, gender, activity level, gravity correction, fiber type which is dominant in the muscle and many other factorshave effect on H/Q ratio (Appen and Duncan, 1986).
When it comes to students, Rosen et al. (2001) in two groups, I-soccer players and II-softball players, got the val-
ue of 0.54 ± 0.19 for the right and 0.53 ± 0.07 for the left leg in the first and 0.56 ± 0.09 for right and 0.54 ± 0.1 for the left in the second group. Furthermore, in their studies Almosnino et al. (2011) and Wilkerson et al. (2004), also on the sample consisting of physically active students, got the value of H/Q ratio of 0.53, while Kovačević (2009), in whose studywere involved female students of the Facul-ty of Sport and Physical Education, similar to Fillyaw et al. (1986), in which the sample were students who trained football, came to a value of 0.54. Garceau et al. (2010), who in the sample of subjects had 22 students, obtained the value of 0.51. Also, Tsang and DiPasquale (2011) in two groups of students had the H/Q ratio of 0.50 and 0.51.
Looking at the above studies, it can be concluded that the H/Q ratio of tested student group at Faculty of Sport, pre-sented in Table No. 1, is not much different from any group of women who had no history of lower extremity injuries, regardless of where they physically active or not. Taking into consideration, that all of these values, when analyzed together,have H/Q ratio value of 0.52 ± 0.02,so it can be concluded that the results for the dominant leg, which have a value of 0.52 ± 0.06, are indistinguishable from the ana-lyzed studies, while the results which are shown on the non-dominant leg, which amounted to 0.51 ± 0.07, are lower by ~ 2% than the results of the studiesmentioned earlier.
Based on these results it can be concluded that the values of reciprocal ratio of leg muscle strength, from this study, are in the range recommended for healthy, physically ac-tive population. That meansfor girls of post adolescent age.
Conclusion
Based on the results it can be concluded that the value of provided tests, includingPeak Torque of dynamic knee stabilizers were helpful in creatingisokinetic strength profile for postadolescent, physically active, female population, namely students of the Faculty of Sport and Physical Edu-cation. Comparing these results, above in paper, with simi-lar studies, it is evident that the mean value of strength test results, for subjects who participated in this study,are not significantly different from the values measured at other Universities.
Furthermore, compared to physically inactive female popu-lation, it can be concluded that the students of the Faculty of Sport and Physical Education are far stronger than inac-tive group, as well as, the same results, when compared with eliteathletes,tell us that these students are slightly be-hind, which is reasonable.Furthermore, when it comes to H/Q ratio, it can be concluded that the values of reciprocal ratio of leg muscle strength for tested student population, is in the range that is recommended for healthy, physically active female subjects. These results suggest that the iso-kinetic profile constructed in this study can be used as a basis for further comparison with similar studies.
HOMO SPORTICUS ISSUE 2 2012 49
References
Alangari, A., & Al-Hazzaa, H. (2004). Normal isometric and isokinetic peak torques of hamstring and quadriceps muscles in young adult Saudi males. Neurosciences, 9(3), 165-70.
Alić, H. (2012). Trenažni efektifunkcionalnih i motoričkih sposobnosti nogometaša u pripremnom i takmičarskom periodu pod utjecajem specifičnog trenažnog procesa (Training effects of functional and motoric abilities of foot-ball players in preparation and competition period under the influence of the specific training process). Doctoral Thesis: Faculty of Sport and Physical education. Sarajevo.
Almosnino, S., Stevenson, J. M., Berdana, D. D., Dia-conescu, E. D., & Dvir, Z. (2011). Reproducibility of iso-kinetic knee eccentric and concentric strength indices in asyptomatic young adults. Physical Therapy in Sport, Available online 22 October; In press, Corrected Proof.
Camic, C. L., Housh, T. J., Weir, J. P., Zuniga, J. M., Hen-drix, C. R., Mielke, M., et al. (2010). Influences of body-size variables on age-related increases in isokinetic peak torque in young wrestlers. Journal of Strength and Condi-tioning Research, 24(9), 2358-65.
Croisier, J. L., Ganteaume, S., Binet, J., Genty, M., & Fer-ret, J. M. (2008). Strength Imbalances and Prevention of Hamstring Injury in Professional Soccer Players. Am J Sports Med, 36(8), 1469-75.
DesnicaBakrač, N. (2003). Izokinetičkadijagnostika (Iso-kinetic Diagnostics). Kondicijskitrening, 2(1), 7-13.
Drouin, J., Valovich-mcLeod, T., Shultz, S., Gansneder, B., & Perrin, D. (2004). Reliability and validity of the Biodex system 3 pro isokinetic dynamometer velocity, torque and position measurements. Eur J ApplPhysiol, 91, 22-9.
Dvir, Z. (2004). Isokinetics: Muscle Testing, Interpretation, and Clinical Applications,2 edition. Edinburgh: Churchill Livingstone.
Feiring, D., Ellenbecker, T., &Derscheid, G. (1990). Test-retest reliability of the biodex isokinetic dynamometer. J Orthop Sports PhysTher, 11(7), 298-300.
Fousekis, K., Tsepis, E., &Vagenas, G. (2010). Lower limb strength in professional soccer players: profile, asymme-try, and training age. Journal of Sports Science and Medi-cine, 9, 364-73.
Ikeda, H., Kurosawa, H., & Kim, S.-G. (2002). Quadriceps torque curve pattern in patients with anterior cruciate liga-ment injury. International Orthopaedics, 26(6), 374-6.
Jaiyesimi, A., &Jegede, J. (2005). Hamstring and Quadri-ceps Strength Ratio: Effects of Age and Gender. Journal of the Nigeria Society of Physiotherapy, 15(2), 54-58.
Kannus, P., & Yasuda, K. (1992). Value of isokinetic angle-specific torque measurements in normal and injured knees. Med Sci Sports Exerc, 24(3), 292-7.
Kazazović, E. (2009). Uticaj individualno oblikovanih trenažnih programa na povećanje maksimalne jačine dinamičkih sta-bilizatora koljena kod studenata fakulteta sporta i tjelesnog odgoja (Influence of individually tailored training programs to increase the maximum output dynamic knee stabilizers in the Faculty of Sport and Physical Education). Doctoral Thesis: Faculty of Sport and Physical education. Sarajevo.
Kovač, S. (2010). Biomehanika u kineziologiji (Biomechan-ics in Kinesiology). Sarajevo: Faculty of Sport and Physical education, University of Sarajevo.
Kovačević, E. (2009). Efekti koncentričnog izokinetičkog treninga na različitm ugaonim brzinama na maksimalnu i eksplozivnu snagu tjelesno aktivnih žena (The effects of concentric isokinetic training on different angular velocities at the maximal and explosive strength in physically active women). Master Thesis: Faculty of Sport and Physical edu-cation. Sarajevo
Larrat, E., Kemoun, G., Carette, P., Teffaha, D., &Dugue, B. (2007). Profilisocinétique des muscles fléchisseursetex-tenseurs du genou chez une population de rugbymen. An-nales de réadaptationet de médecine physique, 50, 280-6.Lue, Y. L., Chang, J. J., Chen, H. M., Lin, R. F., & Chen, S. S. (2000). Knee isokinetic strength and body fat analysis in university students. The Kaohsiung journal of medical sciences, 16(10), 517-24.
McCleary, R. W., & Andersen, J. (1992). Test-Retest Reli-ability of Reciprocal Isokinetic Knee Extension and Flexion Peak Torque Measurements. Journal of Athletic Training, 27(4), 362-5.
Mendonça, L. M., Bittencourt, N. F., Guimarães, C. Q., Silva, A. A., & Fonseca, S. T. (2007). Isokinetics Analysis of Hamstrings and Quadriceps Muscles in the Male and Fe-male Taekwondo Brazilian National Team. In M. H.J., & C. M.H. (Ed.), XXV Internacional Symposium of Biomechan-ics in Sports (pp. 595-597). OuroPreto, Brazil: Departa-mento de Esportes de UFMG.
Metikoš, D., Prot, F., Hofman, E., Pintar, Ž., & Oreb, G. (1989). Mjerenje bazičnih motoričkih dimenzija sportaša (Measurement of basic motor dimensions in athletes). Za-greb: Faculty of Physical Education.
Orchard, J., Steet, E., Walker, C., Ibrahim, A., Rigney, L., &Houang, M. (2001). Hamstring muscle strain injury caused by isokinetic testing. Clin J Sport Med, 11(4), 274-6.
HOMO SPORTICUS ISSUE 2 201250
Perrin, D. H. (1986). Reliability of isokinetic measures. Athletic Training, 21, 319-21.
Soderberg, G. L. (2004,). Bases, Principles, Validation and Protocols for Isokinetic Testing in the Workplace. Retrieved 5 13, 2012, from http://costreductiontech.com/docu-ments/ScientificTreatiseonIsokinetics.pdf
Tsang, K., &DiPasquale, A. (2011). Improving the Q:H Strength Ratio in Women Using Plyometric Exercises. Journal of Strength and Conditioning Research, 25(10), 2740-5.
Van Vlack, L. H. (1989). Elements of Materials Science and Engineering: 6th Edition. Pearson Education Inc.
Wilkerson, G., Colston, M., Short, N., Neal, K., Hoewischer, P., &Pixley, J. (2004). Neuromuscular Changes in Female Collegiate Athletes Resulting From a Plyometric Jump-Training Program. Journal of Athletic Training, 39(1), 17-23.
Yoon, T. S., Park, D. S., Kang, S. W., Chun, S. I., & Shin, J. S. (1991). Isometric and Isokinetic Torque Curves at the Knee Joint. Yonsei Medical Journal, 32(1), 33-43.
Zatsiorsky, V. M., & Kraemer, W. J. (1995). Science and Practice of Strength Training. Champaign, IL: Human Ki-netics.
Correspondence to:Ensar AbazovićFaculty of Sport and Physical Education, University of Sa-rajevoPatriotske lige 41, 71 000 SarajevoBosnia and HerzegovinaPhone: +387 61 303-613E-mail: [email protected]
HOMO SPORTICUS ISSUE 2 2012 51
NEW PUBLICATIONSPublished by the Faculty of Sport and Physical Education, University of Sarajevo, Bosnia and Herzegovina
Lejla Šebić and Marijana Podrug-ArapovićAERIBIC – Aerobic gymnasticsFaculty of Sport and Physical Education, University of Sarajevo In Bosnian lenguangeSarajevo; 2012.ISBN 978-9958-606-59-5CONTENTS: 1. Introduction; 2. Conduct of aerobic classes; 3. Adding and control of load in aerobic hour; 4. Structure of aerobic classes; 5. Legality of making of choreog-raphy; 6. Group fitness programs; 7. Application of group programs in sport; 8. Injurys in aerobics; 9. Health and beauty of woman; 10. References
Safet KapoKARATE – Find your wayFaculty of Sport and Physical Education, University of Sarajevo In Bosnian lenguangeSarajevo; 2011.ISBN 978-9958-606-59-5CONTENTS: 1. Introduction; 2. Basic rules of martial arts; 3. Karate sports activity anal-ysis; 4. Basic methods of karate; 5. Basic elements of karate; 6. Agreed sparring and working on exercise equipment; 7. Methods for assessing the technical readiness; 8. Tactics in the sport of karate, 9. Appendix, 10. References
Faris Rašidagić, Gordana Manić and Nedeljko VidovićTHE INFLUENCE OF MORPHOLOGICAL CHARACTERISTICS ON THE SUCCESS OF THE IMPLEMENTATION OF THE CONTENT OF TEACHING SPORTS AND PHYSICAL EDUCATIONFaculty of Sport and Physical Education, University of Sarajevo In Bosnian lenguangeSarajevo; 2011.ISBN 987-9958-606-58-8CONTENTS: 1. Introduction; 2. Position of education in society; 3. Previous studies; 4.The aims and tasks; 5. Hypothesis; 6. Methodological approach; 7. Results; 8. Gen-eralisability results; 9. Possibility of theoretical and practical applications; 10. Conclu-sion; 11. Summary; 12. Reference.
HOMO SPORTICUS ISSUE 2 201252
Husnija Kajmović, Izet Rađo and Amel MekićJUDO - Analysis of situational efficiency Faculty of Sport and Physical Education, University of SarajevoIn Bosnian lenguangeSarajevo; 2010.ISBN 978-9958-606-52-6CONTENTS: Preface, Introduction. PART ONE: 1. The spiritual basis of martial arts; 2. Systems of martial arts; 3. Historical development of Judo; 4. Principles of Judo; 5. Classification techniques in judo; 6. Characteristics of judo; 7. Methods of learning judo techniques; 8. Structural analysis of judo; 9. Methodology of training techniques of judo; 10. Judo as a self-defense; 11. Judo Games; 12.Excerpt from the rules of sport judo; 13. The benefits of exercise judo; 14. Questions for consideration; 15. Literature. PART TWO: 1. Introduction of the analysis of situational efficiency; 2. Determining the level of difference based on indicators of situational efficiency in judo; 3. Differences in the grip configuration when per-forming the throw between the male and female junior on European championship in judo – Sara-jevo, 2003.; 4. Instead of conclusion.
Murat Ramadanović, Munir Talović, Gordana Manić, Almir Mašala and Eldin JeleškovićMANAGEMENT IN SPORT Faculty of Sport and Physical Education, University of SarajevoIn Bosnian lenguangeSarajevo; 2010.ISBN 978-9958-606-51-9CONTENTS: 1. Preface; 2. Concept, development and function of human resource management in sport; 3. Human resources; 4. Presentation “Managing change”; 5. Presentation of the organi-zational structure OC BiH; 6. Annex - Sports development strategy bih
Munir Talović, Elvira Kazazović, \uro Žifko and Amela HadžiahmetovićTABLE TENISFaculty of Sport and Physical Education, University of Sarajevo In Bosnian lenguangeSarajevo; 2011.ISBN 978-9958-606-56-4CONTENTS: 1. Introduction; 2. Background table tennis; 3. Organizational structure of table tennis; 4. Equipment and accessories for table tennis; 5.Techniques in table tennis; 6. Tactics table tennis; 7. Methodology training beginners; 8. Psychological aspects of table tenis sport 9. Rules; 10. References.
HOMO SPORTICUS ISSUE 2 2012 53
Siniša Kovač BIOMECHANICS IN KINESIOLOGY Faculty of Sport and Physical Education, University of Sarajevo In Bosnian lenguangeSarajevo; 2010.ISBN 978-9958-606-49-6CONTENTS: 1. Introduction; 2. Meaning of Academic Subject Biomechanics; 3. Elements and Function of Locomotors Structures; 4. Kinematics and Kinetics in Biomechanics; 5. Posture Deformities; 6. Kinetics of Human Body in Kinesiology; 7. Biomechanics Analysis Addition; 8. References.
Elvir Kazazović and Alan ČaplarMOUNTAINEERING Faculty of Sport and Physical Education, University of Sarajevo In Bosnian lenguangeSarajevo; 2010.ISBN 978-9958-606-50-2CONTENTS: 1. Introduction; 2. History of mountaineering; 3. Mountains; 4. Equipment for climbing; 5. Meteorology; 6. Science of knots; 7. Hiking trails and markings; 8. Ori-entation; 9. Dangers and assistance in mountains; 10. Hiking ethics; 11. Hiking course; 12. Hiking nutrition; 13. Appropriate hydratation of hikers; 14. Mountaineering special-ties and skills; 15. Hiking tours; 16. Mountain camping; 17. Personal mountaineering activity; 18. What should a hiker know; 19. Contributions.
Nusret Smajlović and Vahida KozićMANAGEMENT OF ATHLETIC EVENTS (CD-ROM)Faculty of Sport and Physical Education, University of Sarajevo In Bosnian lenguangeSarajevo; 2010.ISBN 978-9958-606-45-8CONTENTS: 1. Preparing nominations; 2. General planning; 3. Management of compe-tition - Competition Authority; 4. Electronic Technology; 5. Data processing and infor-mation system; 6. Accreditation and Logistics; 7. Protocol and winning ceremonial; 8. Opening and Closing Ceremonies; 9. Promotions, public relations and graphic design ence; 10. Press; 11. Television and radio coverage of the competition; 12. Marketing and Sponsorship; 13. Accommodation; 14. Transport; 15. Medical services; 16. Safety; 17. Proposed list of projects within each department; 18. Bibliography
Nusret SmajlovićATHLETICS (CD-ROM)Faculty of Sport and Physical Education, University of Sarajevo In Bosnian lenguangeSarajevo; 2010.ISBN 978-9958-606-46-5CONTENTS: 1. Historical development of athletics; 2. The characteristics of athletics as “Queen of sports” and its role in the system of physical education; 3. Athletes in the school sport education; 4. Systematization of athletics; 5. Motor preparation in athletics; 6. Biomechanical and sport-technical preparedness in athletics; 7. Methodol-ogy training athletic events - general considerations; 8. Running; 9. Jumps;10. Throw-ing;11. Bibliography
HOMO SPORTICUS ISSUE 2 201254
Safet Kapo and Branko CikatićK-1 PATH TO PEAK Faculty of Sport and Physical Education, University of Sarajevo In Bosnian lenguangeSarajevo; 2010.ISBN 978-9958-606-43-4CONTENTS: 1. Introduction; 2. Analysis of K-1 sport; 3. Basic technical elements in K-1 sport; 4. Basic method of K-1 sport; 5. Basic tactics of K-1 sport; 6. Technical assessment of fitnes; 7. K-1 device and their application; 8. Specific methods in train-ing techniques in K-1; 9. Doping-challenge of contemporary social community; 10. Application of technical elements K-1 sport in delf-defense; 11. Splendors of the world K-1 sport; 12. References
Izet Rađo and Mile SadžakGLOBAL LEADERSHIPFaculty of Sport and Physical Education University of Sarajevo and Olympic Committee of Bosnia and HerzegovinaIn Bosnian lenguangeSarajevo; 2009.ISBN:978-9958-606-40-3CONTENTS: 1. Global leadership; 2. Theory of leadership; 3. Types of leadership; 4. The role of culture in leadership; 5. Human resources or path to global leadership; 6. Portrait of the global leaders; 7. Project GLOBE; Bibliography
Muhamed TabakovićPREDICTIVE VALUE of anthropological characteristics in the sports gymnastics Faculty of Sport and Physical Education, University of Sarajevo In Bosnian lenguangeSarajevo; 2008CONTENTS: 1. Summary; 2. Introduction; 3. Previous studies; 4. Object and problem of research; 5. Objectives and tasks of research; Hypothetical questions of the pre-sented papers; 6. Work methods; 7. Results and discussion; 8. Theoretical and practi-cal significance of the presented papers; 9. Generalizability of results; 10. Conclusion; 11. References
HOMO SPORTICUS ISSUE 2 2012 55
Munir Talović, Elvir Kazazović, Nenad Rogulj and Vatromir SrhojHANDBALLFaculty of Sport and Physical Education, University of Sarajevo In Bosnian lenguangeSarajevo; 2008.ISBN 978-9958-606-38-0CONTENTS: 1. Historical development of handball; 2. Organizational structure in hand-ball; 3. Technique without the ball; 4. Special techniques of the game without the ball in defense; 5. Technique with the ball; 6. Technique goalie; 7. Tactics games; 8. Basics methodology in handball; 9. Handball at school; 10. Application of additional elemen-tary games in the learning process handball; 11. Mini handball; 12. Rules of handball; 13. References
Izet Rađo, Faris Rašidagić and Husnija KajmovićCOMBAT GAMES IN SPORT AND PHYSICAL EDUCATION Faculty of Sport and Physical Education, University of Sarajevo In Bosnian lenguangeSarajevo; 2008.ISBN 978-9958-606-37-3CONTENTS: 1. Introduction; 2. Organization and application of combat games; 3. Dem-onstration of combat games; 4. Selecting an opponent, setting, attitudes, basic com-mands and end fighting; 5. Organizing and setting up combat games during teaching; 6. Division of combat games; 7. Combat games divided by task and subjects; 8. Games drawing and resistance; 9. Games to push an opponent; 10. Games maintaining the position; 11. Games to keeping the position; 12. Games of the struggle for space.; 13. Combat games for the subjects; 14. Conclusion; 15. References.
HOMO SPORTICUS ISSUE 2 201256
Instruction for authors
HOMO SPORTICUS is the official publication of the Faculty of sport and physical education in Sarajevo. It publishes original scientific papers, review papers and professional papers relating to: physical education, recreation, sports, sport games, sport medicine, sport physiology, sport psy-chology, sport sociology, sport philosophy, sport history, sport coaching, biomechanics, kinesitherapy, and dance. All material is assumed to be submitted exclusively unless otherwise stated, and must not have been published pre-viously except in abstract form. Each author should have participated sufficiently in the work to take public responsi-bility for the content and authenticity.
Material should be written in MS WORD text editor, font Times Roman, 12. Paper should not exceed 16 pages with double spacing including tables, illustrations and referenc-es. It should then be printed on one side with large margins (2,5 cm).The order of the text should be as follows:
Cover page: Title page providing details for all authors in-cluding surname, first name, degrees, complete address, telephone number and e-mail.
Second page: Provide on a separate page an abstract of not more than 200 words. Abstract is brief, comprehensive summary of the contents of the article which should clearly describe the problem, purpose, participants, method, the findings, conclusions and the implications. Abstract should be written in English and Bosnian.
Key words: not more than 5, characterizing the content of the pa per, should be written in English and Bosnian.
Text: Text should be divided in following sections - head-lines: Introduction, Methods (including participants, appa-ratus and procedures), Results, Discussion, Conclusion and References. All pages should be numbered consecu-tively commencing with the title page. Do not import tables or figures in text.
Introduction: state the problem, subject, and aim of their research as well as the relevant findings of prior research.
Method section includes detailed description of research. It precisely states the: participants, phenomena or objects under observation - research as well as the apparatus and procedure. Any statistical method must be stated, and any not in common use sh o uld be fully described or supported by references.
Results: state the results of research.
Discussion: Compare results of the work with previous published references. It is necessary to connect the con-clusions with the aims of the work, but avoid statements and conclusions that do not follow from work. When the discussion is relatively brief it is preferred to combine it with the previous Result section, yielding Results and Con-clusion section.
Tables: Tables must be typed on separate pages and should be followed by the reference list. All tables must be numbered consecutively and each must have a brief heading describing its contents. Tables must be referred to in the main text. All tables must be simple and should not duplicate information given in the text.
Ilustrations: Any illustration must be amrked with number according to their location in tekst, has to be of high qual-ity, resolution and clear for further editing. Size of illustra-tions should be larger than it will be in final printed form.
References: The references in the text should be cited ac-cording to the APA system (see: Publication Manual of the American Psychological Association. 4th Edition; see also: http://www.apa.org).
Paper and floppy disksSend one printed copy of manuscript on paper and on flop-py disk. Editorial board has the final decision on publishin of the articles.Manuscripts will not be returned.Manuscripts that have not been written according to the instructions will be returned to the author for editing.Submitted materials will be evaluated through blind review by at least two referees. Assessments by the referees will be presented anonymously to the author and, in the case of substantial reservations, the article will be returned to the author for correction.
Send all materials to the folowing adrress by mail or per-sonally:Fakultet sporta i tjelesnog odgoja, 71000 Sarajevo, Patriotske lige 41 or toe-mail: [email protected]
HOMO SPORTICUS
Scientific Journal of Sport and Physical Education
Indexed in: COBISS.BH, Index Copernicus, EBSCOHost,
SPORTDiscusTM with Full Text, SPONET, getCited, CABI,
Genamics Journal Seek, NewJour, Open J-Gate, Urlichweb