461


UEMK 2019 Proceedings Book 24/25 October 2019 Gaziantep University, TURKEY
2
UEMK 2019
PROCEEDINGS BOOK
24-25 October 2019
Mavera Kongre ve Kültür Merkezi
GAZIANTEP UNIVERSITY
DEPARTMENT OF ENERGY SYSTEMS ENGINEERING
TURKEY
UEMK 2019
BİLDİRİLER KİTABI
24-25 Ekim 2019
Mavera Kongre ve Kültür Merkezi
GAZİANTEP ÜNİVERSİTESİ
ENERJİ SİSTEMLERİ MÜHENDİSLİĞİ BÖLÜMÜ
TÜRKİYE
Copyright 2019 UEMK 2019

UEMK 2019 Proceedings Book 24/25 October 2019 Gaziantep University, TURKEY
3
4th INTERNATIONAL ENERGY & ENGINEERING CONGRESS 2019
PROCEEDINGS BOOK
4. ULUSLARARASI ENERJİ & MÜHENDİSLİK KONGRESİ 2019
BİLDİRİLER KİTABI
ISBN
978-975-7375-47-0
Onaylanma Tarihi
28/10/2019
Editör
Doç. Dr. Adem ATMACA
Gaziantep Üniversitesi
Mühendislik Fakültesi
Enerji Sistemleri Mühendisliği Yayınları
Gaziantep/ TÜRKİYE
Tel: +90 342 360 1200-3999
Fax: +90 342 360 1013
e-posta: [email protected]
web-site: http://uemk.gantep.edu.tr/
UEMK 2019 Proceedings Book 24/25 October 2019 Gaziantep University, TURKEY
4
TABLE OF CONTENTS
TABLE OF CONTENTS 4
SPONSORS 17
CHAIRS 18
ORGANIZING COMMITTEE 19
CONGRESS TOPICS 21
PREFACE 23
FULL PAPERS, ABSTRACTS AND POSTERS 26
EFFECT OF TEMPERATURE ON ANAEROBIC DIGESTION OF SEWAGE SLUDGE 27
THE DISINFECTION BY-PRODUCTS (THMS) LEVELS IN DRINKING TAP WATER
AT MOSTAGANEM REGION (NORTHERN WEST ALGERIA)-ALGERIA 29
SYNTHESIS AND CHARACTERIZATION OF ACTIVATED CARBON PRODUCED
FROM WASTE HUMAN HAIR MASS USING CHEMICAL ACTIVATION 30
THE EFFECTS OF ALCOHOL ADDITION TO FUEL ON PISTON WEAR IN A TWO-
STROKE ENGINE 32
NUMERICAL STUDY OF EFFECT OF SERPENTINE FLOW FIELD ON PEM FUEL
CELL STACK 41
INVESTIGATION OF SUITABILITY OF HIGH PERFORMANCE CARBON DERIVED
FROM TEA WASTE BIOMASS TO TRANSISTOR APPLICATIONS 54
DEVELOPMENT SEMICONDUCTIVE CARBON MATERIAL FROM BIOMASS AND
ITS DIODE APPLICATIONS 56

UEMK 2019 Proceedings Book 24/25 October 2019 Gaziantep University, TURKEY
5
DEVELOPMENT OF BORON DOPED SUPERCAPACITOR ENERGY STORAGE
MATERIALS FROM BIOMASS 58
MODELLING OF DIRECT CARBON FUEL CELL USING BIOCHAR AS FUEL 60
INVESTIGATION OF APPLICABILITY OF RENEWABLE CARBON IN ELECTRICAL
CIRCUIT 62
THICKNESS EFFECT OF MEMBRANE AND CATALYST LAYER ON THE PEM FUEL
CELL PERFORMANCE 64
THE INVESTIGATION OF FRESHWATER AND SEAWATER IN KAMIL ABDUS
LAGOON AS PART OF WATER POLLUTION CONTROL 76
MICRON-SIZED COAL PARTICLES AS A NOVEL FUEL ADDITIVE FOR DIESEL
ENGINE APPLICATION 94
A SURROGATE MODEL FOR AN OLD PROBLEM: LARGE DEFLECTIONS OF
CANTILEVERS 106
TRIANGULAR LAYOUT DETECTION IN 2D TRUSS OPTIMIZATION 117
CONCEPTUAL DESIGN METHODOLOGY FOR FOLDABLE MOBILE SHELTERS 126
INTRODUCTION 126
UTILISATION OF GLYCEROL ETHERS IN A DIESEL ENGINE 139
TEMPERATURE DEPENDENT DYNAMIC VISCOSITY OF VEGETABLE OIL-
BIODIESEL BLENDS 152
INVESTIGATION THE EFFECT OF TEMPERATURE ON DENSITIES OF CORN OIL
(CO)-DIESEL FUEL (DF) BLENDS 158
UNDERGRADUATE INDUSTRIAL CONTROL LABORATORY EXPERIMENTAL
SETUP: PART 2 TEMPERATURE CONTROL WITH PLC 164
UEMK 2019 Proceedings Book 24/25 October 2019 Gaziantep University, TURKEY
6
UNDERGRADUATE INDUSTRIAL CONTROL LABORATORY EXPERIMENTAL
SETUP: PART 1 FLOW RATE CONTROL WITH PLC 176
THE PERFORMANCE AND EMISSION ANALYSIS OF BIODIESEL PRODUCED
FROM SAFFLOWER SEED OIL IN A SINGLE CYLINDER DI DIESEL ENGINE 188
INVESTIGATION OF ENERGY QUALITY IN FABRIC DYING FACILITIES 196
EFFICIENCY ESTIMATION OF ENERGY GENERATING COUNTRIES WITH SOLAR
POWER PLANTS BY DATA ENVELOPMENT ANALYSIS 197
EXPERIMENTAL INVESTIGATION OF EFFECTS ON ENGINE PERFORMANCE AND
EXHAUST EMISSION PARAMETERS OF TERNARY FUEL BLEND AS DIESEL-
BIODIESEL-BUTANOL 206
SUSTAINABLE GREEN BUILDING ASSESSMENT FOR SHOPPING MALLS 213
PID CONTROL DESIGN FOR A COOLING SYSTEM 214
SUPPRESSION OF BONY STRUCTURES FROM CHEST ROENTGENS USING
INDEPENDENT COMPONENT ANALYSIS 223
DIELECTRIC CHARACTERIZATION OF ORGANIC LIQUIDS UNDER
CONFINEMENT: A STUDY OF ACETONITRILE 230
EFFECT OF CURING CONDITIONS ON THE MECHANICAL PROPERTIES OF
CONVENTIONAL CONCRETE WITH HYBRID FIBER 244
NUMERICAL INVESTICATION OF STRUCTURAL BEHAVIOR OF STEEL FRAMES
UNDER FIRE LOAD 258
CHALLENGES ON SMART THERMOSTAT SYSTEMS IN INTELLIGENT
BUILDINGS 264
EFFECT OF SHEAR SPAN AND REINFORCEMENT RATIO ON NORMAL AND
HIGH STRENGTH REINFORCED CONCRETE ONE WAY SLAB 275

UEMK 2019 Proceedings Book 24/25 October 2019 Gaziantep University, TURKEY
7
INNOVATIVE AND ENVIRONMENTALLY FRIENDLY TWO DIMENSIONAL
MATERIAL: BOROPHENE 289
THE ROLE OF SAFETY CONCERN AND NUTRITIONAL QUALITY IN ORGANIC
FOOD 300
DETECTION OF SCHIZOPHRENIA ON EEG SIGNALS BY USING RELATIVE
WAVELET ENERGY AS A FEATURE EXTRACTOR 301
URBAN TRANSFORMATION PROJECT USING ANALYTICAL HIERARCHY
PROCESS (AHP): CASE OF SANLIURFA 311
APPLICATION OF ENERGY AND EXERGY ANALYSES TO AN SI ENGINE
OPERATED AT DIFFERENT ENGINE LOADS WITH BIOFUEL-GASOLINE
BLENDS 324
FLEXURAL STRENGTH OF AUTOCLAVED AERATED CONCRETE PANELS
REINFORCED WITH STEEL REBARS 330
DECENTRALIZED CONTROL STRATEGY FOR FUEL CELL INVERTERS WITH GRID
INTEGRATION 336
INVESTIGATION OF WOB AND RPM FOR DIFFERENT BIT TYPES USED IN
WESTERN RAMAN DRILLINGS 350
UTILIZATION OF MALUS FLORIBUNDA JUICE AS A POTENTIAL FOOD
INGREDIENT: FOAM STABILITY, DRYING KINETICS AND POWDER
PROPERTIES 359
EFFECT OF HYDROGEN ON IMPACT RESPONSE OF DUCTILE CAST IRON 360
THE EFFECTS OF METHYLPARABEN AND PROPYLPARABEN ON EARLY
DEVELOPMENTAL STAGES AND TRANSCRIPTIONAL PROFILES OF
ZEBRAFISH 366
UEMK 2019 Proceedings Book 24/25 October 2019 Gaziantep University, TURKEY
8
TURKEY’S ELECTRICITY CONSUMPTION FORECASTING WITH ARTIFICIAL
NEURAL NETWORKS 368
FUZZY CHINESE POSTMAN PROBLEM AND AN APPLICATION 375
DEVELOPMENT OF SCADA SYSTEM FOR AN INDUSTRIAL NATURAL GAS
COMPRESSOR STATION 383
OVERVIEW OF AKSARAY’S SOLAR ENERGY STATUS 406
THE EFFECT OF THRUST BEARING FAILURES ON HYDROELECTRIC POWER
PLANTS AND INVESTIGATION OF SOLUTION METHODS 415
ANALYSIS OF RESEARCHES DEALING WITH ANAEROBIC DIGESTION ON THE
WORLD AND TURKEY 422
THE EFFECT OF LOW IRRADIANCE ON THE HARMONICS IN STAND-ALONE
PHOTOVOLTAIC SYSTEM 430
CHARPY IMPACT BEHAVIOR OF GLASS FIBER REINFORCED COMPOSITE PIPES
FABRICATED BY CONTINUOUS FILAMENT WINDING TECHNIQUE 440
SECOND LAW OPTIMIZATION OF WATER-PROPYLENE GLYCOL/ AL2O3
NANOFLUID FLOW IN VARIOUS SHAPES AND AREAS OF THERMAL DUCTS 448
COMPARISON OF CAPITAL COST FLOWS OF 1 MW SOLAR POWER PLANT WITH
AND WITHOUT SOLAR TRACKING SYSTEM 462
ESTIMATION OF GREENHOUSE GAS EMISSION FROM A DISSOLVED AIR
FLOTATION TANK 468
ENERGY COST ESTIMATION IN TERMS OF ORGANIC LOADING FOR A MEAT
PROCESSING INDUSTRY WASTEWATER TREATMENT PLANT 476
ESTIMATION OF GREENHOUSE GAS EMISSION FROM EXTENDED AERATION
ACTIVATED SLUDGE PROCESS 482

UEMK 2019 Proceedings Book 24/25 October 2019 Gaziantep University, TURKEY
9
UNMANNED AERIAL VEHICLES IN THE CONSTRUCTION INDUSTRY:
APPLICATIONS AND IMPLICATIONS 490
THE USE OF INTERNET OF THINGS IN THE CONSTRUCTION INDUSTRY 501
CO-HYDROTHERMAL TREATMENT OF LIGNITE AND WOOD SAWDUST 511
DETERMINATION OF EPILEPTIC EEG SİGNALS USING MULTIWAVELET
TRANSFORM AND RECURRENCE QUANTIFICATION ANALYSIS METHODS 513
CRASHWORTHINESS OF BASALT FIBER REINFORCED COMPOSITE PIPES
SUBJECTED TO QUASI-STATIC LATERAL COMPRESSION 531
DEVELOPMENT OF MULTIFERROIC MATERIALS FOR SPINTRONICS
APPLICATIONS 542
OPTICAL TWEEZING POTENTIAL OF INTEGRATED VORTEX BEAM EMITTER 544
TEMPERATURE STABILITY OF PVA-BORAX GEL ELECTROLYTE FOR
SUPERCAPACITORS 545
BEHAVIOR OF SULFATE-REDUCING BACTERIA IN SINGLE-STAGE ANAEROBIC
DIGESTERS PRETREATED WITH OZONE 546
COMPOSITES USED AS DENTAL BIOMATERIALS IN HUMAN BODY; A
REVIEW 548
EFFECT OF TEMPERATURE CHANGE AND DWELL TIME ON SURFACE
ROUGHNESS OF COMPOSITE MATERIAL IN ARTIFICIAL SALIVA MEDIUM 555
WEAR MECHANISMS OF INTRA-ORAL TRIBOLOGY; REVIEW 562
INVESTIGATION OF THE EFFECT OF ARTIFICIAL AGING ENVIRONMENT
TEMPERATURE ON MECHANICAL BEHAVIOR OF BIO-COMPOSITE MATERIAL
WITH NANO FILLER 568

UEMK 2019 Proceedings Book 24/25 October 2019 Gaziantep University, TURKEY
10
SOLAR ENERGY TECHNOLOGY IN RENEWABLE ENERGY 575
FREQUENCY DEPENDENT CHARACTERIZATION OF THE AL/CRN/N-SI
DEVICE 577
TEMPERATURE DEPENDENT DIELECTRIC CHARACTERISTICS OF THE
AL/CU:TIO2/N-SI DEVICE 588
PRODUCTION OF COBALT-NICKEL ALLOY THIN FILMS BY ORGANIC
COUMARIN INVESTIGATION OF THE STRUCTURAL AND THE MAGNETIC
PROPERTIES 597
CONTRIBUTION OF THE INVESTIGATION OF SMALL WIND AND SOLAR
ENERGY SYSTEMS TO TURKEYS ENERGY PRODUCTION 599
BUCKLING OF NANOBEAMS USING ADOMIAN DECOMPOSITION METHOD 601
VIBRATION OF NANOBEAMS USING ADOMIAN DECOMPOSITION METHOD 606
A CONCEPTUAL DECISION MAKING MODEL PROPOSAL FOR R&D PROJECT
SELECTION 612
HYBRID MULTI-LEVEL INVERTER BASED PHOTOVOLTAIC APPLICATION. 626
DESIGN OF AN EXPERIMENTAL SETUP FOR DETERMINING FRICTION
PARAMETERS OF LINEAR PNEUMATIC CYLINDERS 637
EFFECT OF HEAT TREATMENT PROCESS ON PHASE TRANSFORMATION OF
NEW TYPE ZIRCONIA BASED SOLID ELECTROLYTE SYSTEM 639
AUTOMATIC RECOGNITION OF VINE LEAF DISEASES USING DEEP LEARNING
AND CONVOLUTIONAL NEURAL NETWORKS 640
FACIAL EXPRESSION RECOGNITION USING CONVOLUTIONAL NEURAL
NETWORKS 648

UEMK 2019 Proceedings Book 24/25 October 2019 Gaziantep University, TURKEY
11
THERMODYNAMIC ANALYSIS OF HYBRID GEOTHERMAL POWER PLANT
SUPPORTED WITH BIOMASS USING DIFFERENT BIOMASSES 655
HYDROCHEMICAL INVESTIGATION OF HOT AND MİNERAL WATERS IN EMİR
GEOTHERMAL FIELD (KULA, MANİSA) 657
EXPERIMENTAL INVESTIGATION OF A SOLAR DISH COLLECTOR WITH SPIRAL
COIL TUBE HEAT EXCHANGER FOR HOT WATER PRODUCTION 659
INVESTIGATION OF CRYSTAL STRUCTURE OF BACEO3 BASED NEW TYPE
ELECTROCERAMICS DEPENDING ON TEMPERATURE AND GD ADDITIVE
AMOUNT 672
MINICHANNEL EVAPORATOR DESIGN FOR ELECTRONIC COMPONENTS IN
COMPUTER COOLING APPLICATIONS 675
EFFECTS OF AIR POLLUTION ON HUMAN HEALTH AND AIR POLLUTION
PROBLEM IN GAZIANTEP 676
OBSERVATION OF PRIMARY PARAMETERS IN TWO-STAGE ANAEROBIC
DIGESTERS UNDER UNSTEADY-STATE CONDITION 693
IDENTIFICATION AND EVALUATION OF TRAFFIC MANAGEMENT SCENARIOUS
USING MICROSCOPIC SIMULATION IN MEKELLE 694
SOLAR ASSISTED GROUND SOURCE HEAT PUMP MODELING AND
SIMULATION FOR VAN REGION 711
SEASONAL ENERGY STORAGE MODELING AND SIMULATION IN COLD
CLIMATE CONDITIONS (VAN REGION) 726
EXTRACTED OF AMORPHOUS SILICA FROM INDUSTRIAL RAW MATERIALS TO
USE AS AN ADDITIVE FOR THE DRILLING MUD 737
USABILITY OF DIATOMITE AS ADDITIVE MATERIAL IN WATER-BASED
DRILLING MUDS 744

UEMK 2019 Proceedings Book 24/25 October 2019 Gaziantep University, TURKEY
12
AN ANALYSIS FOR THE PERFORMANCE OF A MULTICORE CPU FOR
NUMERICAL SIMULATIONS WITH SEVEN POINT STENCIL CONFIGURATION 752
A STUDY ON THE INTERACTION BETWEEN CALIXARENE DERIVATIVES AND
BOVINE SERUM ALBUMIN 769
ELECTROCHEMICAL PROPERTIES OF CARBON SUPPORTED CU2MO6S8
NANOSTRUCTURES 774
INVESTIGATION OF THE EFFECT OF BREAD MOLD ON SOIL BASED MICROBIAL
FUEL CELL 775
THE EFFECT OF DEEP EUTECTIC SOLVENT ON COPPER RECOVERY FROM
COPPER SMELTING SLAG 779
THE EFFECT OF REACTION TIME ON COPPER RECOVERY FROM ANODE SLIME
BY USING BMIMBF4 (1-BUTYL-3-METHYLIMIDAZOLIUM
TETRAFLUOROBORATE) IONIC LIQUID 786
EFFECT OF TEOS AS CROSS-LINKER ON INTERFACE GFP EXPRESSED IN
E.COLI/TIO2 AT BIO-BASED SOLAR CELLS 792
PRODUCTION OF GLASS FIBER REINFORCED PHOTOVOLTAIC COMPOSITE
PANEL AND INVESTIGATION OF ITS ELECTRICAL PROPERTIES 797
ELEMENT ENRICHMENTS OF KARABOĞAZ FORMATION (ADIYAMAN)
ORGANIC-RICH ROCKS 809
AN APPLICATION AREA OF 4-D MATRIX 811
NEUTROSOPHIC DESICION TREE 820
USE OF TEA WASTE BASED ADSORBENTS FOR THE REMOVAL OF CATIONIC
DYE FROM AQUOUS SOLUTIONS 825
SYNHESIS AND CHARACTERIZATION OF ZNO PARTICLES 838

UEMK 2019 Proceedings Book 24/25 October 2019 Gaziantep University, TURKEY
13
LEFT BLANKECT OF AGITATION ON THE PROCESS OF BI METHANI 844
TREND ANALYSIS OF MONTHLY MEAN STREAMFLOW DATA WITH
MANNKENDALL AND INNOVATIVE ŞEN METHOD IN PAMUKLUK RIVER
DILAVER BRIDGE STATION
856
CARBON FOOTPRINT ANALYSIS OF A RESIDENTIAL BUILDING 866
EVALUATION OF FIN DESIGN IN TERMS OF HEAT TRANSFER IN PLATE HEAT
EXCHANGERS 880
INVESTIGATION OF HEAT TRANSFER FROM HEATED SURFACES BY USING
IMPINGING AIR JET 899
DESIGN OF EFFICIENT HEAT INTEGRATION BY PINCH AND EXERGY HYBRID
METHODOLOGY 913
A LITERATURE REVIEW ON THE USE OF MACHINE LEARNING ALGORITHMS IN
HEALTH 928
A LITERATURE REVIEW ON THESIS STUDIES REGARDING MACHINE LEARNING
IN TURKEY 957
PASSIVE THERMAL MANAGEMENT OF A SIMULATED BATTERY PACK AT
DIFFERENT DISCHARGE RATES 989
EFFECTS OF NATURAL GAS ENRICHMENT WITH HYDROGEN ON ENGINE
PERFORMANCE IN A COMPRESSION IGNITION ENGINE 1006
EXPERIMENTAL AND NUMERICAL MODELING OF A LOW FROUDE NUMBER
FREE HYDRAULIC JUMP 1014
LIFE CYCLE ASSESSMENT OF SOLAR PHOTOVOLTAIC ELECTRICITY
GENERATION POWER PLANT: A CASE STUDY OF KAYSERİ TURKEY 1026

UEMK 2019 Proceedings Book 24/25 October 2019 Gaziantep University, TURKEY
14
THE PROPERTIES OF HYBRID FIBER REINFORCED SELF-COMPACTING
CONCRETE WITH DIFFERENT TYPE MICRO FIBER 1040
SOME PROPERTIES OF HYBRID FIBER REINFORCED SELF-COMPACTING
CONCRETE CONTAINING BINARY AND TERNARY MINERAL ADMIXTURE 1052
PERFORMANCE ANALYSIS OF DIFFERENT MACHINE LEARNING ALGORITHMS
FOR THE DETECTION OF SCHIZOPHRENIA WITH EEG SIGNALS 1066
ECOLOGICAL CONDUCTIVE YARN PRODUCTION METHOD FOR ELECTRONIC
TEXTILES 1082
A RESEARCH ON SOUND WAVES AND FIRE EXTINGUISHING SYSTEMS 1091
GEMİ KAYNAKLI EMİSYONLARIN HESAPLANMASI; İSTANBUL HAYDARPAŞA
LİMANI UYGULAMASI 1101
IMPACT OF SVC DEVICES ON POWER SYSTEM LOSSES IN POWER SYSTEM
WITHOUT RENEWABLE ENERGY SOURCES 1103
BENEFITING FROM RAINWATER POTENTIAL IN HOUSINGS 1109
INVESTING THE EFFICIENCY OF GENERATING ENERGY USING SOLAR WIND
TECHNOLOGY 1118
CRITICAL THICKNESS CALCLATION OF A SLAB REACTOR FOR TRIPLET
ANISOTROPIC SCATTERING 1119
DETERMINATION OF STIFFNESS PARAMETERS IN FINITE ELEMENT ANALYSIS
OF INTERFERENCE FIT 1130
PROBLEMS AND SUGGESTIONS FOR SUSTAINABLE RENEWABLE SOLAR
ENERGY COOPERATIVING 1140
MECHANICAL PROPERTIES OF STEAM CURED CONCRETE INCORPORATING
QUARRY DUST 1152
UEMK 2019 Proceedings Book 24/25 October 2019 Gaziantep University, TURKEY
15
A STUDY TO FABRICATE ENVIRONMENTALLY-FRIENDLY CONDUCTIVE
TEXTILES 1153
STOCHASTIC CHINESE POSTMAN PROBLEM AND AN APPLICATION 1160
FALL-CONE TESTS ON A CLAYEY SOIL TREATED WITH ROCK POWDER-
SEWAGE SLUDGE ASH MIXTURES 1170
FABRIC PRODUCTION FROM TEXTILE FABRIC WASTES 1175
ENERGY VALORIZATION OF OIL PALM AGRO-RESIDUES BY AIR-DOWNDRAFT
GASIFICATION: TECHNICAL AND ECONOMIC ANALYSIS 1191
DETAILED COMPARISON OF HYDROGEN CONCENTRATION MODELLING IN
DIFFERENT METAL MATRICES 1215
EVALUATION OF DESICCANT DRYING SYSTEM DESIGNED FOR DRYING FOOD
WITH LOW TEMPERATURE IN DIFFERENT CLIMATE CONDITIONS 1226
MANUFACTURING OF A FINNED TYPE SOLAR AIR COLLECTOR AND
INVESTIGATION OF ITS PERFORMANCE IN OSMANIYE CLIMATE
CONDITIONS 1239
A COMPARISON OF HEURISTIC SEARCH ALGORITHMS IN AUTOMATIC
DETECTION OF SCHIZOPHRENIA 1248
EFFECT OF STEEL FIBER ON LOAD CARRYING CAPACITY OF REINFORCED
CONCRETE CORBELS 1259
NUMERICAL INVESTIGATION OF FLOW CHARACTERISTICS OF 90°PIPE BEND
FITTING USING NANOFLUID 1272
HEAT TRANSFER ANALYSIS IN CYLINDRICAL CORRUGATED CHANNEL WITH
CFD METHOD 1285

UEMK 2019 Proceedings Book 24/25 October 2019 Gaziantep University, TURKEY
16
STARCH CONVERSION IN CORN MALTOSE SYRUP PRODUCTION:
DETERMINATION OF OPTIMUM REACTION AND PROCESS CONTROL
PARAMETERS 1293
EARTHQUAKE ANALYSIS OF A SCHOOL PROJECT WITH TBDY 2018 1294
CALCULATION OF HEAT CONDUCTIVITY VALUES OF SOME METALS BY USING
ANN 1300
UNDERGRADUATE INDUSTRIAL CONTROL LABORATORY EXPERIMENTAL
SETUP: PART 3 LIQUID LEVEL CONTROL WITH PLC 1309
HEAT TRANSFER AND VARIABLE SPECIFIC HEATS OF WORKING FLUID IN
OTTO CYCLE 1325
ANALYSIS OF EFFECTS OF DYNAMIC TIME OF USE PROGRAM ON INDUSTRIAL
ELECTRICITY CONSUMPTION 1326
COLD-BONDING METHOD IN ARTIFICIAL AGGREGATE PRODUCTION 1341
ENERGY ANALYSIS OF A SOLAR-ASSISTED HEAT PUMP DRYING SYSTEM WITH
ENERGY STORAGE TANK 1348
AN OVERVIEW ABOUT THE USAGE OF NANOFLUIDS IN HEAT TRANSFER
ENHANCEMENT STUDIES 1372
MECHANICAL PROPERTIES OF STEAM CURED CONCRETE INCORPORATING
QUARRY DUST 1387

UEMK 2019 Proceedings Book 24/25 October 2019 Gaziantep University, TURKEY
17
SPONSORS
UEMK 2019 Proceedings Book 24/25 October 2019 Gaziantep University, TURKEY
18
CHAIRS
HONORORIAL CHAIR of UEMK 2019
Prof. Dr. Ali GÜR
Rector of Gaziantep University
TURKEY
CHAIR of UEMK 2019
Assoc. Prof. Dr. Adem ATMACA
Energy Systems Engineering
Gaziantep University
TURKEY

UEMK 2019 Proceedings Book 24/25 October 2019 Gaziantep University, TURKEY
19
ORGANIZING COMMITTEE
Assoc. Prof. Dr. Adem Atmaca
Prof. Dr. Bin Chen
Dr. Fatih Balcı
Dr. Martin Brabant
Assoc. Prof. Dr. Nihat Atmaca
Dr. Serap Sur Çelik
Ahmet Kılıç
Ali Erdem Rende
Furkan Kuzudişli
Gökçe Yürekli
Hande Topalbekiroğlu
Hanse Özel
Harun Taştan
Kübra İbolar
Merve Çamcı
Miraç Anıl Tunç
Nihal Turgut
Nisan Şafak Güler
Okan Dengiz
Zehra Kardaş
Rıdvan Candemir
Yusuf Yapıcı

UEMK 2019 Proceedings Book 24/25 October 2019 Gaziantep University, TURKEY
20
Yunus Emre Kandemir
Ahmed Talha Hız
Suat Köksüz
Ebru Gedik

UEMK 2019 Proceedings Book 24/25 October 2019 Gaziantep University, TURKEY
21
CONGRESS TOPICS
Energy
Modeling of Energy and Systems
Energy Transport, Power & Fuels
Energy Systems
Energy Supply and Demand
Renewable Energy Resources and Technologies
Energy Audit and Rational Use of Energy
Advanced Energy Technologies
Energy-Saving Technologies
Electrical and Electronics Engineering
Civil Engineering and green buildings
Climate Change and Global Warming
Environmental engineering, Environmental Systems and Telecommunications
Environmental Safety and Health
Water Resources and Future Conflicts
Solid Waste, Waste Treatment and Management
Soil pollution
Air Pollution Control
Noise and Vibration Control
Planning & Sustainable Development Policy
Environmental Policy, Planning and Economy
Energy Policy, Planning and Economics.
UEMK 2019 Proceedings Book 24/25 October 2019 Gaziantep University, TURKEY
22
Computer engineering
Global Climate Change
International cooperation to reduce carbon emissions
Industrial Engineering, Sustainable Materials
More Sustainable Product Design
Science for Sustainable Development
Social Security, Process Safety and Hazard Management
Waste Assessment and Treatment
Sustainable Urban Development
Mechanical Engineering
Mechanical and Structural Sustainability
Sustainable Chemical ProcessesTools to plan, design and operate integrated green
technology
Adsorption and Gas Storage Materials
Sustainable Agriculture and Organic Farming; Green Agriculture Technology
Food engineering, Food Safety and Organic Food
Nanotechnology for Sustainability
Life Cycle Assessment
Computation, Modeling and Simulation, Ecological Sustainability
Management, Green Economy and Sustainable Economic Development
Natural Sciences
UEMK 2019 Proceedings Book 24/25 October 2019 Gaziantep University, TURKEY
23
PREFACE
ÖNSÖZ
Dünya, ekonomide ve enerji sektöründe dengelerin değiştiği ve son derece dinamik
olduğu bir dönemden geçmektedir. Düşük maliyetli ve büyük petrol kaynaklarının
bulunduğu Orta Doğu’da yaşanan gelişmeler, küresel enerji güvenliğini uluslararası
gündemin üst sırasına taşımaktadır. Diğer yandan enerji talebi ve çevre ilişkisi önemini
korumakta, en zengin kaynaklara sahip ülkeler için bile enerji verimliliği ve çevresel etki
ana gündemi oluşturmaktadır.
Ülkelerin kalkınma, refah ve gelişmelerini sağlamada birincil derecede önemli olan
enerji, uluslararası sistemde en stratejik araçlardan biri haline gelmiştir. Enerji politikaları
kısa vadede enerji kaynaklarının uluslararası pazarlara güvenli biçimde ulaşmasını, arz
ve fiyatlama gibi konuları ele alırken, uzun vadede ise kalkınma planlamalarını ve
politikalarını içermektedir. Enerji kaynaklarına sahip olmak, enerji üretebilmek ve elde
edilen enerjiyi pazara ulaştıracak taşıma yollarını kontrol altında tutmak, günümüzde
devletlerin dış politika yapımında ağırlık verdikleri konular arasındandır. Enerji
güvenliği, ulusal ve küresel boyutta, devletlerin önümüzdeki dönemlerde de dış
politikalarına yön veren temel konulardan biri olmayı sürdürecektir.
Küresel mali kriz nedeniyle birçok ülke ekonomisinin daralma gösterdiği bir dönemde
Türkiye ekonomisi, 2008 yılındaki yavaşlamanın ve 2009 yılındaki küçülmenin ardından
toparlanarak önemli oranda büyüme sağlamıştır. Bu ekonomik büyümenin
sağlanmasında enerji sektörü hayati bir rol oynamaktadır. 2003-2016 arasında birincil
enerji arzımızın yılda ortalama %4,2 büyümüş olması ekonominin enerji tüketimiyle
beraber büyüdüğünü göstermektedir.
Türkiye, gelişmekte olan ülkeler içerisinde geçtiğimiz 15 yıllık dönemde enerji talep
artışının en hızlı gerçekleştiği ülkelerden biri olmuştur. Bu durumda Ülkemizin
belirlediği enerji stratejisi, çok kritik ve uzun dönemli etkileri olacak bir konudur. Aynı
zamanda ekonomik gelişme ile paralel olarak enerji ile birlikte doğal kaynakların
yönetimi de stratejik önemini korumaktadır.
2015-2019 Milli Enerji ve Maden Politikası Stratejimiz doğrultusunda başta yerli kömür
olmak üzere rüzgâr, güneş, hidrolik, jeotermal gibi yerli ve yenilenebilir enerji

UEMK 2019 Proceedings Book 24/25 October 2019 Gaziantep University, TURKEY
24
kaynaklarımızın enerji portföyündeki payının artırılmasına yönelik çabalarımız çevreci
bir anlayış ve sürdürülebilirlik ilkesi doğrultusunda yoğunlaştırılmıştır.
Bölgelerarası petrol ve doğal gaz ticaretinin rotalarına göre 2030 Yılına kadar petrol
ticaretinin iki kat artması beklenirken bölgeler arası gaz ticaretinin üç kat artacağı tahmin
edilmektedir.
Türkiye, mevcut uluslararası boru hatları ile hem ihtiyaçlarını karşılayıp gelir sağlıyor
hem de enerji kaynaklarının transferine aracılık ederek stratejik önemini artırıyor.
Türkiye, hayata geçirilecek uluslararası boru hattı projeleriyle de Orta Asya, Hazar ve
Orta Doğu bölgelerindeki zengin doğal gaz ve petrol rezervlerini Avrupa'nın ana tüketim
merkezlerine ulaştıran en önemli enerji köprülerinden biri olacak.
Küresel iklim değişiyor ve ekosistem, insan sağlığı ve ekonomiye yönelik giderek artan
kritik riskler getiriyor. Bu değişimler, dünya çapındaki insan faaliyetlerinin bir sonucu
olarak atmosfere yüksek miktarlarda sera gazı salındığından dolayı gerçekleşiyor. Bu
faaliyetler arasında hepsinden önemlisi elektrik üretimi, ısınma ve taşımacılık için fosil
yakıtların yakılması var. Fosil yakıtların yanması da çevreye ve insan sağlığına zararlı
hava kirleticilerin salınmasına neden oluyor.
Küresel olarak enerji kullanımı, insan faaliyetlerinden açığa çıkan sera gazı emisyonları
arasında açık ara en büyük kaynağı temsil ediyor. Küresel sera gazı emisyonlarının
neredeyse üçte ikisi, ısınma, elektrik, taşımacılık ve sanayide kullanılacak enerji için fosil
yakıtların yanmasıyla ilişkilendiriliyor.
Enerji krizi ve enerji savaşları 20.yy’dan beri üzerine çokça çizilip konuşulan iki kavram.
Artan nüfus oranı ve daha konforlu bir yaşam isteği enerji krizlerine yol açarken, enerji
savaşları daha siyasi bir konu olarak karşımıza çıkıyor. Sömürgeciliğin doğuşundan bu
yana süregelen zamanda, zengin enerji kaynaklarına sahip toprakların paylaşımı
konuşunda bir güç savaşı yaşanmıştır.
Süper güç diye tabir edilen devletler ve terör grupları enerji odaklı bir strateji
izlemektedir. Bundan dolayı yaşanan uluslararası siyasi krizlerin ve çatışmaların temel
sebeplerine baktığımızda enerji faktörünün olduğu görülür. Türkiye’nin artan elektrik
ihtiyacının karşılanması amacı doğrultusunda önemli yatırımlar gerçekleştirilirken,
ülkenin toplam kurulu gücünde ve dolayısıyla elektrik üretiminde son 30 yılda kayda
değer bir artış yaşandı. 1980’li yılların ortasında 10.000 MW’ın altında olan kurulu güç,
2018 sonu itibariyle 88.550 MW seviyesine çıktı.

UEMK 2019 Proceedings Book 24/25 October 2019 Gaziantep University, TURKEY
25
Önümüzdeki yirmi-otuz yıl için petrol ve doğalgaz arzında rezervler açısından bir sorun
olmasa da yeni rezervlerin aranması, üretilmesi, tüketiciye ulaştırılması gibi konular,
uluslararası ilişkileri etkileyen temel problem alanları olmaya devam edecek
görünmektedir.
Bu sene dördüncüsü düzenlenen konferansımız kamu, özel sektör ve akademik
kurumları biraraya getirerek karşılıklı görüş alış verişinde bulunma fırsatı vermiştir.
Enerji sektörü ve çevre başta olmak üzere mühendislik teknolojileri konularında yapılan
güncel akademik çalışmalar, yaklaşık 50’si yurt dışından olmak üzere 300’e yakın
katılımcı tarafından sunulmuştur. Gerçekleştirilen olan oturumlarda, enerji piyasaları,
sanayide enerji verimliliği, yenilenebilir enerji teknolojileri ile makine, inşaat, gida ve
elektrik elektronik mühendisliklerinin kapsamına giren birçok farklı alanda sorunlar
tartışılacak ve akademik çözüm önerileri ortaya konulmuştur. Kongremiz Mavera
Kongre ve Sanat Merkezi’nde bulunan 5 farklı salonda, toplam 18 oturumda yapılmış
olup, 300’e yakın katılımcı hocamız 167 akademik bildiri sunmuştur.
Organizasyon Komitesi Başkanı
Doç.Dr. Adem ATMACA
Enerji Sistemleri Mühendisliği Bölüm Başkanı
Gaziantep Universitesi
Ekim 2019

UEMK 2019 Proceedings Book 24/25 October 2019 Gaziantep University, TURKEY
26
FULL PAPERS, ABSTRACTS and POSTERS
UEMK 2019 Proceedings Book 24/25 October 2019 Gaziantep University, TURKEY
27
EFFECT OF TEMPERATURE ON ANAEROBIC DIGESTION OF SEWAGE SLUDGE Soukaina Aitlahyane*, Zehor Aityacine Laboratoire génie de l’Environnement Ressources Faculté des sciences et techniques, Université Sultan Moulay Slimane, Béni Mellal, [email protected] Hafida Hanine Laboratoire de biointerface et biofilm Faculté des sciences et techniques, Université Sultan Moulay Slimane, Béni Mellal. Brahim Lekhlif Hydrologie traitement et épuration des eaux et changement climatiques Ecole Hassania des ingénieurs. ABSTRACT: In Morocco, the volumes of wastewater discharged were estimated at 470 Mm3 per year in 1994 and would reach 900 Mm3 per year by 2020 (Ministry of Agriculture and Agricultural Development, Morocco 2008). Like developing countries, most wastewater is discharged into the natural environment without treatment. Nevertheless, in recent years, the increase in demand for water for human, industrial and agricultural consumption and the repeated droughts in Morocco have raised awareness among decision-makers to consider wastewater as a significant water resource, hence the need to consider a national wastewater treatment programme. As part of this policy, ONEE has set up several wastewater treatment plants at various sites. Many water treatment plants have been built and the State plans to increase the number of WWTPs nationwide to 280 water treatment plants by 2020. Wastewater treatment generates, on the one hand, clean, sanitized water discharged into the receiving environment or ready for reuse by various processes (bacterial beds, activated sludge, infiltration-percolation), and on the other hand, huge quantities of wastewater sludge that constitute an economic and environmental problem on a national scale. As a result, sludge management systems were sought. Among these sectors, we find anaerobic digestion, which seems an attractive option for the degradation of fermentable waste into useful products such as biogas and high quality compost. In this context, we carried out an experimental study on the anaerobic digestion of fermentable sludge. Two tests were installed, one with heating and the other without heating. The results of the physico-chemical analyses showed that anaerobic digestion with heating gave the best results in terms of: - Production of biogas. - A pH value of 7.8 shows that we have a favorable environment for anaerobic digestion and that the methanogen process has been successfully completed. - A reduction in COD and Organic Matter of 80% and 81% respectively, which clearly shows the reduction in organic load.

UEMK 2019 Proceedings Book 24/25 October 2019 Gaziantep University, TURKEY
28
Keywords: Wastewater treatment sludge, bio-methanization, physico-chemical characterization, anaerobic digestion.

UEMK 2019 Proceedings Book 24/25 October 2019 Gaziantep University, TURKEY
29
THE DISINFECTION BY-PRODUCTS (THMS) LEVELS IN DRINKING TAP WATER AT
MOSTAGANEM REGION (NORTHERN WEST ALGERIA)-ALGERIA
BENHAMIMED EL-Attafia Department of Biology, Faculty of Natural and Life Sciences, Abdelhamid Ibn Badis University of Mostaganem, Algeria, [email protected]
ABSTRACT: Chlorine is commonly used for the disinfection of drinking water in Algeria. During chlorination, chlorine reacts with organics matter in water to form the chlorination by-products including trihalomethanes. The high concentration autorised in drinking water is 100µg/l. These are carcinogenic compounds for humans. This problem leads us to undertake a study about hyperchloration and trihalomethanes analysis in drinking water, especially in Mostaganem region. For this, 18 samples of tap water are collected and analyzed using headspace solid-phase microextraction during the year 2017. The results obtained have shown that the maximal concentration is 172.61µg/l was in Achaacha region and 17.54µg/l in Salamandre area. It was concluded that the drinking tap water distributed in Mostaganem region, contains a considerable amount of Trihalomethanes, chlorodibromomethane and bromoform are in majority, this could impact directly on consumer’s health during a long period of time. Key words: Analyse, tap water, Trihalomethanes, Mostaganem.

UEMK 2019 Proceedings Book 24/25 October 2019 Gaziantep University, TURKEY
30
SYNTHESIS AND CHARACTERIZATION OF ACTIVATED CARBON PRODUCED FROM WASTE HUMAN HAIR MASS USING CHEMICAL ACTIVATION Meryem Dokumacı Recep Tayyip Erdogan University Engineering Faculty Department of Energy Systems Engineering Rize, Turkey [email protected] Safak Cam Recep Tayyip Erdogan University Faculty of Arts and Sciences, Department of Chemistry Rize, Turkey [email protected] Vagif Nevruzoğlu Recep Tayyip Erdogan University Engineering Faculty Department of Energy Systems Engineering, Rize, Turkey [email protected] Derya Bal Altuntaş Recep Tayyip Erdogan University Engineering Faculty Department of Bioengineering, Rize, Turkey [email protected] ABSTRACT: In this study, hair waste was converted into active carbon for the first time and its characteristics were analyzed. As chemical activation tool, zinc chloride (ZnCl2) was impregnated and then carbonized under different temperatures (250-300°C). Scanning Electron Microscope (SEM) images showed increase in the pores density, radius and volume of pores. X-ray diffraction analysis (XRD) showed that the samples had an amorphous structure. In Fourier transform infrared (FT-IR) spectroscope analysis, C=C and N-H vibrations observed in 1515-1520 cm-1 wave number of protein molecules were found to disappear with the increase in temperature. With Raman spectroscopy, the behaviours of D peak at 1344 cm-1 wave number and G peak at 1566 cm-1 wave number expressing structure layout in carbonized structures were analyzed depending on the temperatures. Between these intensities, (ID/IG) rate was found to differ in direct proportion to temperature. XRD spectrums showed that the samples are converted into a more irregular crystal structure. All these results implied that the waste hair mass could be used as an adsorbant material.

UEMK 2019 Proceedings Book 24/25 October 2019 Gaziantep University, TURKEY
31
Key words: Human hair, chemical activation, carbonization, active carbon. *Corresponding author: [email protected] REFERENCES Berndt, T. J. (2002). Friendship quality and social development. Current Directions in Psychological Science, 11, 7-10. Banat FA. Al-Asheh S. (2001). The use of human hair waste as a phenol biosorbent. Adsorpt. Sci. Technol, 19, 599–608 Gupta A. (2014). Human Hair “Waste” and Its Utilization: Gaps and Possibilities. J. Waste Manag., 1–17

UEMK 2019 Proceedings Book 24/25 October 2019 Gaziantep University, TURKEY
32
THE EFFECTS OF ALCOHOL ADDITION TO FUEL ON PISTON WEAR IN A TWO-STROKE ENGINE Salih özer Muş Alparslan University, Faculty of Engineering and Architecture, Mechanical Engineering [email protected] ABSTRACT: In this study, the effects of adding 20% by volume of methanol and ethanol into the fuel of a motorized scythe with a two-stroke gasoline engine, which is also used as a hand tool, were investigated. The effects of the added fuels obtained on this purpose on the fuel consumption value on the engine, the amount of drowsiness, piston and piston wear are investigated. For this reason, the effects of the motor scythe have been investigated for 50 hours and 100 hours. With the addition of methanol and ethanol, it was determined that the fuel consumption value compared to gasoline and the amount of wear increased when the wear increased. Key words: Two-stroke engine, Alcohol, Abrasion. İKİ ZAMANLI BİR MOTORDA YAKITINA ALKOL İLAVESİNİN PİSTON AŞINMASINA ETKİLERİ ÖZET: Bu çalışmada el aleti olarak da geçen iki zamanlı benzinli bir motora sahip motorlu tırpananın yakıtının içerisine hacimce %20 oranında metanol ve etanol ilavesinin etkileri incelenmiştir. Bu amaçla elde edilen ilave edilen yakıtların motor üzerindeki yakıt tüketim değerine, kuruntu bırakma miktarına, piston ve segman aşıntılarına etkileri incelenmiştir. Bu nedenle motorlu tırpan normal çalışma sürelerinde 50 saat ve 100 saatlik sürelerde çalıştırılarak etkileri incelenmiştir. Metanol ve etanol ilavesi ile benzine göre yakıt tüketim değerinin ve aşınmanın arttığı kuruntu miktarının ise azaldığı tespit edilmiştir. Anahtar sözcükler: İki zamanlı motor, Alkol, Aşınma GİRİŞ Enerji makinelerin iş yapabilme kabiliyeti olarak tanımlanmaktadır. Makineler iş yaparken enerji kaynağı olarak katı, sıvı ve gaz yakıtlarını kullanmaktadır. Dünyada bu tür yakıtlar petrol kökenlidir. Bu nedenle petrole alternatif olabilecek yakıtlar üzerinde arayışlar artmaktadır. Bu alanın başında da içten yanmalı motorlarda kullanılan yâda kullanılabilecek potansiyele sahip çok çeşitli biyolojik kökenli yakıtlarla ilgili yayınlar

UEMK 2019 Proceedings Book 24/25 October 2019 Gaziantep University, TURKEY
33
artmaktadır. Bunun yanında kendisi petrol üretemeyip dışarıdan petrol alan ülkelerde de kendi kaynakları ile üretilebilecek yakıt arayışları devam etmektedir. Bu aşamada çalışmalar hem yerli kaynaklarla üretilebilen hem de çevreci yakıtlar üzerinde durmaktadır (Bayraç ve ark. 20018). Fakat yapılan çalışmalar kullanım alanlarının büyüklüğü göz önünde bulundurularak genelde büyük silindir hacmine sahip dört zamanlı motorlarda denenmektedir. Fakat günlük hayatta kullandığımız birçok el aletinde (jeneratör, çapalama makinesi, sulama makinesi, çim makinesi, ilaçlama makinesi vb.) de içten yanmalı motorlar kullanılmaktadır (MAPAS 2019). Bu tür el aletleri birçok iş yeri ve fabrikada sıklıkla kullanılmaktadır. Bu tip el aletleri sürekli taşınması gerektiği için küçük motor hacimlerine sahip motorlar kullanılmaktadır. Benzinli yâda dizel seçenekleri ile satışa sunulan bu ev tipi araçlarda taşıtlarda kullanılan yakıtlar kullanılmaktadır. Bir içten yanmalı motor yakıtın yakıldığı alan altındaki pistonu ile itme gücü sağlanarak çalışmaktadır. Silindir içerisinde yakılan yakıtın yanma sonrası oluşturduğu itme gücü ile el aletine hareket enerji aktarılmaktadır. İçten yanmalı motorlar çalışma koşullarına göre iki yada dört zamanlı olarak adlandırılmaktadır. El tipi aletler sürekli taşınması gerektiği için genellikle kompakt ve hafif motorlar olan iki zamanlı motorlar tercih edilmektedir. El tipi aletlerde kullanılan iki zamanlı motorlarda ekstra bir yağlama sistemi olmayıp yakıt içerisine katılan yağlama yağı ile segmanların yağlama işlemi gerçekleştirilmektedir (Mengi 2004). Yağlama işleminde de genel olarak yakıt içerisine 1:50 oranında katılan 2T diye tabir edilen yağlar karıştırılmaktadır. Bu yağlar motorun uzun süren çalışması esnasında bazen görevini yerine getiremeyip adhezyon oluşmasına neden olabilmektedir. Aşınma tipinin en basiti olan adhezyon demirin demir ile sürtünmesi ile oluşup sürtündüğü parçalara zarar vermektedir. İçten yanmalı motorlarda segmanın gömlek ile sürtünmesi yada pistonun silindir gömleği ile sürtünmesi piston ve segmanlara zarar verebilmektedir. Bu durumda çalışan motorlar zamanla güçten düşerek çalışamaz duruma gelebilmektedir (Kaleli 2019). Alkoller bitkisel kaynaklardan üretilebilmektedir. Genel olarak taşıtlarda en çok kullanılan alternatif yakıt olarak ön plana çıkmaktadırlar. Günümüzde birçok ülkede %15’lere kadar benzin içerisine katılarak kullanılan örnekleri mevcuttur (Onurbaşavcıoğlu 2013). Daha önce yapılan çalışmalar incelendiğinde alkollerin yüksek oktan sayısının motorun çalışmasında iyileşmelere neden olduğu, hatta sıkıştırma oranının artırılması ile motor gücünde artışların görülebileceği bildirilmiştir (Balki ve ark.2012; Thahur et al. 2017). Benzin içerisine alkol ilavesi ile yapılan birçok çalışma ise belirli bir oranda kullanıma kadar motor performansı açısından olumsuzlukların oluşmadığını belirtmektedir (Wua et al., 2011). Yapılan çalışmalar emisyonlar açısından benzine alkol ilavesinde bazı iyileştirmelerin oluştuğunu da göstermektedir (Yüksek ve ark. 2019). Zulfattah et al. (2019), iki zamanlı tek silindirli bir motorda buji tırnak sayısının ve yakıt içerisine kattıkları ilave biyolojik yağların emisyonlara etkilerini incelemişlerdir.

UEMK 2019 Proceedings Book 24/25 October 2019 Gaziantep University, TURKEY
34
Etkilerini görebilmek için deney motorunu rölanti, orta gaz kolu konumu ve tam gaz kolu konumunda çalıştırarak emisyon parametrelerini incelemişlerdir. Tırnak sayısının artması ile emisyonların değiştiğini bildirmişlerdir. Raviteja, et al. (2019), iki zamanlı motora sahip insansız hava aracında yakıt katkısı olarak alkol türü olan nitrometanın itme, devir, tork, güç, frene özgü yakıt tüketimi ve fren ısıl verimi gibi motor etkilerini incelemişler ve metanol ilavesinin sonuçları ile kıyaslamışlardır. Elde ettikleri veriler göstermiştir ki kütlece %40 karışım oranlarında metanol yakıtana göre nitrometan ilavesiyle motor itişinde yaklaşık% 24 artış görülmüştür. Bu çalışmada iki zamanlı tek silindirli 3 hp’lik benzinli bir motora sahip çim biçme makinesinde gerçekleştirilmiştir. Bu motorların bir yağlama sistemi olmayıp yağ benzin yada dizel yakıtının içerisine doğrudan karıştırılarak segmanların yağlama işlemi gerçekleştirilmektedir. Bu çalışmada da benzin içerisine hacimsel olarak %20 oranında etanol ve metanol ilave edilmesinin piston ve segman aşıntısına ile yakıt tüketim değerine etkisi incelenmiştir. Her bir yakıt karışımı ile motorun 50 ve 100 saat doğal çalıştırılma koşullarında çalışması sağlanmıştır. YÖNTEM Bu çalışmada tek silindirli, iki zamanlı benzinli bir motorlu çim tırpanı kullanılmıştır. Makinenin bazı teknik özellikleri Tablo 1’de verilmektedir. Kullanılan motorlu tırpan makinesi şekil 1’de gösterilmektedir. Deneylerde kullanılan metanol ve etanol %99,6 saflık oranındadır. Deney yakıtlarının özellikleri Tablo 2 ve 3’de verilmektedir. Tablo 1. Motorlu Tırpanın Teknik Özellikleri (STHİL 2019).
STHIL FS460
Silindir Hacmi 45,60 cm3 Motor Gücü 3 HP Toplam Ağırlık 8,5 kg Benzin Deposu 0,75 lt
Tablo 2. Motor yağının özellikleri (OPET 2019a).
FULLTRAC 2T
Viskozite (mm2/s) 42,3 Yoğunluk (g/m3) 0,873 Parlama noktası (oC) 180 Akma Noktası (oC) -12
Tablo 3. Kullanılan yakıtların özellikleri (Özer, 2014; OPET2019b; Onurbaşavcıoğlu ve ark.2013) .

UEMK 2019 Proceedings Book 24/25 October 2019 Gaziantep University, TURKEY
35
Benzin Metanol Etanol
Kimyasal Formülü C5H10-C12H26 CH3OH C2H5OH Yoğunluk (g/m3) 0,732-0,755 0,796 0,788 Parlama Noktası (oC) -45 - -13 -40 - -21 12 - 20 Isıl Değer (Mj/kg) 44,3 20,11 26,9 Oktan Sayısı 95 108,7 108,6 Viskozite (mm2/s) 0,37-0,44 0,59 1,19
Üretici firma bu ürünü için benzin içerisine 1:50 oranında yağlama yağı ilave edilmesini önermektedir (STHİL 2019b). Yakıt karışımları için öncelikle benzin ve alkol karışımları oluşturulmuştur. Benzin içerisine hacimce %20 oranında etanol ve metanol ilave edilmiştir. Hazırlanan bu karışıma 1:50 oranında yağ ilave ederek deneylerde kullanılacak yakıtlar hazırlanmıştır. Yakıtlar günlük olarak hazırlanmış ve çalışma boyunca süreler bir kronometre ile kayıt altına alınarak toplam çalışma süresi tespit edilmiştir. Yakıt tüketim değerinin ölçülmesi için bir depo yakıtın tükenme süresi kronometre yardımı ile ölçülmüştür.
Şekil 1. Motorlu tırpanın görünüşü. Her bir yakıt karışımının kullanımından önce motorun piston ve segman seti yenilenmiştir. Tüm pistonlar ve segman setlerinde yerli üretim olan Episan markalı ürünler kullanılmıştır. Takılan ve sökülen motor piston ve segman setleri şekil 2’de gösterilmektedir. Belirlenen kullanım sürelerinden sonra motor piston ve segman seti sökülerek tortulu ve tortulardan temizlenmiş şekilde 0,0000 hassasiyetindeki bir terazide tartılmıştır. Deneyler tüm yakıt karışımları için tekrarlanmıştır. Oluşturulan karışımlar grafiklerde B100 (%100 benzin) BE20 (%80 benzin+%20 Etanol) ve BM20 (%80 benzin+%20 Metanol) olarak ifade edilmektedir.
UEMK 2019 Proceedings Book 24/25 October 2019 Gaziantep University, TURKEY
36
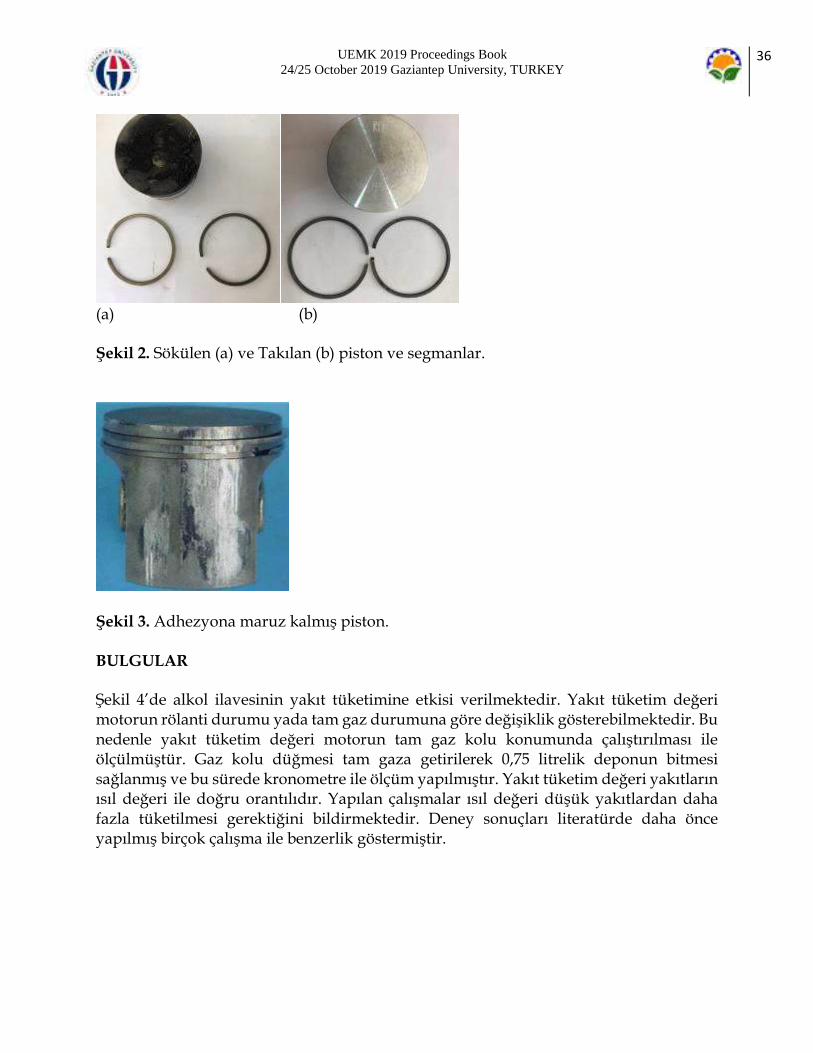
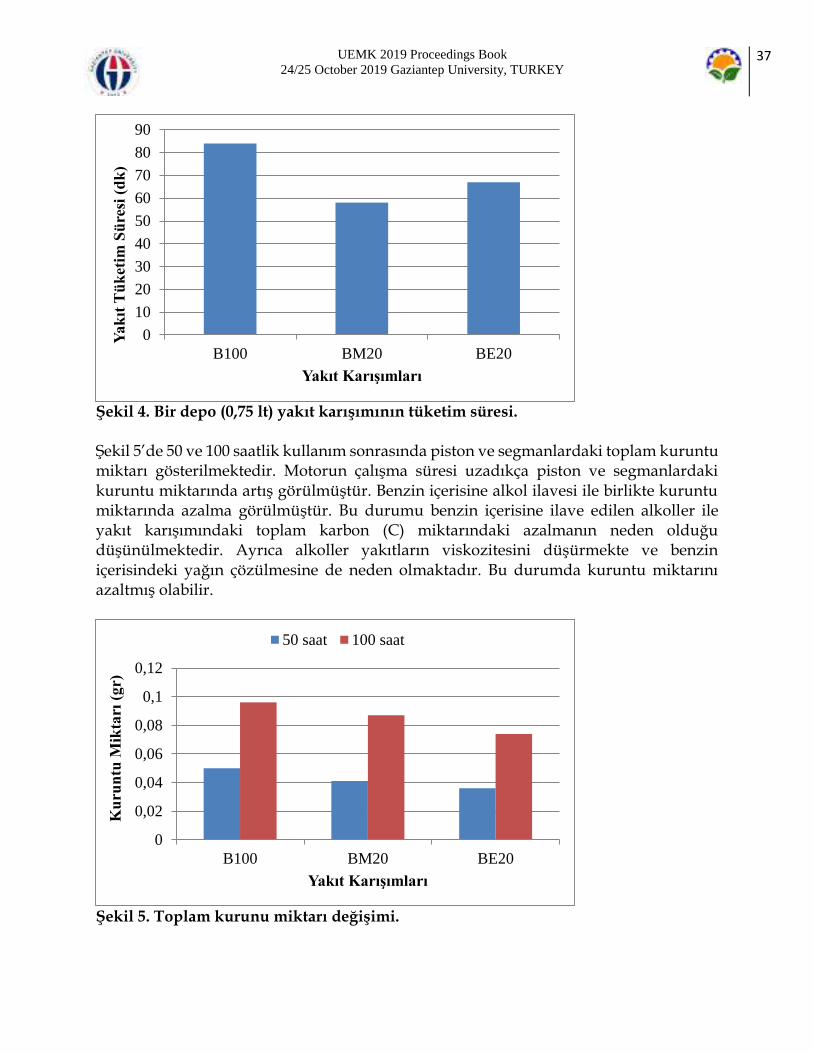
(a) (b) Şekil 2. Sökülen (a) ve Takılan (b) piston ve segmanlar.
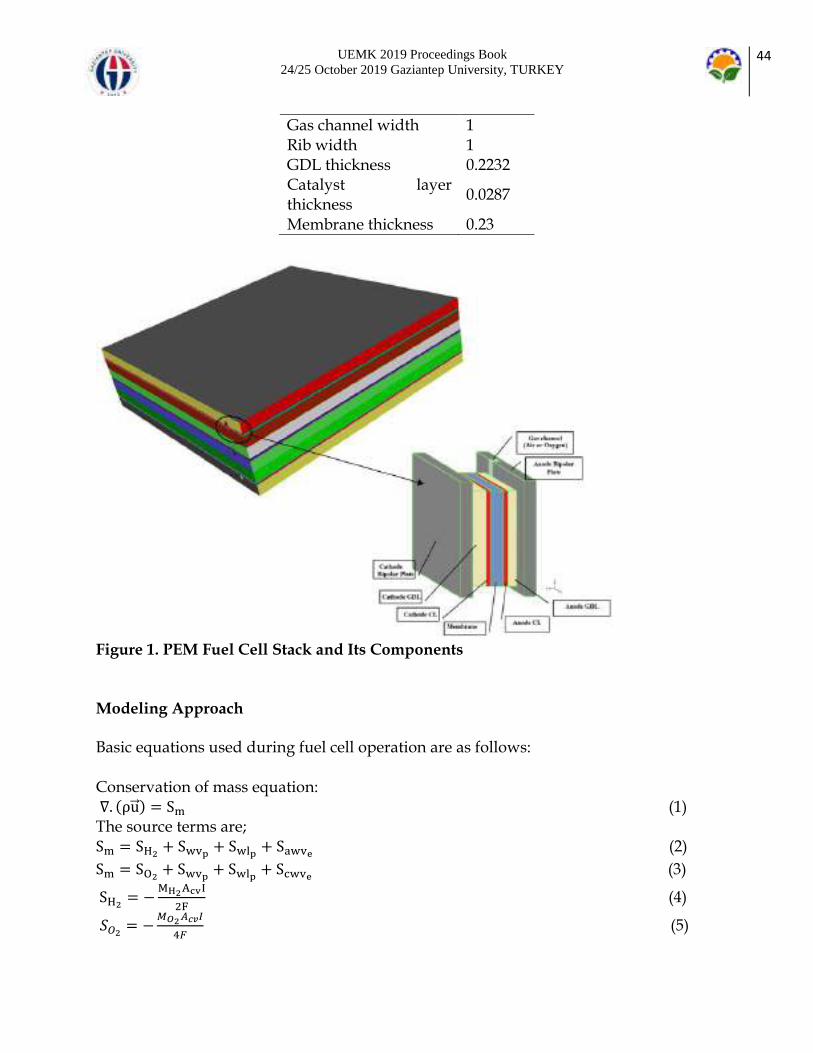
Şekil 3. Adhezyona maruz kalmış piston. BULGULAR Şekil 4’de alkol ilavesinin yakıt tüketimine etkisi verilmektedir. Yakıt tüketim değeri motorun rölanti durumu yada tam gaz durumuna göre değişiklik gösterebilmektedir. Bu nedenle yakıt tüketim değeri motorun tam gaz kolu konumunda çalıştırılması ile ölçülmüştür. Gaz kolu düğmesi tam gaza getirilerek 0,75 litrelik deponun bitmesi sağlanmış ve bu sürede kronometre ile ölçüm yapılmıştır. Yakıt tüketim değeri yakıtların ısıl değeri ile doğru orantılıdır. Yapılan çalışmalar ısıl değeri düşük yakıtlardan daha fazla tüketilmesi gerektiğini bildirmektedir. Deney sonuçları literatürde daha önce yapılmış birçok çalışma ile benzerlik göstermiştir.
UEMK 2019 Proceedings Book 24/25 October 2019 Gaziantep University, TURKEY
37
Şekil 4. Bir depo (0,75 lt) yakıt karışımının tüketim süresi. Şekil 5’de 50 ve 100 saatlik kullanım sonrasında piston ve segmanlardaki toplam kuruntu miktarı gösterilmektedir. Motorun çalışma süresi uzadıkça piston ve segmanlardaki kuruntu miktarında artış görülmüştür. Benzin içerisine alkol ilavesi ile birlikte kuruntu miktarında azalma görülmüştür. Bu durumu benzin içerisine ilave edilen alkoller ile yakıt karışımındaki toplam karbon (C) miktarındaki azalmanın neden olduğu düşünülmektedir. Ayrıca alkoller yakıtların viskozitesini düşürmekte ve benzin içerisindeki yağın çözülmesine de neden olmaktadır. Bu durumda kuruntu miktarını azaltmış olabilir.
Şekil 5. Toplam kurunu miktarı değişimi.
0
10
20
30
40
50
60
70
80
90
B100 BM20 BE20
Yak
ıt T
ük
etim
Sü
resi
(d
k)
Yakıt Karışımları
0
0,02
0,04
0,06
0,08
0,1
0,12
B100 BM20 BE20
Ku
run
tu M
ikta
rı (
gr)
Yakıt Karışımları
50 saat 100 saat

UEMK 2019 Proceedings Book 24/25 October 2019 Gaziantep University, TURKEY
38
Motorun 50 saatlik ve 100 saatlik kullanımı sonrasında kuruntulardan temizlenerek tartılan piston ve segmanlardaki ilk duruma göre değişimi Şekil 6’da verilmiştir. Kullanım süresinin artması ile aşıntı miktarının arttığı görülmektedir. Bilindiği gibi pistonlar çalışma esnasında silindir gömleğine dayanarak çalışmaktadır. Bu nedenle yağlamanın zayıfladığı noktalarda aşınmanın olması beklenilen bir durumdur. Alkol ilavesi ile birlikte aşıntı miktarında artış olmuştur. Bu durum yakıtların viskozitesindeki azalma ile açıklamak mümkündür. Azalan viskozite değeri yağlamanın tam manasıyla gerçekleşmesine engel olmaktadır. Bu nedenle alkol kullanımı benzine göre sürtünmeyi arttırmaktadır.
Şekil 6. Toplam aşıntı miktarı değişimi. Yapılan çalışmada ayrıca ilk çalıştırma durumunda benzine göre daha iyi bir performans elde edildiği görülmektedir. Bu durum alkollerin buharlaşma sıcaklıklarının benzine göre daha düşük olmasından kaynaklanmaktadır. Elle çekilerek ilk ateşlemenin sağlandığı bu araçlarda yakıtların bu özelliği önemli bir avantaj getirmektedir. SONUÇLAR VE ÖNERİLER Bu çalışmada el aletlerinde kullanılan iki zamanlı bir motorda alkol ilave edilmesinin etkileri incelenmiştir. Elde edilen sonuçlar göstermektedir ki;
İki zamanlı motora sahip bir el aletinde hacimce %20 oranında alkol ilave edilerek çalıştırılabilir.
Alkol ilavesi ile birlikte yağlamada aksilikler olmakta ve aşınma miktarı artmaktadır.
Motorun ürettiği kuruntu miktarında azalma görülmektedir. Bu çalışmanın devamı niteliğinde emisyonlar ile ilgili çalışmalar da yapılmalıdır. Bu nedenle emisyonlar açısından da incelenerek deneyler tekrarlanmalıdır.
0
0,05
0,1
0,15
0,2
B100 BM20 BE20
Aşı
nm
a D
eğiş
imi
(%
)
Yakıt Karışımları
50 saat 100 saat

UEMK 2019 Proceedings Book 24/25 October 2019 Gaziantep University, TURKEY
39
KAYNAKLAR Kaynaklar Balki, M. K., Sayın, C., Çanakcı, M., (2012). Farklı Alkol Yakıtların Buji Ateşlemeli Bir Motorun Performans, Emisyon ve Yanma Karakteristiklerine Etkisinin Deneysel İncelenmesi, 12. Uluslararası Yanma Sempozyumu, (ICS 2012), Mayıs 228-234. Bayraç, N.H., Çelikay, F., Çildir, M. (2018). Küreselleşme Sürecinde Sürdürülebilir Enerji Politikaları. Ekin Basım Yayın Dağıtım, Bursa. Kaleli, H. (2019). İçten yanmalı motorlarda aşınma, yağlama ve soğutma. https://www.yeniatmaca.com/blogs/icten-yanmali-motorlarda-asinma-yaglama-ve-sogutma.pdf, (Erişim: 26.06. 2019). MAPAS (2019), İki zamanlı motorların çalışması ve bakım koşulları, http://mapas.com.tr/blog/2-zamanli-benzinli-motor-calistirma-ve-bakimi/304, (Erişim: 26.06. 2019). Mengi, M., (2004). Modern İki zamanlı motorlarda verimi artırma yöntemlerinin incelenmesi, Yüksek Lisans Tezi, İstanbul Teknik Üniversitesi. Onurbaşavcıoğlu, A., Atasoy, Z. D., Türker, U., Koçtürk, D., (2013). Tarımsal Kökenli Yenilebilir Enerjiler: Biyoyakıtlar, Nobel Yayınevi, Ankara. OPET (2019a). Yağlama Yağının Teknik Özellikleri, http://www.opetfuchs.com.tr/urun/fulltrac-2t, (Erişim Tarihi: 26.06.2019). OPET (2019b). https://www.opet.com.tr/files/PDF/Urun/Ultra-Force-95-Oktan-urun-teknik-ozellikleri.pdf, (Erişim Tarihi: 26.06.2019). Özer, S., (2014). Alkollerin içten yanmalı motorlarda alternatif yakıt olarak kullanılması. Uludağ Üniversitesi Mühendislik-Mimarlık Fakültesi Dergisi, 19 (1): 97-114. Raviteja, S., Ramakrishna, P.A., Ramesh, A., (2019). Performance Enhancement of a Small Two-Stroke Engine Using Nitromethane Blends”, Journal of Propulsion and Power 35(3):1-10. STHİL (2019a). Motorlu Tırpanın Özellikleri. https://www.sadal.com.tr/Product?productId=211, (Erişim Tarihi: 26.06.2019). STHİL (2019b). Motorlu tırpan kullanım kılavuzu. http://admin2.sadal.com.tr/Upload/Image/STIHL%20FS%20%20460%20C-M-49f19e52492a4d7d890d56e7fd02b04e.pdf, (Erişim Tarihi: 26.06.2019). Thakur, A. K., Kaviti, A. K., Mehra, R., Mer, K.K.S. (2017). Progress in performance analysis of ethanol-gasoline blend on SI engine, Renewable and Sustainable Energy Reviews, 69, 324-340. Yüksel, T., Temizer, İ., Can, İ., Koca, F., (2019). Benzinli bir motorda ısıtılmış biyoetanolün ikincil yakıt olarak kullanılmasının etkileri”, Fırat Üniversitesi Mühendislik Bilimleri Dergisi, 31 (1): 67-77, Zulfattah Z.M., Zulkifli, N.W.M., Masjuki, H.H., Harith, M.H. Syahir, A.Z. Norain, I., Jumaidin, R., Yusoff M.N.A.M, Azham A., Jamshaid, M., Arslan, A. (2019). Effect of bio-

UEMK 2019 Proceedings Book 24/25 October 2019 Gaziantep University, TURKEY
40
based lubricant towards emissions and engine breakdown due to spark plug fouling in a two-stroke engine, Journal Of Cleaner Production, 221 (1): 215-223. Wua, X., Daniel, R., Tianb, G., Xub, H., Huanga, Z., Richardson, D., (2011). Dual-injection: The Flexible, Bi-Fuel Concept for Spark-Ignition Engines Fuelled with Various Gasoline and Biofuel Blends, Applied Energy, 88, 2305-2314.

UEMK 2019 Proceedings Book 24/25 October 2019 Gaziantep University, TURKEY
41
NUMERICAL STUDY OF EFFECT OF SERPENTINE FLOW FIELD ON PEM FUEL CELL STACK Elif EKER KAHVECİ Engineering Faculty, Mechanical Engineering Department Sakarya University Sakarya, TURKEY [email protected] Imdat TAYMAZ Engineering Faculty, Mechanical Engineering Department Sakarya University Sakarya, TURKEY [email protected] ABSTRACT: In this study, a 3-cell PEM fuel cell stack model that has serpentine flow channels with 150 cm2 active layer has been developed to show contour plots of molar concentrations of reactant gases, temperature and protonic potential. The model equations were solved using the commercial CFD software ANSYS Fluent® 16.2 and Gambit® 2.4.6 as a pre-processor. It was found from simulations that H2 concentration on the anode side in did not cause a visible decrease from the inlet to the outlet because of excessive flow rate required for chemical reactions. Also as shown in the figures clearly, the oxygen decreased and water concentration increased from the inlet of the channels to the outlet of the channels due to the reactions on the cathode side. Key words: CFD, PEM fuel cell stack, Molar concentration distribution INTRODUCTION Fuel cell that is expected to provide clean and efficient form of power generation by definition is an electrochemical device which changes chemical energy into electrical energy. Additionally PEM fuel cell are the most promising clean energy technologies in many applications like portable, automotive and stationary due to their high power density at low operating temperatures among the fuel cells. Modelling plays a very significant role in determining the best configuration for the reactant transport and the optimum operating conditions of PEM fuel cell in order to improve the performance. In literature, several modelling work has been investigated in order to understand the effect of operating and design parameters to the PEM fuel cell performance.

UEMK 2019 Proceedings Book 24/25 October 2019 Gaziantep University, TURKEY
42
Kahveci and Taymaz (2018) established a 3-D single PEM fuel cell model that was operated in 333–353K, the pressure range of 1–3atm, gas diffusion layer (GDL) porosity range of 0.3–0.6, both anode and cathode relative humidity range (RH) of 10–100% to investigate the performance. The current density and power density was measured according to these varying operation parameters. Also they compared simulation results with the experimental data reported in literature. It showed good agreement between the model and experimental results. Sezgin et al. (2016) observed a 3-D model of High Temperature PEM fuel cell by using COMSOL Multiphysics. Also they compared their results with experimental results 0.133 m/s H2 velocity, 1.3 m/s air velocity for 10 S/m proton conductivity at 160°C cell temperature. Shao et al. (2019) built a 2-D PEMFC model described by the Butler-Volmer equation, Darcy’s law and Maxwell-Stefan equations, to simulate the current density distribution and liquid water distribution in cathode by using COMSOL Multiphysics. Their results are that to achieve a more efficient water management to pretend the flooding in the cathode in the PEMFC, the material with appropriate smaller porosity should be used or a higher air mass flow rate should be applied in cathode to remove the produced liquid water in time. Carcadea et al. (2019) investigated numerically the effect of the catalyst microstructure on a 5 cm2 PEM fuel cell performance. They found that a higher platinum loading and a lower particle radius were recommended to achieve better performance. Wilberforce et al. (2019) studied a 3-D single serpentine model of PEM fuel cell in order to obtain the effect of humidification of reactive gases comparing with experimental results. They found that simulation with 100% relative humidity of oxygen and air showed a better results than the use of pure oxygen. Also flow rate of gases and their flow patterns played an important role in the improvement of water management and fuel cell performance. Park and Li (2007) performed a 3-D numerical simulation covering the entire flow channel and GDL in a serpentine PEM fuel cell to understand the effect of cross leakage flow on pressure distribution. The simulation indicated that permeability and thickness of GDL were the two most important parameters influencing the cross flow and the resultant pressure drops. Solati et al. (2019) investigated the influence of different configurations of catalyst, gas diffusion and membrane on the performance of the radial fuel cell. The maximum net power of the cell at the voltage of 0.5 V was found to be 1.594 W and 1.037 W for the R4C

UEMK 2019 Proceedings Book 24/25 October 2019 Gaziantep University, TURKEY
43
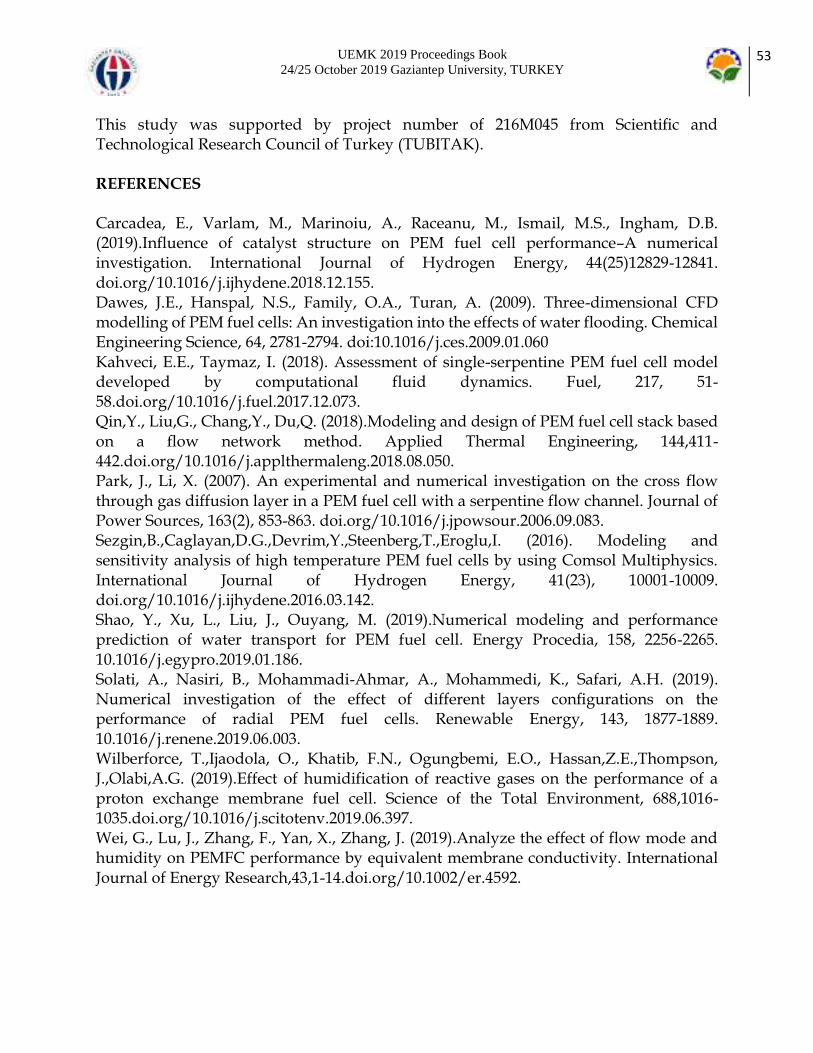
and R2CV models, respectively, and showed that it is possible to increase the cell power through modifying the configuration of the layers without any additional cost. Wei et al. (2019) developed a 3-D PEMFC having 25 cm2 active layer to investigate the effects of flow mode and relative humidity on cell performance. They found that membrane conductivity was improved from 10.35 to 11.11 S/m by using counter flow mode instead of co-flow mode. Also with high RH (%100) the membrane would contain more water and have a high conductivity. Dawes et al. (2009) developed a 3-D PEM fuel cell model to investigate the effects of water flooding on cell performance parameters. It was determined that the GDL permeability had little or no effect on the current densities due to the diffusion dominated nature of the gas flow. Although the diffusivity model improved the power of model, a multiphase model would represent a significant improvement. Qin et al. (2018) established a fuel cell stack model based on the flow network method to determine the pressure and mass distributions of the reactant gas and coolant streams by the flow network method incorporating the cross flow effect. The optimal designs for the fuel cell stack obtained as the cathode flow channel with a cross section of 0.25×0.25mm2 ,the cooling channel with a width of 2.16 mm, a depth of 0.6 mm ,a the mass flow rate of 1.992x10⁻² kg/s. In this study a structured grid scheme was employed which was built with a pre-processing software, GAMBIT 2.4.6. Then, the grid was imported into finite volume based commercial software, ANSYS-FLUENT 16.2. The PEMFC Module is an add-on module based on FLUENT CFD package for computations. This 3-D PEM fuel cell stack model with 3x70x70 mm2 active layer has been investigated by determining the current density, oxygen ,hydrogen and water molar concentration distributions took into account the mass, momentum, energy, species, charge conservation equation as well as combines electrochemistry reaction inside the fuel cell. METHODS In paper, the model presented is a 3-D, isothermal, single-phase, steady-state model that resolves coupled transport processes in membrane, catalyst layers, gas diffusion layers and reactant flow channels of a PEM fuel cell (Fig.1). Dimensions of PEM fuel cell model components are given at Table 1. Table 1 Dimensions of PEM Fuel Cell Model
Parameter Value (mm)
Gas channel depth 1
UEMK 2019 Proceedings Book 24/25 October 2019 Gaziantep University, TURKEY
44
Gas channel width 1 Rib width 1 GDL thickness 0.2232 Catalyst layer thickness
0.0287
Membrane thickness 0.23
Figure 1. PEM Fuel Cell Stack and Its Components Modeling Approach Basic equations used during fuel cell operation are as follows: Conservation of mass equation: ∇. (ρu ) = Sm (1) The source terms are; Sm = SH2 + Swvp + Swlp + Sawve (2)
Sm = SO2 + Swvp + Swlp + Scwve (3)
SH2 = −MH2AcvI
2F (4)
𝑆𝑂2 = −𝑀𝑂2𝐴𝑐𝑣𝐼
4𝐹 (5)

UEMK 2019 Proceedings Book 24/25 October 2019 Gaziantep University, TURKEY
45
Momentum transport equation: 𝛻. (𝜌 ) = −𝛻𝑃 + 𝛻. (𝜇𝛻 ) + 𝑆𝑝,𝑖 (6)
Here 𝛽 is the permeability. 𝑆𝑝,𝑖 is the sink source term for porous media in x, y and z-
directions;
𝑆𝑝,𝑖 = −(∑1
𝛽𝑗
3𝑗=1 𝜇𝑢𝑗) (7)
Species transport equation: 𝛻. (𝜌𝑚𝑛 ) = 𝛻. (𝐽𝑛) + 𝑆𝑠 (8) Here n denotes for 𝐻2, 𝑂2 water vapor and liquid water. The source terms are the same as those of the conservation of mass equation. The diffusion mass flux (J) of species n in n-direction is:
𝐽𝜉,𝑛 = −𝜌𝐷𝜀,𝑛𝜕𝑚𝐾,𝑛
𝜕𝜉 (9)
Energy equation: 𝛻. (𝜌 ℎ) = 𝛻. (𝑘𝛻𝑇) + 𝑆ℎ (10) The source term 𝑆ℎ can be obtained by energy losses and heat source by phase change. The heat source from the electrochemical reaction:
𝑆ℎ𝑒 = ℎ𝑟𝑥𝑛 [𝐼𝐴𝑐𝑣
2𝐹] − 𝐼𝑉𝑐𝑒𝑙𝑙𝐴𝑐𝑣 (11)
The local current density of the cell is calculated from the open circuit voltage (𝑉𝑜𝑐) and the losses;
𝐼 =𝜎𝑚
𝑡𝑉𝑜𝑐 − 𝑉𝑐𝑒𝑙𝑙 − (12)
Where t is the membrane thickness and 𝜎𝑚 is the membrane conductivity and defined as;
𝜎𝑚 = (0.514𝑀𝑚,𝑑𝑟𝑦
𝜌𝑚,𝑑𝑟𝑦𝐶𝑤𝑎 − 0.326) . 𝑒𝑥𝑝 (1268 (
1
𝑇0−
1
𝑇)) (13)
The procedure to model PEM fuel cell is (Fig.2);

UEMK 2019 Proceedings Book 24/25 October 2019 Gaziantep University, TURKEY
46
Figure 2. Modeling Procedure of PEM Fuel Cell Solution Algorithm The solution strategy was based on the SIMPLE algorithm. Momentum equations were solved for the velocity followed by solving the equation of continuity, which updates the pressure and the flow rate. A HP-PC-Intel®Xeon® CPU [email protected] GHz, 2.6 GHz, 64 GB was used to solve the set of equations. The computational time for solving the set of equations was about 476 min. Physical and electrochemical parameters are shown in Table 2, operating and boundary conditions of PEMFC model are given in Table 3. Table 2 Physical and Electrochemical Parameters of PEM Fuel Cell Model
Anode Cathode
Parameter Value Unit Parameter Value Unit
Reference current density
10000 A/ m² Reference current density
20 A/ m²
Reference concentration
1 kmol/m3 Reference concentration
1 kmol/m3
Reference diffusivity
3e-05 m2/s Reference diffusivity 3e-05 m2/s
GDL viscose resistance
1e+12 1/ m2 GDL viscose resistance
1e+12 1/ m2
GDL porosity 0.5 - GDL porosity 0.5 - Catalyst porosity 0.5 - Catalyst porosity 0.5 - Catalyst surface/volume
200000 1/m Catalyst surface/volume
200000 1/m
Concentration exponent
0.5 - Concentration exponent
1 -

UEMK 2019 Proceedings Book 24/25 October 2019 Gaziantep University, TURKEY
47
Exchange coefficient 2 Exchange coefficient 2 -
Open circuit voltage 2.85 V
Active layer 0.015 m2
Membrane equivalent weight
1100 kg/kmol
Boundary Conditions Boundary conditions are set as follows: constant mass flow rate at the channel inlet (mass flow inlet type) and constant pressure condition at the channel outlet (pressure outlet type). The membrane-GDL interface was defined as a wall. The anode voltage was grounded (V = 0) and the cathode voltage was adjusted 2.7 V, 2.4 V, 2.1 V, 1.8 V, 1.5 V, 1.2 V respectively less than the open-circuit potential (2.85 V). Boundary of PEM fuel cell stack model is given at Fig. 3. The current density values which correspond to each voltage value in the simulation results were noted. Both anode and cathode terminals were assigned wall boundaries. Hydrogen and oxygen velocities are evaluated from the chemical stoichiometric ratio, operational pressure and temperature by the following equations:
𝑢𝑎,𝑖𝑛
= 𝑎
𝐼𝑟𝑒𝑓
𝑛𝑒 . 𝐹. 𝐴𝑀𝐸𝐴.
1
𝑋𝐻2,𝑖𝑛.𝑅. 𝑇𝑖𝑛,𝑐𝑒𝑙𝑙𝑃𝑎,𝑖𝑛
.1
𝐴𝑐ℎ (14)
𝑢𝑐,𝑖𝑛
= 𝑐
𝐼𝑟𝑒𝑓
𝑛𝑒 . 𝐹. 𝐴𝑀𝐸𝐴.
1
𝑋𝑂2,𝑖𝑛.𝑅. 𝑇𝑖𝑛,𝑐𝑒𝑙𝑙𝑃𝑐,𝑖𝑛
.1
𝐴𝑐ℎ (15)
Figure 3. Boundary of PEM Fuel Cell Stack Model

UEMK 2019 Proceedings Book 24/25 October 2019 Gaziantep University, TURKEY
48
Table 3. Operating and Boundary Conditions of PEM Fuel Cell Model
Zone Parameter Unit Value
Anode
Operation pressure
kPa 200
Operation temperature
K 333
RHa % 100 Mass flow rate kg/s 1.659x10-
3
Mass fraction of H2
- 0.378
Mass fraction of H2O
- 0.622
Cathode
Operation pressure
atm 200
Operation temperature
K 333
RHc % 100 Mass flow rate kg/s 2.910x10-
2
Mass fraction of O2
- 0.247
Mass fraction of H2O
- 0.0097
Mesh Independence Study A grid independence test was carried out to determine the number of optimum meshes and to check that the results are independent of the grid. The number of cells for tests, the grids were 45150, 697200 and 5107200 respectively. As shown in the Fig. 4, no considerable difference in the results for the number 2 and number 3 grids and thus the results of the number 2 grid are used for the simulations. The computational time for solving the set of equations was about 476 min for number 2 grid model.

UEMK 2019 Proceedings Book 24/25 October 2019 Gaziantep University, TURKEY
49
Figure 4. Mesh Independence Study for Three Different Grid RESULTS AND FINDINGS The fact that the H2 concentration on the anode side in the Fig. 5 does not cause a visible decrease from the inlet to the outlet is due to the fact that the flow rate is higher than the required for chemical reactions. Similar results were obtained in single-cell analysis at previous studies. As shown in Fig. 6, due to the reactions on the cathode side, the oxygen concentration decreases from the inlet of the channels to the outlet of the channels.

UEMK 2019 Proceedings Book 24/25 October 2019 Gaziantep University, TURKEY
50
Figure 5. Molar Concentration Distributions of H2 for Given Operating Conditions at 0.6 V in 3-Cell Fuel Cell Stack.
Figure 6. Molar Concentration Distributions of O2 for Given Operating Conditions at 0.6 V in 3-Cell Fuel Cell Stack.

UEMK 2019 Proceedings Book 24/25 October 2019 Gaziantep University, TURKEY
51
Figure 7. Molar Concentration Distributions of H2O for Given Operating Conditions at 0.6 V in 3-Cell Fuel Cell Stack. It is observed as shown in Fig. 7 that the largest amount of water molar concentration was obtained in the mid region of anode side and the water observed at the anode region is due to the fact that the hydrogen gas is fully humidified. Also in Fig. 7, it is seen that the water formed as a result of the reactions on the cathode side creates an increase from the inlet to the outlet and does not create an excessive change on the anode side and provides the desired humidity in the membrane layers.
Figure 8. Temperature Distributions for Given Operating Conditions at 0.6 V in 3-Cell Fuel Cell Stack. The temperatures in the middle layers are higher than the temperature of the components of the edge cells, because the temperature cannot be removed as a result of the reactions. (Fig.8)

UEMK 2019 Proceedings Book 24/25 October 2019 Gaziantep University, TURKEY
52
Figure 9. Contours of Protonic Potential for Given Operating Conditions at 0.6 V in 3-Cell Fuel Cell Stack. It is shown that the protonic potential for given operating conditions at 0.6 V in 3-cell Fuel cell stack from anot side to cathode side in Fig.9. It is expected that the protonic potential shows an increasing properties from the anode to the cathode, since the reactions take place on the cathode side. CONCLUSIONS In this study a 3-D CFD model of PEM fuel cell stack with serpentine flow channels was developed to investigate stack temperature, molar concentration of reactant gases at each cell. The temperature and mass flow distributions in the fuel cell stack have been obtained from the modeling. The structured grid scheme was employed which was built with a pre-processing software, GAMBIT 2.4.6. Then, the grid was imported into finite volume based commercial software, ANSYS-FLUENT 16.2. The PEMFC Module is an add-on module based on FLUENT CFD package for computations. The distributions of oxygen, hydrogen and water molar concentration were taken into account the mass, momentum, energy, species, charge conservation equation as well as combines electrochemistry reaction inside the fuel cell. In the numerical study, verification was performed under the highest operating conditions obtained from the experiments in previous studies. ACKNOWLEDGEMENTS
UEMK 2019 Proceedings Book 24/25 October 2019 Gaziantep University, TURKEY
53
This study was supported by project number of 216M045 from Scientific and Technological Research Council of Turkey (TUBITAK). REFERENCES Carcadea, E., Varlam, M., Marinoiu, A., Raceanu, M., Ismail, M.S., Ingham, D.B. (2019).Influence of catalyst structure on PEM fuel cell performance–A numerical investigation. International Journal of Hydrogen Energy, 44(25)12829-12841. doi.org/10.1016/j.ijhydene.2018.12.155. Dawes, J.E., Hanspal, N.S., Family, O.A., Turan, A. (2009). Three-dimensional CFD modelling of PEM fuel cells: An investigation into the effects of water flooding. Chemical Engineering Science, 64, 2781-2794. doi:10.1016/j.ces.2009.01.060 Kahveci, E.E., Taymaz, I. (2018). Assessment of single-serpentine PEM fuel cell model developed by computational fluid dynamics. Fuel, 217, 51-58.doi.org/10.1016/j.fuel.2017.12.073. Qin,Y., Liu,G., Chang,Y., Du,Q. (2018).Modeling and design of PEM fuel cell stack based on a flow network method. Applied Thermal Engineering, 144,411-442.doi.org/10.1016/j.applthermaleng.2018.08.050. Park, J., Li, X. (2007). An experimental and numerical investigation on the cross flow through gas diffusion layer in a PEM fuel cell with a serpentine flow channel. Journal of Power Sources, 163(2), 853-863. doi.org/10.1016/j.jpowsour.2006.09.083. Sezgin,B.,Caglayan,D.G.,Devrim,Y.,Steenberg,T.,Eroglu,I. (2016). Modeling and sensitivity analysis of high temperature PEM fuel cells by using Comsol Multiphysics. International Journal of Hydrogen Energy, 41(23), 10001-10009. doi.org/10.1016/j.ijhydene.2016.03.142. Shao, Y., Xu, L., Liu, J., Ouyang, M. (2019).Numerical modeling and performance prediction of water transport for PEM fuel cell. Energy Procedia, 158, 2256-2265. 10.1016/j.egypro.2019.01.186. Solati, A., Nasiri, B., Mohammadi-Ahmar, A., Mohammedi, K., Safari, A.H. (2019). Numerical investigation of the effect of different layers configurations on the performance of radial PEM fuel cells. Renewable Energy, 143, 1877-1889. 10.1016/j.renene.2019.06.003. Wilberforce, T.,Ijaodola, O., Khatib, F.N., Ogungbemi, E.O., Hassan,Z.E.,Thompson, J.,Olabi,A.G. (2019).Effect of humidification of reactive gases on the performance of a proton exchange membrane fuel cell. Science of the Total Environment, 688,1016-1035.doi.org/10.1016/j.scitotenv.2019.06.397. Wei, G., Lu, J., Zhang, F., Yan, X., Zhang, J. (2019).Analyze the effect of flow mode and humidity on PEMFC performance by equivalent membrane conductivity. International Journal of Energy Research,43,1-14.doi.org/10.1002/er.4592.

UEMK 2019 Proceedings Book 24/25 October 2019 Gaziantep University, TURKEY
54
INVESTIGATION OF SUITABILITY OF HIGH PERFORMANCE CARBON DERIVED FROM TEA WASTE BIOMASS TO TRANSISTOR APPLICATIONS Saliha Nur BIÇAKÇI Department of Energy Systems Engineering, Recep Tayyip Erdogan University, Fener-Rize, 53100, Turkey [email protected] Asst. Prof. Dr. Gökçen AKGÜL Department of Energy Systems Engineering, Recep Tayyip Erdogan University, Fener-Rize, 53100, Turkey [email protected] ABSTRACT: Carbon materials are studied in high-tech electronics such as diodes, transistors similar devices (Feng et al., 2018). The use of porous carbon materials in electronic devices and their application in energy storage areas are important in terms of developing more economical methods and reducing the dimensions. Although a large number of carbon channel transistors have been reported in the literature in recent years, transistor applications of carbon from biomass as porous carbon are limited. Most of the carbon materials are originated from fossil sources that are diminishing. So, renewable carbon resources are gaining importance. Biomass is the only renewable carbon resource. It can be converted to carbonized material called biochar by pyrolysis. However, in order to apply the biochar to carbon-based electrical devices, its structure needs to be improved. In this study, biochar obtained from industrial tea wastes was converted to high performance and n-dopped carbon material (graphene-like) by chemical and physical methods (Roy, 2017; Smith et al., 2019). The upper contact / upper door structured field effect transistors (FETs) were made by using these carbon materials that silver paint was used as contact point paste (Koç et al., 2019;). The newly derived carbon materials were characterized by SEM, XRD, Raman Spectroscopy, FT-IR, TGA methods. The current –voltage (I-V) characteristics of the developed FETs were determined. Key words: industrial tea waste, carbon, field effect transistor Acknowledgement: We gratefully acknowledge the financial support provided by Recep Tayyip Erdoğan University, Scientific Research Projects Coordinator Unit (BAP) (Project No: FYL-2018-970). ÇAY ATIĞI BİYOKÜTLESİNDEN TÜRETİLEN YÜKSEK PERFORMANS KARBONUN TRANSİSTÖR UYGULAMALARINA UYGUNLUĞUNUN ARAŞTIRILIMASI
UEMK 2019 Proceedings Book 24/25 October 2019 Gaziantep University, TURKEY
55
ÖZET: Diyotlar, transistörler ve benzeri aygıtlar gibi ileri teknoloji alanlarında karbon malzemeler çalışılmaktadır (Feng vd., 2018). Gözenekli karbon materyallerin elektronik aygıtlarda kullanımı ve enerji depolama alanlarında uygulamaları da daha ekonomik yöntemler geliştirilmesi ve boyutların küçültülmesi bakımından önemlidir. Son yıllarda literatürde çok sayıda karbon kanallı transistör rapor edilmiş olsa da, gözenekli karbon olarak biyokütleden elde edilen karbonun transistör uygulamaları sınırlı sayıdadır. Karbon malzemelerin çoğu, giderek tükenmekte olan fosil kaynaklardır. Bu sebeple yenilenebilir karbon kaynakları önem kazanmaya başlamaktadır. Biyokütle tek yenilenebilir karbon kaynağıdır. Piroliz yöntemi ile biyokömür olarak adlandırılan karbonize materyale dönüştürülebilir. Ancak biyokömürün karbon tabanlı elektriksel aygıtlara uygulanabilmesi için yapısının geliştirilmesi gerekmektedir. Bu çalışmada, endüstriyel çay atıklarından elde edilen biyokömür, kimyasal ve fiziksel yöntemlerle yüksek performans ve n-katkılı karbon materyale (grafen benzeri) dönüştürülmüştür (Roy, 2017; Smith vd., 2019; ). Oluşturulan bu karbon ile üst kontak / üst kapı yapılı alan etkili transistörler gümüş boya kullanılarak kontakları gerçekleştirilmiş ve karakterizasyonları yapılmıştır (Koç vd., 2019). Yeni türetilen karbon materyal SEM, XRD, Raman Spektroskopisi, FT-IR, TGA yöntemleriyle karakterize edilmiştir. Geliştirilen alan etkili karbon transistörün akım-gerilim (I-V) karakteristikleri belirlenmiştir. Anahtar sözcükler: endüstriyel çay atığı, karbon, alan etkili transistör Teşekkür: Bu proje Recep Tayyip Erdoğan Üniversitesi, Bilimsel Araştırma Projeleri Koordinatör Birimi (BAP) (Proje No: FYL-2018-970) tarafından desteklenmiştir. KAYNAKLAR Feng, X. et al., 2018. All carbon materials pn diode. Nature Communications, 9, 3750, 1-7. Koç, M.M. et al., 2019, Electrical characterization of solar sensitive zinc oxide doped amorphous carbon photodiode. Optik - International Journal for Light and Electron Optics 178, 316-326. Roy, S., 2017. Synthesis of graphene oxide using tea-waste biochar as green substitute of graphite and its application in de-fluoridation of contaminated water. AJCR, 1, 1, 1-19. Smith, A.T., La Chance, A.M. Zeng, S., Liu, B. and Sun, L., 2019. Synthesis, properties, and applications of graphene oxide/reduced graphene oxide and their nanocomposites. Nano Materials Science, 1(1), 31-47.

UEMK 2019 Proceedings Book 24/25 October 2019 Gaziantep University, TURKEY
56
DEVELOPMENT SEMICONDUCTIVE CARBON MATERIAL from BIOMASS and ITS DIODE APPLICATIONS Sözer SÖZER Department of Energy Systems Engineering, Recep Tayyip Erdogan University, Fener-Rize, 53100, Turkey [email protected] Asst. Prof. Dr. Gökçen AKGÜL Department of Energy Systems Engineering, Recep Tayyip Erdogan University, Fener-Rize, 53100, Turkey [email protected] ABSTRACT: Electronic devices generally consist of circuits containing semiconductor materials. Semiconductor materials can be organic and/or inorganic, such as polymers and metal oxides [1]. Current studies are being conducted on the use and development of carbon in semiconductor technology [2]. Recently, unlike nano-carbon or graphene materials, the use of porous carbon materials in electronic devices and their applications in energy storage areas have been among the research subjects in terms of developing more economical and greener methods [3]. Porous carbon, also called as biochar, can be obtained by pyrolysis of biomass, a renewable energy source. Biochar is generally amorphous, rich in surface functional groups, and its electrical conductivity is negligible [4]. However, the carbon structure can be developed into graphite / graphene-like structures by thermal and / or chemical methods. The presence of surface functional groups also facilitates N and / or P type doping onto the structure. In addition, the mineral elements existing in the biomass also enhance the semiconductivity properties. Diodes are the simplest and most basic semiconductor devices with one P type and one N type sides. Applying porous and doped carbon to diodes can produce electronic devices with advantages such as directing signals, providing flexibility, low power consumption, high switching speed, diminishing dimensions and lower cost [5]. Key words: yarı iletken karbon, biyokütle, diyot YARI İLETKEN KARBON MATERYALİN BİYOKÜTLEDEN GELİŞTİRİLMESİ ve DİYOT UYGULAMALARI ÖZET: Elektronik aygıtlar genellikle yarı iletken malzemeler içeren devrelerden oluşmaktadır. Yarı iletken malzemeler polimerler ve metal oksitler gibi organik ve inorganik temelli olabilmektedir [1]. Karbonun yarı iletken teknolojisinde kullanımı ve geliştirilmesi yönünde güncel çalışmalar yapılmaktadır [2]. Son zamanlarda, nano-karbon veya grafen materyallerinden farklı olarak, gözenekli karbon materyallerin

UEMK 2019 Proceedings Book 24/25 October 2019 Gaziantep University, TURKEY
57
elektronik aygıtlarda kullanımı ve enerji depolama alanlarında uygulamaları da daha ekonomik ve çevreci yöntemler geliştirilmesi bakımından araştırma konuları arasında yer almıştır [3]. Gözenekli karbon, biyokömür olarak da adlandırılır, yenilenebilir enerji kaynağı olan biyokütlenin pirolizi ile elde edilebilir. Biyokömür genellikle amorf yapıdadır, yüzey fonksiyonel gruplarınca zengindir ve elektriksel iletkenliği ihmal edilecek düzeyde düşüktür [4]. Ancak karbon yapısı grafit/grafen benzeri yapılara termal ve/veya kimyasal yöntemlerle geliştirilebilir. Yüzey fonksiyonel grupların varlığı, yapıya N ve/veya P tipi katkılmayı da kolaylaştırır. Ayrıca biyokütlenin içerdiği mineral elementler de yarı iletkenlik özelliğini geliştirici yönde etki eder. Diyotlar, yapısında bir adet P tipi ve bir adet N tipi yarı iletken bulunan en basit ve temel yarı iletken aygıtlardır. Gözenekli ve katkılanmış karbonun diyotlarda uygulanması ile sinyallerin doğrultulması, esneklik sağlanması, düşük güç tüketimi, yüksek anahtarlama hızı, boyutların küçültülmesi ve düşük maliyet gibi avantajlara sahip elektronik aygıtlar üretilebilir [5]. Anahtar sözcükler: yarı iletken karbon, biyokütle, diyot KAYNAKLAR [1] Ahmad, S. (2014). Organic semiconductors for device applications: Current trends and future prospects. Journal of Polymer Engineering, 34(4), 279–338. doi:10.1515/polyeng-2013-0267 [2] Kreupl, F. (2015). Advancing CMOS with carbon electronics, 1–6. doi:10.7873/date2014.250 [3] Rahimi, R., Ochoa, M. ve Ziaie, B. (2016). Direct Laser Writing of Porous-Carbon/Silver Nanocomposite for Flexible Electronics. ACS Applied Materials and Interfaces, 8(26), 16907–16913. doi:10.1021/acsami.6b02952 [4] Gabhi, R. S., Kirk, D. W. ve Jia, C. Q. (2017). Preliminary investigation of electrical conductivity of monolithic biochar. Carbon, 116, 435–442. doi:10.1016/j.carbon.2017.01.069 [5] Semple, J., Georgiadou, D. G., Wyatt-Moon, G., Gelinck, G. ve Anthopoulos, T. D. (2017). Flexible diodes for radio frequency (RF) electronics: A materials perspective. Semiconductor Science and Technology, 32(12). doi:10.1088/1361-6641/aa89ce.

UEMK 2019 Proceedings Book 24/25 October 2019 Gaziantep University, TURKEY
58
DEVELOPMENT OF BORON DOPED SUPERCAPACITOR ENERGY STORAGE MATERIALS from BIOMASS Ayşenur GÜNDOĞDU Department of Energy Systems Engineering, Recep Tayyip Erdogan University, Fener-Rize, 53100, Turkey [email protected] Asst. Prof. Dr. Gökçen AKGÜL Department of Energy Systems Engineering, Recep Tayyip Erdogan University, Fener-Rize, 53100, Turkey [email protected] ABSTRACT: Energy is a key part of modern economies. Possession of energy is necessary for rising living standards, having larger economies, social and economic development. Increasing the use of renewable and sustainable energy sources and developing energy storage technologies are very important for meeting the increasing energy demand of human beings as well as reducing the negative factors of climate change and environmental pollution. Supercapacitors are energy storage devices with high power density, fast charging and discharging properties, also known as ultracapacitors or electrochemical double layer capacitors [1]. Electrodes are the most important components that affect the performance of supercapacitors. Metal oxides, polymers and carbon-based materials are used as electrode materials [2]. It is aimed to develop carbon energy storage material that uses biomass as an alternative, renewable, sustainable, domestic and clean carbon source. It is proposed to produce supercapacitor material with high energy storage capacity, high galvanostatic charge-discharge cycle and low impedance properties by boron doping of biochar which is obtained by pyrolysis of biomass. Developing energy storage systems by using entirely domestic resources are targeted. Key words: supercapacitor, biomass, boron Acknowledgement: We gratefully acknowledge the Boron Institute for the bursary support program (2019). BİYOKÜTLEDEN BOR KATKILI SÜPERKAPASİTÖR ENERJİ DEPOLAMA MALZEMELERİNİN GELİŞTİRİLMESİ ÖZET: Enerji, modern ekonomilerin anahtar parçalarından bir tanesidir. Yaşam standartlarının artması, daha büyük ekonomilere sahip olma, sosyal ve ekonomik kalkınma gibi nedenlerle enerjiye sahip olmak gereklidir. Fosil kaynakların giderek

UEMK 2019 Proceedings Book 24/25 October 2019 Gaziantep University, TURKEY
59
tükendiği ve sebep olduğu iklim değişikliğinin etkilerinin iyice hissedildiği günümüzde yenilenebilir ve sürdürülebilir enerji kaynaklarının kullanımının artması ve enerji depolama teknolojilerinin geliştirilmesi, hem insanoğlunun artan enerji ihtiyacının karşılanması hem de iklim değişikliği ve çevre kirliliğine neden olan negatif faktörlerin azaltılması için çok önemlidir. Süperkapasitörler; ultrakapasitörler veya elektrokimyasal çift tabakalı kapasitörler olarak da bilinen, yüksek güç yoğunluğu, hızlı şarj ve deşarj özellikleri olan enerji depolama araçlarıdır [1]. Süperkapasitörlerdeki performansı etkileyen en önemli parça elektrotlardır. Elektrot materyali olarak metal oksitler, polimerler ve karbon esaslı malzemeler kullanılır [2]. Alternatif, yenilenebilir, sürdürülebilir, yerli ve temiz karbon kaynağı olarak biyokütlenin kullanıldığı enerji depolama materyali geliştirilmesi hedeflenmektedir. Biyokütlenin pirolizi ile elde edilen ve yüzey fonksiyonel gruplarınca zengin olan “biyokömürün” bor katkılanması ile enerji depolama kapasitesi yüksek, galvanostatik şarj-deşaj döngüsü çok ve impedansı düşük süperkapasitör materyali üretilmesi amaçlanmıştır. Böylece tamamen yerli kaynaklar kullanılarak enerji depolama sistemlerinin geliştirilmesi hedeflenmektedir. Anahtar sözcükler: superkapasitör, biyokütle, bor Teşekkür: Bu çalışma BOREN burs programı tarafından desteklenmektdir. KAYNAKLAR [1] Kalyani, P., Anitha, A., 2013. Biomass carbon & its prospects in electrochemical energy systems. Int. J. of Hydrogen Energy, 38, 4034-4045. [2] Guerrero, M.A. et al., 2009. Supercapacitors: Alternative Energy Storage Systems. Przeglad Elektrotechnıczny, 85(10), 188-195.

UEMK 2019 Proceedings Book 24/25 October 2019 Gaziantep University, TURKEY
60
MODELLING of DIRECT CARBON FUEL CELL USING BIOCHAR as FUEL Fatma Gül NİŞANCI Department of Energy Systems Engineering, Recep Tayyip Erdogan University, Fener-Rize, 53100, Turkey [email protected] Asst. Prof. Dr. Gökçen AKGÜL Department of Energy Systems Engineering, Recep Tayyip Erdogan University, Fener-Rize, 53100, Turkey [email protected] Asst. Prof. Dr. Rasim Volga OVALI Department of Material Science and Nanotechnology Engineering, Recep Tayyip Erdogan University, Fener-Rize, 53100, Turkey ABSTRACT: Due to the diminishing fossil fuel reserves of the world and the increasing need for energy, there has been a growing interest in technologies that use energy efficiently. Fuel cells are one of them. Direct carbon fuel cells (DCFC) are systems operating at high temperatures, using solid carbon as fuel, and converting chemical energy in carbon by electrochemical reactions into electricity. The fuel cell performance using biochar derived from biomass as renewable, clean and alternative carbon fuel was determined by modeling with Matlab program. In this study, the direct carbon fuel cell-solid model of Liu et al. [1] was referenced and biochar was accepted as fuel [2, 3]. The effects of cell temperature, electrical conductivity, density and particle size of carbon on fuel cell voltage were determined by Matlab modeling. During modeling, 3 main losses affecting fuel cell performance were evaluated; activation losses due to electrochemical reaction, ohmic losses due to ionic and electronic conductivity and concentration losses due to mass transfer. The high performance values for DCFC were found to be close to the graphite fuel used systems when having high electrical conductivity biochar has been used. It can be concluded that the use of biochar with high electrical conductivity as a fuel in DCFCs increases the fuel cell performance. Key words: Direct Carbon Fuel Cell (DCFC), Matlab, Modeling, Biochar BİYOKÖMÜR YAKITI KULLANILAN DOĞRUDAN KARBON YAKIT PİLİNİN MODELLENMESİ ÖZET: Dünyanın azalan fosil yakıt rezervleri ve enerjiye olan ihtiyacın artması nedeniyle enerjinin verimli kullanıldığı teknolojilere ilgi artmıştır. Yakıt pilleri bunlardan bir tanesidir. Doğrudan karbon yakıt pilleri (DCFC) yüksek sıcaklıkta çalışan, yakıt olarak
UEMK 2019 Proceedings Book 24/25 October 2019 Gaziantep University, TURKEY
61
katı karbonu kullanan ve karbondaki kimyasal enerjiyi elektrokimyasal reaksiyonlarla elektriğe dönüştüren sistemlerdir. Yenilenebilir, temiz ve alternatif karbon yakıt olarak biyokütleden türetilen biyokömürün kullanıldığı yakıt pili performansı, Matlab programı ile modellenerek belirlenmiştir. Bu çalışmada Liu vd. [1]’nin doğrudan karbon yakıt pili katı modeli referans olarak alınmıştır. Biyokömün DCFC’lerde yakıt olarak kullanılmasının uygun olduğu bulunmuştur [2, 3]. Hücre sıcaklığının, karbonun elektriksel iletkenliğinin, yoğunluğunun ve parçacık büyüklüğünün yakıt pili gerilimi üzerindeki etkileri bu çalışmada Matlab modelleme ile belirlenmiştir. Modelleme yapılırken yakıt pili performansını etkileyen 3 ana kayıp değerlendirilmiştir; elektrokimyasal reaksiyondan kaynaklanan aktivasyon kayıpları, iyonik ve elektronik iletime bağlı omik kayıplar ve kütle transferi nedeniyle oluşan konsantrasyon kayıplarıdır. Biyokütlenin elektriksel iletkenliğinin yüksek olduğu değerlerde grafit kullanılan sistemlere yakın performans değerleri bulunmuştur. Elektriksel iletkenliği yüksek olan biyokömürün DCFC’ler de yakıt olarak kullanılmasının yakıt pili performansını arttırdığı söylenebilir. Anahtar sözcükler: Doğrudan Karbon Yakıt Pilleri (DCFC), Matlab, Modelleme, Biyokömür KAYNAKLAR [1] Liu, Q., Tian, Y., Xia, C., Thompson L.T., Liang, B. and Li, Y., 2008. Modeling and simulation of a single direct carbon fuel cell. Journal of Power Sources, 185, 1022–1029. DOI:10.1016/j.jpowsour.2008.08.100 [2] Yu, J., Zhao, Y. and Li, Yongdan., 2014. Utilization of corn cob biochar in a direct carbon fuel cell. Journal of Power Sources, 270, 312-317. [3] Gabhi, R.S., Kirk, D.W. and Jia, C.Q., 2017. Preliminary investigation of electrical conductivity of monolithic biochar. Carbon, 116, 435-442.
UEMK 2019 Proceedings Book 24/25 October 2019 Gaziantep University, TURKEY
62
INVESTIGATION OF APPLICABILITY OF RENEWABLE CARBON IN ELECTRICAL
CIRCUIT
İpek Nur AYDİN Department of Energy Systems Engineering, Recep Tayyip Erdogan University, Fener-Rize, 53100, Turkey [email protected] Asst. Prof. Dr. Gökçen AKGÜL Department of Energy Systems Engineering, Recep Tayyip Erdogan University, Fener-Rize, 53100, Turkey [email protected] ABSTRACT: Electric circuits are the electrical systems that are needed at every level of our daily life. It is used in many fields such as cooling, heating, lighting, sound production, motion and communication. Transmission of electrons through conductive channels is provided in electrical circuits. Conductive metals are generally used in conductive channels such as gold, silver and copper. The use of conductive carbon materials in electrical circuits for more environmentally friendly, economic, domestic and renewable circuits is being investigated [1-3]. In this study, carbon material (biochar) was derived from industrial tea waste biomass - a renewable biomass energy source - by pyrolysis. Carbon composites were prepared impregnation of conductive metals. Biochar, rich in surface functional groups, is very advantageous in the production of carbon composite materials. As next step, an ink of carbon composite was prepared with ethyl cellulose / terpinol then applied as an electrical circuit through a circuit pattern. Detailed characterization of the derived material was performed, such as SEM, XRD, FTIR and the conductivity of the electrical circuit was determined. Thus, renewable, sustainable, alternative organic electricity circuit has been developed by using local and domestic biomass energy source. Key words: electrical circuit, renewable carbon, tea waste Acknowledgement: We gratefully acknowledge the financial support provided by TUBITAK 2209A (project no: 1919B011803642) YENİLENEBİLİR KARBONUN ELEKTRİK DEVRESİNDE UYGULANABİLİRLİĞİNİN ARAŞTIRILMASI ÖZET: Elektrik devreleri, günlük yaşantımızın her alanında ihtiyaç duyulan ve kullanımı en üst düzeyde olan elektriksel sistemlerdir. Soğutma, ısıtma, aydınlatma, ses üretimi, hareket, haberleşme gibi birçok alanda kullanılmaktadır. Elektirk devrelerinde elektronların iletken kanallardan geçerek iletimi sağlanır. İletken kanallarda genellikle

UEMK 2019 Proceedings Book 24/25 October 2019 Gaziantep University, TURKEY
63
altın, gümüş, bakır gibi iletken metaller kullanılır. Daha çevreci, ekonomik, yerli ve yenilenebilir devreler için iletken karbon materyallerin elektrik devrelerinde kullanımı araştırılmaktadır [1-3]. Bu çalışmada yenilenebilir biyokütle enerji kaynağı olan çay fabrika atığı biyokütlesinden piroliz ile biyokömür karbon materyali türetilmiştir. İletken metallerle katkılanarak elektriksel iletkenliği geliştirilmiş karbon kompozitleri geliştirilmiştir. Yüzey fonksiyonel gruplarınca zengin olan biyokömür, kompozit materyallerin türetilmesi açısından oldukça avantajlıdır. Daha sonra etil selüloz/terpinol ile mürekkebi hazırlanan karbon materyal, çıkarılan kalıp üzerinden elektrik devresi olarak uygulanmıştır. Türetilen materyalin SEM, XRD, FTIR gibi detaylı karekterizasyonları yapılmış, elektrik devresinin iletkenliği belirlenmiştir. Böylece yenilenebilir, sürdürülebilir, altenatif organik elektrik devresinin yerel ve yerli biyokütle enerji kaynağı kullanılarak geliştirilebileceği gösterilmiştir. Anahtar sözcükler: elektrik devresi, yenilenebilir karbon, çay atığı Teşekkür: Bu proje Tübitak 2209-A (proje no: 1919B011803642 ) Üniversite Öğrencileri Araştırma Projeleri Destekleme Programı kapsamında desteklenmiştir. KAYNAKLAR [1] Massey, M.K., Kotsialos, A., Volpati, D., Vissol-Gaudin, E., Pearson, C., Bowen, L.,Petty, M. C. (2016). evolution of electronic circuits using carbon nanotube composites. Scientific Reports, 6, 1–7. doi:10.1038/srep32197 [2] Lawes, S., Riese, A., Sun, Q., Cheng, N. ve Sun, X. (2015). Printing nanostructured carbon for energy storage and conversion applications. Carbon, 92, 150–176. doi:10.1016/j.carbon.2015.04.008 [3] Zhong,X., Hu, H., and Fu, H. (2018). Self-cleaning, chemically stable, reshapeable, highly conductive nanocomposites for electrical circuits and flexible electronic devices. ACS Appl. Mater. Interfaces, 10, 25697−25705.
UEMK 2019 Proceedings Book 24/25 October 2019 Gaziantep University, TURKEY
64
THICKNESS EFFECT OF MEMBRANE AND CATALYST LAYER ON THE PEM FUEL CELL PERFORMANCE Safiye Nur ÖZDEMİR Department of Mechanical Engineering, Sakarya University, Sakarya-Turkey [email protected] İmdat TAYMAZ Department of Mechanical Engineering, Sakarya University, Sakarya-Turkey [email protected] ABSTRACT: Proton exchange membrane fuel cells (PEMFCs) are considered as promising alternative energy sources when the optimal performance criteria is supplied. Membrane or catalyst layer’s thickness is one of the design parameters affecting system performance in PEM fuel cells using pure hydrogen on the anode side and air on the cathode side. In this study, a three dimensional, steady-state and single-phase numerical model was developed by using ANSYS FLUENT 18.1, a CFD software with a Fuel Cell and Electrolysis Module based on finite volume method in order to investigate the thickness effect of membrane and catalyst layer on the performance of the PEM fuel cell. Modeling findings are presented in the form of polarization curves, which show the effects of the different design parameters on the performance of the PEMFC. As a result of this study, it is observed that the cell performance is improved as the membrane or catalyst layer’s thickness decreases.
Key words: Computational Fluid Dynamics, Membrane Thickness, Catalyst Layer’s Thickness, Cell Performance INTRODUCTION A fuel cell is an electrochemical energy converter that converts the chemical energy of the fuel directly into electricity without combustion process. Fuel cells operate quietly compared to internal combustion engines, cleaner, more efficient, simple structured modern energy carriers. They can be classified by electrolyte type and can be listed as follows: proton exchange membrane fuel cell (PEMFC), solid oxide fuel cell (SOFC), molten carbonate fuel cell (MCFC), phosphoric acid fuel cell (PAFC) and alkaline fuel cells (AFC) (Sharaf and Orhan 2014; Ding et al. 2013). Among several types of fuel cells, the proton exchange membrane fuel cells (PEMFCs) are the most promising and attractive energy technologies for stationary and portable transportation applications based on its high power density, low noise, harmless and long-lasting.
UEMK 2019 Proceedings Book 24/25 October 2019 Gaziantep University, TURKEY
65
Most of the studies related to the operating parameters affecting the cell performance have been conducted in the literature (Freire et al. 2014; Khazaee et al. 2012; Ahmadi et al. 2016; Caglayan et al. 2016). Optimum design of the flow channels within the bipolar plates is a key parameter affecting the overall performance of the fuel cell. During the last twenty years, lots of studies have been performed in order to enhance the cell performance by designing a novel flow field (Bilgili et al. 2015; Shen et al. 2018; Kuo et al. 2008; Afshari et al. 2017; Soong et al. 2005). Jourdani et al. (2017) developed a three-dimensional PEMFC model to analyze the membrane thickness effect on the single PEMFC performance. Four different membrane thicknesses (125e-6 m, 100e-6 m, 75e-6 m, 50e-6 m) have been studied in order to get the best cell performance after the model validation. It is recorded that, the performance of PEMFC depends strongly on the characteristics of the membrane. Numerical results indicated that higher current densities are obtained using a thinner membrane. Xia et al. (2018) carried out numerical simulations by using a three-dimensional model of high-temperature PEMFC in COMSOL to investigate the effects of the physical parameters (operating temperature, membrane’s thickness and catalyst layer’s thickness) on the cell performance. Cell performance is enhanced as the operating temperature increases. It could be drawn from this study, better cell performance has been obtained with a thinner membrane and catalyst layer. Fadzillah et al. (2015) developed a two-dimensional simulation model by using MATLAB to determine the effects of the gas diffusion layer’s thickness and porosity on the cell performance. Simulation results indicated that thinner GDL produced a higher-performance cell. Higher porosity GDL corresponds to better cell performance. Lee et al. (2004) investigated the effects of the gas diffusion layer’s thickness and fabrication method on cell performance. The main goal of this study is to find the optimum gas diffusion layer’s thickness and to analyze the characteristics of the electrodes fabricated by several methods. Ferng et al. (2014) investigated the effects of the different parameters which are PBI loading, operating temperature, gas flow rate, electrode thickness and porosity, and acid doping level to improve the performance of a PBI-based PEMFC. It could be drawn from this study, thinner electrode thickness, higher acid doping level and smaller porosity positively affect the performance of the PBI-based PEMFC. METHODS Numerical Model
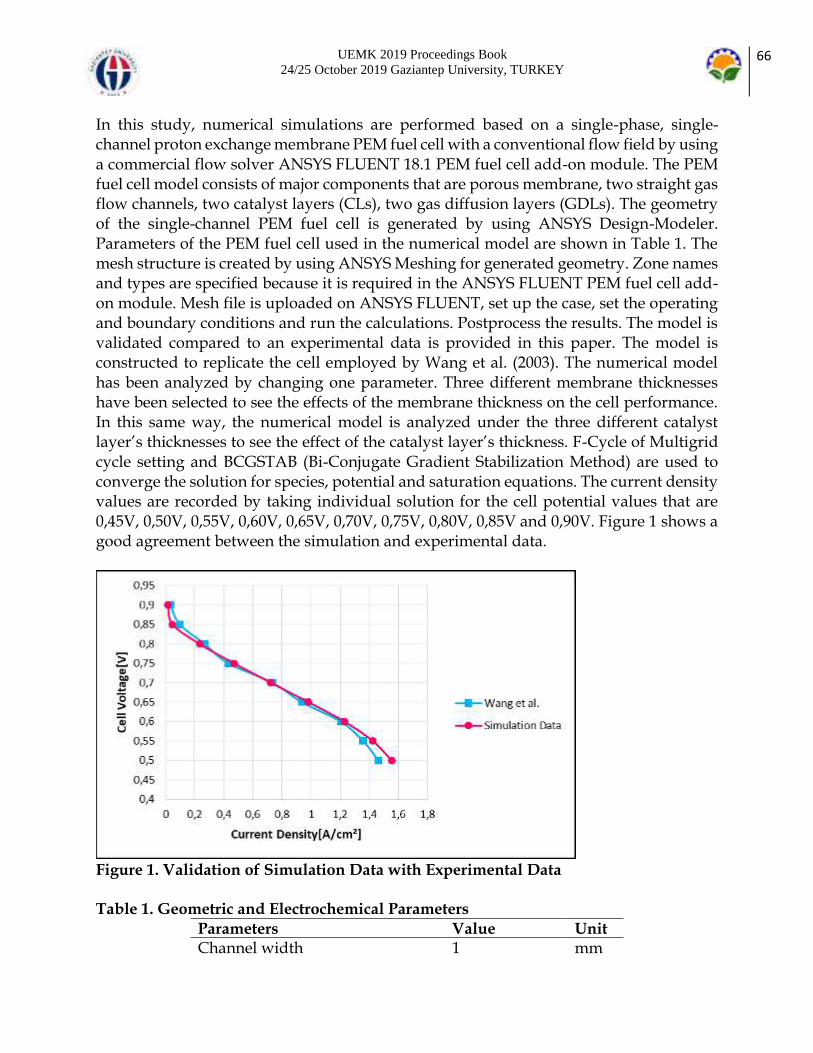
UEMK 2019 Proceedings Book 24/25 October 2019 Gaziantep University, TURKEY
66
In this study, numerical simulations are performed based on a single-phase, single-channel proton exchange membrane PEM fuel cell with a conventional flow field by using a commercial flow solver ANSYS FLUENT 18.1 PEM fuel cell add-on module. The PEM fuel cell model consists of major components that are porous membrane, two straight gas flow channels, two catalyst layers (CLs), two gas diffusion layers (GDLs). The geometry of the single-channel PEM fuel cell is generated by using ANSYS Design-Modeler. Parameters of the PEM fuel cell used in the numerical model are shown in Table 1. The mesh structure is created by using ANSYS Meshing for generated geometry. Zone names and types are specified because it is required in the ANSYS FLUENT PEM fuel cell add-on module. Mesh file is uploaded on ANSYS FLUENT, set up the case, set the operating and boundary conditions and run the calculations. Postprocess the results. The model is validated compared to an experimental data is provided in this paper. The model is constructed to replicate the cell employed by Wang et al. (2003). The numerical model has been analyzed by changing one parameter. Three different membrane thicknesses have been selected to see the effects of the membrane thickness on the cell performance. In this same way, the numerical model is analyzed under the three different catalyst layer’s thicknesses to see the effect of the catalyst layer’s thickness. F-Cycle of Multigrid cycle setting and BCGSTAB (Bi-Conjugate Gradient Stabilization Method) are used to converge the solution for species, potential and saturation equations. The current density values are recorded by taking individual solution for the cell potential values that are 0,45V, 0,50V, 0,55V, 0,60V, 0,65V, 0,70V, 0,75V, 0,80V, 0,85V and 0,90V. Figure 1 shows a good agreement between the simulation and experimental data.
Figure 1. Validation of Simulation Data with Experimental Data Table 1. Geometric and Electrochemical Parameters
Parameters Value Unit Channel width 1 mm

UEMK 2019 Proceedings Book 24/25 October 2019 Gaziantep University, TURKEY
67
Channel depth 1 mm Channel length 70 mm Active area(XxZ) 0,00021 m² Catalyst layer thickness 0,01, 0,02, 0,03 mm GDL thickness 0,3 mm Membrane thickness 0,075, 0,1, 0,125 mm Operating temperature 343 K Operation pressure 300 kPa Mass flow rate on the anode side 6e-07 kg/s Mass flow rate on the cathode side 5e-06 kg/s Gas diffusion layer porosity 0,5 - Anodic exchange coefficient at the anode
1/2 - Cathodic exchange coefficient at the anode
1/2 - Anodic exchange coefficient at the cathode
2 - Cathodic exchange coefficient at the cathode
2 - Reference diffusivity of H2 3e-05 m2/s Reference diffusivity of O2 3e-05 m2/s Viscous resistance of GDL 1e+12 1/m2
Surface/Volume ratio of CL 200000 1/m Governing Equations In the CFD model development, the following assumptions are used; 1. The PEM fuel cell operates at steady-state conditions. 2. 3D domain, the single-phase model is presumed. 3. The gas flow regime is laminar and incompressible due to the low velocities. 4. Reactants and products are considered to be ideal gases. 5. The gas diffusion layers, catalyst layers, and membrane are assumed as isotropic and homogeneous. 6. Viscous dissipation and buoyancy effects are negligible. 7. The membrane is impermeable to the water and reactant gases. 8. There is no contact resistance at the interfaces between the different layers. 9. The electrochemical reaction is governed by the Butler-Volmer equation in PEMFC modeling. 10. The membrane is completely moistened and its proton concentration is constant. partial differential equations used for the numerical analysis as follows: mass, momentum, energy, species and charge conservation equations. The gas transport equations for three-dimensional PEMFC can be expressed as follows: Conservation of mass: The general conservation of mass is expressed for all processes which are fluid flow, phase change, electrochemical reactions, etc. in fuel cells as follows:
UEMK 2019 Proceedings Book 24/25 October 2019 Gaziantep University, TURKEY
68
( v) 0 (1)
Where v , ε, ρ, ∇ are the velocity vector, porosity, density and del operator, respectively. Conservation of momentum:
effm( vv) p ( v) S (2)
Where p is the fluid pressure, eff is dynamic viscosity and mS is the source term that
varies in each region of the fuel cell. In gas channels, the source term of the momentum equation is expressed as mS 0 . In the porous regions, the source term is represented as follows:
2mS v
k
(3)
Where k is the permeability of the gas diffusion layers or catalyst layers, ε is the porosity coefficient respectively. Conservation of energy:
p eff eff e( c ) (v T) (k T) S (4)
Where pc , T, k and eS are the specific heat capacity, temperature, thermal conductivity
and source term of the energy equation, respectively. Conservation of species:
effk k k k( vC ) (D C ) S (5)
In the porous medium, effkD is a function of porosity which is described as a common
relationship is given by the Bruggeman model,
1,5k,eff kD D (6)
Where kD is the species diffusion coefficient. Species volumetric source terms for the PEMFC are expressed as follow: Source term for hydrogen:

UEMK 2019 Proceedings Book 24/25 October 2019 Gaziantep University, TURKEY
69
2w,Hk an
MS R
2F
(7)
Source term for oxygen:
2w,Ok cat
MS R
4F
(8)
Source term for water:
2w,H Ok cat
MS R
2F
(9)
Conservation of charge:
e( v ) S (10)
RESULTS AND FINDINGS Thickness Effect of Membrane The membrane thickness is a key parameter affecting cell performance. In this paper, numerical analyses are carried out to investigate the effect of membrane thickness on the cell performance in three different values which are taken as 0,075 mm, 0,1 mm and 0,125 mm. All other parameters are kept constant. To see the effect of membrane thickness on polarization curve, a total of 30 different boundary conditions are defined in FLUENT. Figure 2 shows the change of current density compared to the cell potential. Power density based on a cell potential is represented as Figure 3. The results indicated that better cell performance can be obtained by using a thinner membrane. Figure 4 shows the largest molar water concentration in the PEMFC at 0,075 mm for the same voltage level. The electrochemical reaction has been accelerated as the membrane thickness decreased. Water formation is increased, and thus ionic resistance is reduced.

UEMK 2019 Proceedings Book 24/25 October 2019 Gaziantep University, TURKEY
70
Figure 2. Cell Performance at Different Membrane Thicknesses with I-V Graph
Figure 3. Cell Performance at Different Membrane Thicknesses with V-P Graph
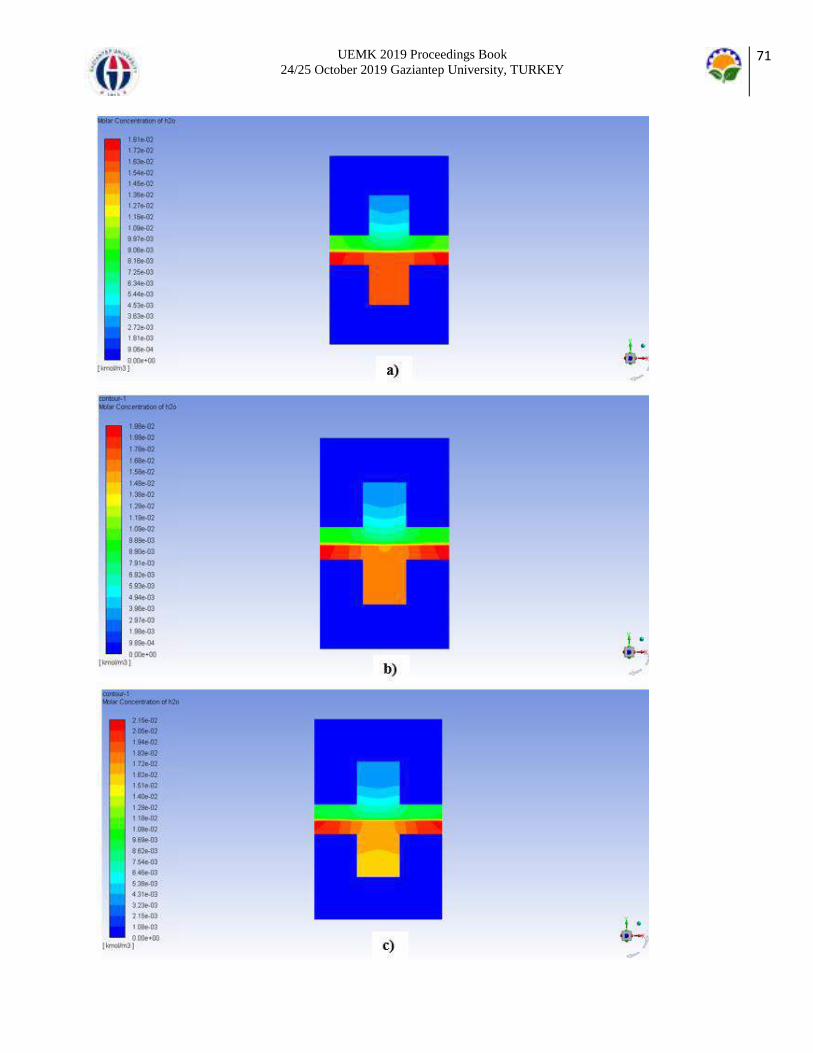
UEMK 2019 Proceedings Book 24/25 October 2019 Gaziantep University, TURKEY
71
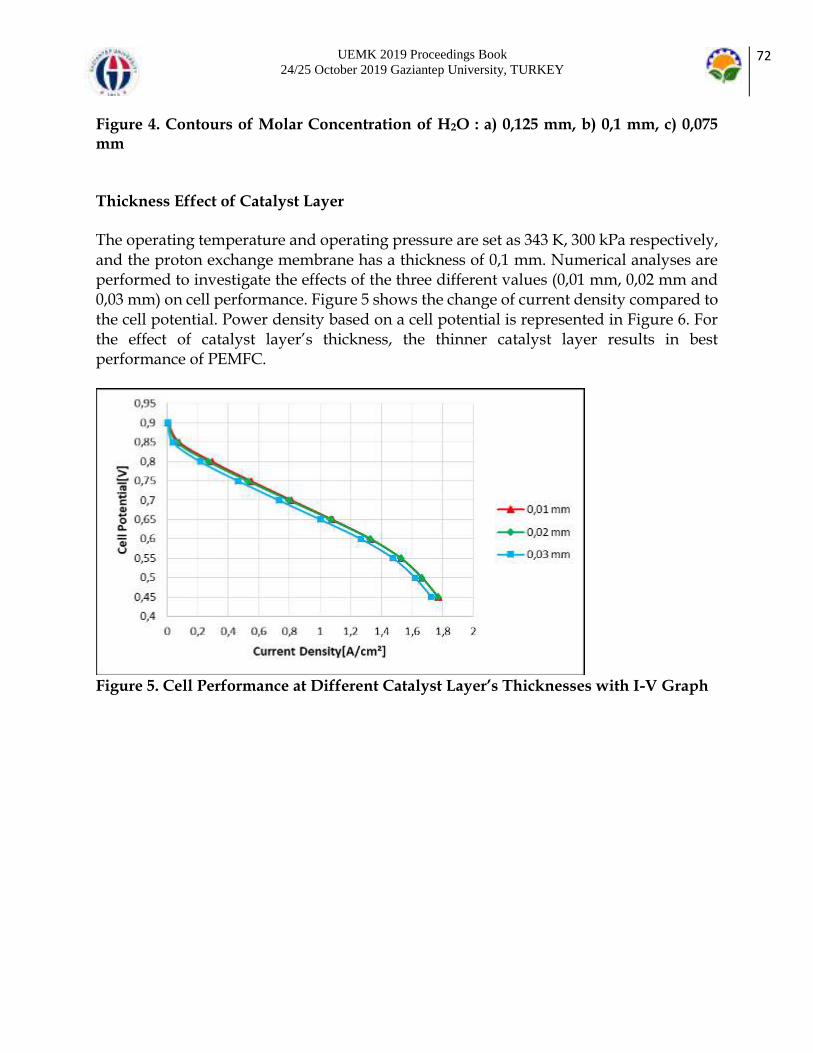
UEMK 2019 Proceedings Book 24/25 October 2019 Gaziantep University, TURKEY
72
Figure 4. Contours of Molar Concentration of H2O : a) 0,125 mm, b) 0,1 mm, c) 0,075 mm Thickness Effect of Catalyst Layer The operating temperature and operating pressure are set as 343 K, 300 kPa respectively, and the proton exchange membrane has a thickness of 0,1 mm. Numerical analyses are performed to investigate the effects of the three different values (0,01 mm, 0,02 mm and 0,03 mm) on cell performance. Figure 5 shows the change of current density compared to the cell potential. Power density based on a cell potential is represented in Figure 6. For the effect of catalyst layer’s thickness, the thinner catalyst layer results in best performance of PEMFC.
Figure 5. Cell Performance at Different Catalyst Layer’s Thicknesses with I-V Graph

UEMK 2019 Proceedings Book 24/25 October 2019 Gaziantep University, TURKEY
73
Figure 6. Cell Performance at Different Catalyst Layer’s Thicknesses with V-P Graph CONCLUSION In this present paper, a 3-D computational model containing a conventional straight flow field is developed to investigate the thickness effects of membrane and catalyst layer on the performance of PEMFC. The numerical model is developed by using ANSYS FLUENT 18.1, a CFD software. The simulation model is validated with experimental data. The governing equations were solved by the finite volume method. Effective cell performance is achieved with decrease of membrane thickness provided that enough humidification. Membrane thicknesses are selected as 0,075 mm, 0,1 mm and 0,125 mm, respectively. The temperature is taken as 343 K. The operating temperature should not be too high because of overheating of membrane. The maximum current density is obtained as 1,90354 A/cm² when the cell potential is 0,45 V and the value of membrane thickness is 0,075 mm. The maximum power density is obtained as 0,91947 W/cm² when the cell potential is 0,55 V and the value of membrane thickness is 0,075 mm. When the catalyst layer’s thickness decreases from 0,03 mm to 0,01 mm, improved cell performance has been obtained according to the numerical results. The maximum current density has been obtained as 1,77042 A/cm², when the cell potential is 0,45 V and the values of the catalyst layer and membrane thicknesses are 0,01 mm and 0,1 mm, respectively. REFERENCES Sharaf, O. Z. and Orhan, M. F. (2014) ‘An overview of fuel cell technology: Fundamentals and applications’, Renewable and Sustainable Energy Reviews. Elsevier, 32, pp. 810–853.

UEMK 2019 Proceedings Book 24/25 October 2019 Gaziantep University, TURKEY
74
Ding, Y., Bi, X., Wilkinson, D.P., 2013. Numerical Analysis on Performance of Polymer Electrolyte Membrane Fuel Cells. Chemical Engineering Science, V.100, p.445-455 Freire, L. S. et al. (2014) ‘Influence of operational parameters on the performance of PEMFCs with serpentine flow field channels having different (rectangular and trapezoidal) cross-section shape’, International Journal of Hydrogen Energy. Elsevier Ltd, 39(23), pp. 12052–12060. Khazaee, I., Ghazikhani, M., and Mohammadiun, M. (2012) ‘Sharif University of Technology Experimental and thermodynamic investigation of a triangular channel geometry PEM fuel cell at different operating conditions’, Scientia Iranica. Elsevier B.V., 19(3), pp. 585–593. Ahmadi, N. et al. (2016) ‘Analysis of the operating pressure and GDL geometrical configuration effect on PEM fuel cell performance’, Journal of the Brazilian Society of Mechanical Sciences and Engineering. Springer Berlin Heidelberg, 38(8), pp. 2311–2325. Caglayan, D. G. et al. (2016) ‘Three-dimensional modeling of a high temperature polymer electrolyte membrane fuel cell at different operation temperatures’, International Journal of Hydrogen Energy. Elsevier Ltd, 41(23), pp. 10060–10070. Bilgili, M., Bosomoiu, M. and Tsotridis, G. (2015) ‘Gas flow field with obstacles for PEM fuel cells at different operating conditions’, International Journal of Hydrogen Energy. Elsevier Ltd, 40(5), pp. 2303–2311. Shen, J. et al. (2018) ‘Performance investigation of PEMFC with rectangle blockages in Gas Channel based on field synergy principle’, Heat and Mass Transfer/Waerme- und Stoffuebertragung. Heat and Mass Transfer. Kuo, J. K., Yen, T. S. and Chen, C. K. (2008) ‘Improvement of performance of gas flow channel in PEM fuel cells’, Energy Conversion and Management, 49(10), pp. 2776–2787. Afshari, E., Mosharaf-Dehkordi, M., and Rajabian, H. (2017) ‘An investigation of the PEM fuel cells performance with partially restricted cathode flow channels and metal foam as a flow distributor’, Energy. Elsevier Ltd, 118, pp. 705–715. Soong, C. Y. et al. (2005) ‘Analysis of reactant gas transport in a PEM fuel cell with partially blocked fuel flow channels’, Journal of Power Sources, 143(1–2), pp. 36–47. Jourdani, M., Mounir, H. and Marjani, A. (2017) ‘Three-Dimensional PEM Fuel Cells Modeling using COMSOL Multiphysics’, 11(4), pp. 427–442. Soong, C. Y. et al. (2005) ‘Analysis of reactant gas transport in a PEM fuel cell with partially blocked fuel flow channels’, Journal of Power Sources, 143(1–2), pp. 36–47. Xia, L. et al. (2018) ‘Investigation of parameter effects on the performance of high-temperature PEM fuel cell’, International Journal of Hydrogen Energy. Elsevier Ltd, 43(52), pp. 23441–23449. Fadzillah, D. M., Nee, C. L. and Rosli, M. I. (2015) ‘The model development of gas diffusion layer for PEM fuel cell’, International Journal of Mechanical and Mechatronics Engineering, 15(5), pp. 83–89. Lee, H. K. et al. (2004) ‘A study on the characteristics of the diffusion layer thickness and porosity of the PEMFC’, Journal of Power Sources, 131(1–2), pp. 200–206.

UEMK 2019 Proceedings Book 24/25 October 2019 Gaziantep University, TURKEY
75
Ferng, Y. M., Su, A. and Hou, J. (2014) ‘Parametric investigation to enhance the performance of a PBI-based high-temperature PEMFC’, Energy Conversion and Management, 78, pp. 431–437. Wang, L. et al. (2003) ‘A parametric study of PEM fuel cell performances’, International Journal of Hydrogen Energy, 28(11), pp. 1263–1272.
UEMK 2019 Proceedings Book 24/25 October 2019 Gaziantep University, TURKEY
76
THE INVESTIGATION OF FRESHWATER AND SEAWATER IN KAMIL ABDUS LAGOON AS PART OF WATER POLLUTION CONTROL Burak YANIK Marmara University [email protected] Esin BOZKURT KOPUZ* Marmara University [email protected] Yeşim GÜRTUĞ Marmara University [email protected] ABSTRACT: Lagoons should be protected against potential pollutants and hazards as they are used extensively for recreational purposes such as fishing and swimming. In this study, temperature, pH and salinity were measured onsite weekly at three stations in the south of the Kamil Abduş Lagoon (Station 1), north (Station 2) and in the Marmara Sea (Station 3) between 7 November 2018 and 16 April 2019. Water samples were also collected and prepared in the laboratory and heavy metal concentrations (Cu, Cd, Cr, Pb, Ni, Zn, As, Co, Fe, Mn, Se, Ba, Al) were determined by ICP-OES. The temperature varies
between 4 and 16.9 C at stations 1 and 2, while it is between 8.6 and 17.4C at Station 3. The salinity values at Station 3 where sea water is measured are generally higher than lake salinity values at Station 1 and 2. According to the Water Pollution Regulation, both the pH values of seawater at the station no. 3 and of fresh water at stations 1 and 2 are suitable. The pH ranges at station 1 and 2 indicate the Class I water quality of the lagoon. Stations 1 and 2 were suitable for the fresh water limit of the pH in the EPA Aquatic Life Criteria table, while station 3 exceeded slightly the salt water limit by 8.62 on 20 March 2019. Within the scope of the General Quality Criteria of Sea Water Regulation, at station 3, copper, cadmium, chromium, lead, nickel and arsenic concentrations are below the limit value, but zinc concentration has exceeded the limit value. According to the Quality Criteria of Inland Water Resources, copper, cadmium, chromium, iron, manganese, barium, aluminum I., arsenic, cobalt II, lead, nickel, zinc III., Selenium IV. water quality class. Key words: sea water, freshwater, lagoon, heavy metal, water quality. Acknowledgement: This work was supported by Research Fund of the Marmara University. Project Number: FEN-C-YLP-110718-0405
UEMK 2019 Proceedings Book 24/25 October 2019 Gaziantep University, TURKEY
77
KAMİL ABDUŞ LAGÜNÜ’NDE TATLI VE TUZLU SUYUN SU KİRLİLİĞİNİN KONTROLÜ YÖNETMELİĞİ KAPSAMINDA İNCELENMESİ ÖZET: Lagünler balıkçılık, plaj gibi rekreasyon amacıyla yoğun bir şekilde kullanıldıklarından dolayı potansiyel kirletici ve tehlikeli kaynaklarına karşı korunmalıdır. Bu çalışmada haftalık olarak 7 Kasım 2018 ve 16 Nisan 2019 tarihleri arasında Kamil Abduş Lagünü’nün güneyinde (İstasyon 1), kuzeyinde (İstasyon 2) ve Marmara Denizi'nde (İstasyon 3) üç istasyonda sıcaklık, pH ve tuzluluk yerinde ölçüldü. Ayrıca su örnekleri toplanarak laboratuvarda hazırlanıp ağır metal konsantrasyonları (Cu, Cd, Cr, Pb, Ni, Zn, As, Co, Fe, Mn, Se, Ba, Al) ICP-OES cihazıyla belirlendi. İstasyon 1 ve 2'de sıcaklık 4 ile 16,9 °C arasında, İstasyon 3'te 8,6 ile 17,4 °C arasında değişmektedir. Deniz suyunun ölçüldüğü İstasyon 3'teki tuzluluk değerleri İstasyon 1 ve 2'deki göl tuzluluk değerlerinden genellikle daha yüksektir. Su Kirliliği Yönetmeliği’ne hem 3 nolu istasyondaki deniz suyunun hem de 1 ile 2 nolu istasyonlardaki tatlı suyun pH değerleri uygundur. 1 ve 2 nolu istasyonlardaki pH aralıkları lagünün I. Sınıf su kalitesini göstermektedir. EPA Akuatik yaşam kriter tablosundaki pH’ın tatlı su sınırına 1 ve 2 nolu istasyonlar uygunken tuzlu su sınırını 3 nolu istasyon sadece 20 Mart 2019’da 8,62 değeri ile çok az aşmıştır. Su Kirliliği Yönetmeliği deniz suyunun genel kalite kriterleri kapsamında 3 nolu istasyonda bakır, kadmiyum, krom, kurşun, nikel ve arsenik konsantrasyonları limit değerin altındadır fakat çinko konsantrasyonu limit değeri aşmıştır. Kıta İçi Su Kaynaklarının Kalite Kriterlerine göre bakır, kadmiyum, krom, demir, mangan, baryum, alüminyum I., arsenik, kobalt II., kurşun, nikel, çinko III., selenyum IV. su kalite sınıfına girmektedir. Anahtar sözcükler: deniz suyu, tatlı su, lagün, ağır metal, su kalitesi. Teşekkür: Bu çalışma Marmara Üniversitesi Bilimsel Araştırma Projeleri Koordinasyon Birimince Desteklenmiştir. Proje Numarası: FEN-C-YLP-110718-0405 GİRİŞ Kamil Abduş Lagünü (Tuzla Balık Gölü), Kocaeli Yarımadası’nın güneybatısıyla Tuzla Yarımadası’nın kuzeyinde konumlanmaktadır. Lagün alanı kıyı bölgesi olduğundan dalga ve akıntıların etkisindedir. Denizden bir kıyı kordonu ile ayrılır. Lagün bir dereyle beslenmekle birlikte özellikle lodoslu havalarda deniz sularının istilası sonucu suları yükselmektedir (Atalay, Ekinci& Bayrak, 2015).

UEMK 2019 Proceedings Book 24/25 October 2019 Gaziantep University, TURKEY
78
Marmara denizinde 1970 ile 2018 yılları arasında aylık ortalama deniz suyu sıcaklığı 8 ve
24,1C aralığında değişmektedir (Tarım ve Orman Bakanlığı Meteoroloji Genel Müdürlüğü, 2019). Tuzluluk Karadeniz’de ‰18, Marmara denizinde ‰22 civarındadır. Kamil Abduş Lagünü denizle bağlantısı olan bir göl olduğundan kendine has ekolojiye sahiptir (Acar, 2003). Kamil Abduş Lagünü coğrafi konumu bakımından mineral su kaynaklarından etkilenmektedir (Ateş Can, 2014 ve Şenol, 2012). Ayrıca Marmara denizinin kıyı morfolojisi sebebiyle Kamil Abduş Lagünü su seviyesi değişimlerinden de etkilenmektedir (Ertek, 2016, Alpar, 2016, Ceylan ve Ceylan, 2010). Lagün alanındaki doğal ormanlar tahribat sonucu ortadan kalkmıştır. Değişik kuş türleri de tehlike altındadır. Kamil Abduş Lagünü, son yıllarda yapılaşmanın artması ve atık girdisinin kontrol altına alınamaması sonucu bataklık olma tehlikesiyle karşı karşıya gelmiştir. Tuzla tersanelerinin lagüne yakınlığından dolayı tersaneden çıkan atıklar ve Umur Deresi’nin aktığı dönemlerde taşıdığı endüstriyel atıklar lagüne karışmıştır. Lagünün hidrografik yapısında ortaya çıkan ani değişimler biyolojik yapıyı da etkilemiş, ani ölümlere sebep olmuştur. Kıyıda yapılan dolgu alanları, tersane ve limanlar dalgaların aşındırma ve biriktirme faaliyetlerinde kesintilere sebep olmuştur. Bunun sonucunda yapay alanın arkasındaki doğal kıyının gelişimi durmuştur. Kamil Abduş Lagünü’ndeki tüm bu olumsuz koşullar lagünü kurtarmaya yönelik çalışmaların yapılmasını zorunlu hale getirmiştir. Lagün alanı çevresel ve doğal kültürel özelliklerinden dolayı Kültür ve Tabiat Varlıklarını Koruma Kurulu’nca doğal parka dönüştürülmüş ve 1. Derece sit alanı ilan edilmiştir. Bu nedenle lagünde ve lagünün Marmara Denizi ile bağlantısındaki plajda su kalitesi oldukça önemlidir. DSİ, İBB, Tuzla Belediyesi ve İstanbul Çevre Vakfı’nca sürdürülen Tuzla Ekolojik Diriliş Projesi dâhilinde lagüne doğal su sirkülasyonunun tekrar kazandırılması amaçlanmış, bu proje vasıtasıyla lagünün birçok canlı türüne tekrar yaşam alanı olması bir nebze de olsa sağlanmıştır (Atalay vd., 2015). Su Kirliliği Kontrolü Yönetmeliği pH limitleri (Tablo 1), deniz suyundaki element konsantrasyonları limitleri (Tablo 2) ve kıta içi su kaynaklarının kalite kriterleri (Tablo 3) bu çalışmada Kamil Abduş Lagününün değerlendirilmesinde kullanılmıştır (EPA Quality Criteria for Water, 1986 ve Gazete, 2004 a,b,c). Tablo 1. pH Limit Değerleri (EPA Quality Criteria for Water, 1986 ve Gazete, 2004a, b, c)
EPA SKKY göllerin kontrolü
SKKY SKKY kıta içi su kaynakları
Tatlı su
Tuzlu su
Rekreasyon
Çeşitli kullanımlar
Deniz suyu
I. Sınıf
II. Sınıf
III. Sınıf
IV. Sınıf

UEMK 2019 Proceedings Book 24/25 October 2019 Gaziantep University, TURKEY
79
6,5-9 6,5-8,5 6,5-8,5 6-10,5 6,0-9,0 6,5-8,5
6,5-8,5
6,0-9,0
6,0-9,0 dışında
Tablo 2. SKKY Deniz Suyunun Genel Kalite Kriterleri (Gazete, 2004b)
Element Limit (μg/L)
Bakır 10 Kadmiyum 10 Krom 100 Kurşun 100 Nikel 100 Çinko 100 Arsenik 100
Tablo 3. SKKY Kıta İçi Su Kaynaklarının Sınıflarına Göre Kalite Kriterleri (Gazete, 2004c)
Element I. Sınıf
II. Sınıf
III. Sınıf
IV. Sınıf
Bakır (μg Cu/L) 20 50 200 > 200 Kadmiyum (μg Cd/L)
3 5 10 > 10
Krom (toplam) (μg Cr/L)
20 50 200 > 200
Kurşun (μg Pb/L) 10 20 50 > 50 Nikel (μg Ni/L) 20 50 200 > 200 Çinko (μg Zn/L) 200 500 2000 > 2000 Arsenik (μg As/L) 20 50 100 > 100 Kobalt (μg Co/L) 10 20 200 > 200 Demir (μg Fe/L) 300 1000 5000 > 5000 Mangan (μg Mn/L) 100 500 3000 > 3000 Baryum (μg Ba/L) 1000 2000 2000 > 2000 Alüminyum (μg Al/L)
300 300 1000 > 1000
Sıcaklık (°C) 25 25 30 > 30
Kamil Abduş Lagünü’nde 1990 yılında Orhon ve Kıratlı tarafından yapılan çalışmada lagündeki çözünmüş oksijenin düşük, Ni ve Fe haricindeki ağır metallerin uygun değerlerde olduğu tespit edilmiştir (Acar, 2003). Kayhan ve Özhatay’ın çalışmasında ise Kamil Abduş Lagünü’nde kadmiyum (Cd), alüminyum (Al) ve demir (Fe) birikimi insan, balık, kuş ve diğer canlılar açısından incelenmiştir. Dünya Sağlık Örgütü (WHO), Avrupa Komisyonu (CEU) ve T.C. Çevre ve Şehircilik Bakanlığı standartlarıyla karşılaştırılmıştır.

UEMK 2019 Proceedings Book 24/25 October 2019 Gaziantep University, TURKEY
80
Cd değerlerinin yüksek, Al ve Fe değerlerinin ise normal düzeylerde olduğu belirtilmiştir (Kayhan ve Özhatay, 2004). İstanbul’daki göller; Terkos, Ömerli, Elmalı, Alibey, Darlık, Samandıra (Aydos), Sazlıdere, Çatalca Büyükkokmuşgöl ve Küçükkokmuşgöl iken lagünler Büyükçekmece, Küçükçekmece ve Kamil Abduş Lagünü’dür. Bu göllerin arasında Kamil Abduş Lagünü flora ve fauna açısından 1. Derece Doğal Sit olarak tescil edildiğinden (T.Ü.İ.K., 2014) ve lagünün Marmara denizi ile bağlantısında plaj bulunduğundan su kalitesi oldukça önemlidir. İstanbul’da Marmara denizinde rekreasyon amacıyla kullanılan 3 plajdaki su kalitesi parametrelerinden nikel ve kurşun ağır metalleri 2009 yılında Su Kalitesi Yönetmeliğindeki limit değerlerin altında gözlenmiştir (Bozkurt vd., 2014). Meksika’nın Pasifik kıyılarında 2013-2014 yıllarında pH, iletkenlik, tuzluluk, ağır metal konsantrasyonları (arsenik, bakır, kadmiyum, krom, civa, nikel, kurşun ve çinko) limit değerlerin altında (Pérez-Moreno vd., 2016) iken Endonezya’nın Palu kıyılarında ağır metal konsantrasyonları (çinko ve kurşun) limit değerlerin üzerindedir (Rahmadani vd., 2015). Güllük Lagünü’nde Haziran 2011 ve Mayıs 2012 tarihleri arasında yapılan çalışmada sıcaklık, pH, iletkenlik ve tuzluluk değerleri normal seviyelerde tespit edilmiş olup, çözünmüş oksijen değerlerinin lagünün kimi bölgelerinde yaşamı güçleştirecek kadar düşük olduğu belirlenmiştir (Özdemir ve Alparslan, 2013). Balık Gölü’nde (Samsun) 2010 yılında ilkbahar (Nisan/Mayıs) ve sonbahar (Ekim/Kasım) karışım dönemlerinde yapılan çalışmada; sonbahar döneminde tuzluluğun artması sonucu iletkenliğin de arttığı, tuzluluktaki artışın sebebinin sonbahar döneminde denizle bağlantıyı sağlayan boğazdan gölün iç kesimlerine giren tuzlu su olduğu, pH ve çözünmüş oksijen değerlerinin doğal koruma alanları bazında kritik düzeylerde olduğu ve gölün III.sınıf su kalitesine sahip olduğu tespit edilmiştir (Cüce vd., 2011). Romanya’daki Razim-Sinoie Lagün Sistemi’nde 2016 yılında Mayıs ve Ağustos olmak üzere iki dönemde yapılan çalışmada; pH değerleri bazik sulara yakın olarak ölçülmüş, Golovita, Zmeica ve Sinoie göllerinde krom değerlerinin araştırılan diğer metallere (Cu, Zn, Fe, Mn, Ni) nazaran yüksek olduğu tespit edilmiştir. Çalışmada sistemdeki çevresel koşulların iyi olduğu ve su örneklerinin de bunu yansıttığı belirtilmiştir (Catianis vd., 2018). Akyatan Lagünü’nde Aralık 2007 ve Kasım 2008 tarihleri arasında yapılan çalışmada; lagün boyunca alkali bir ortam (pH dolayısıyla) tespit edilmiştir (Demir vd., 2014).

UEMK 2019 Proceedings Book 24/25 October 2019 Gaziantep University, TURKEY
81
Arnavutluk’taki Karavasta Lagünü’nde 2013 yılında yapılan çalışmada; pH, 3. ve 4. İstasyonlarda yüksek bulunmuştur. Buna sebep olarak fitoplankton yoğunluğundan kaynaklanan yüksek fotosentez oranı gösterilmiştir. Çözünmüş oksijen değerlerinin iyi bir biyolojik verimliliği işaret ettiği belirtilmiştir. Sudaki bakır ve krom konsantrasyonları yüksek, kadmiyum ve çinko konsantrasyonları düşük bulunmuştur. Bakır konsantrasyonunun yüksek olmasına sebep olarak lagün çevresinde yapılan tarımsal faaliyetler gösterilmiştir (Koto vd., 2014). Meksika’nın Karayip kıyılarında (Akumal kasabası) Eylül 2007 ve Eylül 2008 tarihleri arasında yapılan çalışmada; en yüksek sıcaklık deniz suyunda, en düşük sıcaklıklar kaynaklarda ve Lagartos Lagünü’nde ölçülmüştür. En yüksek pH deniz suyunda, en düşük pH ise Akumal Körfezi’nin güneyindeki bir kaynakta tespit edilmiştir. Akumal Körfezi’ndeki sualtı kaynağı en düşük tuzluluğa sahip olup, en yüksek değerler deniz suyunda elde edilmiştir (Hernández-Terrones vd., 2015). Karagöl’de (Sivas) Kasım 2011 ve Kasım 2012 tarihleri arasında yapılan çalışmada; göl sıcaklık ve iletkenlik bakımından iyi durumda (SKKY göre I.sınıf) bulunmakla birlikte pH değerleri suyun bazik karakterde olduğunu (SKKY göre I – III. Sınıf) göstermektedir. Göl suyu Cd ve Pb elementleri bakımından I. Sınıftır. Cu elementi kışın tespit edilmezken ilkbaharda birden artış gösterdiği görülmüştür. Buna sebep olarak göl çevresindeki meyve bahçelerinde bakım ve budama işlemlerinde kullanılan bordo bulamacı (göztaşı) gösterilmiştir. Dolayısıyla Cu elementi açısından gölün su kalitesi SKKY göre II. Sınıftır. Fe elementi kış aylarında düşük seviyelerdeyken ilkbaharda en yüksek değerine ulaşmıştır. Bu bakımdan gölün su kalitesi SKKY göre I. Sınıftır (Mutlu vd., 2013). Uluabat Gölü’nde Haziran 2008 ve Mayıs 2009 tarihleri arasında yapılan çalışmada sıcaklık ve iletkenliğin yazın maksimum, kışın minimum değerlerde olduğu gözlenmiştir. pH değerleri göl sularının bazik karakterde olduğunu göstermektedir. Çözünmüş oksijen değerleri kış mevsiminde yüksek, yaz mevsiminde düşük seviyelerde gözlenmiştir (İleri vd., 2014). Tecer Gölü’nde (Sivas) Mart 2011 ve Şubat 2012 tarihleri arasında yapılan çalışmada; sıcaklık uygun değerlerde bulunmuş olup (SKKY göre I.Sınıf), pH değerlerine göl suyu biraz bazik olarak (SKKY göre I – II.Sınıf) nitelendirilmiştir. Çözünmüş oksijen uygun seviyelerde olup (SKKY göre I.Sınıf), iletkenlik değerlerine göre de su kalitesi SKKY göre I.Sınıftır. Göl suları Pb değerleri açısından SKKY göre II.Sınıf, Cd değerleri açısından ise III.Sınıf olarak nitelendirilmiştir. Cu değerleri kışın iz seviyelerdeyken ilkbaharda birden artış göstermiştir. Buna sebep olarak (yine Sivas’ta bulunan Karagöl’de olduğu gibi) göl çevresindeki meyve bahçelerinde bakım ve budama işlemlerinde kullanılan bordo bulamacı (göztaşı) gösterilmiştir. Bundan dolayı su kalitesi Cu değerleri açısından SKKY göre II.Sınıf özelliği göstermektedir (Mutlu vd., 2018).

UEMK 2019 Proceedings Book 24/25 October 2019 Gaziantep University, TURKEY
82
Arnavutluk’ta Butrinti Lagünü’nde 2011 yılı Ağustos ayı boyunca yapılan çalışmada pH değerleri lagün suyunun bazik karakterde olduğunu göstermekte olup, çözünmüş oksijen değerlerinin lagünün biyolojik verimliliğini olumlu etkilediği belirtilmiştir. Pb değerlerinin bir istasyon hariç AB standartlarının (7,2 μg/L) altında olduğu, yine Cd değerlerinin de standart değerin (1 μg/L) altında ölçüldüğü belirtilmiştir. Cr değerleri yüzeyde WHO limit değerinin (50 μg/L) altında iken dipte sadece iki istasyonda bu değerin üzerindedir. Cu değerlerinin de aynı şekilde limit değerlerin altında olduğu tespit edilmiştir (Topi vd., 2012). Kolombiya, Cartagena Körfezi’nde Eylül 2014 ve Ağustos 2015 tarihleri arasında Tosic ve diğ. tarafından yapılan çalışmada tuzluluğun yağmur mevsiminde azaldığı tespit edilmiştir. Buna sebep olarak da aynı dönemde kanaldan körfeze yapılan tatlı su deşarjı gösterilmiştir. Sıcaklığın hem yüzey sularında hem de dip sularında kuru/rüzgârlı mevsim boyunca düşük olduğu belirlenmiştir. Yağmur mevsimi boyunca derinlerde çözünmüş oksijen değeri 4 mg/L’nin altına düşerken, mevsim geçişlerinde yüzeye yakın sularda da benzer durum görülmüştür (Tosic vd, 2017). Tunus Lagünü’nün güney kısmında Abidi ve diğ. tarafından Temmuz 2013 ve Şubat 2014 olmak üzere iki farklı dönemde gerçekleştirilen çalışmada, sıcaklık ve tuzluluk değerlerinin mevsimsel olarak değişkenlik gösterdiği görülmüştür. pH değerleri lagün sularının bazik karakterde olduğunu göstermektedir (Abidi vd., 2018). Meksika’nın Karayip kıyılarındaki Bacalar Lagünü’nde Tobón Velázquez ve diğ. tarafından Kasım 2016 ve Haziran 2017 olmak üzere iki farklı dönemde gerçekleştirilen çalışmada, düşük iletkenlik değerlerinin bir tatlı su sistemini işaret ettiği belirtilmiş olup, sıcaklık değerlerinin iki dönemde de stabil olduğu gözlenmiştir. pH değerleri göl sularının yer yer asidik karakterde olduğunu göstermektedir (Tobón Velázquez vd., 2019). Fransa’da Bages-Sigean ve Canet-St.Nazaire lagünlerinde Vouvé ve diğ. tarafından Mart 2009, Haziran-Temmuz 2009 ve Ekim 2009 olmak üzere üç farklı dönemde gerçekleştirilen çalışmada, tuzluluk değerlerinin Bages-Sigean Lagünü’nün kuzey kısmının tatlı su etkisi altında, güney kısmının ise deniz etkisi altında olduğunu gösterdiği belirtilmiş olup; en yüksek tuzluluk değerinin Canet-St.Nazaire Lagünü’nde elde edildiği görülmüştür. pH değerleri lagünlerdeki suyun çoğunlukla bazik karakterde olduğunu göstermektedir. Cu değerleri Bages-Sigean Lagünü’nün güney kısmında yüksekken lagünün kuzey kısmında Cd değerleri yüksektir. Canet-St.Nazaire Lagünü’nde Cu değerleri Bages-Sigean Lagünü’nden daha yüksek olup, Cd değerleri hemen hemen aynı seviyededir (Vouvé vd., 2014).
UEMK 2019 Proceedings Book 24/25 October 2019 Gaziantep University, TURKEY
83
Arnavutluk’ta Narta Lagünü’nde Kotori ve diğ. tarafından Eylül 2013 tarihinde yapılan çalışmada; pH değerleri normal seviyelerde tespit edilmiştir (Kotori vd., 2015). Adıyaman’da Gölbaşı Gölü’nde Uçkun tarafından Ağustos 2017 ve Kasım 2017 olmak üzere iki farklı dönemde gerçekleştirilen çalışmada; gölün su kalitesi fizikokimyasal parametreler açısından I.sınıf olarak belirlenmiştir. Hem Ağustos hem de Kasım dönemlerinde en yüksek konsantrasyona sahip olan metalin krom olduğu tespit edilmiştir. Sudaki toplam metal konsantrasyonunun Ağustos döneminde Kasım dönemine göre genelde daha yüksek olduğu belirtilmiştir. Ağustos ve Kasım dönemleri arasında krom ve çinko konsantrasyonlarında belirgin farklılıklar tespit edilmiştir. Ancak, sudaki metal konsantrasyonlarının EPA’ya ait içme sularında izin verilen maksimum ağır metal konsantrasyonları limit değerlerinin altında olduğu ilave edilmiştir (Alkan, 2019). İskenderun Körfezi’nde Göycıncık ve diğ. tarafından Kasım 2014 ve Mart 2015 tarihleri arasında yapılan çalışmada; Al, Cr, Fe, Cu, Se konsantrasyonlarının yüksek, Ni ve As konsantrasyonlarının düşük olduğu tespit edilmiştir (Tarım ve Köy İşleri Bakanlığı’nın “Su Ürünleri Yönetmeliği”nde belirtilen limit değerlere göre). Elde edilen sonuçlara göre İskenderun Körfezi’nin Al, Cr, Fe, Cu, Se yönünden kirlenmeyle karşı karşıya kaldığı belirtilmiştir. Ancak Ni ve As konsantrasyonlarının kimi aylarda farklılıklar gösterdiği tespit edilmiş olup; bunun sebebinin arıtılmış ve arıtılmamış suların bölgeye deşarjı ve liman ve insan kaynaklı faaliyetlerin oluşturduğu mevsimsel farklılıklar olduğu ifade edilmiştir. Özellikle K istasyonundan alınan örneklerde Ni, Fe, Cr ve Al konsantrasyonlarının diğer istasyonlara göre oldukça yüksek olduğu gözlenmiştir. Buna sebep olarak bölgeye yapılan evsel atık kaynaklı deşarjlar gösterilmiştir (Göycıncık vd., 2018). Bafa Gölü’nde Kara tarafından 2018 yılı Nisan ayında yapılan çalışmada; göldeki ağır metal konsantrasyonları ölçülmüş, göl suları S.K.K.Y’ye göre 1.sınıf olarak tespit edilmiştir. Ayrıca toksik ve antropojenik olabilen As, Cd, Cr, Pb, Co ve Ni elementlerine ait konsantrasyon değerlerinin Yerüstü Su Kalitesi Yönetmeliği’ndeki yıllık ortalama ve maksimum çevresel kalite standartlarına uygun olduğu belirtilmiştir. Al, Cu ve Zn konsantrasyonları bazı ölçüm noktalarında standartların biraz üzerinde ölçülmüştür. Ayrıca gölde ölçülen element konsantrasyonlarının sulama ve hayvansal içme suyu kullanım amaçları için uygun değerlerde olduğu tespit edilmiştir (Kara, 2019). Eğirdir Gölü’nde Bulut ve Kubilay tarafından Nisan 2013 ve Ocak 2014 tarihleri arasında yapılan çalışmada; sıcaklık değerlerinin standartlara uygun olduğu, pH değerlerinin biraz yüksek olmasına karşın (göl çevresindeki kireç taşlarından dolayı) standartları aşmadığı tespit edilmiştir (Bulut ve Kubilay, 2019).

UEMK 2019 Proceedings Book 24/25 October 2019 Gaziantep University, TURKEY
84
Tunus’da Gabes Körfezi’nde El Zrelli ve diğ. tarafından 2013 yılı Eylül ayında yapılan çalışmada; pH değerleri 3 istasyonda (CE, LG ve GH1) standartların altında tespit edilmiş; bunun sebebi olarak endüstri kaynaklı deşarjlar gösterilmiştir. Yine aynı istasyonlarda su sıcaklığının standartları aştığı, Cd, Zn ve Cr konsantrasyonlarının da yüksek değerlerde olduğu belirtilmiştir (El Zrelli vd., 2018). İspanya’da Mar Menor Lagünü’nde Pérez-Ruzafa ve diğ. tarafından Ocak 2010 – Haziran 2012, Şubat 2016 - Aralık 2017 ve Ocak 2018 - Kasım 2018 olmak üzere üç farklı dönemde gerçekleştirilen çalışmada, sıcaklık ve tuzluluk değerlerinin ötrofikasyon aşamaları boyunca uygun değerlerde olduğu belirtilmiştir (Pérez-Ruzafa vd., 2019). İran’da Gomishan Lagünü’nde Basatnia ve diğ. tarafından Temmuz 2010 ve Aralık 2010 tarihleri arasında yapılan çalışmada; su sıcaklığının Temmuz ayı hariç uygun değerlerde olduğu, pH değerlerinin de standartlara uygun olduğu tespit edilmiştir. Tuzluluk değerlerinin ölçüm periyodu boyunca artış gösterdiği, ancak Hazar Denizi’nden büyük miktarlarda su girişi olduğu zamanlarda gölün orta kısımlarında düşüş gösterdiği belirtilmiştir. Çözünmüş oksijen özellikle gölün kuzey kesimlerindeki iyi havalanmadan dolayı yüksek değerlerde ölçülmüştür (Basatnia vd., 2018). Kolombiya’da Juan Polo Lagünü’nde Baldiris-Navarro ve diğ. tarafından 2001 ve 2015 yılları arasında yürütülen çalışmada; pH değerlerinin standartlara uygun olduğu belirtilmiş; tuzluluk değerlerinin geniş bir aralıkta (%2 – 53,2) değişim gösterdiği, bunun lagünün çoğunlukla yağmurlu mevsimde gerçekleşen tuzlanmasının bir işareti olduğu ve sebep olarak da lagün ile deniz arasında devamlı bir etkileşimin olmayışı gösterilmiştir (Baldiris-Navarro vd., 2018). Küba’da El Cobre Blue Lagünü’nde Rodríguez Gámez ve diğ. tarafından Şubat 2017 ve Nisan 2017 tarihleri arasında yapılan çalışmada; su sıcaklığı değerlerinin standartlara uygun olduğu, pH değerlerinin ise standartların altında olduğu tespit edilmiştir. Özellikle pH değerlerinden dolayı göl suları ortalama düzeyde asidik ve fazlasıyla oligohalin olarak nitelendirilmiştir. Çözünmüş oksijen değerleri ise standartların üzerinde tespit edilmiştir (Gámez vd., 2019). YÖNTEM Kamil Abduş Lagünü’nde, çevresel kirliliğin araştırılması amacıyla sahada belirlenen 3 istasyonda (Şekil 1a) 6 ay boyunca her hafta sıcaklık, pH ve tuzluluk ölçülerek su numunesi toplanmıştır ve laboratuvarda hazırlanan numunelerde ağır metal konsantrasyonları İndüktif Eşleşmiş Plazma Optik Emisyon Spektrometresi (ICP-OES) cihazıyla (Şekil 1b) belirlenmiştir. Birinci istasyon tersane yakınındaki lagünün kuzeyi, ikinci istasyon lagünün güneyi ve üçüncüsü Marmara Denizi’ne girilen Tuzla Halk Plajı’dır.
UEMK 2019 Proceedings Book 24/25 October 2019 Gaziantep University, TURKEY
85
Polietilen şişeler %40 nitrik asit içeren deiyonize su içinde 24 saat bekletildikten sonra deiyonize su cihazından (ELGA purelab) su ile 3 kez çalkalanmış (Şekil 2a) ve etüvde (Binder) kurutulmuştur. Numuneler, 3-4 m uzunluğundaki teleskopik çubuğun tepesine tutturulmuş olan beher kullanılarak (Şekil 2b), yüzeyin 50 cm altında bir derinlikten alınmıştır. Numune şişeleri, deniz suyu ile üç kez çalkalandıktan sonra, şişeler tamamen doldurulmuştur. Deniz suyunun sıcaklık, pH ve tuzluluk değerleri denizin altına batırılmış ölçüm cihazının (WTW) probları ile belirlenmiştir (Şekil 2c). Daha sonra, Strickland & Parsons, 1968’deki yöntemlere göre analiz için Marmara Üniversitesi laboratuvarına transfer edilmek üzere örnekler buz üzerinde saklanmıştır. Laboratuvarda, örnekler 0,45 µm PTFE filtreden (Sartorius) steril şırınga ile süzülmüştür (Şekil 2d). Mikropipet (Brand) kullanılarak (Şekil 2e) %2 nitrik asit (Merck) ilave edilmiş ve cihazda analiz başlayana kadar buzdolabında saklanmıştır. Tüm numunelerde (Şekil 2f) ICP-OES (Spectro Blue marka) cihazı ile metal konsantrasyonları belirlenmiştir. İndüktif Eşleşmiş Plazma Optik Emisyon Spektrometresi (ICP-OES) tekniği ile plazma içerisinden geçirilen numunelerin ışığının optik özelliklerine bağlı olarak dalga boylarına göre elementlerin kalitatif ve kantitatif analizi yapılır. Katı numuneler ekstraksiyon ya da parçalama sonrası cihaza verilirken sıvı ve gazlar doğrudan verilir. Bu teknik numunenin plazmanın yaklaşık 6000-10000 °C sıcaklığına maruz kalarak gaz fazına geçtiğinde atomların emisyon ölçümüne dayanır. Numune çözeltisinin plazma yüksek ısısı ile iyonlaşarak kütle ağırlıklarına göre elementlerin tayinini yapan İndüktif eşleşmiş plazma-kütle spektrometresi (ICP-MS) tekniğinde ppt dedeksiyon limitinde ölçüm yapılabilirken ICP-OES’te ppb seviyesinde ölçüm yapılabilir. Gaz faz atomlarının konsantrasyonunu ölçmek için ışığın absorpsiyonunun kullanıldığı Atomik Absorpsiyon Spektrometresinde katot ve anot arasında yüksek bir voltaj geçirilir ve metal atomları belli bir emisyon spektrumuyla ışık üretir. ICP; Atomik Absorpsiyon Spektrometresinden daha hızlıdır ve aynı anda 69 elementi analiz edebilir.

UEMK 2019 Proceedings Book 24/25 October 2019 Gaziantep University, TURKEY
86
Şekil 1. (a) Araştırma Alanı: 1. İstasyon Kamil Abduş Lagününün Tersane Yakınındaki Kuzeyi, 2. İstasyon: Lagünün Güneyi Ve 3. İstasyon: Tuzla Halk Plajı (b) ICP-OES cihazı
Şekil 2. (a) Deiyonize Su Cihazı, (b) Numune Toplama Aparatı, (c) Sıcaklık, pH Ve Tuzluluk Ölçüm Cihazı, (d) Filtre Ve Şırıngalar, (e) Mikropipetler (f) Laboratuvarda Hazırlanan Numuneler

UEMK 2019 Proceedings Book 24/25 October 2019 Gaziantep University, TURKEY
87
BULGULAR Lagünde sıcaklık değerleri Kasım ayında 13,3 ve 16,9°C arasında, Aralık ayında 6,2 ve 10,2°C arasında, Ocak ayında 4,0 ve 9,7°C arasında, Şubat ayında 6,5 ve 11,2°C arasında, Mart ayında 9,7 ve 15,9°C arasında ve Nisan ayında 14,5 ve 19,1°C arasında ölçülmüştür (Şekil 3a). pH değerleri Kasım ayında 7,40 – 8,28 arasında, Aralık ayında 8,02 – 8,16 arasında, Ocak ayında 8,10 – 8,22 arasında, Şubat ayında 8,16 – 8,29 arasında, Mart ayında 8,22 – 8,36 arasında ve Nisan ayında 8,11 – 8,19 arasında ölçülmüştür (Şekil 3b). Tuzluluk değerleri ölçüm süresi boyunca 19,68 – 23,24 değerleri arasında değişiklik göstermiştir (Şekil 3c). Denizde ise sıcaklık değerleri Kasım ayında 14,7 ve 17,4°C arasında, Aralık ayında 8,9 ve 12,8°C arasında, Ocak ayında 9,1 ve 10,8°C arasında, Şubat ayında 9,1 ve 9,7°C arasında, Mart ayında 8,6 ve 12,7°C arasında ve Nisan ayında 15,4 ve 16,3°C arasında ölçülmüştür. pH değerleri Kasım ayında 8,36 – 8,40 arasında, Aralık ayında 8,06 – 8,29 arasında, Ocak ayında 6,75 – 8,24 arasında, Şubat ayında 8,25 – 8,51 arasında, Mart ayında 8,35 – 8,62 arasında ve Nisan ayında 8,34 civarında ölçülmüştür. Tuzluluk değerleri ölçüm süresi boyunca 19,68 – 23,24 değerleri arasında değişiklik göstermiştir. Alüminyum, arsenik, baryum, krom, mangan, demir, kobalt, nikel, bakır, çinko, kurşun, kadmiyum, selenyum konsantrasyonları sırasıyla 0,574-266,102, 2,765-25,808, 0,474-55,185, 0,638-9,732, 0,413-97,097, 1,191-187,333, 0,479-13,271, 1,017-127,92, <0,1818, 1,725-942,685, 4,706-30,75, 0,098-2,132, 0,937-28,411 aralığındadır (Şekil 4).
Şekil 3. İstasyonlardaki (a) Sıcaklık, (b) pH Ve (c) Tuzluluk Değerleri
(a) (b) (c)
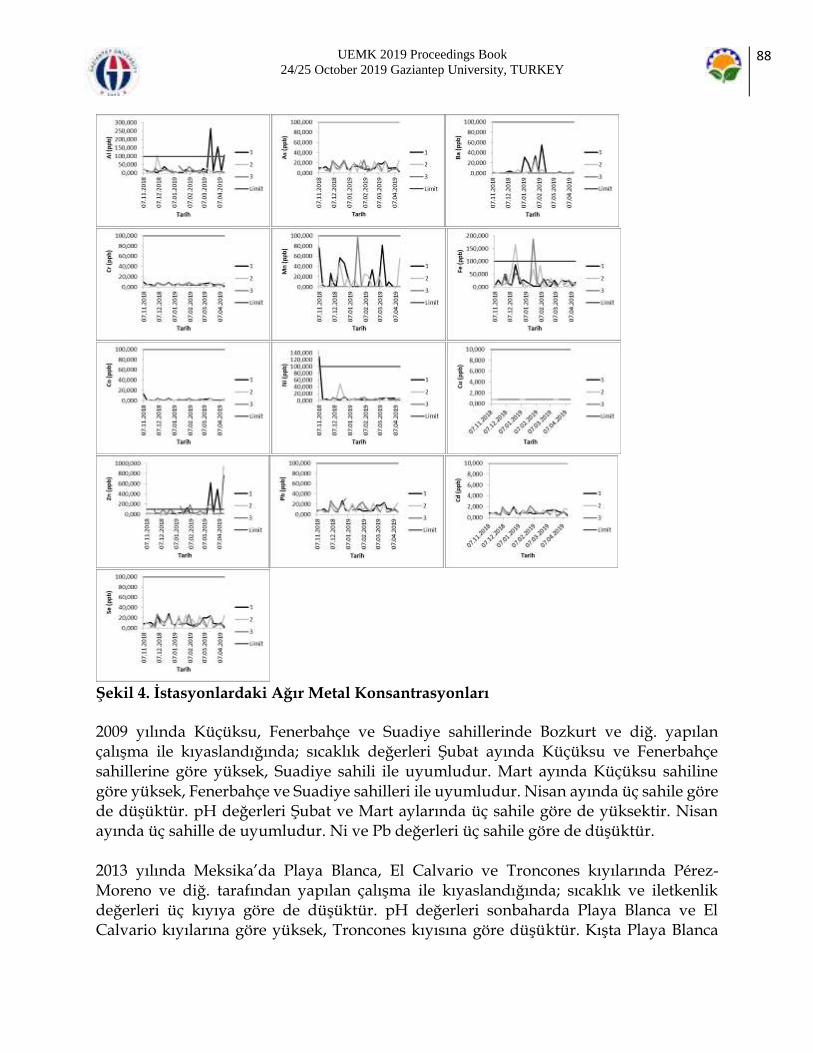
UEMK 2019 Proceedings Book 24/25 October 2019 Gaziantep University, TURKEY
88
Şekil 4. İstasyonlardaki Ağır Metal Konsantrasyonları 2009 yılında Küçüksu, Fenerbahçe ve Suadiye sahillerinde Bozkurt ve diğ. yapılan çalışma ile kıyaslandığında; sıcaklık değerleri Şubat ayında Küçüksu ve Fenerbahçe sahillerine göre yüksek, Suadiye sahili ile uyumludur. Mart ayında Küçüksu sahiline göre yüksek, Fenerbahçe ve Suadiye sahilleri ile uyumludur. Nisan ayında üç sahile göre de düşüktür. pH değerleri Şubat ve Mart aylarında üç sahile göre de yüksektir. Nisan ayında üç sahille de uyumludur. Ni ve Pb değerleri üç sahile göre de düşüktür. 2013 yılında Meksika’da Playa Blanca, El Calvario ve Troncones kıyılarında Pérez-Moreno ve diğ. tarafından yapılan çalışma ile kıyaslandığında; sıcaklık ve iletkenlik değerleri üç kıyıya göre de düşüktür. pH değerleri sonbaharda Playa Blanca ve El Calvario kıyılarına göre yüksek, Troncones kıyısına göre düşüktür. Kışta Playa Blanca

UEMK 2019 Proceedings Book 24/25 October 2019 Gaziantep University, TURKEY
89
kıyısına göre düşük, El Calvario ve Troncones kıyılarına göre yüksektir. İlkbaharda üç kıyıya göre de yüksektir. As değerleri üç kıyıya göre de yüksek olup Cd, Cu, Cr, Ni, Pb ve Zn değerleri üç kıyıya göre de düşüktür. 2013 yılında Karavasta Lagünü’nde Topi ve diğ. tarafından yapılan çalışma ile kıyaslandığında; sıcaklık ve pH değerleri tüm istasyonlara göre düşüktür. İletkenlik değerleri 1 ve 2. İstasyonlarla uyumlu, diğer istasyonlara göre yüksektir. Cu ve Cr değerleri tüm istasyonlara düşük olup Cd ve Pb değerleri tüm istasyonlara göre yüksektir. 2010 yılında Gomishan Lagünü’nde Basatnia ve diğ. tarafından yapılan çalışma ile kıyaslandığında; sıcaklık değerleri Kasım ve Aralık aylarında lagünle uyumludur. pH ve iletkenlik değerleri her iki ayda da lagüne göre yüksektir. 2014 yılında İskenderun Körfezi’nde Göycıncık ve diğ. tarafından yapılan çalışma ile kıyaslandığında pH değerleri Kasım, Aralık, Şubat ve Mart aylarında tüm istasyonlarda körfeze göre yüksek olup Ocak ayında düşüktür. Cr, Fe, Ni, Cu ve As değerleri tüm istasyonlara göre düşüktür. 2011 yılında Tecer Gölü’nde Mutlu ve diğ. tarafından yapılan çalışma ile kıyaslandığında; pH, tuzluluk ve iletkenlik değerleri ilkbahar, sonbahar ve kış mevsimlerinde göle göre yüksektir. Pb değerleri ilkbahar ve kış mevsimlerinde göle göre yüksek olup sonbahar mevsiminde göle göre düşüktür. Cd değerleri ilkbahar ve sonbahar mevsimlerinde göle göre düşük olup kış mevsiminde göle göre yüksektir. Cu değerleri üç mevsimde de göle göre düşüktür. Fe değerleri ilkbahar mevsiminde göle göre düşük olup sonbahar ve kış mevsimlerinde göle göre yüksektir. SONUÇ Su Kirliliği Yönetmeliği’ndeki deniz suyunun genel kalite kriterlerine göre 3 nolu istasyondaki deniz suyunun 6,75 ve 8,62 aralığı içindeki pH değerleri uygundur. Su Kirliliği Yönetmeliği’ndeki göller, göletler, bataklıklar ve baraj haznelerinin doğal koruma alanı ve rekreasyon kullanımında ötrofikasyon kontrolü sınır değerlerine göre 1 ve 2 nolu istasyonlardaki tatlı suyun 7,4 ve 8,36 aralığı içindeki pH değerleri de uygundur. Su Kirliliği Kontrolü Yönetmeliği kıta içi su kaynaklarının sınıflarına göre kalite kriterlerine göre pH lagünün I. sınıf su kalitesini göstermektedir. EPA Akuatik yaşam kriter tablosundaki pH’ın tatlı su sınırına 1 ve 2 nolu istasyonlar uygunken tuzlu su sınırını 3 nolu istasyon sadece 20 Mart 2019’da 8,62 değeri ile aşmıştır. Su Kirliliği Yönetmeliği deniz suyunun genel kalite kriterleri kapsamında 3 nolu istasyonda bakır, kadmiyum, krom, kurşun, nikel ve arsenik konsantrasyonları limit
UEMK 2019 Proceedings Book 24/25 October 2019 Gaziantep University, TURKEY
90
değerin altındadır fakat çinko konsantrasyonu 27.12.2018, 16.01.2019, 5.2.2019 tarihlerinde limit değeri aşmıştır. Kıta İçi Su Kaynaklarının Kalite Kriterlerine göre bakır, kadmiyum, demir, mangan, baryum, alüminyum I., arsenik, kobalt II., kurşun, nikel, çinko III., selenyum IV. su kalite sınıfına girmektedir. İnsanların balıkçılık vb. rekreasyon amacıyla kullanımı ve su canlılarının yaşamı açısından önemli olan Kamil Abduş Lagünü’nün korunması gerekmektedir. KAYNAKLAR Acar, H. (2003). Göllerin ekolojisini etkileyen faktörlerin araştırılması ve Tuzla (Kamil Abduş) Gölü örneği. Alkan Uçkun, A. (2019) Investigation of Toxic Metal Contamination in Water and Sediments of Gölbaşı Lake (Adıyaman). Adıyaman University Journal of Science 8(2). Alpar, B. (2016). Sea level changes along the turkish straits system and climate change. The Sea of Marmara: Marine Biodiversity, Fisheries, Conservation and Governance, 831. Atalay, İ., Ekinci, D., Bayrak, M. (2015). Türkiye Kıyılarındaki Bazı Sulak Alanların Antropojenik Süreçlere Bağlı Ekolojik Sorunları. IV. Ulusal Jeomorfoloji Sempozyumu. Bildiriler Kitabi, Samsun. Ateş Can, S. (2014). Robert oerley and Tuzla mineral springs. METU Journal of the Faculty of Architecture, 31(1). Baldiris-Navarro, I., Sanchez-Aponte, J., Gonzalez-Delgado, A., Acosta-Jimenez, J.C. ve Jimenez, A.R. (2018) Multivariable statistical evaluation of water quality in Juan polo coastal lagoon (Colombian Caribbean). Contemporary Engineering Sciences 11(27), 1339-1348. Basatnia, N., Hossein, S.A., Rodrigo-Comino, J., Khaledian, Y., Brevik, E.C., Aitkenhead-Peterson, J. ve Natesan, U. (2018) Assessment of temporal and spatial water quality in international Gomishan Lagoon, Iran, using multivariate analysis. Environmental Monitoring and Assessment 190(5), 314. Bozkurt, E., Eliri, Ö., Kesiktaş, M. (2014) Analysis of Heavy Metals in Seawater Samples Collected From Beaches of Asian Side of Istanbul. Journal of Recreation and Tourism Research (JRTR) 1(1), 39-47. Bulut, C. ve Kubilay, A. (2019) Seasonal change of water quality in Egirdir Lake (Isparta/Turkey). Ege Journal of Fisheries and Aquatic Sciences 36(1), 13-23. Catianis, I., Secrieru, D., Pojar, I., Grosu, D., Scrieciu, A., Pavel, A.B. ve Vasiliu, D. (2018) Water Quality, Sediment Characteristics and Benthic Status of the Razim-Sinoie Lagoon System, Romania. Open Geosciences 10(1), 12-33. Ceylan, M., & Ceylan, M. A. (2010). Türkiye kıyılarında tomboloların oluşumu dağılışı ve fonksiyonel özellikleri konusunda bir araştırma. Marmara Coğrafya Dergisi, (22), 205-232.

UEMK 2019 Proceedings Book 24/25 October 2019 Gaziantep University, TURKEY
91
Cüce, H., Bakan,G., Akıncı, H. (2011) Balık Gölü (Kızılırmak Deltası, Samsun) Su Kalitesinin Konumsal Analizi, 3. Demir Yetis, A., Selek, Z., Seckin, G. ve Davutluoglu, O.I. (2014) Water quality of Mediterranean coastal plains: conservation implications from the Akyatan Lagoon, Turkey. Environmental Monitoring and Assessment 186(11), 7631-7642. El Zrelli, R., Rabaoui, L., Ben Alaya, M., Daghbouj, N., Castet, S., Besson, P., Michel, S., Bejaoui, N. ve Courjault-Rade, P. (2018) Seawater quality assessment and identification of pollution sources along the central coastal area of Gabes Gulf (SE Tunisia): Evidence of industrial impact and implications for marine environment protection. Marine Pollution Bulletin 127, 445-452. EPA Quality Criteria for Water (1986). Gold Book National Recommended Water Quality Criteria - Aquatic Life Criteria Table. https://www.epa.gov/wqc/national-recommended-water-quality-criteria-aquatic-life-criteria-table Ertek, T. A. (2016). Coastal geomorphology of Sea of Marmara and its islands. The Sea of Marmara: Marine Biodiversity, Fisheries, Conservation and Governance, 290. Gámez, O.R., Laffont-Schwob, I., Prudent, P., Vassalo, L., Rodriguez, I.A., Macias, R.P., Petit, M.E., Ibarra, A.T.A., Masotti, V., Perraud-Gaime, I. ve Rodriguez, A.A. (2019) Assessment of water quality from the Blue Lagoon of El Cobre mine in Santiago de Cuba: a preliminary study for water reuse. Environmental Science and Pollution Research, 26(16), 16366-16377. Gazete, R. (2004a). Su Kirliliği Kontrolü Yönetmeliği. TC Çevre ve Şehircilik Bakanlığı, Karar, 8289, Tablo 2: göller, göletler, bataklıklar ve baraj haznelerinin ötrofikasyon kontrolü sınır değerleri, http://www.mevzuat.gov.tr/Metin.Aspx?MevzuatKod=7.5.7221&sourceXmlSearch=&MevzuatIliski=0 Gazete, R. (2004b). Su Kirliliği Kontrolü Yönetmeliği. TC Çevre ve Şehircilik Bakanlığı, Karar, 8289, Tablo 4: Deniz suyunun genel kalite kriterleri http://www.mevzuat.gov.tr/Metin.Aspx?MevzuatKod=7.5.7221&sourceXmlSearch=&MevzuatIliski=0 Gazete, R. (2004c). Su Kirliliği Kontrolü Yönetmeliği. TC Çevre ve Şehircilik Bakanlığı, Karar, 8289, Tablo1: Kıtaiçi su kaynaklarının sınıflarına göre kalite kriterleri, http://www.mevzuat.gov.tr/Metin.Aspx?MevzuatKod=7.5.7221&sourceXmlSearch=&MevzuatIliski=0 Göycıncık, S., Danahaliloğlu, H. ve Karayiğit, H.B. (2018) İskenderun Körfezi Deniz Suyunun Eser Element Düzeylerinin Araştırılması. Karadeniz Fen Bilimleri Dergisi 8(2), 39-48. Hernández-Terrones, L.M., Null, K.A., Ortega-Camacho, D. ve Paytan, A. (2015) Water quality assessment in the Mexican Caribbean: Impacts on the coastal ecosystem. Continental Shelf Research 102, 62-72. İleri, S., Karaer, F., Kâtip, A., Onur, S. (2014) Sığ Göllerde Su Kalitesi Değerlendirmesi, Uluabat Gölü Örneği. Uludağ Üniversitesi Mühendislik-Mimarlık Fakültesi Dergisi 19(1).
UEMK 2019 Proceedings Book 24/25 October 2019 Gaziantep University, TURKEY
92
Kara, M. (2019) Bafa Gölü Sularında Element Konsantrasyonlarının Belirlenmesi ve Su Kalitesi Açısından Değerlendirilmesi. BEÜ Fen Bilimleri Dergisi 8(1). Kayhan, F.E., Özhatay, E. (2004) The Determination of Some Chemical Pollution Parameters (Cd, Al, Fe) in Tuzla Balık Lake, DPÜ Fen Bilimleri Enstitüsü Dergisi, (7). Kayhan, F.E., Özhatay, E. (2004) The Determination of Some Chemical Pollution Parameters (Cd, Al, Fe) in Tuzla Balık Lake, DPÜ Fen Bilimleri Enstitüsü Dergisi, (7). Koto, R., Bani, A., Topi, T., Topi, M. (2014) Water Quality and Heavy Metal Content of Karavasta Lagoon in Albania. Fresenius Environmental Bulletin 23(12). Kotori, P., Hasanaj, L. ve Kane, S. (2015) Physical-Chemical Parameters and Assessment of Pollution Through Bioindicators of Narta Lagoon, Sustainable Development of Sea-Corridors and Coastal Waters, Bölüm 5, 47-55. Mutlu, E., Kutlu, B., Demir, T., Yanık, T. (2018) Assessment of metal concentrations and physicochemical parameters in the waters of Lake Tecer, Kastamonu Universitesi Orman Fakültesi Dergisi 18(1). Mutlu, E., Yanık, T., Demir, T. (2013) Karagöl (Hafik-Sivas) ‘ün Su Kalitesinin İncelenmesi, Alınteri Zirai Bilimler Dergisi 24(1), 35-45. Özdemir, N., Engin, A. (2013) Güllük Lagünü’nün Su Kalitesi Yönünden İncelenmesi, Güllük Körfezi Bakteriyolojisi TÜBİTAK Proje Çalıştayı, 10 Mayıs 2013, Güllük, Muğla, 53. Pérez-Ruzafa, A., Campillo, S., Fernández-Palacios, J.M., García-Lacunza, A., García-Oliva, M., Ibañez, H., Navarro-Martínez, P.C., Pérez-Marcos, M., Pérez-Ruzafa, I.M., Quispe-Becerra, J.I., Sala-Mirete, A., Sánchez, O. ve Marcos, C. (2019) Long-Term Dynamic in Nutrients, Chlorophyll a, and Water Quality Parameters in a Coastal Lagoon During a Process of Eutrophication for Decades, a Sudden Break and a Relatively Rapid Recovery, Frontiers in Marine Science, (6). Rahmadani, T., Sabang, S. M., Said, I. (2015) Analisis Kandungan Logam Zink (Zn) Dan Timbal (Pb) Dalam Air Laut Pesisir Pantai Mamboro Kecamatan Palu Utara, Jurnal Akademika Kimia, 4(4), 197-203. Şenol, C. (2012). İstanbul’un içme suyu havzalarının ekolojik sorunları. III. Ulusal Jeomorfoloji Sempozyumu. Bildiriler Kitabi, Hatay. T.Ü.İ.K. (2014) Seçilmiş Göstergelerle İstanbul (2013), Türkiye İstatistik Kurumu Matbaası, Eylül 2014, Ankara, Türkiye. Tarım ve Orman Bakanlığı Meteoroloji Genel Müdürlüğü, 2019, https://www.mgm.gov.tr/FILES/resmi-istatistikler/denizSuyu/Marmara-DenizSuyu-Sicakligi-Analizi.pdf Tobón Velázquez, N.I., Rebolledo Vieyra, M., Paytan, A., Broach, K.H. ve Hernández Terrones, L.M. (2019) Hydrochemistry and carbonate sediment characterisation of Bacalar Lagoon, Mexican Caribbean. Marine and Freshwater Research 70(3), 382. Topi, T., Bani, A., Malltezi, J., Sulce, S. (2012) Heavy Metals in Soil, Sediments, Mussels and Water From Butrinti Lagoon (Albania). Fresenius Environmental Bulletin 21(10).

UEMK 2019 Proceedings Book 24/25 October 2019 Gaziantep University, TURKEY
93
Tosic, M., Restrepo, J.D., Lonin, S., Izquierdo, A. ve Martins, F. (2019) Water and sediment quality in Cartagena Bay, Colombia: Seasonal variability and potential impacts of pollution, Estuarine, Coastal and Shelf Science, (216), 187-203. Vouvé, F., Buscail, R., Aubert, D., Labadie, P., Chevreuil, M., Canal, C., Desmousseaux, M., Alliot, F., Amilhat, E., Faliex, E., Paris-Palacios, S. ve Biagianti-Risbourg, S. (2014) Bages-Sigean and Canet-St Nazaire lagoons (France): physico-chemical characteristics and contaminant concentrations (Cu, Cd, PCBs and PBDEs) as environmental quality of water and sediment, Environmental Science and Pollution Research, 21(4), 3005-3020.

UEMK 2019 Proceedings Book 24/25 October 2019 Gaziantep University, TURKEY
94
MICRON-SIZED COAL PARTICLES AS A NOVEL FUEL ADDITIVE FOR DIESEL ENGINE APPLICATION Abdülvahap ÇAKMAK Department of Motor Vehicles and Transportation Technologies, Kavak Vocational School, Samsun University [email protected] Hakan Özcan Department of Mechanical Engineering, Ondokuz Mayıs University [email protected] ABSTRACT: This research investigates the effect of addition micron-sized coal particles to diesel fuel on engine performance and emissions. Micron-sized coal particles used in this study was prepared by the mechanical ball milling process. The obtained coal particles were characterized by Scanning Electron Microscopy (SEM) and energy dispersive X-rays (EDX) analysis. The micron-sized coal particles were dispersed in a mass fraction of 300 ppm with diesel fuel and B20 by ultrasonication and the resulted fuels were labeled as D+C and B20+C, respectively. Pure diesel (D) and B20 without coal particles were used to set baseline data for comparison. Engine performance and emission tests were performed at a constant engine speed of 1500 rpm and full engine load. Addition of micron-sized coal particles to diesel fuel improved the brake thermal efficiency by 6.3% and reduced the NOx emissions by 11.8%. Improvement in engine performance and exhaust emissions were also observed for B20+C fuel. Keywords: Micron-sized coal particles, Nano-additives, Diesel engine, Biodiesel, Performance and emissions INTRODUCTION The diesel engine is the most efficient internal combustion engine widely used in car, bus, truck, railroad, marine, industrial and agricultural applications (Pulkrabek, 1997). However, diesel-powered vehicles and equipment emit a big amount of pollutants such as NOx and PM which cause serious health and environmental hazards (Bhandarkar, 2013; Heywood, 1988). Therefore, a major concern has been raised for scientists to find an effective way of reducing pollutant emissions. There are some methods of reducing pollutant exhaust emissions: exhaust gas recirculation (EGR), after-treatment methods, fuel injection/combustion system design and fuel modification. Nevertheless, among these methods fuel modification is the more effective and cheaper countermeasure to high emissions, agreed by many researchers (Chen et al., 2018).
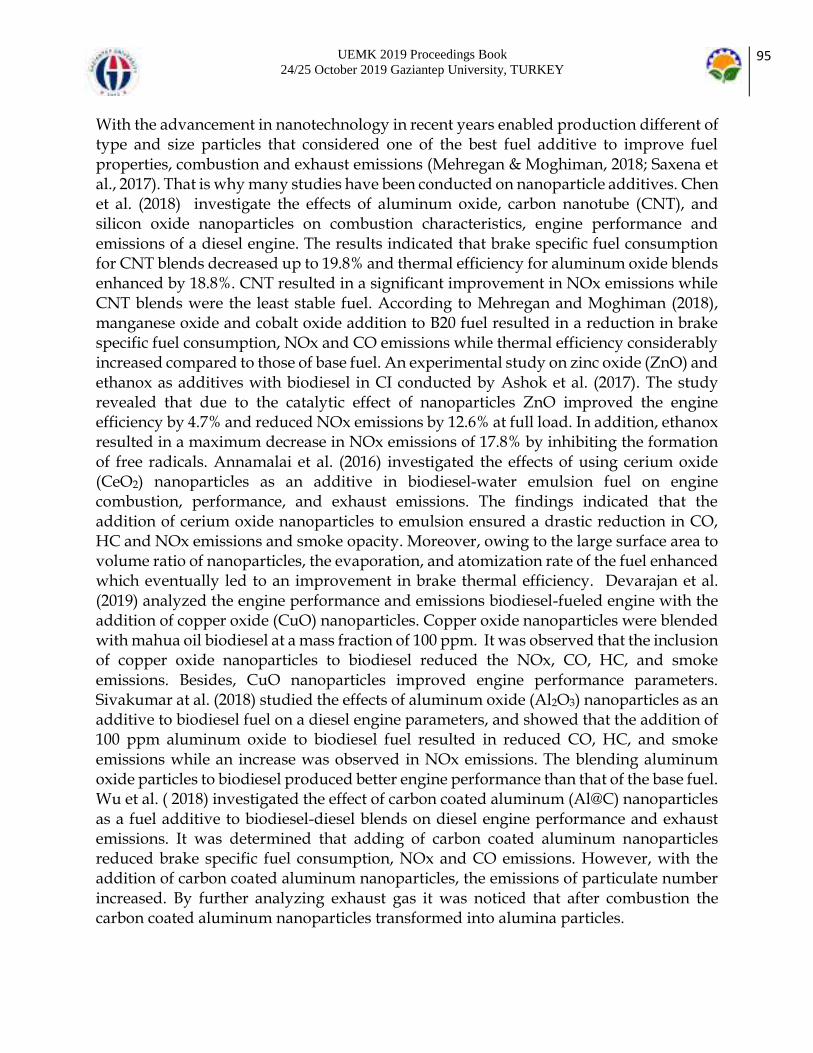
UEMK 2019 Proceedings Book 24/25 October 2019 Gaziantep University, TURKEY
95
With the advancement in nanotechnology in recent years enabled production different of type and size particles that considered one of the best fuel additive to improve fuel properties, combustion and exhaust emissions (Mehregan & Moghiman, 2018; Saxena et al., 2017). That is why many studies have been conducted on nanoparticle additives. Chen et al. (2018) investigate the effects of aluminum oxide, carbon nanotube (CNT), and silicon oxide nanoparticles on combustion characteristics, engine performance and emissions of a diesel engine. The results indicated that brake specific fuel consumption for CNT blends decreased up to 19.8% and thermal efficiency for aluminum oxide blends enhanced by 18.8%. CNT resulted in a significant improvement in NOx emissions while CNT blends were the least stable fuel. According to Mehregan and Moghiman (2018), manganese oxide and cobalt oxide addition to B20 fuel resulted in a reduction in brake specific fuel consumption, NOx and CO emissions while thermal efficiency considerably increased compared to those of base fuel. An experimental study on zinc oxide (ZnO) and ethanox as additives with biodiesel in CI conducted by Ashok et al. (2017). The study revealed that due to the catalytic effect of nanoparticles ZnO improved the engine efficiency by 4.7% and reduced NOx emissions by 12.6% at full load. In addition, ethanox resulted in a maximum decrease in NOx emissions of 17.8% by inhibiting the formation of free radicals. Annamalai et al. (2016) investigated the effects of using cerium oxide (CeO2) nanoparticles as an additive in biodiesel-water emulsion fuel on engine combustion, performance, and exhaust emissions. The findings indicated that the addition of cerium oxide nanoparticles to emulsion ensured a drastic reduction in CO, HC and NOx emissions and smoke opacity. Moreover, owing to the large surface area to volume ratio of nanoparticles, the evaporation, and atomization rate of the fuel enhanced which eventually led to an improvement in brake thermal efficiency. Devarajan et al. (2019) analyzed the engine performance and emissions biodiesel-fueled engine with the addition of copper oxide (CuO) nanoparticles. Copper oxide nanoparticles were blended with mahua oil biodiesel at a mass fraction of 100 ppm. It was observed that the inclusion of copper oxide nanoparticles to biodiesel reduced the NOx, CO, HC, and smoke emissions. Besides, CuO nanoparticles improved engine performance parameters. Sivakumar at al. (2018) studied the effects of aluminum oxide (Al2O3) nanoparticles as an additive to biodiesel fuel on a diesel engine parameters, and showed that the addition of 100 ppm aluminum oxide to biodiesel fuel resulted in reduced CO, HC, and smoke emissions while an increase was observed in NOx emissions. The blending aluminum oxide particles to biodiesel produced better engine performance than that of the base fuel. Wu et al. ( 2018) investigated the effect of carbon coated aluminum (Al@C) nanoparticles as a fuel additive to biodiesel-diesel blends on diesel engine performance and exhaust emissions. It was determined that adding of carbon coated aluminum nanoparticles reduced brake specific fuel consumption, NOx and CO emissions. However, with the addition of carbon coated aluminum nanoparticles, the emissions of particulate number increased. By further analyzing exhaust gas it was noticed that after combustion the carbon coated aluminum nanoparticles transformed into alumina particles.
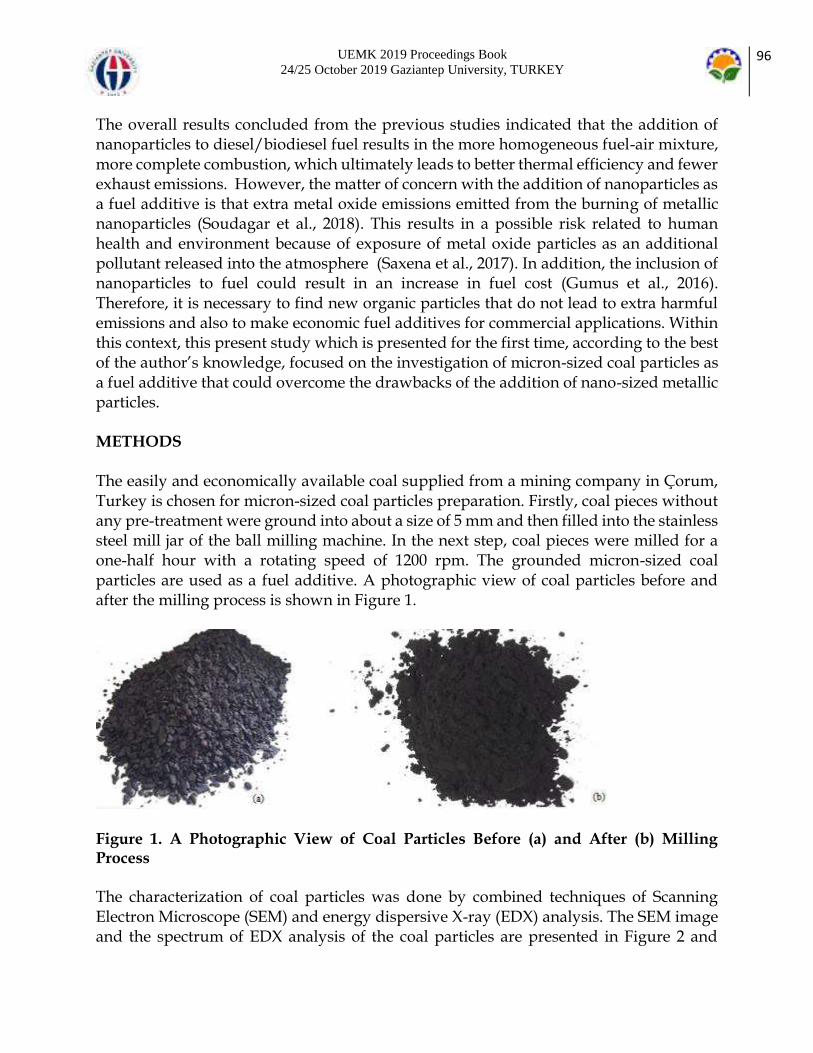
UEMK 2019 Proceedings Book 24/25 October 2019 Gaziantep University, TURKEY
96
The overall results concluded from the previous studies indicated that the addition of nanoparticles to diesel/biodiesel fuel results in the more homogeneous fuel-air mixture, more complete combustion, which ultimately leads to better thermal efficiency and fewer exhaust emissions. However, the matter of concern with the addition of nanoparticles as a fuel additive is that extra metal oxide emissions emitted from the burning of metallic nanoparticles (Soudagar et al., 2018). This results in a possible risk related to human health and environment because of exposure of metal oxide particles as an additional pollutant released into the atmosphere (Saxena et al., 2017). In addition, the inclusion of nanoparticles to fuel could result in an increase in fuel cost (Gumus et al., 2016). Therefore, it is necessary to find new organic particles that do not lead to extra harmful emissions and also to make economic fuel additives for commercial applications. Within this context, this present study which is presented for the first time, according to the best of the author’s knowledge, focused on the investigation of micron-sized coal particles as a fuel additive that could overcome the drawbacks of the addition of nano-sized metallic particles. METHODS The easily and economically available coal supplied from a mining company in Çorum, Turkey is chosen for micron-sized coal particles preparation. Firstly, coal pieces without any pre-treatment were ground into about a size of 5 mm and then filled into the stainless steel mill jar of the ball milling machine. In the next step, coal pieces were milled for a one-half hour with a rotating speed of 1200 rpm. The grounded micron-sized coal particles are used as a fuel additive. A photographic view of coal particles before and after the milling process is shown in Figure 1.
Figure 1. A Photographic View of Coal Particles Before (a) and After (b) Milling Process The characterization of coal particles was done by combined techniques of Scanning Electron Microscope (SEM) and energy dispersive X-ray (EDX) analysis. The SEM image and the spectrum of EDX analysis of the coal particles are presented in Figure 2 and
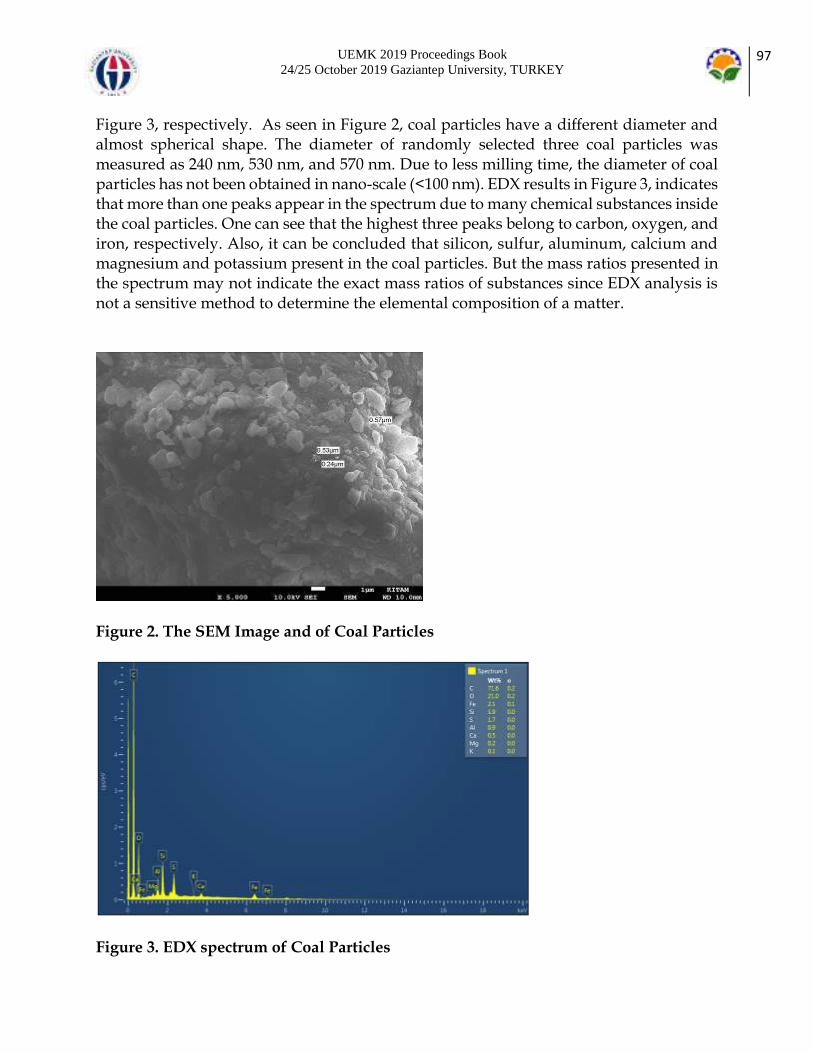
UEMK 2019 Proceedings Book 24/25 October 2019 Gaziantep University, TURKEY
97
Figure 3, respectively. As seen in Figure 2, coal particles have a different diameter and almost spherical shape. The diameter of randomly selected three coal particles was measured as 240 nm, 530 nm, and 570 nm. Due to less milling time, the diameter of coal particles has not been obtained in nano-scale (<100 nm). EDX results in Figure 3, indicates that more than one peaks appear in the spectrum due to many chemical substances inside the coal particles. One can see that the highest three peaks belong to carbon, oxygen, and iron, respectively. Also, it can be concluded that silicon, sulfur, aluminum, calcium and magnesium and potassium present in the coal particles. But the mass ratios presented in the spectrum may not indicate the exact mass ratios of substances since EDX analysis is not a sensitive method to determine the elemental composition of a matter.
Figure 2. The SEM Image and of Coal Particles
Figure 3. EDX spectrum of Coal Particles
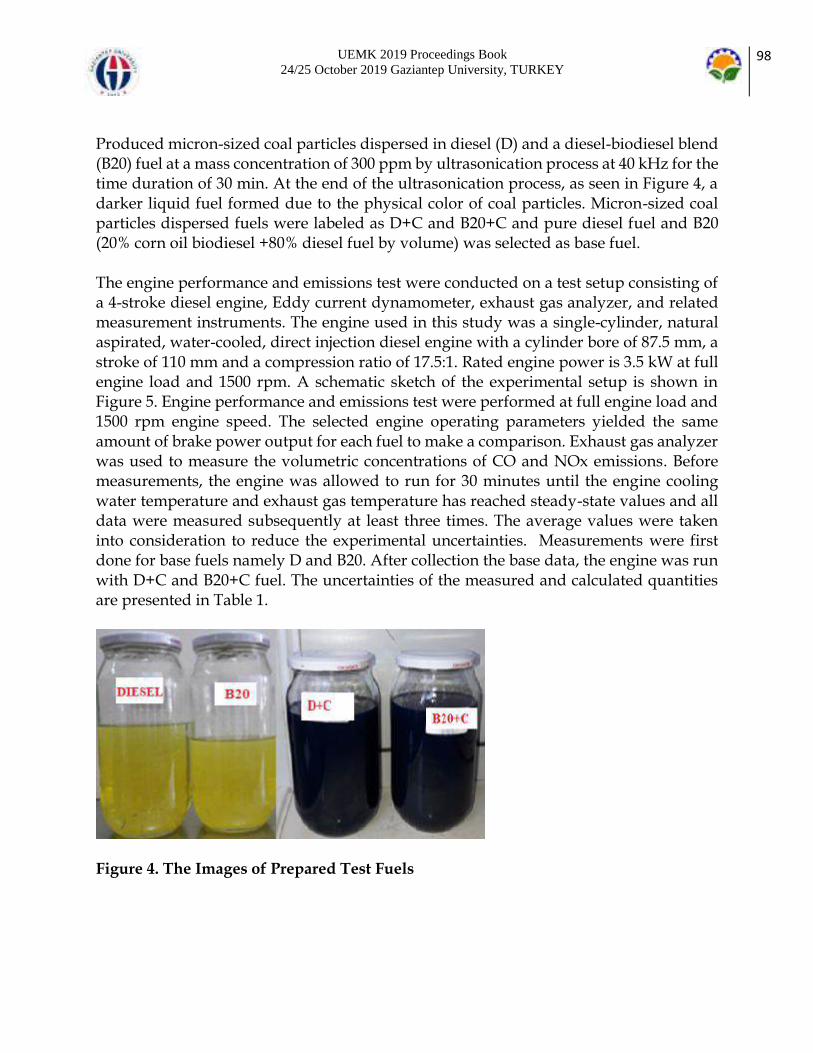
UEMK 2019 Proceedings Book 24/25 October 2019 Gaziantep University, TURKEY
98
Produced micron-sized coal particles dispersed in diesel (D) and a diesel-biodiesel blend (B20) fuel at a mass concentration of 300 ppm by ultrasonication process at 40 kHz for the time duration of 30 min. At the end of the ultrasonication process, as seen in Figure 4, a darker liquid fuel formed due to the physical color of coal particles. Micron-sized coal particles dispersed fuels were labeled as D+C and B20+C and pure diesel fuel and B20 (20% corn oil biodiesel +80% diesel fuel by volume) was selected as base fuel. The engine performance and emissions test were conducted on a test setup consisting of a 4-stroke diesel engine, Eddy current dynamometer, exhaust gas analyzer, and related measurement instruments. The engine used in this study was a single-cylinder, natural aspirated, water-cooled, direct injection diesel engine with a cylinder bore of 87.5 mm, a stroke of 110 mm and a compression ratio of 17.5:1. Rated engine power is 3.5 kW at full engine load and 1500 rpm. A schematic sketch of the experimental setup is shown in Figure 5. Engine performance and emissions test were performed at full engine load and 1500 rpm engine speed. The selected engine operating parameters yielded the same amount of brake power output for each fuel to make a comparison. Exhaust gas analyzer was used to measure the volumetric concentrations of CO and NOx emissions. Before measurements, the engine was allowed to run for 30 minutes until the engine cooling water temperature and exhaust gas temperature has reached steady-state values and all data were measured subsequently at least three times. The average values were taken into consideration to reduce the experimental uncertainties. Measurements were first done for base fuels namely D and B20. After collection the base data, the engine was run with D+C and B20+C fuel. The uncertainties of the measured and calculated quantities are presented in Table 1.
Figure 4. The Images of Prepared Test Fuels

UEMK 2019 Proceedings Book 24/25 October 2019 Gaziantep University, TURKEY
99
Figure 5. Experimental Setup Table 1. The Uncertainties of the Measured and Calculated Quantities
Parameter Measurement Range
Resolution Uncertainty
Brake torque 0-90 Nm 0.1 Nm ±1.5 % Engine speed 0-9999 rpm 1 rpm ±0.06 %
Air flow rate - - <±0.8 % Fuel flow rate - - <±0.7 % Temperature - 0.1 1 Brake thermal efficiency
- - <±0.9 %
CO 0-10 % vol. 0.001 % ±3% NOx 0-4000 ppm 1 ppm ± 25 ppm
RESULTS AND FINDINGS Brake thermal efficiency (BTE) of the test fuels presented in Figure 6. Brake thermal efficiency is a significant performance parameter used to identify the engine’s capability to convert fuel chemical energy into useful work. It can be clearly seen in this figure that B20 base fuel presented higher BTE than that of base diesel fuel. In spite of the low heating value of B20 fuel, the oxygen in the chemical structure of the biodiesel could improve the combustion quality, and thus enhance the BTE. The BTE results revealed that the inclusion of micron-sized coal particles in both D and B20 presented an improvement in BTE compared to base fuels. Addition of 300 ppm coal particles to D and B20 resulted in an increase in BTE by 6.32% and 3.34%, respectively. This increase in BTE could be due to the catalytic effect of coal particles. In addition, adding micron-sized coal particles could improve the fuel properties such as thermal conductivity, evaporation rate and
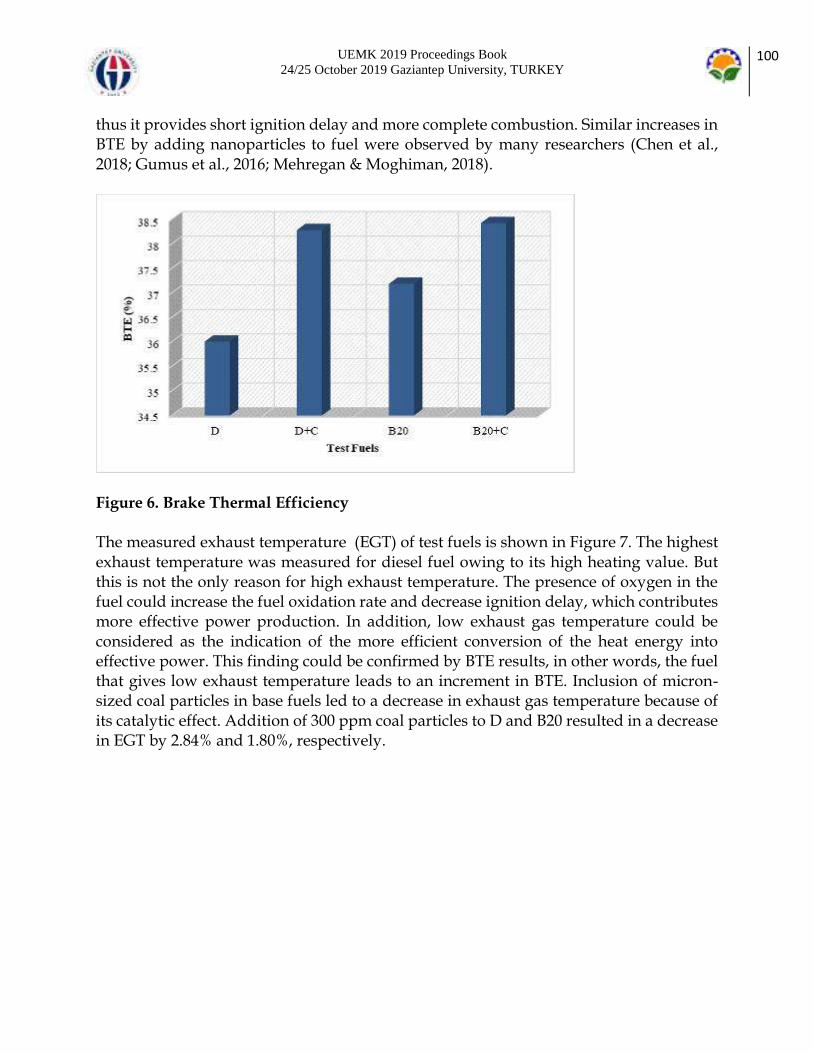
UEMK 2019 Proceedings Book 24/25 October 2019 Gaziantep University, TURKEY
100
thus it provides short ignition delay and more complete combustion. Similar increases in BTE by adding nanoparticles to fuel were observed by many researchers (Chen et al., 2018; Gumus et al., 2016; Mehregan & Moghiman, 2018).
Figure 6. Brake Thermal Efficiency The measured exhaust temperature (EGT) of test fuels is shown in Figure 7. The highest exhaust temperature was measured for diesel fuel owing to its high heating value. But this is not the only reason for high exhaust temperature. The presence of oxygen in the fuel could increase the fuel oxidation rate and decrease ignition delay, which contributes more effective power production. In addition, low exhaust gas temperature could be considered as the indication of the more efficient conversion of the heat energy into effective power. This finding could be confirmed by BTE results, in other words, the fuel that gives low exhaust temperature leads to an increment in BTE. Inclusion of micron-sized coal particles in base fuels led to a decrease in exhaust gas temperature because of its catalytic effect. Addition of 300 ppm coal particles to D and B20 resulted in a decrease in EGT by 2.84% and 1.80%, respectively.

UEMK 2019 Proceedings Book 24/25 October 2019 Gaziantep University, TURKEY
101
Figure 7. Exhaust Gas Temperature Figure 8 shows the CO emissions for test fuels. CO emission value for D and B20 was measured as 0.14% and 0.16%, respectively. The potential reasons for high CO emission for B20 could be its high fuel consumption, high viscosity, high density, and lower volatility of biodiesel. At full engine load, due to low energy content more B20 fuel must be injected in the cylinder in order to produce the equal brake power when compared to diesel fuel, so there would not be enough time to completely burn of all injected fuel. High viscosity and low volatility of the biodiesel could worsen the fuel-air mixing process. As a result, CO emission increased. It is noticed also in Figure 8 that adding of micron-sized coal particles to base fuels led to different behavior in CO emissions. It was determined that the inclusion of 300 ppm coal particles in diesel fuel led to an increase in CO emissions by 12.85%. This was due to the increase in the carbon content of the base fuel (Chen et al., 2018). However, the addition of coal particles to B20 fuel presented lower CO emission by 15.63% compared to base B20 fuel. In spite of an increase in the carbon content of B20 fuel owing to coal particle adding, the influence of oxygen in the biodiesel and catalytic effect of coal particles resulted in a decrease in CO emissions.
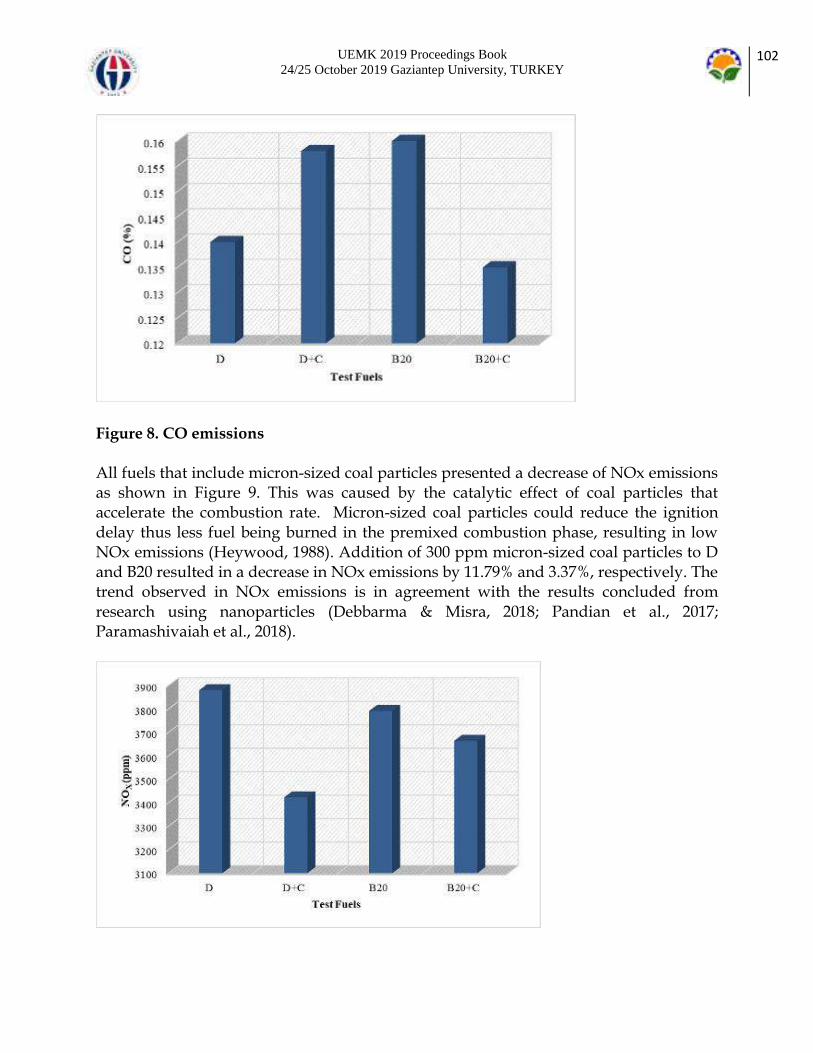
UEMK 2019 Proceedings Book 24/25 October 2019 Gaziantep University, TURKEY
102
Figure 8. CO emissions All fuels that include micron-sized coal particles presented a decrease of NOx emissions as shown in Figure 9. This was caused by the catalytic effect of coal particles that accelerate the combustion rate. Micron-sized coal particles could reduce the ignition delay thus less fuel being burned in the premixed combustion phase, resulting in low NOx emissions (Heywood, 1988). Addition of 300 ppm micron-sized coal particles to D and B20 resulted in a decrease in NOx emissions by 11.79% and 3.37%, respectively. The trend observed in NOx emissions is in agreement with the results concluded from research using nanoparticles (Debbarma & Misra, 2018; Pandian et al., 2017; Paramashivaiah et al., 2018).

UEMK 2019 Proceedings Book 24/25 October 2019 Gaziantep University, TURKEY
103
Figure 9. NOX emissions CONCLUSIONS This study revealed that micron-sized coal particles could have the potential to replace metal-based nanoparticles. Along with this, the coal particle could overcome the side effects of metal nanoparticles. The obtained results from this study showed that the addition of coal particles to diesel and B20 fuel resulted in an improvement in brake thermal efficiency and NOX emissions. In the frame of engine experiments, no issues related to the engine functionality were observed. This observation indicates that micron-sized coal particles can be used in a CI without any modification. RECOMMENDATIONS Since this study is the first research on using micron-sized coal particles as a fuel additive, could not be done a comprehensive experimental study, however, Authors are planning to make further research on this subject. Further studies are required to determine coal particle size and its dosage value, which will provide the optimum engine performance and exhaust emissions. Another aspect should be investigated is the stability of coal particles added fuels. In addition, an economic analysis of coal particle use should be done. ACKNOWLEDGMENTS This study was supported by the Project Management Office of Ondokuz Mayis University (Project number: PYO.MUH.1904.19.016). Abdülvahap ÇAKMAK thanks TUBİTAK for his doctoral scholarship (TUBİTAK-BİDEB: 2211-C). REFERENCES Annamalai, M., Dhinesh, B., Nanthagopal, K., SivaramaKrishnan, P., Isaac JoshuaRamesh Lalvani, J., Parthasarathy, M., & Annamalai, K. (2016). An assessment on performance, combustion and emission behavior of a diesel engine powered by ceria nanoparticle blended emulsified biofuel. Energy Conversion and Management, 123, 372–380. https://doi.org/10.1016/J.ENCONMAN.2016.06.062 Ashok, B., Nanthagopal, K., Mohan, A., Johny, A., & Tamilarasu, A. (2017). Comparative analysis on the effect of zinc oxide and ethanox as additives with biodiesel in CI engine. Energy, 140, 352–364. https://doi.org/10.1016/J.ENERGY.2017.09.021 Bhandarkar, S. (2013). Vehicular Pollution, Their Effect on Human Heatlh and Mitigation Measures. Vehicle Engineering(VE), 1(2). Chen, A. F., Akmal Adzmi, M., Adam, A., Othman, M. F., Kamaruzzaman, M. K., &
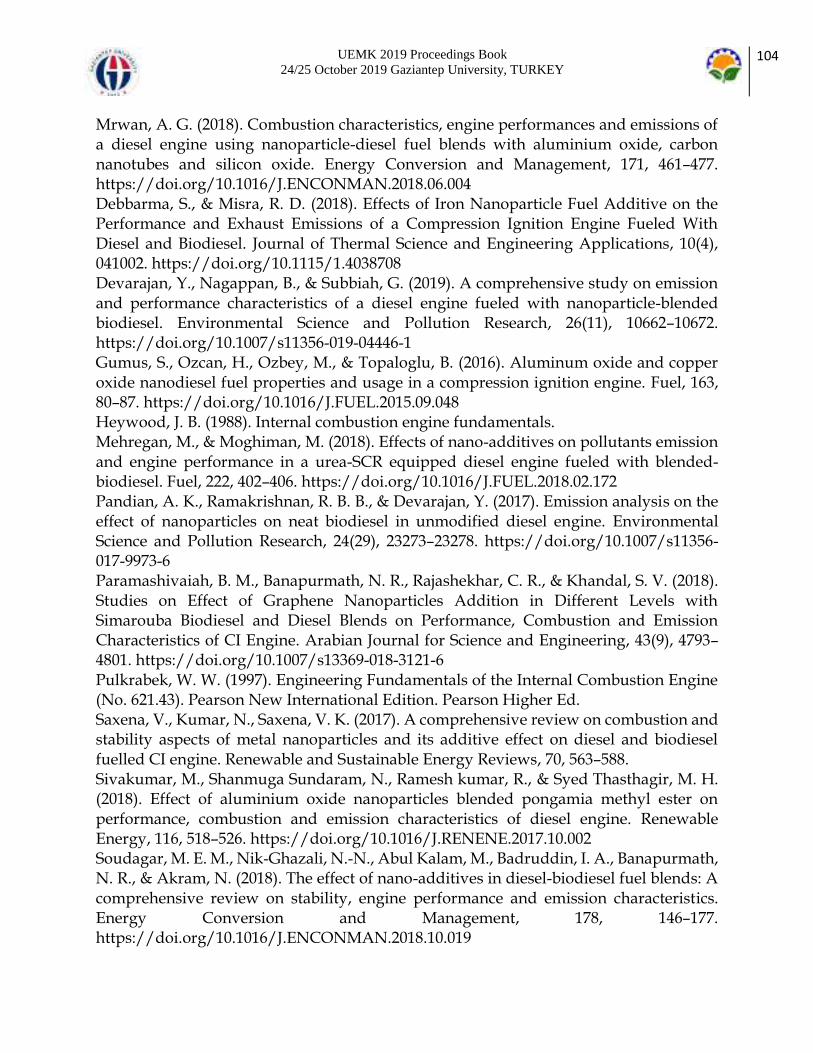
UEMK 2019 Proceedings Book 24/25 October 2019 Gaziantep University, TURKEY
104
Mrwan, A. G. (2018). Combustion characteristics, engine performances and emissions of a diesel engine using nanoparticle-diesel fuel blends with aluminium oxide, carbon nanotubes and silicon oxide. Energy Conversion and Management, 171, 461–477. https://doi.org/10.1016/J.ENCONMAN.2018.06.004 Debbarma, S., & Misra, R. D. (2018). Effects of Iron Nanoparticle Fuel Additive on the Performance and Exhaust Emissions of a Compression Ignition Engine Fueled With Diesel and Biodiesel. Journal of Thermal Science and Engineering Applications, 10(4), 041002. https://doi.org/10.1115/1.4038708 Devarajan, Y., Nagappan, B., & Subbiah, G. (2019). A comprehensive study on emission and performance characteristics of a diesel engine fueled with nanoparticle-blended biodiesel. Environmental Science and Pollution Research, 26(11), 10662–10672. https://doi.org/10.1007/s11356-019-04446-1 Gumus, S., Ozcan, H., Ozbey, M., & Topaloglu, B. (2016). Aluminum oxide and copper oxide nanodiesel fuel properties and usage in a compression ignition engine. Fuel, 163, 80–87. https://doi.org/10.1016/J.FUEL.2015.09.048 Heywood, J. B. (1988). Internal combustion engine fundamentals. Mehregan, M., & Moghiman, M. (2018). Effects of nano-additives on pollutants emission and engine performance in a urea-SCR equipped diesel engine fueled with blended-biodiesel. Fuel, 222, 402–406. https://doi.org/10.1016/J.FUEL.2018.02.172 Pandian, A. K., Ramakrishnan, R. B. B., & Devarajan, Y. (2017). Emission analysis on the effect of nanoparticles on neat biodiesel in unmodified diesel engine. Environmental Science and Pollution Research, 24(29), 23273–23278. https://doi.org/10.1007/s11356-017-9973-6 Paramashivaiah, B. M., Banapurmath, N. R., Rajashekhar, C. R., & Khandal, S. V. (2018). Studies on Effect of Graphene Nanoparticles Addition in Different Levels with Simarouba Biodiesel and Diesel Blends on Performance, Combustion and Emission Characteristics of CI Engine. Arabian Journal for Science and Engineering, 43(9), 4793–4801. https://doi.org/10.1007/s13369-018-3121-6 Pulkrabek, W. W. (1997). Engineering Fundamentals of the Internal Combustion Engine (No. 621.43). Pearson New International Edition. Pearson Higher Ed. Saxena, V., Kumar, N., Saxena, V. K. (2017). A comprehensive review on combustion and stability aspects of metal nanoparticles and its additive effect on diesel and biodiesel fuelled CI engine. Renewable and Sustainable Energy Reviews, 70, 563–588. Sivakumar, M., Shanmuga Sundaram, N., Ramesh kumar, R., & Syed Thasthagir, M. H. (2018). Effect of aluminium oxide nanoparticles blended pongamia methyl ester on performance, combustion and emission characteristics of diesel engine. Renewable Energy, 116, 518–526. https://doi.org/10.1016/J.RENENE.2017.10.002 Soudagar, M. E. M., Nik-Ghazali, N.-N., Abul Kalam, M., Badruddin, I. A., Banapurmath, N. R., & Akram, N. (2018). The effect of nano-additives in diesel-biodiesel fuel blends: A comprehensive review on stability, engine performance and emission characteristics. Energy Conversion and Management, 178, 146–177. https://doi.org/10.1016/J.ENCONMAN.2018.10.019

UEMK 2019 Proceedings Book 24/25 October 2019 Gaziantep University, TURKEY
105
Wu, Q., Xie, X., Wang, Y., & Roskilly, T. (2018). Effect of carbon coated aluminum nanoparticles as additive to biodiesel-diesel blends on performance and emission characteristics of diesel engine. Applied Energy, 221, 597–604. https://doi.org/10.1016/J.APENERGY.2018.03.157.
UEMK 2019 Proceedings Book 24/25 October 2019 Gaziantep University, TURKEY
106
A SURROGATE MODEL FOR AN OLD PROBLEM: LARGE DEFLECTIONS OF CANTILEVERS Hakan ÖZBAŞARAN Eskişehir Osmangazi University, Department of Civil Engineering, Eskişehir/TURKEY [email protected] ABSTRACT: Exceeding of the allowable stress, loss of stability and large deflections are the leading problems in design of beams. In most cases, beams fail due to excessive stress under increasing loads. However, depending on the mechanical properties of the structural material and the cross-section geometry, some beams can make undesired large deflections without exceeding allowable stress limits. The Euler-Bernoulli beam theory, which is a useful simplification to calculate the deflection curves of laterally loaded beams, leads to acceptable results for small deflections. Unfortunately, this theory fails in large deflection analysis due to invalid assumptions. Solution of the large deflection problems mostly involves calculation of integrals and/or dealing with long equations. This paper revisits the large deflection analysis of highly flexible beams and presents a surrogate model to reduce the computational cost of the exhaustive procedures involving large deflection analysis such as optimization with metaheuristics. Key words: beam; cantilever; large deflection; deflection curve; surrogate model INTRODUCTION Since Bernoulli presented the first precise formulation of elastica in 1691 (Levien, 2008), many studies are conducted on the deflection of highly flexible beams. However, it would be appropriate to mention some of the latest studies. Barten (1945) presented the solution for large deflection of the cantilever beam subjected to a concentrated load at its free end. Bisshopp and Drucker (1945) introduced the solution of large deflection problem for a cantilever beam which is subjected to a concentrated load acting at its free end in terms of elliptic integrals. Mattiasson (1980) provided the numerical solutions of large deflection problems for various systems including a cantilever beam subjected to a concentrated load acting at its free end. De Bona and Zelenika (1997) presented an analytical solution for the large deflections of slightly curved cantilever strips. Lee (2002) studied the large deflection of cantilever beams that include material and geometrical non-linearities; a numerical solution is presented by using a fifth order Runge-Kutta method. Belendéz et al. (2002, 2003) conducted numerical and experimental studies on large deflections of cantilevers. Kumar et al. (2004) presented genetic algorithms for large deflection analysis of simply supported and cantilever beams; validating the accuracy of
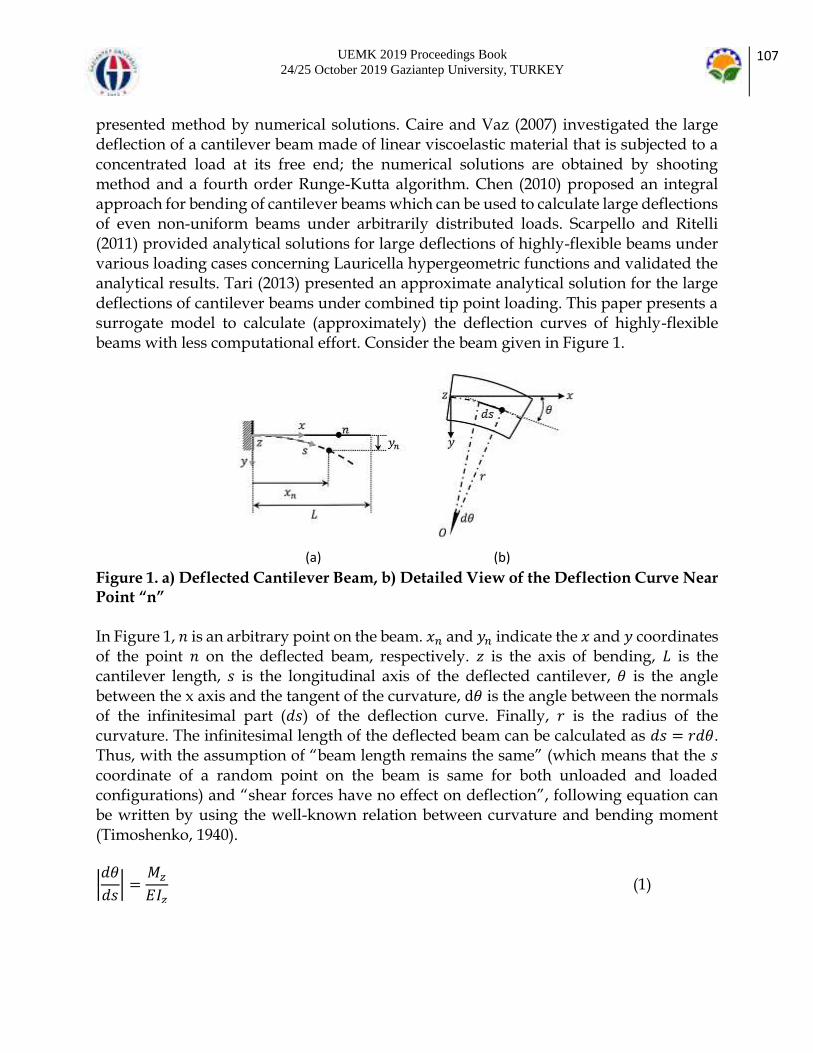
UEMK 2019 Proceedings Book 24/25 October 2019 Gaziantep University, TURKEY
107
presented method by numerical solutions. Caire and Vaz (2007) investigated the large deflection of a cantilever beam made of linear viscoelastic material that is subjected to a concentrated load at its free end; the numerical solutions are obtained by shooting method and a fourth order Runge-Kutta algorithm. Chen (2010) proposed an integral approach for bending of cantilever beams which can be used to calculate large deflections of even non-uniform beams under arbitrarily distributed loads. Scarpello and Ritelli (2011) provided analytical solutions for large deflections of highly-flexible beams under various loading cases concerning Lauricella hypergeometric functions and validated the analytical results. Tari (2013) presented an approximate analytical solution for the large deflections of cantilever beams under combined tip point loading. This paper presents a surrogate model to calculate (approximately) the deflection curves of highly-flexible beams with less computational effort. Consider the beam given in Figure 1.
Figure 1. a) Deflected Cantilever Beam, b) Detailed View of the Deflection Curve Near Point “n” In Figure 1, 𝑛 is an arbitrary point on the beam. 𝑥𝑛 and 𝑦𝑛 indicate the 𝑥 and 𝑦 coordinates of the point 𝑛 on the deflected beam, respectively. 𝑧 is the axis of bending, 𝐿 is the cantilever length, 𝑠 is the longitudinal axis of the deflected cantilever, is the angle between the x axis and the tangent of the curvature, d is the angle between the normals of the infinitesimal part (𝑑𝑠) of the deflection curve. Finally, 𝑟 is the radius of the curvature. The infinitesimal length of the deflected beam can be calculated as 𝑑𝑠 = 𝑟𝑑 . Thus, with the assumption of “beam length remains the same” (which means that the 𝑠 coordinate of a random point on the beam is same for both unloaded and loaded configurations) and “shear forces have no effect on deflection”, following equation can be written by using the well-known relation between curvature and bending moment (Timoshenko, 1940).
|𝑑
𝑑𝑠| =
𝑀𝑧
𝐸𝐼𝑧 (1)
(a) (b)
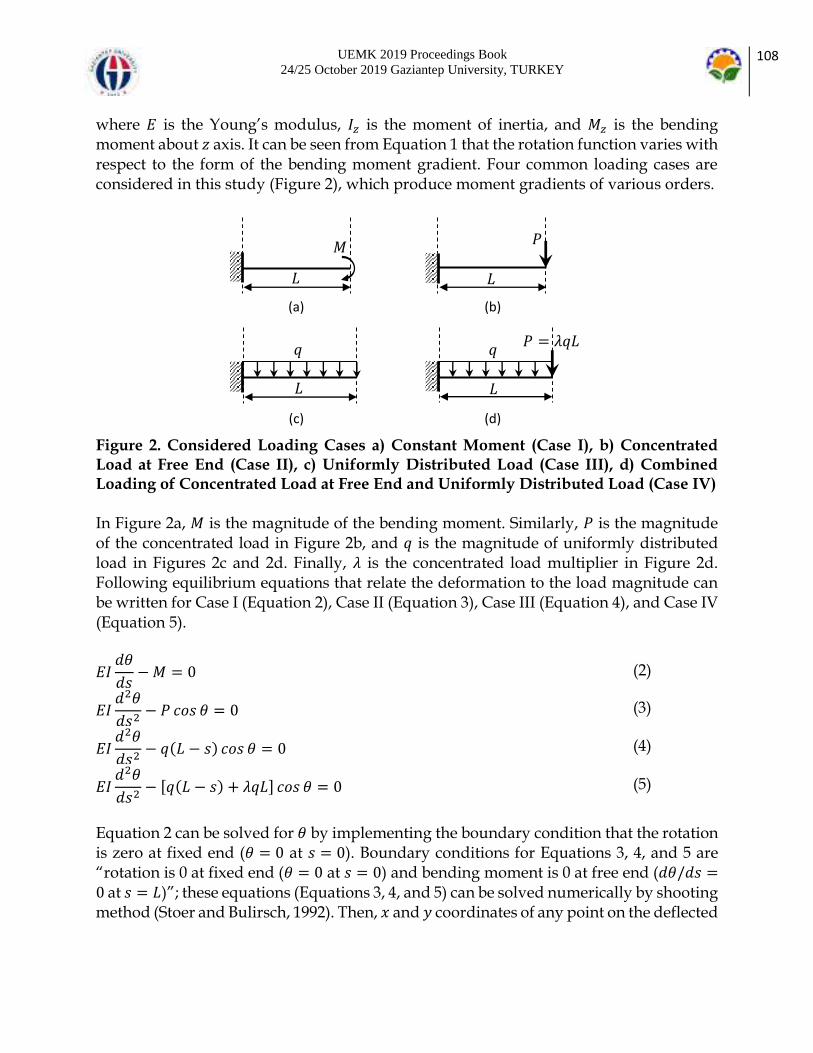
UEMK 2019 Proceedings Book 24/25 October 2019 Gaziantep University, TURKEY
108
where 𝐸 is the Young’s modulus, 𝐼𝑧 is the moment of inertia, and 𝑀𝑧 is the bending moment about 𝑧 axis. It can be seen from Equation 1 that the rotation function varies with respect to the form of the bending moment gradient. Four common loading cases are considered in this study (Figure 2), which produce moment gradients of various orders.
Figure 2. Considered Loading Cases a) Constant Moment (Case I), b) Concentrated Load at Free End (Case II), c) Uniformly Distributed Load (Case III), d) Combined Loading of Concentrated Load at Free End and Uniformly Distributed Load (Case IV) In Figure 2a, 𝑀 is the magnitude of the bending moment. Similarly, 𝑃 is the magnitude of the concentrated load in Figure 2b, and 𝑞 is the magnitude of uniformly distributed load in Figures 2c and 2d. Finally, 𝜆 is the concentrated load multiplier in Figure 2d. Following equilibrium equations that relate the deformation to the load magnitude can be written for Case I (Equation 2), Case II (Equation 3), Case III (Equation 4), and Case IV (Equation 5).
𝐸𝐼𝑑
𝑑𝑠−𝑀 = 0 (2)
𝐸𝐼𝑑2
𝑑𝑠2− 𝑃 𝑐𝑜𝑠 = 0 (3)
𝐸𝐼𝑑2
𝑑𝑠2− 𝑞(𝐿 − 𝑠) 𝑐𝑜𝑠 = 0 (4)
𝐸𝐼𝑑2
𝑑𝑠2− [𝑞(𝐿 − 𝑠) + 𝜆𝑞𝐿] 𝑐𝑜𝑠 = 0 (5)
Equation 2 can be solved for by implementing the boundary condition that the rotation is zero at fixed end ( = 0 at 𝑠 = 0). Boundary conditions for Equations 3, 4, and 5 are “rotation is 0 at fixed end ( = 0 at 𝑠 = 0) and bending moment is 0 at free end (𝑑 /𝑑𝑠 =0 at 𝑠 = 𝐿)”; these equations (Equations 3, 4, and 5) can be solved numerically by shooting method (Stoer and Bulirsch, 1992). Then, 𝑥 and 𝑦 coordinates of any point on the deflected
𝑞
𝐿
𝑃 = 𝜆𝑞𝐿
𝑃
𝐿
𝑞
𝐿
(a) (b)
𝑀
𝐿
(d) (c)

UEMK 2019 Proceedings Book 24/25 October 2019 Gaziantep University, TURKEY
109
beam can be calculated by Equations 6 and 7, respectively with a numerical integration method such as Simpsons’ rule (Adams, 1999).
𝑥(𝑠) = ∫ 𝑐𝑜𝑠 𝑑𝑠𝑠
0
(6)
𝑦(𝑠) = ∫ 𝑠𝑖𝑛 𝑑𝑠𝑠
0
(7)
THE SURROGATE MODEL The form of the deflection curve depends on the load magnitude, cantilever length, Young’s modulus, and the moment of inertia. The dimensionless coefficients for each considered loading case are developed to be used in the surrogate model (see Table 1). It can be said that the deflection curves of two beams having the same 𝑐 values under the same loading case is identical. Table 1. Dimensionless 𝑐 Coefficients
Loading Case 𝒄
Case I 2𝑀𝐿
𝐸𝐼𝑧
Case II 𝑃𝐿2
2𝐸𝐼𝑧
Case III 2𝑞𝐿3
3𝐸𝐼𝑧
Case IV 2𝑞𝐿3(1 + 2𝜆)
3𝐸𝐼𝑧
First, the equilibrium equations for considered loading cases (Equations 2, 3, 4, and 5) are solved numerically for various 𝑐 values and interpolating rotation functions are constructed. Then, 𝑠/𝐿 − 𝑥/𝐿 and 𝑠/𝐿 − 𝑦/𝐿 curves for each loading case are obtained with respect to 𝑐 by substituting corresponding functions into Equations 6 and 7, respectively. It is found that for any value of 𝑐, position of a point on the deflection curve of a cantilever beam can be approximated by the bivariate polynomials given in Equations 8 and 9.
𝑥(𝑐, 𝑠) = 𝐿∑∑𝐾𝑖𝑗𝑥𝑐𝑖−1 (
𝑠
𝐿)𝑗−1
𝑛
𝑗=1
𝑛
𝑖=1
(8)
𝑦(𝑐, 𝑠) = 𝐿∑∑𝐾𝑖𝑗𝑦𝑐𝑖−1 (
𝑠
𝐿)𝑗−1
𝑛
𝑗=1
𝑛
𝑖=1
(9)

UEMK 2019 Proceedings Book 24/25 October 2019 Gaziantep University, TURKEY
110
In Equations 8 and 9, 𝐾𝑖𝑗𝑥 and 𝐾𝑖𝑗
𝑦 are the elements of the coefficient matrices 𝐾𝑥 and 𝐾𝑦.
Note that taking 𝑛 = 5 is adequate to obtain satisfactory approximations. TUNING
The 𝐾𝑖𝑗𝑥 and 𝐾𝑖𝑗
𝑦 matrices are calculated for the values of 𝑐 between 0.5 and 5.0; the smallest
considered 𝑐 value is determined by comparing the difference of the obtained deflection curves with the presented study and the Euler-Bernoulli beam theory. The deflection curve of the cantilever beams are obtained with respect to 𝑐 with 0.05 intervals by the numerical procedure explained in the introduction part. Each deflection curve is obtained precisely by calculating 𝑥 and 𝑦 coordinates of 100 nodes. Then, Equations 8 and 9 are fitted to three-dimensional 𝑐 − 𝑠/𝐿 − 𝑥/𝐿 and 𝑐 − 𝑠/𝐿 − 𝑦/𝐿 data with the Jaya Algorithm (Venkata Rao, 2016). The relation between 𝑐 and the deflection curve for Case I is given in Figure 3.
Figure 3. The “𝒄 – Deflection Curve” Relation for Case I a) 𝒄 − 𝒔/𝑳 − 𝒙/𝑳, b) 𝒄 − 𝒔/𝑳 − 𝒚/𝑳 In Figure 3a, the relative 𝑥 coordinates (𝑥/𝐿) are nearly equal to the relative 𝑠 coordinates (𝑠/𝐿) for small smaller values of 𝑐. The 𝑥/𝐿 ratio significantly decreases by increasing 𝑐 (as expected). The 𝐾𝑥 and 𝐾𝑦 matrices to determine the surfaces presented in Figures 3a and 3b are given in Equations 10 and 11, respectively.
𝐾𝑥 =
[ −0.04415 10001 −13.123 31.066 −24.5810.24174 −10.166 71.629 −169.23 133.56−0.31872 13.375 −94.038 −195.06 −174.290.15561 −6.5113 45.651 −107.20 83.924−0.01574 0.61534 −3.9213 7.4232 −1.6580]
10−5 (10)
(a)
𝑐
𝑠
𝐿
𝑥
𝐿
(b)
𝑠
𝐿
𝑦
𝐿
𝑐
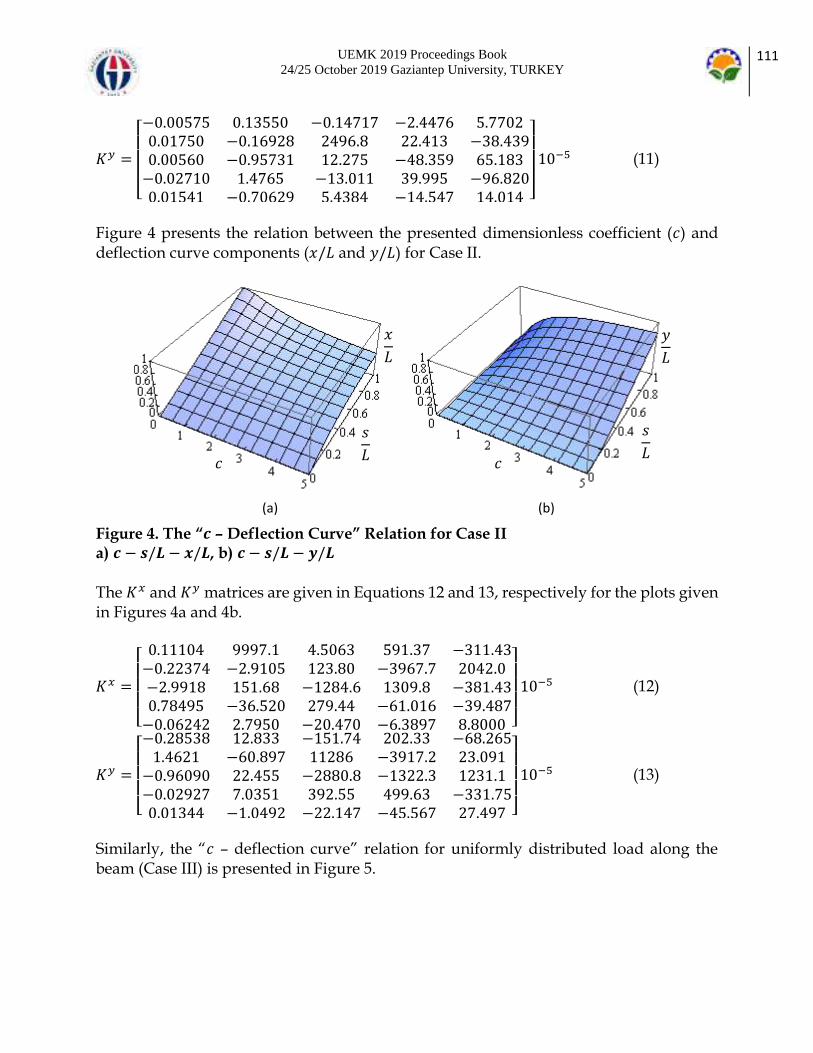
UEMK 2019 Proceedings Book 24/25 October 2019 Gaziantep University, TURKEY
111
𝐾𝑦 =
[
−0.00575 0.13550 −0.14717 −2.4476 5.77020.01750 −0.16928 2496.8 22.413 −38.4390.00560 −0.95731 12.275 −48.359 65.183−0.02710 1.4765 −13.011 39.995 −96.8200.01541 −0.70629 5.4384 −14.547 14.014 ]
10−5 (11)
Figure 4 presents the relation between the presented dimensionless coefficient (𝑐) and deflection curve components (𝑥/𝐿 and 𝑦/𝐿) for Case II.
Figure 4. The “𝒄 – Deflection Curve” Relation for Case II a) 𝒄 − 𝒔/𝑳 − 𝒙/𝑳, b) 𝒄 − 𝒔/𝑳 − 𝒚/𝑳 The 𝐾𝑥 and 𝐾𝑦 matrices are given in Equations 12 and 13, respectively for the plots given in Figures 4a and 4b.
𝐾𝑥 =
[ 0.11104 9997.1 4.5063 591.37 −311.43−0.22374 −2.9105 123.80 −3967.7 2042.0−2.9918 151.68 −1284.6 1309.8 −381.430.78495 −36.520 279.44 −61.016 −39.487−0.06242 2.7950 −20.470 −6.3897 8.8000 ]
10−5 (12)
𝐾𝑦 =
[ −0.28538 12.833 −151.74 202.33 −68.2651.4621 −60.897 11286 −3917.2 23.091−0.96090 22.455 −2880.8 −1322.3 1231.1−0.02927 7.0351 392.55 499.63 −331.750.01344 −1.0492 −22.147 −45.567 27.497 ]
10−5 (13)
Similarly, the “𝑐 – deflection curve” relation for uniformly distributed load along the beam (Case III) is presented in Figure 5.
𝑐
𝑠
𝐿
𝑥
𝐿
(a)
𝑦
𝐿
𝑠
𝐿
𝑐
(b)

UEMK 2019 Proceedings Book 24/25 October 2019 Gaziantep University, TURKEY
112
Figure 5. The “𝒄 – Deflection Curve” Relation for Case III a) 𝒄 − 𝒔/𝑳 − 𝒙/𝑳, b) 𝒄 − 𝒔/𝑳 − 𝒚/𝑳 The 𝐾𝑥 and 𝐾𝑦 matrices given in Equations 14 and 15 are for the surface plots presented in Figures 5a and 5b, respectively.
𝐾𝑥 =
[ −0.01965 10000 −6.3753 −3.5438 3.63870.12426 −5.4326 38.879 29.007 −26.490−0.86194 41.170 −336.19 −111.48 145.670.12610 −5.2592 35.667 47.139 −36.229−0.00574 0.21145 −1.1818 −3.6368 2.4140 ]
10−5 (14)
𝐾𝑦 =
[ −0.01444 0.42982 −9.6231 −7.8642 6.78510.07472 −2.1664 3799.4 −2455.7 587.92−0.08538 2.3471 −55.397 −58.508 46.695−0.05947 2.6528 −54.706 20.043 0.994800.00628 −0.25375 5.0238 −0.58629 −0.82585]
10−5 (15)
The form of the deflection curve varies due to the value of the concentrated load multiplier (𝜆) for Case IV. Therefore, different 𝐾𝑥 and 𝐾𝑦 matrices will be obtained for each 𝜆 value to build an accurate surrogate model. In this study, the results are presented for 𝜆 = 0.5 (Figure 6).
𝑐
𝑠
𝐿
𝑥
𝐿
(a)
𝑐
𝑠
𝐿
𝑦
𝐿
(b)

UEMK 2019 Proceedings Book 24/25 October 2019 Gaziantep University, TURKEY
113
Figure 6. The “𝒄 – Deflection Curve” Relation for Case IV a) 𝒄 − 𝒔/𝑳 − 𝒙/𝑳, b) 𝒄 − 𝒔/𝑳 − 𝒚/𝑳 Finally, the 𝐾𝑥 and 𝐾𝑦 matrices are given in Equations 16 and 17 to obtain the surfaces given in Figures 6a and 6b, respectively.
K𝑥 =
[ −0.01594 10000 −5.3594 −0.39736 1.60160.09815 −4.3068 30.941 31.576 −24.937−0.68692 31.774 −250.45 −424.74 285.710.09057 −3.5500 22.293 122.53 −71.364−0.00370 0.11617 −0.47215 −9.3590 5.1576 ]
10−5 (16)
𝐾𝑦 =
[ −0.00091 −0.24091 −14.882 −24.174 15.674−0.00214 1.6845 3829.8 −1734.0 222.610.01707 −2.8634 −97.048 −195.01 121.45−0.05280 2.3946 −49.975 26.717 −3.78370.00461 −0.18193 5.0204 −0.20548 −0.93486]
10−5 (17)
VALIDATION In this part, the results obtained by the presented model and a finite element analysis (FEA) software are compared. The ABAQUS software is utilized for finite element analysis; one dimensional cantilever beam models are generated and loads are applied to the beams that satisfy certain 𝑐 values. The 𝑥 and 𝑦 coordinates of the deflection curve of each numerical example are noted. The results are presented in the plot given in Figure 7 for 𝑐 = 1.0.
𝑐
𝑠
𝐿
𝑥
𝐿
(a)
𝑐
𝑠
𝐿
𝑦
𝐿
(b)

UEMK 2019 Proceedings Book 24/25 October 2019 Gaziantep University, TURKEY
114
Figure 7. The deflection curves for 𝒄 = 𝟏. 𝟎 In Figure 7, the ticks indicate the values obtained by ABAQUS software. The continuous lines show the deflection curves obtained by the surrogate model presented in this study. The deflection curves for 𝑐 = 2.0 is given in Figure 8.
Figure 8. The deflection curves for 𝒄 = 𝟐. 𝟎 Finally, the deflection curves for 𝑐 = 4.0 are as presented in Figure 9.
0,0
0,1
0,2
0,3
0,4
0,5
0,6
0,0 0,2 0,4 0,6 0,8 1,0
y/L
x/L
Case I
Case II
Case III
Case IV (λ=0.5)
0,0
0,2
0,4
0,6
0,8
0,0 0,2 0,4 0,6 0,8 1,0
y/L
x/L
Case I
Case II
Case III
Case IV (λ=0.5)
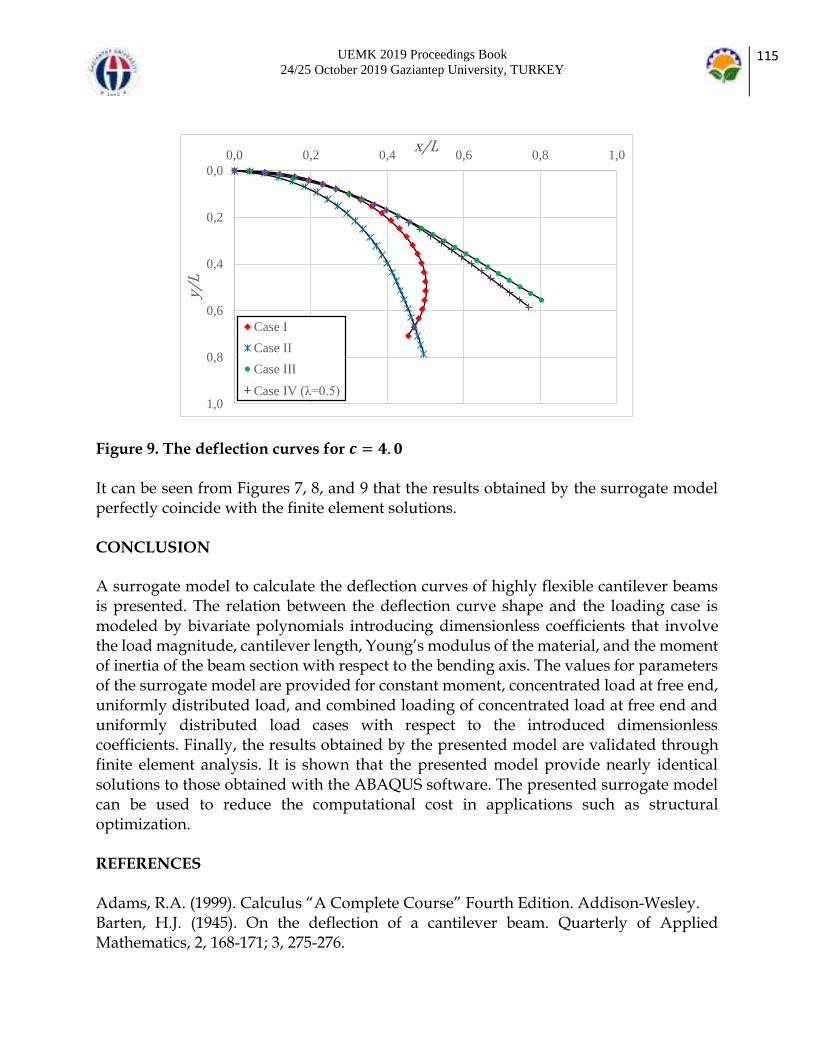
UEMK 2019 Proceedings Book 24/25 October 2019 Gaziantep University, TURKEY
115
Figure 9. The deflection curves for 𝒄 = 𝟒. 𝟎 It can be seen from Figures 7, 8, and 9 that the results obtained by the surrogate model perfectly coincide with the finite element solutions. CONCLUSION A surrogate model to calculate the deflection curves of highly flexible cantilever beams is presented. The relation between the deflection curve shape and the loading case is modeled by bivariate polynomials introducing dimensionless coefficients that involve the load magnitude, cantilever length, Young’s modulus of the material, and the moment of inertia of the beam section with respect to the bending axis. The values for parameters of the surrogate model are provided for constant moment, concentrated load at free end, uniformly distributed load, and combined loading of concentrated load at free end and uniformly distributed load cases with respect to the introduced dimensionless coefficients. Finally, the results obtained by the presented model are validated through finite element analysis. It is shown that the presented model provide nearly identical solutions to those obtained with the ABAQUS software. The presented surrogate model can be used to reduce the computational cost in applications such as structural optimization. REFERENCES Adams, R.A. (1999). Calculus “A Complete Course” Fourth Edition. Addison-Wesley. Barten, H.J. (1945). On the deflection of a cantilever beam. Quarterly of Applied Mathematics, 2, 168-171; 3, 275-276.
0,0
0,2
0,4
0,6
0,8
1,0
0,0 0,2 0,4 0,6 0,8 1,0
y/L
x/L
Case I
Case II
Case III
Case IV (λ=0.5)

UEMK 2019 Proceedings Book 24/25 October 2019 Gaziantep University, TURKEY
116
Belendéz, T., Neipp, C., Belendéz, A. (2002). Large and small deflections of a cantilever beam. European Journal of Physics, 23(3), 371-379. Belendéz, T., Neipp, C., Belendéz, A. (2003). Numerical and experimental analysis of a cantilever beam: a laboratory project to introduce geometric nonlinearity in mechanics of materials. International Journal of Engineering Education, 19(6), 885-892. Bisshopp, K.E., & Drucker, D.C. (1945). Large deflections of cantilever beams. Quarterly of Applied Mathematics, 3, 272-275. Caire, M., & Vaz, M.A. (2007). Large deflections of a linear viscoelastic cantilever beam subjected to a concentrated end load. Proceedings of the 19th International Congress of Mechanical Engineering, Brazil. Chen, L. (2010). An integral approach for large deflection cantilever beams. International Journal of Non-Linear Mechanics, 45, 301-305. De Bona, F., & Zelenika, S. (1997). A generalized elastica-type approach to the analysis of large displacements of spring strips. Proceedings of the Institution of Mechanical Engineers (Part C), 211, 509-517. Kumar, R., Ramachandra, L.S., Roy, D. (2004). Techniques based on genetic algorithms for large deflection analysis of beams. Sadhana, 29(6), 589-604. Lee, K. (2002). Large deflections of cantilever beams of non-linear elastic material under a combined loading. International Journal of Non-Linear Mechanics, 37, 439-443. Levien, R. (2008). The elastica: a mathematical history. Technical Report No. UCB/EECS 2008-103, EECS Department, University of California, Berkeley. Mattiasson, K. (1980). Numerical results from large deflection beam and frame problems analysed by means of elliptic integrals. International Journal for Numerical Methods in Engineering, 17(1), 145-153. Scarpello, G.M., & Ritelli, D. (2011). Exact solutions of nonlinear equation of rod deflections involving the Lauricella hypergeometric functions. International Journal of Mathematics and Mathematical Sciences, Article ID: 838924. Stoer, J. & Bulirsch, R. (1992). Introduction to Numerical Analysis. Second ed., New York: Springer-Verlag. Tari, H. (2013). On the parametric large deflection study of Euler–Bernoulli cantilever beams subjected to combined tip point loading. International Journal of Non-Linear Mechanics, 49, 90-99. Timoshenko, S. (1940). Strength of Materials: Part I. Second ed., D. Van Nostrand Company Inc. Venkata Rao, R. (2016). Jaya: A simple and new optimization algorithm for solving constrained and unconstrained optimization problems. International Journal of Industrial Engineering Computations, 7, 19-34.
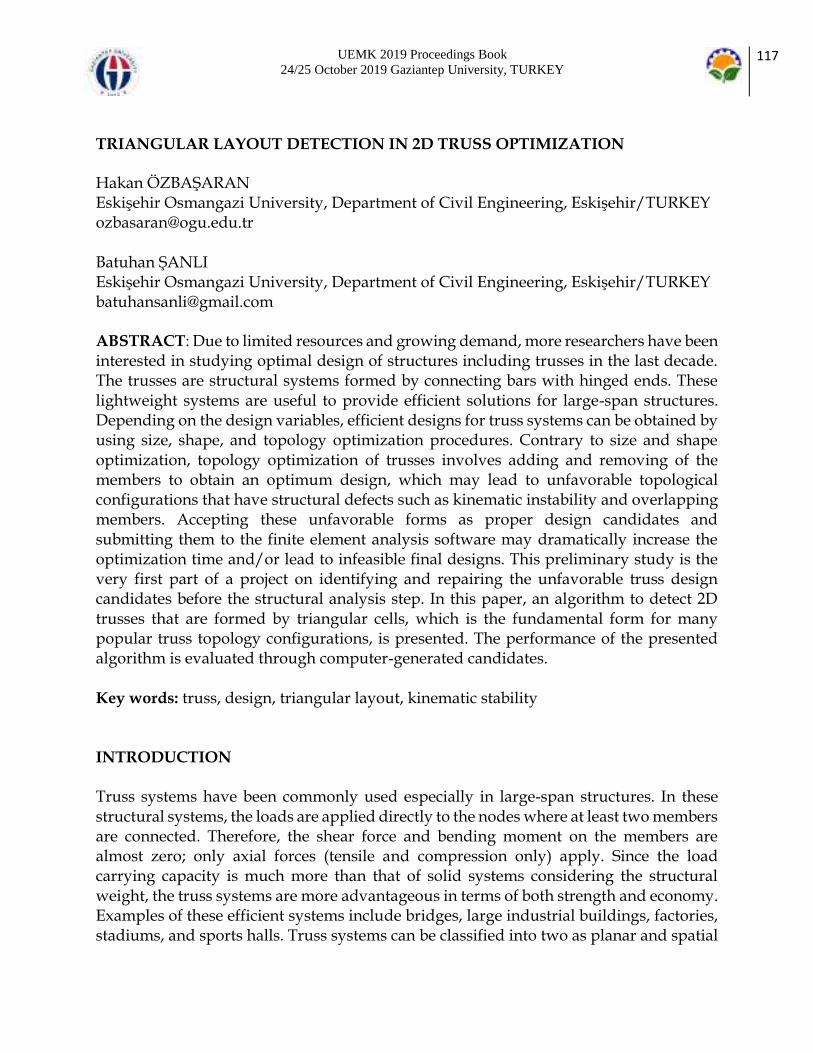
UEMK 2019 Proceedings Book 24/25 October 2019 Gaziantep University, TURKEY
117
TRIANGULAR LAYOUT DETECTION IN 2D TRUSS OPTIMIZATION Hakan ÖZBAŞARAN Eskişehir Osmangazi University, Department of Civil Engineering, Eskişehir/TURKEY [email protected] Batuhan ŞANLI Eskişehir Osmangazi University, Department of Civil Engineering, Eskişehir/TURKEY [email protected] ABSTRACT: Due to limited resources and growing demand, more researchers have been interested in studying optimal design of structures including trusses in the last decade. The trusses are structural systems formed by connecting bars with hinged ends. These lightweight systems are useful to provide efficient solutions for large-span structures. Depending on the design variables, efficient designs for truss systems can be obtained by using size, shape, and topology optimization procedures. Contrary to size and shape optimization, topology optimization of trusses involves adding and removing of the members to obtain an optimum design, which may lead to unfavorable topological configurations that have structural defects such as kinematic instability and overlapping members. Accepting these unfavorable forms as proper design candidates and submitting them to the finite element analysis software may dramatically increase the optimization time and/or lead to infeasible final designs. This preliminary study is the very first part of a project on identifying and repairing the unfavorable truss design candidates before the structural analysis step. In this paper, an algorithm to detect 2D trusses that are formed by triangular cells, which is the fundamental form for many popular truss topology configurations, is presented. The performance of the presented algorithm is evaluated through computer-generated candidates. Key words: truss, design, triangular layout, kinematic stability INTRODUCTION Truss systems have been commonly used especially in large-span structures. In these structural systems, the loads are applied directly to the nodes where at least two members are connected. Therefore, the shear force and bending moment on the members are almost zero; only axial forces (tensile and compression only) apply. Since the load carrying capacity is much more than that of solid systems considering the structural weight, the truss systems are more advantageous in terms of both strength and economy. Examples of these efficient systems include bridges, large industrial buildings, factories, stadiums, and sports halls. Truss systems can be classified into two as planar and spatial

UEMK 2019 Proceedings Book 24/25 October 2019 Gaziantep University, TURKEY
118
trusses. The planar truss systems, which is the main concern of the study, is a two-dimensional lattice system with co-planar members. The simplest internally stable planar truss is a triangular cell, which can be constructed by connecting three straight members to each other from their ends to form a triangle. The optimal design of trusses can be carried out through three different procedures as size, shape, and topology optimization. The size optimization process searches for the minimum weight design by altering the sections of the members. The most favorable node positions are investigated in the shape optimization process. Finally, the truss topology optimization is to explore the design space for the best member count and connectivity configuration for the given loads and constraints. The constraints may be stress, deflection, stability, etc. depending on the application. A considerable number of studies have been conducted on topology optimization of trusses and detection of unfavorable topological forms. Cazacu and Grama (2014) have proposed an algorithm for topology optimization that works together with the Finite Element Method. In their tests using MATLAB, they mentioned the importance of the penalty function to be used in the genetic algorithm to solve the problem. Cui et al. (2018) proposed an approach to determine the intersecting and overlapping bars; they have also provided the mathematical definition of intersections and overlaps. Recently, Shakya et al. (2018) developed an algorithm that removes kinematically unstable and useless zero-stress bars from the system. Bekdaş et al. (2015) formulated a structural optimization approach based on the Flower Pollination Algorithm. Assimi et al. (2017) presented a genetic algorithm approach to the simultaneous size and topology optimization of trusses. They aimed to achieve minimum weight by adhering to the maximum permissible stress and deflections. In earlier period, Zhou (1996) wrote an article on stress and local buckling constraints and optimization of truss system topology. However, he pointed out that the solution made in this way may behave unstable and that the solution may be different from the real optimal solution. In addition to Zhou's study, Rozvany (1996) added system stability constraints to the formulation to prevent the seemingly optimal but unstable solutions. However, it is shown in his examples that even these modified formulations can lead to a non-optimal solution. Recently, Larsen et al. (2018) proposed a method for obtaining a near-optimal frame structure based on the solution of a topology optimization model based on homogenization. The Michell (1904) method, which was developed by considering the least weight truss problem, leaded to the solutions close to the optimal solution with a relatively low operational cost. There are popular predefined topological configurations for planar trusses (see Figure 1) that are commonly used to build structural systems for roofs and bridges; most of these topological forms can be formed by joining triangular cells. In this study, the planar trusses that can be formed by connecting triangular cells are called as “trusses that have triangular layout”. All trusses given in Figure 1 except the “Fink” have triangular layout

UEMK 2019 Proceedings Book 24/25 October 2019 Gaziantep University, TURKEY
119
(assuming that the top cord of the “Bowstring” is constructed by straight bars). Note that the “Fink” is constructed by connecting two triangular layout trusses sharing a node with a bar.
Figure 1. Common Planar Trusses (Karagöz et al., 2015) This study presents an algorithm to detect truss systems with triangular layout. The presented algorithm may be used in topology optimization applications to force the final design to have a triangular layout, which is mostly preferred in engineering practice for the construction ease. In addition, this algorithm naturally checks the kinematic stability of the candidates before submitting it to the structural analysis (saving a significant amount of computational effort) since the trusses with triangular layout are internally stable. The following part summarizes the kinematic stability of planar trusses. KINEMATIC STABILITY OF PLANAR TRUSSES Kinematics is the branch of physics that examines the movement of bodies, regardless of the forces that cause or result from these movements. The members of a structural system should be assembled to construct a kinematically stable structure. The first condition is that the system meets the stiffness condition. The number of the unknowns in a truss system is the sum of the number of the bars (c) and the number of the support reactions (r). Since all of the members of the two-dimensional trusses are straight bars on the same plane, the forces acting on each joint is in the same plane and intersect with each other. For this reason, the rotation and the torque balance at the joints is provided. Only the equilibrium equations ∑Fx = 0 and ∑Fy = 0 are required to be satisfied. On the other hand, the total number of the equations is 2d, where d is the number of the nodes in the truss system. Thus, by comparing the number of unknowns (c + r) with the total number of
HOWE PRATT
BELGIAN FINK SCISSORS
BOWSTRING VAULTED PARALLEL
FLAT MANSARD SLOPING FLAT

UEMK 2019 Proceedings Book 24/25 October 2019 Gaziantep University, TURKEY
120
equations, it can be found whether the system has enough bars and support reactions to build a stable form as a preliminary test as follows: c + r ≥ 2d (1) If Equation 1 is not satisfied, it can be said that the system is certainly unstable (the system does not have enough bars to construct a load bearing structure). However, a truss system may be unstable even though it passes the above mentioned test (Figure 2); Therefore, Equation 1 is a necessary but not sufficient condition for kinematic stability of planar trusses. In such cases, it is possible to decide whether the system is stable by observation or force analysis.
Figure 2. Two Planar Trusses Having Same Number of Nodes, Bars, and Support Reactions a) Stable, b) Unstable It should be reminded that constructing the global elastic stiffness matrix of a truss and conducting a positive definiteness test is an exact but computationally expensive method to determine if the system is kinematically stable or not. As told above, it can be said that a truss system is internally stable if it can be formed by joining triangular cells; however, this does not mean that a truss system candidate is certainly unstable if it has a non-triangular layout. Note that the bars 1-2 and 1-4 are not members of a triangular cell in the simple truss given in Figure 3.
Figure 3. A Kinematically Stable Planar Truss with a Non-Triangular Layout THE ALGORITHM
(a) (b)
1 2
4

UEMK 2019 Proceedings Book 24/25 October 2019 Gaziantep University, TURKEY
121
An efficient algorithm should be robust and computationally inexpensive. As the number of operations increases the required processing power and time increase as well. The authors do not claim that a more efficient algorithm than the presented one in this study cannot be found to accomplish the mentioned task. However, it can be said that it does its job by using an acceptable amount of computational power considering the applications in the field. The steps of the presented algorithm is as follows: 1. Node and bar lists are generated. The algorithm does not use the coordinates of the nodes. This sometimes cause detection of a triangular cell of which nodes lie on the same line. It is well-known that this condition is unfavorable since constructing trusses with overlapping bars is not possible in real-world. However, theoretically, this unfavorable form is internally stable. The nodes list consist of node numbers as n = (1, 2, …) and the bars list stores the start and the end nodes of the bars as b = ((1,2), (1,4), (2,3), (2,4), …). An additional empty list is generated for the bars that are components of the triangular cells as bt = (). 2. The first element of the nodes list is selected. In fact, it is not necessary to start from the first element of the nodes list; a random node can be selected. 3. The bars in the b and bt lists connected to the selected node are determined. Consider that the node “1” is selected. The bars in the “b” list that are connected to node 1 are determined and added to another list called “bn” as bn = ((1,2), (1,4), …). 4. The other node (other than the selected one) of the bars are extracted and listed. This list would be in the form on = (2, 4, …) for selected node 1. 5. The bars in the lists b and bt that connect the nodes in the on list are checked. The bar (2,4) in the b list connects the nodes 2 and 4 of the on list. 6. The bars detected in the 5th step and the relevant bars are appended to the bt list (by avoiding duplication) and removed from b list (if it is there). For example, consider that the bar (2,4) is detected in the 5th step. The bars (1,2), (1,4), and (2,4) should be added to the bt list and removed from the b list. This means that the mentioned bars are the components of at least one triangular cell. 7. The algorithm proceeds by selecting the next node in the nodes list (n) and returning to step 3. If no nodes are left. Then proceed to the next step. 8. The design candidate is categorized. If no bars are left in the b list (all of the bars are moved to the bt list) this means that all bars in the system are the components of at least one triangular cell. Therefore, it can be said that the considered system has a triangular layout. If there are bars left in the b list, the considered system has a non-triangular layout. The bars left in the b list may be removed (if possible) or connected to a random triangular cell as a fast repairing procedure.
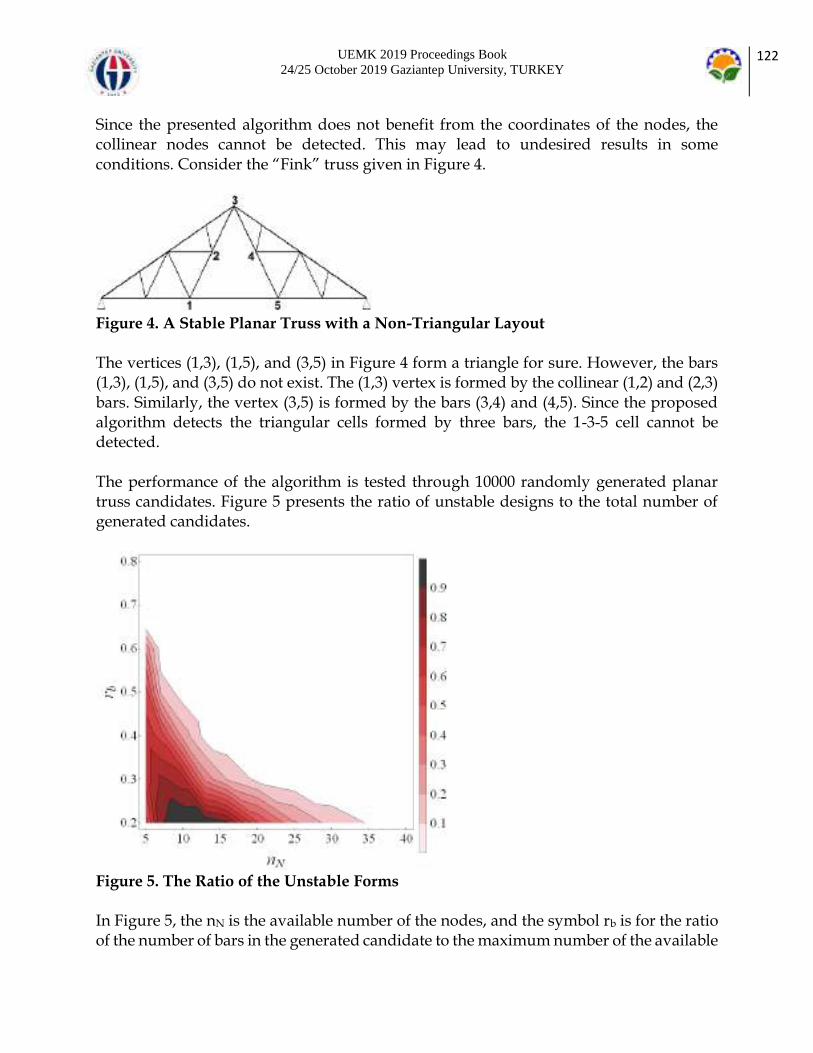
UEMK 2019 Proceedings Book 24/25 October 2019 Gaziantep University, TURKEY
122
Since the presented algorithm does not benefit from the coordinates of the nodes, the collinear nodes cannot be detected. This may lead to undesired results in some conditions. Consider the “Fink” truss given in Figure 4.
Figure 4. A Stable Planar Truss with a Non-Triangular Layout The vertices (1,3), (1,5), and (3,5) in Figure 4 form a triangle for sure. However, the bars (1,3), (1,5), and (3,5) do not exist. The (1,3) vertex is formed by the collinear (1,2) and (2,3) bars. Similarly, the vertex (3,5) is formed by the bars (3,4) and (4,5). Since the proposed algorithm detects the triangular cells formed by three bars, the 1-3-5 cell cannot be detected. The performance of the algorithm is tested through 10000 randomly generated planar truss candidates. Figure 5 presents the ratio of unstable designs to the total number of generated candidates.
Figure 5. The Ratio of the Unstable Forms In Figure 5, the nN is the available number of the nodes, and the symbol rb is for the ratio of the number of bars in the generated candidate to the maximum number of the available
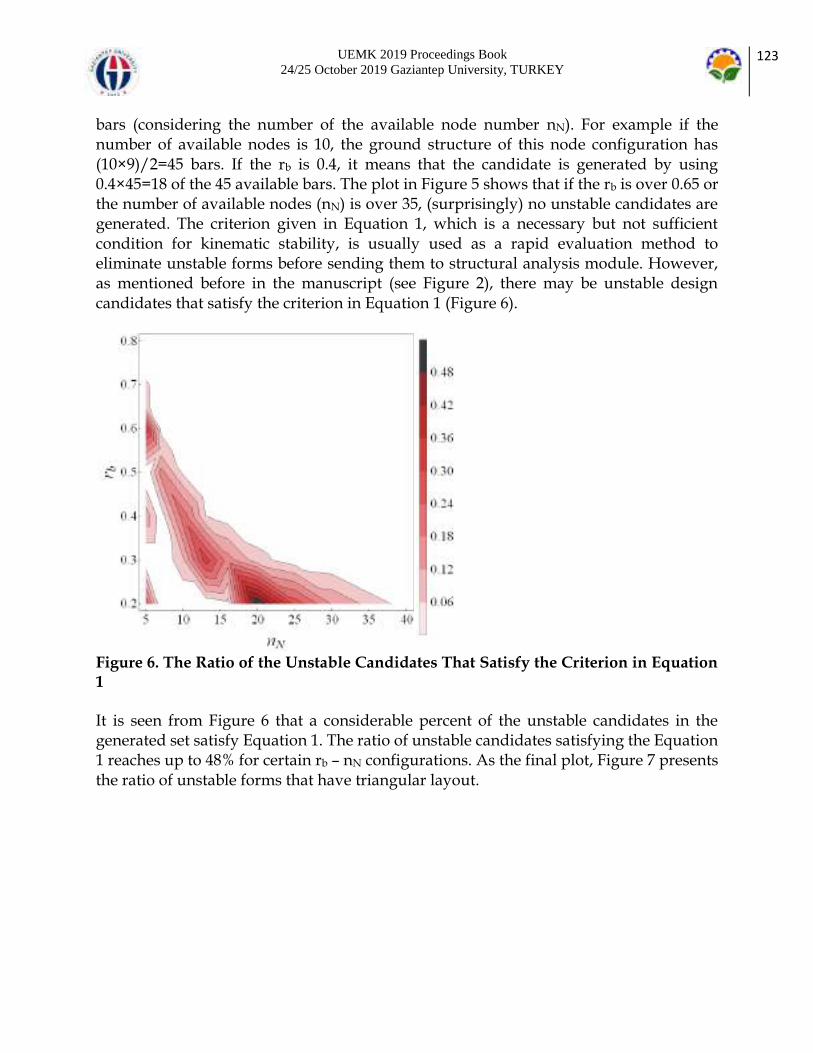
UEMK 2019 Proceedings Book 24/25 October 2019 Gaziantep University, TURKEY
123
bars (considering the number of the available node number nN). For example if the number of available nodes is 10, the ground structure of this node configuration has (10×9)/2=45 bars. If the rb is 0.4, it means that the candidate is generated by using 0.4×45=18 of the 45 available bars. The plot in Figure 5 shows that if the rb is over 0.65 or the number of available nodes (nN) is over 35, (surprisingly) no unstable candidates are generated. The criterion given in Equation 1, which is a necessary but not sufficient condition for kinematic stability, is usually used as a rapid evaluation method to eliminate unstable forms before sending them to structural analysis module. However, as mentioned before in the manuscript (see Figure 2), there may be unstable design candidates that satisfy the criterion in Equation 1 (Figure 6).
Figure 6. The Ratio of the Unstable Candidates That Satisfy the Criterion in Equation 1 It is seen from Figure 6 that a considerable percent of the unstable candidates in the generated set satisfy Equation 1. The ratio of unstable candidates satisfying the Equation 1 reaches up to 48% for certain rb – nN configurations. As the final plot, Figure 7 presents the ratio of unstable forms that have triangular layout.
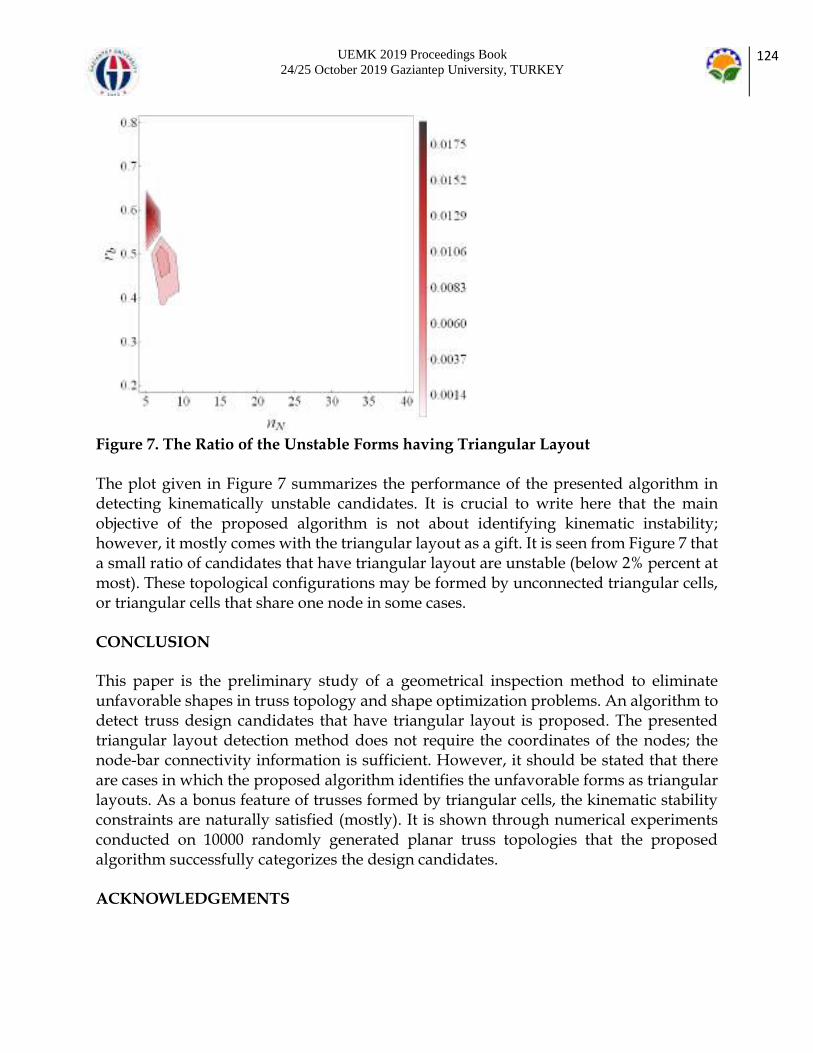
UEMK 2019 Proceedings Book 24/25 October 2019 Gaziantep University, TURKEY
124
Figure 7. The Ratio of the Unstable Forms having Triangular Layout The plot given in Figure 7 summarizes the performance of the presented algorithm in detecting kinematically unstable candidates. It is crucial to write here that the main objective of the proposed algorithm is not about identifying kinematic instability; however, it mostly comes with the triangular layout as a gift. It is seen from Figure 7 that a small ratio of candidates that have triangular layout are unstable (below 2% percent at most). These topological configurations may be formed by unconnected triangular cells, or triangular cells that share one node in some cases. CONCLUSION This paper is the preliminary study of a geometrical inspection method to eliminate unfavorable shapes in truss topology and shape optimization problems. An algorithm to detect truss design candidates that have triangular layout is proposed. The presented triangular layout detection method does not require the coordinates of the nodes; the node-bar connectivity information is sufficient. However, it should be stated that there are cases in which the proposed algorithm identifies the unfavorable forms as triangular layouts. As a bonus feature of trusses formed by triangular cells, the kinematic stability constraints are naturally satisfied (mostly). It is shown through numerical experiments conducted on 10000 randomly generated planar truss topologies that the proposed algorithm successfully categorizes the design candidates. ACKNOWLEDGEMENTS
UEMK 2019 Proceedings Book 24/25 October 2019 Gaziantep University, TURKEY
125
The second author (Batuhan ŞANLI) is an undergraduate student in Eskişehir Osmangazi University, Department of Civil Engineering. The first author congratulates his effort to prepare this paper. REFERENCES Assimi, H., Jamali, A., Nariman-zadeh, N. (2017). Sizing and topology optimization of truss structures using genetic programming. Swarm and Evolutionary Computation, 37, 90-103. doi:10.1016/j.swevo.2017.05.009 Bekdaş, G.¸ Nigdeli, S.M., Yang X.S. (2015). Sizing optimization of truss structures using flower pollination algorithm. Applied Soft Computing, 37, 322-331. doi:10.1016/j.asoc.2015.08.037 Cazacu, R., & Grama, L. (2014). Steel truss optimization using genetic algorithms and FEA. Procedia Technology, 12, 339-346. doi:10.1016/j.protcy.2013.12.496 Cui, H., An, H., Huang, H. (2018). Truss topology optimization considering local buckling constraints and restrictions on intersection and overlap of bar members, Structural and Multidisciplinary Optimization, 58(2), 575-594. doi:10.1007/s00158-018-1910-x Karagöz, Ö., Özbaşaran, H., Doğan, M., Gönen, H., Ünlüoğlu E. (2015). Betonarme taşıyıcı sistem – çelik kafes çatı etkileşimi: Deprem davranışı. 6. Çelik Yapılar Sempozyumu. Eskişehir, Turkey. Larsen, S.D., Sigmund, O., Groen, J.P. (2018). Optimal truss and frame design from projected homogenization-based topology optimization. Structural and Multidisciplinary Optimization, 57(4) 1461-1474. doi:10.1007/s00158-018-1948-9 Michell, A.G.M. (1904). The limits of economy of material in frame-structure. The Philosophical Magazine: Structure and Properties of Condensed Matter, 8(47), 589-597. doi:10.1080/14786440409463229 Rozvany, G.I.N. (1996). Difficulties in truss topology optimization with stress, local buckling and system stability constraints. Structural Optimization, 11(3-4), 213-217. doi:10.1007/BF01197036 Shakya, A., Nanakorn, P., Petprakob, W. (2018). A ground-structure-based representation with an element-removal algorithm for truss topology optimization. Structural and Multidisciplinary Optimization, 58(2), 657-675. doi:10.1007/s00158-018-1917-3 Zhou, M. (1996). Difficulties in truss topology optimization with stress and local buckling constraints. Structural Optimization, 11(2), 134-136. doi:10.1007/BF01376857.

UEMK 2019 Proceedings Book 24/25 October 2019 Gaziantep University, TURKEY
126
CONCEPTUAL DESIGN METHODOLOGY FOR FOLDABLE MOBILE SHELTERS
Jumana ALRAHAL*, Mustafa ÖZAKÇA Department of Civil Engineering, Faculty of Engineering, University of Gaziantep, Gaziantep, Turkey. *Corresponding author: [email protected] ABSTRACT: Prefabricated and quick-to-install shelters can provide victims of harsh natural and man-made disasters with the opportunity to survive. Seeking to cater for this need and to reflect the topic of the mobile sheltering system, this paper focuses on the case study development of a foldable, modular mobile shelter, from emergency scenarios to the permanent phase. The purpose of this paper is to propose a lightweight foldable and modular shelter that can be considered for the post-disaster shelter response and can be replaced, upgraded in size and geometrical configuration, and stored in a very short period of time. Using the folding technique, the specific mobile shelter structure investigated in this study has the ability to transform from a compact closed form to a large living space open form. The suggested structure of these shelters are incrementally expandable through adding more modular units to its ends and sides. Furthermore, this paper examines the feasibility of the proposed concept and structure systems through a literature review, design-based research and digital model development. Keywords: Incremental architecture, foldable structure, shelter design. Introduction Natural and manmade disasters have caused considerable damage to buildings. Many homes have been damaged and rendered unusable, causing a high number of displaced people. Thus, housing reconstruction programs take a significant role in disaster recovery and temporary shelters are essential suppliers and a critical part of disaster recovery. In this sense, shelters should provide homeless victims with privacy, safety and comfort to restart their daily activities and return to normal life as soon as possible after a disaster [1]. After the Second World War, governments were trying to develop urgent solutions to the drastic housing problem. With the support of the industries, architects and engineers, alternative solutions such as prefabricated buildings, mobile architecture and modular, transformable structures were developed. These alternative solutions expanded with the need for affordable, rapidly-constructed housing [2]. The need for shelter and housing reconstruction program was not limited to the post-war period; however, it became the main issue after every disaster. To coordinate activities associated with the right to have a proper shelter, Global Shelter Cluster (GSC) was established in 2005 by the Inter-

UEMK 2019 Proceedings Book 24/25 October 2019 Gaziantep University, TURKEY
127
Agency Standing Committee (IASC) of United Nations and is co-instructed worldwide by United Nations High Commissioner for Refugees (UNHCR) and International Federation of the Red Cross and Red Crescent Societies (IFRC/RCS) in natural disaster situations. GSC is responsible for emergency urgent requirements (such as plastic, sheeting, tents, cash, etc.) and long-term requirements (such as mobile shelters, building or reconstruction of houses and related matters). Moreover, a shelter cluster is responsible for site planning and settlement design working in close cooperation with other clusters [3]. Given that the reconstruction, or resettlement, generally takes between 2 to 15 years [4]. Bashawri et.al [5] reviews the categories of sheltering/housing which are divided into emergency shelter, temporary shelter, temporary housing, transitional/progressive shelter, and permanent housing (see Figure 1).
Figure 1 Categories of sheltering/housing systems
The existing evacuation shelters are usually complicated, take too much time to be constructed and are usually made of heavy materials. Many of them cannot be deployed or folded in a configurable geometric order, transportation becomes more difficult and storage for future use is particularly problematic. Asefi and Sirus [6] review the shelter both with and without transformable elements. Examples for shelters with transformable elements are folding bamboo house, recover accordion shelter and portable, retractable tent. Many researchers and engineers keep searching for a better alternative design for emergency shelter. During the design of a better shelter, they take the local culture and traditions into account and use materials available near to affected site. As a result, researchers started to investigate sustainable solutions. One possible shelter solution is supplying affected families with the means to start reconstruction directly

UEMK 2019 Proceedings Book 24/25 October 2019 Gaziantep University, TURKEY
128
after the disaster through the foldable transitional shelter approach as shown in Figure 2. In fact, the foldable transitional shelter can be considered as incremental process, not a final product, but an ongoing process. It supports the post-disaster affected families as they seek to sustain alternative options for recovering the damage, starting just after the disaster, and achieve a durable permanent house in a progressive manner within a limited period of time [7].
Figure 2 An incremental foldable transitional shelter and construction process
The transitional shelter can begin just after the disaster by distributing a foldable shelter package. Further support, such as cash or further material distribution, enables incremental building and upgrading of shelter towards the permanent house as presented in Figure 2. However, the period this process can take depends mainly on the economic situation and size of the family. Additionally, the transitional shelter is grounded on five characteristics which are defined by IOM [7]. These shelters are upgradable, reusable, relocatable, resalable and recyclable. Consequently, the mobile transitional shelter is expected to be a continuous process for months and even years. The mobile transitional shelter offers the opportunity to link relief and future development perspectives towards a sustainable solution [7]. As a response for the increasing need for decent, more sustainable sheltering system, this research aims to suggest a design of a mobile shelter following a modular methodology and innovate an easy foldable unit that can fold in a short time. The suggested shelter will be well equipped for quick deployment immediately after the disaster. The suggested design is controlled to be light, so that it can be compactly folded in a package to make transportation easier. Moreover, it has the capability to be expanded as needed. The suggested mobile shelter design has objectives (such as security, size, lifespan, relief, and privacy) and limitations (such as cost, quantity, timeliness, materials availability, cultural appropriateness, and construction skills). Foldable Mobile Structure Design Methodology The term 'foldable structure' can be used to describe a structure that can be transformed from a compressed 'folded' form to a larger 'expanded' form [8]. Since folding is a relatively simple and rapid process to acquire three-dimensional shape, it has attracted

UEMK 2019 Proceedings Book 24/25 October 2019 Gaziantep University, TURKEY
129
many architects to implement this technology in designing a wide range of structures, from extended roofs to exceptional building structures. In addition, with the possibility of combining it with parametric graphic tools, folding technology significantly accelerates the design cycle. More specifically, the existing application of folding technology in architectural design is basically focused on structural design and surface design [9]. The folding technique is generally used in the pre-hinged structure system. In foldable structures, in order to facilitate the folding process, static elements (plates) are connected by movable joints, which converts them into kinetic components. Taking this into consideration, it is understood that movable joints not only are a connection between two plates but also must transfer loads permitting relative motion in some directions while constraining motion in others [2]. A review of current challenges regarding foldable structures is presented and different mechanical modelling of foldable structures is investigated by Lebée [10]. Rigid folding, in which all the deformation is concentrated in the hinges while the faces between the folds remain flat, is adopted in this study. Modular design (construction) can be defined as: A module is a unit whose structural elements are powerfully connected among themselves and relatively weakly connected to elements in other units. Obviously there are degrees of connection, so there are gradations of modularity [11]. The modular design grid described by Smith [12] and adopted in this current study is a geometric configuration system that enables building components and module elements to have standard dimensions. These configuration systems are generally based on square and rectangular structure, thus creating linear, component-like, flat-panel and box-like modules, though not necessarily. Structural systems are often placed on an axial grid, and panels and modules are deployed on a modular grid. Although this is effective from a design standpoint, there are problems in adjusting how other materials and elements are connected to the main module. If each column, beam, or structural element is in a different dimension, the 2D and 3D grid loses the ability to have a standardized panel or filling element associated with the frame with a standardized connection. When a major structural system is connected to another enclosure or interior system on the axis grid, special connections are necessary to be made. Every building is designed in accordance with specific parameter sets such as use, size, material etc. Traditionally, this set of parameters is fixed earlier at the design process. However, the modular design features changeability of parameters into the current design process. Use of folding and interlocking techniques will improve the system flexibility for easy assembling, transportation, restoration and expansion. This leads to a more dynamic and flexible design where "late change", such as adding a kitchen unit to a base mobile shelter, does not result in the difficult laborious manual integration of a new element into an existing design [13]. The incremental housing is a step-by-step process and is designed to be one part of the sustainable response. It starts with a primary core shelter which can be a bedroom unit or a bare lot with the possibility of connecting more units. It is not quick, immediate or

UEMK 2019 Proceedings Book 24/25 October 2019 Gaziantep University, TURKEY
130
complete but the owner manages housing expansion based on his needs and resources. The implementation of the incremental strategy is not as simple as ready-set-go. However, one of the most important issues that must be tackled by possible policies is to provide a starter house core to provide families with shelter and offer flexibility [14]. Design Example: Winged Shelter Module description The Winged shelter is a foldable housing unit which consists of an expandable parallelogram. The four symmetrical folded plates are the wings which are connected to long sides of the parallelogram by hinge joint system. Each wing is joined by two foldable plates. One of these two foldable plates is folded to the long edge of the wing, and the other is folded into the short edge of the wing using a hinge system so that it can freely rotate at a 90 degree angle. Figure 3 shows folded and unfolded Winged shelter unit.
(a) (b)
Figure 3 Winged shelter design (a) folded unit, (b) unfolded (after erected) unit Geometry and dimension
The suggested shelter structure is derived from a simple technique of folding. When Winged shelter design is erected (opened), the base unit will be 400 cm long, 358 cm wide, 269 cm high. The unit supports 14.32 𝑚2 living floor area. The plane and sections views of the Winged shelter design is shown in Figure 4. The shape of this design is a parallelogram. It is a purely geometric shape which consists of flat sides. Flat surfaces give the ability to use standard prefabricated panels. In addition, they have flexibility to create openings like doors and windows to provide good lighting conditions to the unit.

UEMK 2019 Proceedings Book 24/25 October 2019 Gaziantep University, TURKEY
131
Figure 4 The plane and section view of Winged design (All dimensions are in cm) Conceptual design The basic idea of the concept is using folding and interlocking technology with the same modular composition system unit. The use of folding techniques makes the system more flexible, easily transportable, restorable and expandable. As shown step by step in Figure 5, the installation procedure begins with the preparation of the foundation and ground where the unit will be placed as shown in image1. Next, the wings are unfolded at a 90 degree angle to form the roof and floor as shown in image 2 and 3. After that, each wing is unfolded from the long edge at a 90 degree angle to form side walls (see image 4 and 5). It is noted that two plates from two different wings meet to form a side wall. The result of this step is two opposite walls of the unit. Then, the second plates of two of the wings are unfolded to the short edge at a 90 degree angle to make two vertical plates forming the backside walls as shown in image 6 and 7. Finally, the second plates of the other two wings are unfolded at a 90 degree angle to form front window and door panels as shown in image 8 and 9. In this case, the desired erected (unfolded) unit is ready to shelter people. The unit can be unfolded to make it available within an hour by only three persons.
1 2
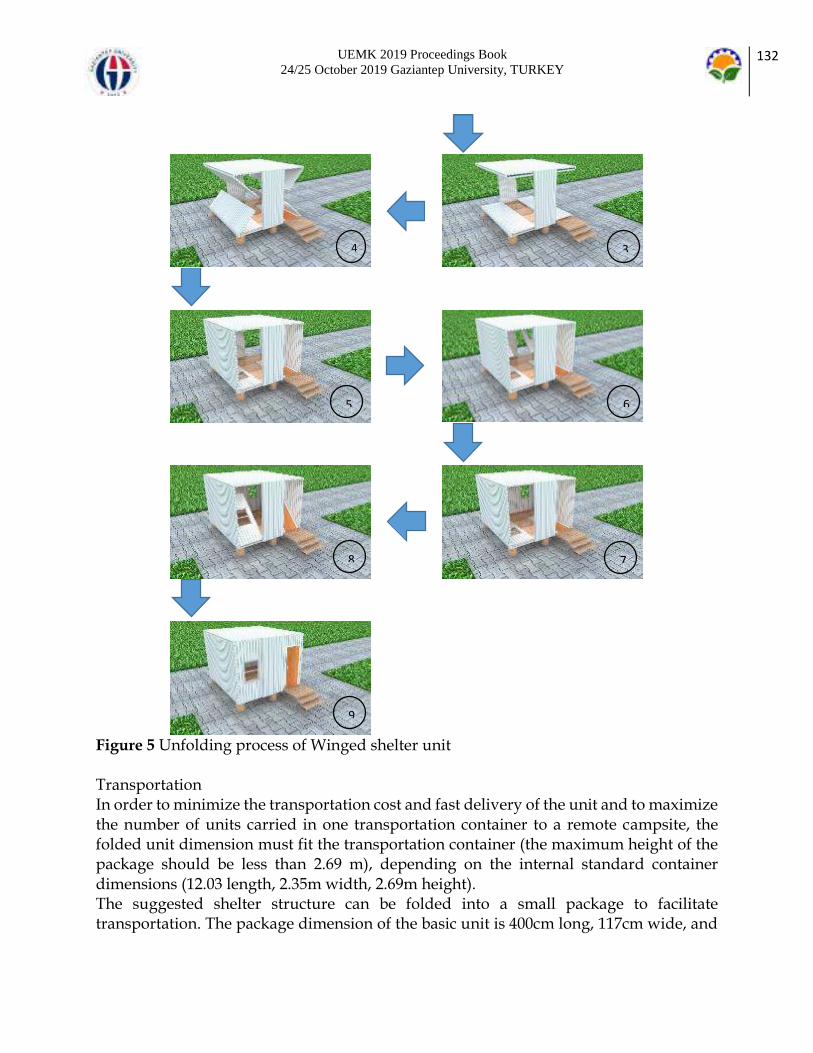
UEMK 2019 Proceedings Book 24/25 October 2019 Gaziantep University, TURKEY
132
Figure 5 Unfolding process of Winged shelter unit Transportation In order to minimize the transportation cost and fast delivery of the unit and to maximize the number of units carried in one transportation container to a remote campsite, the folded unit dimension must fit the transportation container (the maximum height of the package should be less than 2.69 m), depending on the internal standard container dimensions (12.03 length, 2.35m width, 2.69m height). The suggested shelter structure can be folded into a small package to facilitate transportation. The package dimension of the basic unit is 400cm long, 117cm wide, and
3 4
5 6
7 8
9

UEMK 2019 Proceedings Book 24/25 October 2019 Gaziantep University, TURKEY
133
269 cm high. Six basic unit packages can fit in a standard transportation container and be delivered up at a time as shown in Figure 6.
Figure 6 Transportation of Winged shelter units
Incremental housing process After receiving relief, affected families usually begin looking for more space to be used for daily activities. In incremental housing concept, the base unit is considered as the first step to be used in emergencies. Families can expand their shelter according to their needs, such as adding a bathroom or a kitchen unit or both. The expansion will occur according to incremental architecture, which is a step-by-step process using addition, subtraction and substitution to obtain the required configuration. The core structure which is a bedroom with a baby-room space unit; this phase is called emergency phase (is a place for people to live temporarily when they cannot live in their previous residence, similar to homeless shelters) see Figure 7. The unit in the emergency phase (single unit) has the following features:
Easily and quickly transported
Easy to set up and quick to construct
The unit can fit for 3 to 4 people
Relocatable as necessary
Upgradable size

UEMK 2019 Proceedings Book 24/25 October 2019 Gaziantep University, TURKEY
134
(a) (b) Figure 7 The first level of expansion of Winged shelter design, (a) main module (emergency phase), (b) Plan of the main module When it is required, it is possible to connect additional modules (including bathroom, kitchen or another bedroom) to the core structure. This phase represents the temporary phase (double unit) and is illustrated in Figure 8 In this phase, one of the modules contains a kitchen and a bathroom, separate from each other. The unit in this temporary phase has the following features:
People at this stage will begin searching for a larger area to cover more purposes such as a kitchen, a bathroom and a living room etc.
The added unit can easily function as a kitchen or a bathroom by connecting it to the water supply system in the site or providing a water tank for each shelter.
(a) (b) Figure 8 The second level of expansion of Winged shelter design, (a) Two module
(temporary phase), (b) Plan view of two modules. The third level of expansion program is called the transitional or semi-permanent phase (triple unit) in which we add another module to the unit in the previous phase (temporary phase). In this phase one of the modules represents the entrance - a living room with a
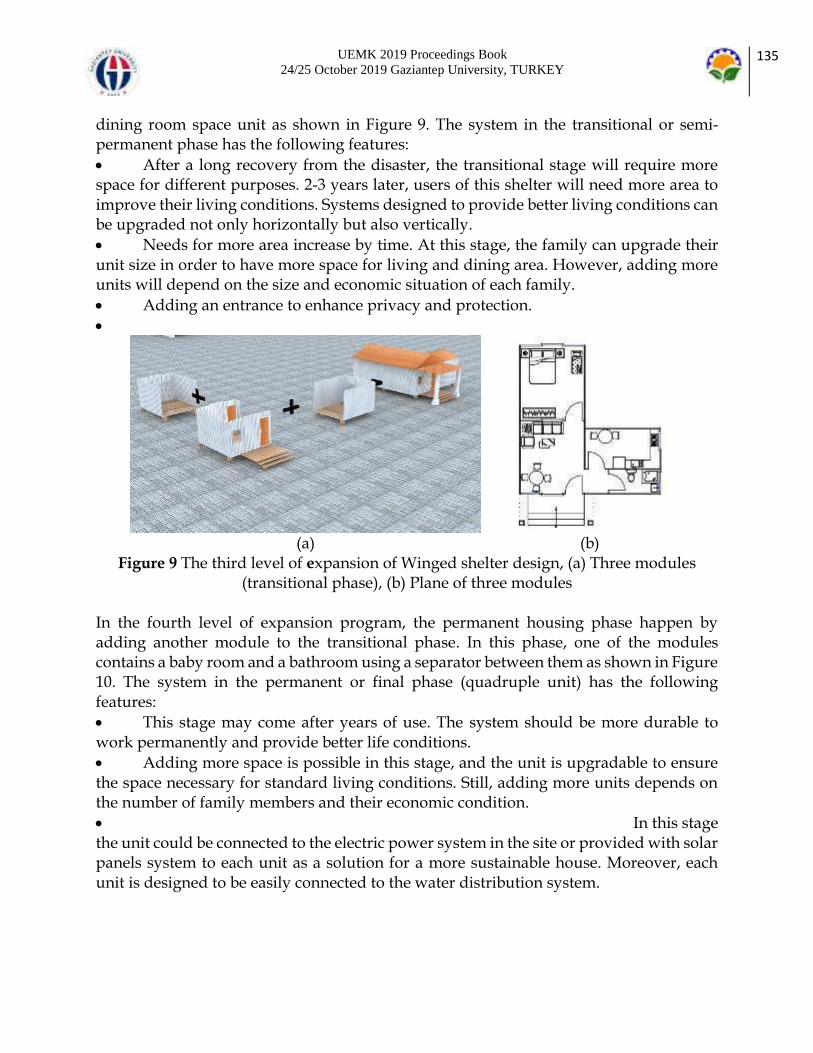
UEMK 2019 Proceedings Book 24/25 October 2019 Gaziantep University, TURKEY
135
dining room space unit as shown in Figure 9. The system in the transitional or semi-permanent phase has the following features:
After a long recovery from the disaster, the transitional stage will require more space for different purposes. 2-3 years later, users of this shelter will need more area to improve their living conditions. Systems designed to provide better living conditions can be upgraded not only horizontally but also vertically.
Needs for more area increase by time. At this stage, the family can upgrade their unit size in order to have more space for living and dining area. However, adding more units will depend on the size and economic situation of each family.
Adding an entrance to enhance privacy and protection.
(a) (b)
Figure 9 The third level of expansion of Winged shelter design, (a) Three modules (transitional phase), (b) Plane of three modules
In the fourth level of expansion program, the permanent housing phase happen by adding another module to the transitional phase. In this phase, one of the modules contains a baby room and a bathroom using a separator between them as shown in Figure 10. The system in the permanent or final phase (quadruple unit) has the following features:
This stage may come after years of use. The system should be more durable to work permanently and provide better life conditions.
Adding more space is possible in this stage, and the unit is upgradable to ensure the space necessary for standard living conditions. Still, adding more units depends on the number of family members and their economic condition.
In this stage the unit could be connected to the electric power system in the site or provided with solar panels system to each unit as a solution for a more sustainable house. Moreover, each unit is designed to be easily connected to the water distribution system.
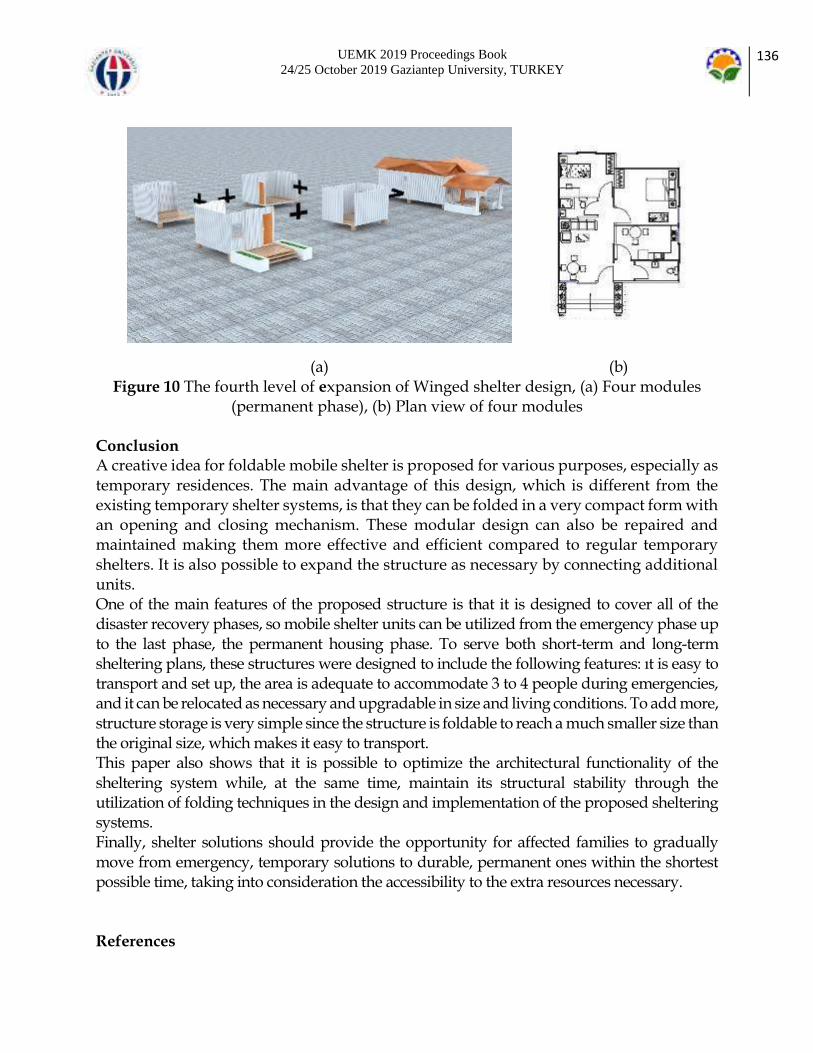
UEMK 2019 Proceedings Book 24/25 October 2019 Gaziantep University, TURKEY
136
(a) (b) Figure 10 The fourth level of expansion of Winged shelter design, (a) Four modules
(permanent phase), (b) Plan view of four modules Conclusion A creative idea for foldable mobile shelter is proposed for various purposes, especially as temporary residences. The main advantage of this design, which is different from the existing temporary shelter systems, is that they can be folded in a very compact form with an opening and closing mechanism. These modular design can also be repaired and maintained making them more effective and efficient compared to regular temporary shelters. It is also possible to expand the structure as necessary by connecting additional units. One of the main features of the proposed structure is that it is designed to cover all of the disaster recovery phases, so mobile shelter units can be utilized from the emergency phase up to the last phase, the permanent housing phase. To serve both short-term and long-term sheltering plans, these structures were designed to include the following features: ıt is easy to transport and set up, the area is adequate to accommodate 3 to 4 people during emergencies, and it can be relocated as necessary and upgradable in size and living conditions. To add more, structure storage is very simple since the structure is foldable to reach a much smaller size than the original size, which makes it easy to transport. This paper also shows that it is possible to optimize the architectural functionality of the sheltering system while, at the same time, maintain its structural stability through the utilization of folding techniques in the design and implementation of the proposed sheltering systems. Finally, shelter solutions should provide the opportunity for affected families to gradually move from emergency, temporary solutions to durable, permanent ones within the shortest possible time, taking into consideration the accessibility to the extra resources necessary. References

UEMK 2019 Proceedings Book 24/25 October 2019 Gaziantep University, TURKEY
137
[1] Félix D, Branco JM, Feio A. Temporary housing after disasters: A state of the art survey. Habitat International 2013; 40: 136-141. [2] Werner C.D.M. Transformable and transportable architecture: analysis of buildings components and strategies for project design. MSc, Escuela Técnica Superior de Arquitectura de Barcelona, Universitat Politècnica de Catalunya, Spain, 2013. [3] UNHCR, United Nations High Commissioner for Refugees. Handbook for emergencies. 4nd ed. Genova, Switzerland: 2015. [4] do Nascimento JIG. Transitional Architecture in Emergency Scenarios: Click house case study: modular shelter made of advanced composite materials. MSc, Instituto Superior Técnico of the University of Lisbon, Lisboa, Portugal, 2015. [5] Bashawri A, Garrity S, Moodley K. An overview of the design of disaster relief shelters. Procedia Economics and Finance 2014; 18: 924-931. [6] Asefi M, Sirus FA. Transformable shelter: Evaluation and new architectural design proposals. Procedia-Social and Behavioral Sciences 2012; 51: 961-966. [7] International Organization for Migration (IOM). Transitional Shelter Guidelines. Shelter Centre. Geneva Switzerland, 2012. [8] Farrugia P. Kinematic analysis of foldable structures. PhD diss., University of Surrey, England, United Kingdom, 2008. [9] Shen T, Nagai Y. An Overview of Folding Techniques in Architecture Design. World Journal of Engineering and Technology 2017; 5: 12-19. [10] Lebée A. From folds to structures, a review. International journal of space structures. 2015 Jun; 30(2):55-74. [11] Baldwin YC, Clark BK. Design Rules, The Powerity of Modularity. The MIT Press Cambridge, Massachusetts, London, England: 2000. [12] Smith RE. Prefab Architecture: A Guide to Modular Design and Construction. New Jersey, USA: John Wiley and Sons, Inc., Hoboken, 2010. [13] Bakbak D, Özakça M, Göğüş MT. Design of Transitional Shelter Using Foldable Panels. Architecture in Emergency: Rethinking the refugee crisis conference; 17–19

UEMK 2019 Proceedings Book 24/25 October 2019 Gaziantep University, TURKEY
138
November 2016; , İstanbul Kultur University, Turkey. [14] Goethert, R. Incremental housing. Monday Developments, 9, 23–25. Retrieved from http://web.mit.edu, 2010.

UEMK 2019 Proceedings Book 24/25 October 2019 Gaziantep University, TURKEY
139
UTILISATION OF GLYCEROL ETHERS IN A DIESEL ENGINE Abdülvahap ÇAKMAK Department of Motor Vehicles and Transportation Technologies, Kavak Vocational School, Samsun University [email protected] Murat KAPUSUZ Department of Mechanical Engineering, Ondokuz Mayıs University [email protected] Hakan ÖZCAN Department of Mechanical Engineering, Ondokuz Mayıs University [email protected] ABSTRACT: The aim of this study is to explore the usability of glycerol ethers as a future bio-renewable fuel in a diesel engine. In this context, an experimental study was carried out to synthesize glycerol ethers and investigate the effect of glycerol ethers on diesel engine performance and emissions. Glycerol ethers were synthesized by etherification reaction of glycerol with tert-butyl alcohol (TBA) in a stainless steel batch reactor. Produced glycerol ethers were mixed by 2 vol. % with a biodiesel-diesel blend to research glycerol ethers usage as fuel in a diesel engine. Engine performance and emissions tests were performed on a single-cylinder research diesel engine and the results revealed that the addition of glycerol ethers in the fuel caused an average increase in brake specific fuel consumption by 2.17 % and NOx emissions by 1.79 %. However, a reduction was observed in CO emissions by 2.71 % and HC emissions by 48.99 %, due to the addition of glycerol ethers in the diesel-biodiesel blend. Keywords: Glycerol ethers, Oxygenated fuel, Biodiesel, Diesel engine, Performance, Emissions INTRODUCTION Today, the world energy supply is heavily depending on petroleum products and fossil fuels. But the limited reserves of fossil resources, increasing petroleum products cost and environmental issues resulted in the need to find alternative fuels that will be renewable and environment-friendly fuel. Biodiesel is one of the best alternative fuel for diesel engine application since it has many advantages over petroleum-based diesel fuel. Biodiesel is a renewable fuel produced from vegetable oils, animal fats or waste oils by the transesterification reaction. It is a biodegradable, non-toxic fuel and it contains no

UEMK 2019 Proceedings Book 24/25 October 2019 Gaziantep University, TURKEY
140
sulfur and aromatic compounds in its composition (Singh & Singh, 2010). Without any fuel system and engine modification in a diesel engine, biodiesel can be used in 100% concentration or it can be blended in any ratio with diesel fuel. Biodiesel has a higher flash point than that of diesel fuel, which makes it safer for handle and transportation (Al-Zuhair, 2007). Due to oxygen in molecular structure, it improves the fuel oxidation rate and thus lowers exhaust emissions and increase engine efficiency. In addition, it has a high cetane number and good lubricity property (Singh & Singh, 2010). Thanks to the above-mentioned advantages of biodiesel, it has been an alternative for petroleum-based diesel fuel. Therefore, countries around the world are using biodiesel produced different sources. Moreover, in order to reduce dependence on limited petroleum reserves the blending ratio of biodiesel is being progressively increased. For example, the Europe Union has set a target to increase biofuels use up to 10% for transportation in 2020 (Phillips et al., 2018). In Turkey, biodiesel produced from local sources could be mixed up to 7 vol.% with diesel fuel. Because biodiesel is a leading solution for diesel engine application, its production experienced sustainable growth over two decades. Since 2000-2017 global biodiesel production has increased from 0.78 billion liters to 32.6 billion liters (IEA, 2018). Additionally, it is estimated that biodiesel production can reach up to 39 billion liters in 2027 (OECD/FAO, 2018). In the biodiesel production process, glycerol occurs as a by-product approximately 10 wt. % of produced biodiesel. (Rahmat et al.2010; Spooner-Wyman et al., 2010). As a result of the increasing of biodiesel production, also the production of glycerol will grow proportionally (Beatrice et al., 2014). The main problem associated with increasing biodiesel production is the surplus glycerol which could not be completely used in glycerol related industries, which could lead to improper disposal of glycerol into the environment. (Rahmat et al., 2010). So, the key challenge emerged is the evaluation of excess glycerol. However, it is demonstrated that excess glycerol can be transformed into oxygenated fuels could be used in conventional internal combustion engines (Karinen & Krause, 2006; Klepáþová et al., 2003). Etherification of glycerol with tert-butyl alcohol (TBA) or isobutene has emerged the most effective route to convert excess glycerol into oxygenated fuel additives. The etherification of glycerol yields mono-ethers, di-ethers, and tri- ether of glycerol which considered as potential oxygenated fuel ( Klepáčová et al., 2005; Klepáþová et al., 2003). Although there are many studies deal with etherification of glycerol (Chang & Chen, 2011; Frusteri et al., 2009; Kiatkittipong et al., 2011; Klepáčová et al., 2006; Ozbay et al., 2010; Ozbay et al., 2013), only a few studies related to the effect of glycerol ethers on engine performance and emissions are found in the existing literature (Beatrice et al., 2014; Beatrice et al., 2015; Frusteri et al., 2013). The aim of this research study is to investigate the effects of glycerol ethers on performance and emissions of a diesel engine fueled with a diesel-biodiesel blend. Unlike previous studies, in this work produced glycerol ethers were mixed with biodiesel since glycerol ethers can improve the cold fuel

UEMK 2019 Proceedings Book 24/25 October 2019 Gaziantep University, TURKEY
141
properties of biodiesel (Klepáþová et al., 2003; Noureddini et al., 1998), this can be the novelty of this presented study. METHODS In this research, glycerol ethers were synthesized by etherification reaction of glycerol with TBA at a presence of Amberlyst-15 catalyst since the glycerol ethers are not commercially available. For this purpose, a 0.5 L stainless steel batch reactor was designed and manufactured. A photograph of the batch reactor was given in Figure 1. Glycerol (purity ≥ 99%, TEKKİM), TBA (purity ≥ 99.5%, Merck) and Amberlyst-15 (dry form, Dow Chemical Company) were the chemicals for synthesis glycerol ethers. The esterification reaction conditions such as alcohol/glycerol molar ratio, amount of catalyst, reaction time, reaction temperature and stirring speed, which gives high glycerol conversion and high ether selectivity were determined from the previously published studies (Frusteri et al., 2009b; Klepáčová et al., 2006; Nagabhatla Viswanadham & Saxena, 2013). The etherification reaction conditions selected for this study were below:
TBA/Glycerol molar ratio: 4:1
Amount of Amberlyst-15: 7.5 wt. % / glycerol
Reaction temperature: 90
Reaction time: 3 h
Stirring speed: 1200 rpm The reaction procedure was the following: a defined amount of glycerol, TBA and Amberlyst-15 were loaded into the reactor and the reactor was flushed with nitrogen gas to obtain an inert environment. Then, the reactor was heated up to reaction temperature and the reaction started immediately by running the magnetic stirring. At the end of the reaction, the reactor was cooled down to the room temperature to obtain all compounds in the liquid phase. The Amberlyst-15 catalyst was removed from the product by the vacuum filtration method. In order to purify the products, a distillation process was done. Sufficient amounts of glycerol ethers were produced with the same method by repeating experiments.
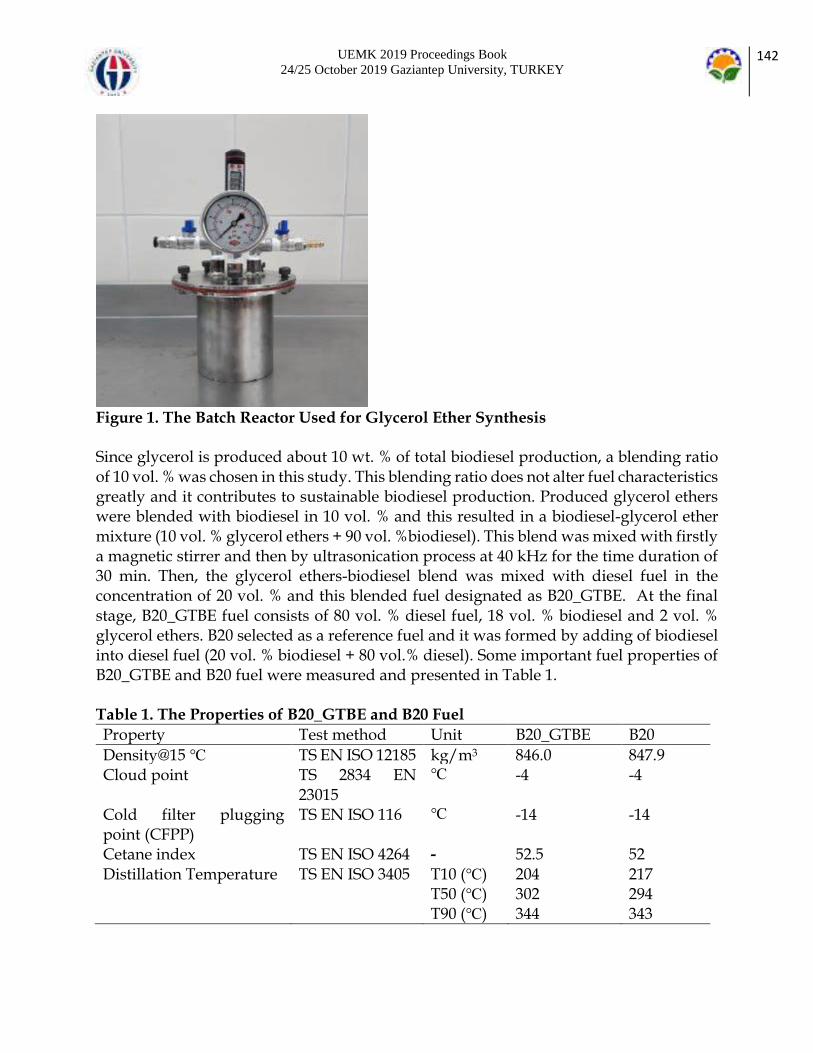
UEMK 2019 Proceedings Book 24/25 October 2019 Gaziantep University, TURKEY
142
Figure 1. The Batch Reactor Used for Glycerol Ether Synthesis Since glycerol is produced about 10 wt. % of total biodiesel production, a blending ratio of 10 vol. % was chosen in this study. This blending ratio does not alter fuel characteristics greatly and it contributes to sustainable biodiesel production. Produced glycerol ethers were blended with biodiesel in 10 vol. % and this resulted in a biodiesel-glycerol ether mixture (10 vol. % glycerol ethers + 90 vol. %biodiesel). This blend was mixed with firstly a magnetic stirrer and then by ultrasonication process at 40 kHz for the time duration of 30 min. Then, the glycerol ethers-biodiesel blend was mixed with diesel fuel in the concentration of 20 vol. % and this blended fuel designated as B20_GTBE. At the final stage, B20_GTBE fuel consists of 80 vol. % diesel fuel, 18 vol. % biodiesel and 2 vol. % glycerol ethers. B20 selected as a reference fuel and it was formed by adding of biodiesel into diesel fuel (20 vol. % biodiesel + 80 vol.% diesel). Some important fuel properties of B20_GTBE and B20 fuel were measured and presented in Table 1. Table 1. The Properties of B20_GTBE and B20 Fuel
Property Test method Unit B20_GTBE B20
Density@15 TS EN ISO 12185 kg/m3 846.0 847.9 Cloud point TS 2834 EN
23015
-4 -4
Cold filter plugging point (CFPP)
TS EN ISO 116 -14 -14
Cetane index TS EN ISO 4264 - 52.5 52 Distillation Temperature TS EN ISO 3405 T10 () 204 217 T50 () 302 294 T90 () 344 343

UEMK 2019 Proceedings Book 24/25 October 2019 Gaziantep University, TURKEY
143
As seen in Table 1, using glycerol ethers by 2 vol. % rate resulted in no significant changes in determined fuel properties. A slight decrease in fuel density and no changes in cold flow properties of test fuels were observed. Due to the low boiling temperature of glycerol ethers the distillation temperature (T10) of the B20_GTBE decreased. Engine performance and emission tests were performed on a single-cylinder four-stroke diesel engine. The test engine has a stroke volume of 661.5 cm3 and a compression ratio of 17.5:1. Test engine fitted with the mechanical fuel injection system with an injection pressure of 200 bar. At full engine load and a speed of 1500 rpm, the maximum brake power output of the engine is 3.5 kW. The engine was connected to an Eddy current dynamometer to load engine. External engine cooling system was used to decrease parasitic loads without influencing the engine load conditions. Each test fuels were supplied to the engine by separate fuel tanks. The engine was operated at a constant speed of 1500 rpm and at 25%, 50%, 75%, and 100% engine load. An exhaust gas analyzer was used to measure the emissions of CO, HC, CO2, and NOx. In figure 2, the experimental layout was illustrated and in Table 2 experimental uncertainties were presented.
Figure 2. Test Setup Layout Table 2. The Uncertainties of the Measured and Calculated Parameters
Parameter Measurement Range
Resolution Uncertainty
Brake torque 0-90 Nm 0.1 Nm ±1.5 % Engine speed 0-9999 rpm 1 rpm ±0.06 %
UEMK 2019 Proceedings Book 24/25 October 2019 Gaziantep University, TURKEY
144
Air flow rate - - <±0.8 % Fuel flow rate - - <±0.7 % Temperature - 0.1 1 Brake thermal efficiency
- - <±0.9 %
CO 0-10 % vol. 0.001 % ±3% HC 0-4000 1 ppm ± 8 ppm CO2 0-20 % vol. 0.01% ±3% NOx 0-4000 ppm 1 ppm ± 25 ppm
RESULTS AND FINDINGS Since each fuel was tested at the same engine speed and loads, test fuels produced the same brake power at the same test condition. Hence, the comparison of the engine performance was made based on brake specific fuel consumption (BSFC) and brake thermal efficiency (BTE). The variation of brake specific fuel consumption and brake thermal efficiency for test fuels were presented in Figure 3. It was noticed that BSFC decreased while BTE increased with increasing the engine load for both fuels, as expected. This was due to an increase in the amount of injected fuel in the cylinder that enhances engine power. In addition, as increase engine load, the heat loss per cycle through the cylinder wall decreased and this consequently reduced the BSFC and increased BTE. It can be seen in this figure that B20_GTBE presented slightly higher brake specific fuel consumption than that of B20. It was determined that the addition of 2 vol. % glycerol ethers in fuel caused an average increase in BSFC by 2.14% because of the lower heating value of glycerol ethers. Glycerol ethers did not show a significant effect on brake thermal efficiency in spite of the lower heating value of glycerol ethers. The reasons for this may be extra oxygen content of the fuel due to the addition of glycerol ethers in the biodiesel. Moreover, the low distillation temperature of the glycerol ether could reduce the ignition delay, which led to an improvement in fuel combustion. Thus, B20_GTBE presented nearly the same thermal efficiency with B20 and differences in brake thermal efficiency were less than the calculated uncertainties of BTE.

UEMK 2019 Proceedings Book 24/25 October 2019 Gaziantep University, TURKEY
145
Figure 3. Comparison of Engine Performance for Test Fuels Figure 4. shows the variation of exhaust gas temperature of test fuels. The exhaust temperature with B20_GTBE was lower than that of B20 at all engine loads. Besides, an average decrease of 1.36% in exhaust temperature was determined with the use of glycerol ethers. The decrease in exhaust temperature can be attributed to lower energy content and shorter ignition delay for B20_GTBE compared to B20. Therefore, B20_GTBE caused a lower combustion temperature, resulting in a lower exhaust temperature compared with B20.
Figure 4. Comparison of Exhaust Temperature for Test Fuels The variation of CO and HC emissions of test fuels was illustrated in Figure 5 and Figure 6, respectively. Both CO and HC emissions decreased with the use of glycerol ethers. It
10
15
20
25
30
35
40
0,2
0,3
0,4
0,5
0,6
0,7
25 50 75 100
BT
E [
%]
BSF
C [
L/k
W-h
]
Engine Load [%]
B20 B20_GTBE
160
180
200
220
240
25 50 75 100
Exh
aust
Gas
Tem
pera
ture
[o C
]
Engine Load [%]
B20 B20_GTBE

UEMK 2019 Proceedings Book 24/25 October 2019 Gaziantep University, TURKEY
146
was determined that B20_GTBE fuel resulted in an average reduction in CO and HC emissions by 2.71% and 48.99%, respectively, compared to B20. These findings are a typical result of oxygenated fuel since this may be due to better combustion in case of oxygen contained fuels (Beatrice et al., 2015; Behçet et al., 2015; Cakmak et al., 2018). Glycerol ethers contain about 39 mol. % oxygen in chemical structure (Beatrice et al., 2014) and the oxygen atoms weakly bonded two carbon atoms (Kaul et al., 2015). The weakly bonded oxygen atoms in glycerol ethers further aid the fuel oxidation process by it reduces the local fuel-rich zone. This resulted in less HC and CO emissions for B20_GTBE fuel. Additionally, the lower distillation temperature of glycerol ethers might facilitate the breakdown of the fuel molecule, which enhances the combustion efficiency.
Figure 5. Comparison of CO Emissions for Test Fuels CO2 emissions of test fuel presented in Figure 7. As seen in this figure both fuels resulted in nearly the same level of CO2 emissions. The fuel impact on CO2 emissions was not significant and the differences between CO2 emissions value were in the range of measurement uncertainties for CO2. The effect of test fuels on NOX emissions was presented in Figure 8. An average increase of 1.79 % in NOX emissions was found when the engine fuelled with B20_GTBE as compared to B20. The NOX values of test fuels were close to each other up to 75% engine load however, beyond this load B20_GTBE led to an increase in NOX emission level. Because of the lower heating value of glycerol ethers, more fuel must be injected at full engine load to run the engine at the same test condition compared to that of B20 operation. This led to a further increase in cylinder temperature and oxygen concentration in the cylinder and thus high NOX emissions. Moreover, due to the improved combustion quality as a result of fuel borne-oxygen, more NOX emissions were formed in the case of glycerol ethers use.
0,15
0,18
0,21
0,24
0,27
0,3
25 50 75 100
CO
[%
]
Engine Load [%]
B20 B20_GTBE
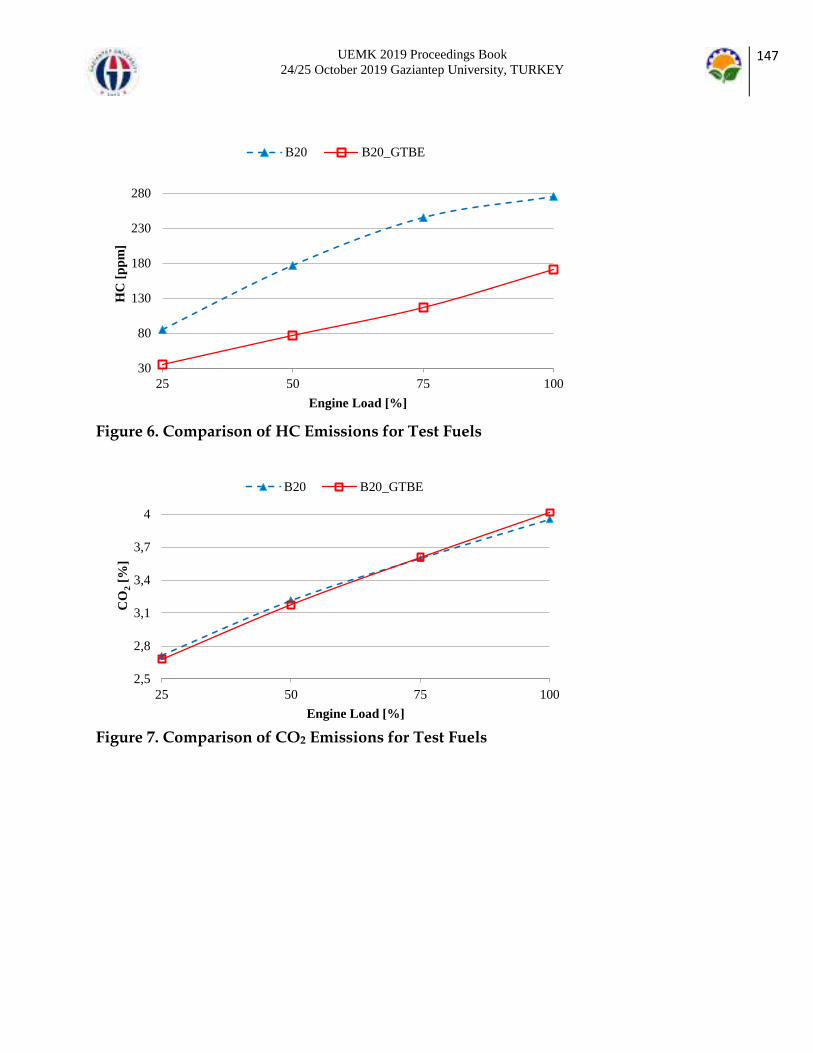
UEMK 2019 Proceedings Book 24/25 October 2019 Gaziantep University, TURKEY
147
Figure 6. Comparison of HC Emissions for Test Fuels
Figure 7. Comparison of CO2 Emissions for Test Fuels
30
80
130
180
230
280
25 50 75 100
HC
[pp
m]
Engine Load [%]
B20 B20_GTBE
2,5
2,8
3,1
3,4
3,7
4
25 50 75 100
CO
2[%
]
Engine Load [%]
B20 B20_GTBE

UEMK 2019 Proceedings Book 24/25 October 2019 Gaziantep University, TURKEY
148
Figure 8. Comparison of NOX Emissions for Test Fuels CONCLUSION In this research study, glycerol ethers were synthesized and added to a diesel-biodiesel blended fuel to investigate the usability of glycerol ethers in a diesel engine. The results of this study revealed the possibility to use glycerol ethers at a concentration of 2 vol. % in a diesel-biodiesel blend without any significant influence- on fuel properties, engine performance, and exhaust emissions. In addition, this study indicated that excess glycerol originated from biodiesel production could be turned into oxygenated fuel and could be used as a fuel additive in diesel engines. It is evident that by evaluating excess glycerol in fuel production in this way, environmental pollution caused by excess glycerol will be prevented. RECOMMENDATIONS It is recommended to investigate the economic analysis of production and use of glycerol ethers. Because of appropriate fuel properties, glycerol ethers could also be used as a fuel additive to gasoline and thus studies in this field should be conducted. ACKNOWLEDGMENTS This study was supported by the Project Management Office of Ondokuz Mayis University (Project number: PYO.MUH.1904.19.016). Abdülvahap ÇAKMAK has been awarded a doctoral scholarship by the Scientific and Technical Research Council of Turkey (TUBİTAK-BİDEB: 2211-C). REFERENCES
500
1100
1700
2300
2900
3500
4100
25 50 75 100
NO
X[p
pm]
Engine Load [%]
B20 B20_GTBE

UEMK 2019 Proceedings Book 24/25 October 2019 Gaziantep University, TURKEY
149
Al-Zuhair, S. (2007). Production of biodiesel: possibilities and challenges. Biofuels, Bioproducts and Biorefining, 1(1), 57–66. https://doi.org/10.1002/bbb.2 Beatrice, C., Di Blasio, G., Guido, C., Cannilla, C., Bonura, G., & Frusteri, F. (2014). Mixture of glycerol ethers as diesel bio-derivable oxy-fuel: Impact on combustion and emissions of an automotive engine combustion system. Applied Energy, 132, 236–247. https://doi.org/10.1016/J.APENERGY.2014.07.006 Beatrice, C., Di Blasio, G., Lazzaro, M., Mancaruso, E., Marialto, R., Sequino, L., & Vaglieco, B. M. (2015). Investigation of the combustion in both metal and optical diesel engines using high-glycerol ethers/diesel blends. International Journal of Engine Research, 16(1), 38–51. https://doi.org/10.1177/1468087414561482 Behçet, R., Oktay, H., Çakmak, A., & Aydin, H. (2015). Comparison of exhaust emissions of biodiesel-diesel fuel blends produced from animal fats. Renewable and Sustainable Energy Reviews, Vol. 46, pp. 157–165. Elsevier Ltd. Cakmak, A., Kapusuz, M., Ganiyev, O., & Ozcan, H. (2018). Effects of Methyl Acetate as Oxygenated Fuel Blending on Performance and Emissions of SI Engine. Environmental and Climate Technologies, 22(1), 55–68. https://doi.org/10.2478/rtuect-2018-0004 Chang, J.-S., & Chen, D.-H. (2011). Optimization on the etherification of glycerol with tert-butyl alcohol. Journal of the Taiwan Institute of Chemical Engineers, 42(5), 760–767. https://doi.org/10.1016/J.JTICE.2011.02.011 Frusteri, F., Arena, F., Bonura, G., Cannilla, C., Spadaro, L., & Di Blasi, O. (2009a). Catalytic etherification of glycerol by tert-butyl alcohol to produce oxygenated additives for diesel fuel. Applied Catalysis A: General, 367(1–2), 77–83. https://doi.org/10.1016/J.APCATA.2009.07.037 Frusteri, F., Arena, F., Bonura, G., Cannilla, C., Spadaro, L., & Di Blasi, O. (2009b). Catalytic etherification of glycerol by tert-butyl alcohol to produce oxygenated additives for diesel fuel. Applied Catalysis A: General, 367(1–2), 77–83. https://doi.org/10.1016/J.APCATA.2009.07.037 Frusteri, F., Cannilla, C., Bonura, G., Spadaro, L., Mezzapica, A., Beatrice, C., … Guido, C. (2013). Glycerol Ethers Production and Engine Performance with Diesel/Ethers Blend. Topics in Catalysis, 56(1–8), 378–383. https://doi.org/10.1007/s11244-013-9983-7 IEA. (2018). Key World Energy Statistics 2018. Retrieved from https://webstore.iea.org/key-world-energy-statistics-2018 Karinen, R. S., & Krause, A. O. I. (2006). New biocomponents from glycerol. Applied Catalysis A: General, 306, 128–133. https://doi.org/10.1016/j.apcata.2006.03.047 Kaul, S., Behera, B., Negi, M. S., Porwal, J., Kanojia, P., Tripathi, D., … Bangwal, D. (2015). Efficacy of a bio-additive on the exhaust emissions of petrodiesel. Biomass Conversion and Biorefinery, 5(4), 387–395. https://doi.org/10.1007/s13399-014-0155-1 Kiatkittipong, W., Intaracharoen, P., Laosiripojana, N., Chaisuk, C., Praserthdam, P., & Assabumrungrat, S. (2011). Glycerol ethers synthesis from glycerol etherification with tert-butyl alcohol in reactive distillation. Computers & Chemical Engineering, 35(10), 2034–2043. https://doi.org/10.1016/J.COMPCHEMENG.2011.01.016 Klepáčová, K., Mravec, D., & Bajus, M. (2006). Etherification of glycerol with tert-butyl
UEMK 2019 Proceedings Book 24/25 October 2019 Gaziantep University, TURKEY
150
alcohol catalysed by ion-exchange resins. Chemical Papers, 60(3), 224–230. https://doi.org/10.2478/s11696-006-0040-x Klepáčová, Katarína, Mravec, D., Bajus, M., & Klepáčová, K., Mravec, D., & Bajus, M. (2005). tert-Butylation of glycerol catalysed by ion-exchange resins. Applied Catalysis A: General, 294(2), 141-147. https://doi.org/10.1016/J.APCATA.2005.06.027 Klepáþová, K., Mravec, D., Hajekova, E., & Bajus, M. (2003). Etherification of glycerol. Petroleum and Coal, 45, 1-2. Noureddini, Hossein; Dailey, W R.; and Hunt, B. A. (1998). Production of ethers of glycerol from crude glycerol - The by-product of biodiesel production. Papers in Biomaterials., 18, 1–14. Retrieved from https://digitalcommons.unl.edu/cgi/viewcontent.cgi?article=1019&context=chemeng_biomaterials OECD/FAO. (2018). OECD Agriculture statistics (database). Retrieved from http://dx.doi.org/10.1787/agr-outl-data-en. Ozbay, N., Oktar, N., Dogu, G., & Dogu, T. (2010). Conversion of Biodiesel By-Product Glycerol to Fuel Ethers over Different Solid Acid Catalysts. International Journal of Chemical Reactor Engineering, 8(1). https://doi.org/10.2202/1542-6580.2149 Ozbay, N., Oktar, N., Dogu, G., & Dogu, T. (2013). Activity Comparison of Different Solid Acid Catalysts in Etherification of Glycerol with tert-Butyl Alcohol in Flow and Batch Reactors. Topics in Catalysis, 56(18–20), 1790–1803. https://doi.org/10.1007/s11244-013-0116-0 Phillips, S., Flach, B., Lieberz, S., Lappin, J., & Bolla, S. (2018). EU Biofuels Annual 2018. Retrieved from https://gain.fas.usda.gov/Recent GAIN Publications/Biofuels Annual_The Hague_EU-28_7-3-2018.pdf Rahmat, N., Abdullah, A. Z., & Mohamed, A. R. (2010). Recent progress on innovative and potential technologies for glycerol transformation into fuel additives: A critical review. Renewable and Sustainable Energy Reviews, 14(3), 987–1000. https://doi.org/10.1016/J.RSER.2009.11.010 Singh, S. P., & Singh, D. (2010). Biodiesel production through the use of different sources and characterization of oils and their esters as the substitute of diesel: A review. Renewable and Sustainable Energy Reviews, 14(1), 200–216. https://doi.org/10.1016/j.rser.2009.07.017 Spooner-Wyman, J. K., Appleby, D. B., Yost, D. M., Rahmat, N., Abdullah, A. Z., & Mohamed, A. R. (2010). Recent progress on innovative and potential technologies for glycerol transformation into fuel additives: A critical review. Renewable and Sustainable Energy Reviews, 14(3), 987–1000. https://doi.org/10.1016/J.RSER.2009.11.010 Viswanadham, N. and Saxena, S. K. (2013). Etherification of glycerol for improved production of oxygenates. Elsevier. Retrieved from https://www.sciencedirect.com/science/article/pii/S0016236112004772 Viswanadham, Nagabhatla, & Saxena, S. K. (2013). Etherification of glycerol for improved production of oxygenates. Fuel, 103, 980–986. https://doi.org/10.1016/J.FUEL.2012.06.057.

UEMK 2019 Proceedings Book 24/25 October 2019 Gaziantep University, TURKEY
151

UEMK 2019 Proceedings Book 24/25 October 2019 Gaziantep University, TURKEY
152
TEMPERATURE DEPENDENT DYNAMIC VISCOSITY OF VEGETABLE OIL-BIODIESEL
BLENDS
Mert Gülüm Department of Mechanical Engineering, Karadeniz Technical University [email protected] Abdülvahap ÇAKMAK Department of Motor Vehicles and Transportation Technologies, Kavak Vocational School, Samsun University [email protected] Atilla BİLGİN Department of Mechanical Engineering, Karadeniz Technical University [email protected] ABSTRACT: Vegetable oils can be considered as an alternative or emergency fuel for diesel engine due to the oxygen content in the molecular structure and biodegradability, renewability and superior lubrication properties. However, vegetable oils result in operational and durability problems for the long-term operation because of being much more viscous than diesel fuel. To overcome this drawback, the blending of vegetable oils with diesel fuel or alcohol is one of the most widely used techniques. Therefore, in this study, (1) corn oil biodiesel (COB) was produced by the transesterification reaction, (2) corn oil (CO) was mixed with corn oil biodiesel on the volume basis of 10%, 15%, 20%, 30% and 40%, (3) dynamic viscosities the binary blends were measured at different temperatures (10-70) according to DIN 53015, (4) the variations in viscosity of binary blends vs. temperature were evaluated, and (5) the rational model as a function of temperature were fitted to the experimental data measured by the authors. According to results, the best correlation was obtained by the rational model with the low error of 1.2115% and the high minimum R2 value of 0.9993. Keywords: Corn oil, Biodiesel, Viscosity, Binary blends, Rational model INTRODUCTION Increase in demand for energy to satisfy the need for modernization of the world has resulted in the depletion of fossil fuel reserve along with increased global temperature and anthropogenic climate change (Owusu & Asumadu-Sarkodie, 2016). This present global scenario has risked the inventory of fossil fuel resources and has pushed the planet to rely on renewable energy sources (Höök & Tang, 2013). Biodiesel is one such promising
UEMK 2019 Proceedings Book 24/25 October 2019 Gaziantep University, TURKEY
153
renewable biofuel which is known for its environmental friendliness, non-toxicity, non-aromatic, high biodegradability and improved combustibility along with reduced emissions of HC, CO, and PM (Srinivasan, Shankar, & Jambulingam, 2019). Moreover, the continuous use of petroleum increases the amount of carbon dioxide released into the atmosphere. However, if pure or blend biodiesel is used as fuel, the amount of released carbon dioxide can be reduced (Çakmak & Bilgin, 2017; Srinivasan et al., 2019). Generally, the transesterification process is used for the production of biodiesel. In this process, vegetable oil or animal fat is treated with alcohol in the presence of a catalyst at a particular reaction time and temperature (Srinivasan et al., 2019). Viscosity is one of the most significant fuel properties because it affects atomization quality, the size of fuel droplets and jet penetration, all of which affect the quality of combustion. High viscosity causes poor fuel atomization and incomplete combustion increases engine deposits, requires more power to pump the fuel, and causes more problems in cold weather, as viscosity increases with decreasing temperature. Viscosity also affects injectors and fuel pump lubrications (Mert Gülüm & Bilgin, 2017). For the correct development of the models which can be used the engine combustion, it is required the knowledge of the thermophysical properties (such as viscosity) of biodiesel blends (Ramírez-Verduzco, 2011). In addition, given the difficulty of obtaining the basic properties of the blends by measurement, the ability to calculate these properties using regression models is very useful (Candeia et al., 2009). Although the measurements or predictions of the viscosity of pure biodiesel or blends are not new, we have focused either on a specific type of biodiesel fuel or on vegetable oil-biodiesel blends. At present, no report is available on deriving regression equations for the viscosities of the corn oil-corn oil biodiesel. The objectives of this study were to address these issues. MATERIALS and METHODS The transesterification reaction for producing biodiesel was performed with the molar ratio of methanol to the oil of 9:1 and catalyst (NaOH) concentration of 0.90% for 60 minutes at 50 and atmospheric pressure with a continuous stirring speed of 500 rpm. It shall be noted here that the optimum reaction parameters were previously determined by the author (Gülüm, 2014; Gülüm, Bilgin, & Çakmak, 2015) to produce COB having the lowest viscosity. Dynamic viscosities of corn oil-corn oil biodiesel (CO-COB) (CO10COB-CO40COB) were measured at several temperatures (10-70) using Haake Falling Ball Viscometer, Haake Water Bath and stopwatch in accordance with DIN 53015 standard. The viscosity measurements were performed three times for each sample, and the results were averaged. More details on dynamic viscosity can be also found in the author’s previous study (Mert Gülüm & Bilgin, 2016).
UEMK 2019 Proceedings Book 24/25 October 2019 Gaziantep University, TURKEY
154
RESULTS AND FINDINGS Figure 1 illustrates the comparisons between the experimental data and calculated values of dynamic viscosities of corn oil-corn oil biodiesel binary blends according to temperature. The calculated results show similar patterns with the experimental data for all blends measured by the authors: the binary blends demonstrate nonlinearity temperature dependence behavior, and at a fixed temperature increase of oil fraction in blend increases viscosity since the viscosity of the oil is greater than that of biodiesel. As the temperature increases, the average intermolecular forces decrease which in turn reduce the resistance to follows and result in lower viscosity. In these figures, the symbols show viscosity data measured by the authors at the corresponding temperature and oil fraction while the lines correspond calculated values from the regression model. The rational model (Eq. 1) was suggested to predict the viscosity variation with temperature for different corn oil-corn oil biodiesel binary blends. The mathematical form of the rational model was given as respectively:
𝜇(𝑇) = (𝑎 + 𝑇)/(𝑏 + 𝑐 ∙ 𝑇) (1) where T is blend temperature (K), and a, b and c are regression constants. It can be seen that the rational model successfully represents the viscosity variation vs. temperature throughout all studied temperature in terms of qualitative behavior. In other words, the calculated values from the rational model are close to the measurements. Table 1 lists dynamic viscosity data of the binary blends measured by the authors, percent relative errors between measured data and calculated values from Eq. (1), and regression constants and correlation coefficients (R2). The maximum errors coming from Eq. (1) were computed as 1.2115% and 0.9469 with the minimum R2 value of 0.9993, respectively. These results show that the rational model (Eq. 1) developed to describe the variation in viscosity as a function of temperature shows an excellent agreement with the experimental dynamic viscosity data in terms of quantitative behavior.
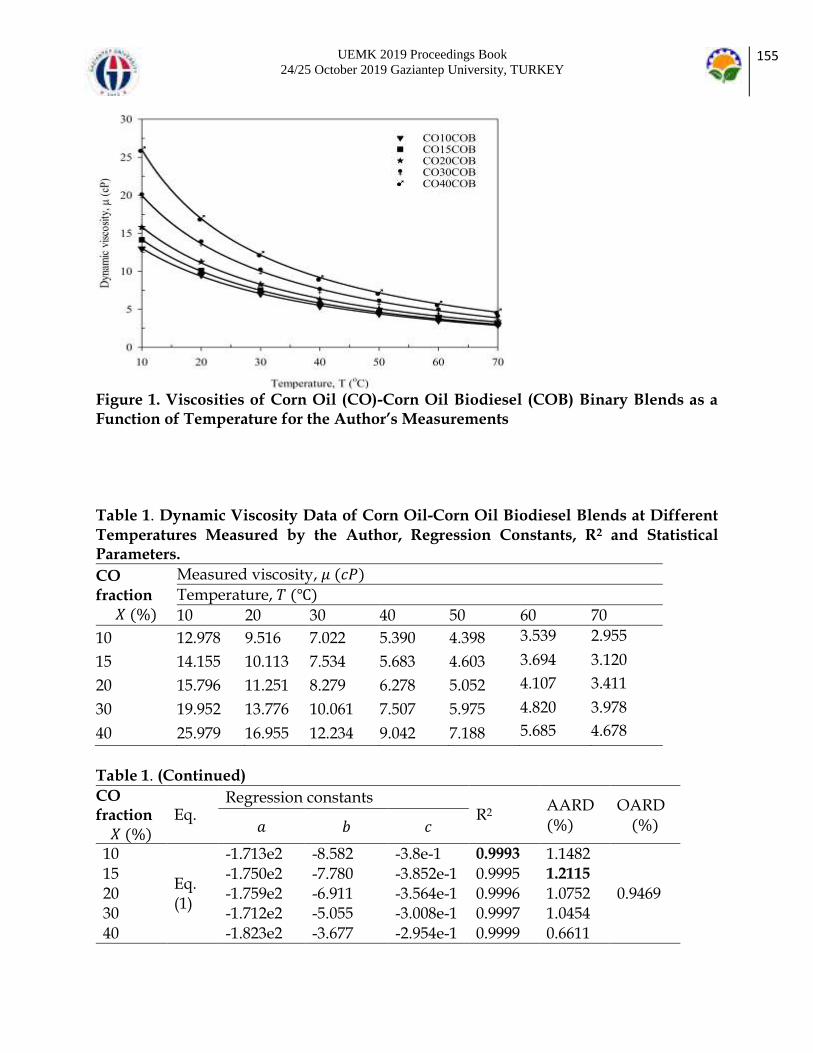
UEMK 2019 Proceedings Book 24/25 October 2019 Gaziantep University, TURKEY
155
Figure 1. Viscosities of Corn Oil (CO)-Corn Oil Biodiesel (COB) Binary Blends as a Function of Temperature for the Author’s Measurements Table 1. Dynamic Viscosity Data of Corn Oil-Corn Oil Biodiesel Blends at Different Temperatures Measured by the Author, Regression Constants, R2 and Statistical Parameters.
CO fraction 𝑋 (%)
Measured viscosity, 𝜇 (𝑐𝑃)
Temperature, 𝑇 ()
10 20 30 40 50 60 70
10 12.978 9.516 7.022 5.390 4.398 3.539 2.955
15 14.155 10.113 7.534 5.683 4.603 3.694 3.120
20 15.796 11.251 8.279 6.278 5.052 4.107 3.411
30 19.952 13.776 10.061 7.507 5.975 4.820 3.978
40 25.979 16.955 12.234 9.042 7.188 5.685 4.678
Table 1. (Continued)
CO fraction 𝑋 (%)
Eq. Regression constants
R2 AARD (%)
OARD (%) 𝑎 𝑏 𝑐
10
Eq. (1)
-1.713e2 -8.582 -3.8e-1 0.9993 1.1482
0.9469 15 -1.750e2 -7.780 -3.852e-1 0.9995 1.2115
20 -1.759e2 -6.911 -3.564e-1 0.9996 1.0752 30 -1.712e2 -5.055 -3.008e-1 0.9997 1.0454 40 -1.823e2 -3.677 -2.954e-1 0.9999 0.6611
UEMK 2019 Proceedings Book 24/25 October 2019 Gaziantep University, TURKEY
156
𝐴𝐴𝑅𝐷(%) = ∑𝐴𝑅𝐷𝑖(%)
𝑛
𝑛𝑖=1 , 𝑂𝐴𝑅𝐷(%) =
1
𝑁𝑠∑ 𝐴𝐴𝑅𝐷(%)𝑛 where n is the number of
experimental data points of a given blend at various temperature and 𝑁𝑠 is the number of systems being investigated. CONCLUSION In this study, the variation in viscosity corn oil-corn oil biodiesel binary blends with respect to temperature was determined. Viscosity measurements were performed according to DIN 53015 standards. The rational model, previously suggested by the authors, was fitted to the viscosity data of corn oil-corn oil biodiesel binary blends measured by the authors. According to results, the rational model is determined to be the better predictor since the low error values arising from the rational model were determined as 1.2115% and 0.9469%. REFERENCES Çakmak, A., & Bilgin, A. (2017). Performance and Emissions of a Single Cylinder CI Engine Running on Corn Oil Methyl Ester-Diesel Blends. Journal of Clean Energy Technologies, 5(4), 280–284. https://doi.org/10.18178/JOCET.2017.5.4.383 Candeia, R. A., Silva, M. C. D., Carvalho Filho, J. R., Brasilino, M. G. A., Bicudo, T. C., Santos, I. M. G., & Souza, A. G. (2009). Influence of soybean biodiesel content on basic properties of biodiesel–diesel blends. Fuel, 88(4), 738–743. https://doi.org/10.1016/J.FUEL.2008.10.015 Gülüm, M. (2014). Experimental investigation of the effect of various production parameters on the some fuel properties of produced biodiesels from corn and hazelnut oils. Karadeniz Technical University. Gülüm, Mert, & Bilgin, A. (2016). Two-term power models for estimating kinematic viscosities of different biodiesel-diesel fuel blends. Fuel Processing Technology, 149, 121–130. https://doi.org/10.1016/J.FUPROC.2016.04.013 Gülüm, Mert, & Bilgin, A. (2017). Measurements and empirical correlations in predicting biodiesel-diesel blends’ viscosity and density. Fuel, 199, 567–577. https://doi.org/10.1016/J.FUEL.2017.03.001 Gülüm, Mert, Bilgin, A., & Çakmak, A. (2015). Comparıson of optımum reactıon parameters of corn oıl bıodıesels produced by usıng sodıum hydroxıde ( NAOH ) and potassıum hydroxıde ( KOH ). Journal of the Faculty of Engineering and Architecture of Gazi University., 30(3), 503–511. Höök, M., & Tang, X. (2013). Depletion of fossil fuels and anthropogenic climate change—A review. Energy Policy, 52, 797–809. https://doi.org/10.1016/J.ENPOL.2012.10.046 Owusu, P. A., & Asumadu-Sarkodie, S. (2016). A review of renewable energy sources, sustainability issues and climate change mitigation. Cogent Engineering, 3(1). https://doi.org/10.1080/23311916.2016.1167990 Ramírez-Verduzco, L. F., García-Flores, B. E., Rodríguez-Rodríguez, J. E., & del Rayo

UEMK 2019 Proceedings Book 24/25 October 2019 Gaziantep University, TURKEY
157
Jaramillo-Jacob, A. (2011). Prediction of the density and viscosity in biodiesel blends at various temperatures. Fuel, 90(5), 1751–1761. https://doi.org/10.1016/J.FUEL.2010.12.032 Srinivasan, G. R., Shankar, V., & Jambulingam, R. (2019). Experimental study on influence of dominant fatty acid esters in engine characteristics of waste beef tallow biodiesel. Energy Exploration & Exploitation, 37(3), 1098–1124. https://doi.org/10.1177/0144598718821791.

UEMK 2019 Proceedings Book 24/25 October 2019 Gaziantep University, TURKEY
158
INVESTIGATION THE EFFECT OF TEMPERATURE ON DENSITIES OF CORN OIL (CO)-DIESEL FUEL (DF) BLENDS Mert Gülüm Department of Mechanical Engineering, Karadeniz Technical University [email protected] Abdülvahap ÇAKMAK Department of Motor Vehicles and Transportation Technologies, Kavak Vocational School, Samsun University [email protected] Atilla BİLGİN Department of Mechanical Engineering, Karadeniz Technical University [email protected] ABSTRACT: Fuel crisis because of a dramatic increase in vehicular population and environmental concerns have renewed interest in the scientific community to look for alternative fuels of bio-origin such as vegetable oils. Vegetable oils have become more attractive recently because of its environmental benefits and the fact that it is made from renewable resources. In this study, densities of corn oil-commercially available petrodiesel fuel blends have been investigated. The effect of temperature on the densities of blends was examined. The blends (CO10DF, CO15DF, CO30DF, and CO40DF) were prepared on a volume basis and their densities were measured by following ISO test method between 278.15 K-368.15 K. Regression equations were fitted to the measurements for identifying of variations of densities with respect to temperature Keywords: Corn oil, Density, Diesel, Regression equations INTRODUCTION The scarcity of conventional fossil fuels and the concern of environmental protection, the utilization of biofuel from bio-renewable resources have attracted increasing worldwide interest. With recent increases in petroleum prices, there is renewed interest in vegetable oil and their derivatives as alternative fuels for diesel engines. As an alternative fuel vegetable oil is one of the renewable fuels. Vegetable oils have become more attractive recently because of its environmental benefits and the fact that it is made from renewable resources (Behçet, Oktay, Çakmak, & Aydin, 2015; Demirbas, 2008). When Rudolf Diesel invented the diesel engine more than a century ago, he demonstrated the principle of compression ignition engine by employing peanut oil as fuel and suggested that
UEMK 2019 Proceedings Book 24/25 October 2019 Gaziantep University, TURKEY
159
vegetable oils would be the future fuel for diesel engines. However, petroleum was discovered later, which replaced vegetable oils as engine fuel due to its abundant supply and low price (Agarwal, Kumar, & Agarwal, 2008). The major problem associated with the use of pure vegetable oils as fuels, for Diesel engines is caused by high fuel viscosity and density in compression ignition and resulting injector fouling and other engine problems. The disadvantages of vegetable oils as diesel fuel are: (a) higher density, (b) higher viscosity, (c) higher pour point, (d) higher flash point, (e) higher cloud point, (f) higher density, and (g) the reactivity of unsaturated hydrocarbon chains (Demirbas, 2008). As the use of vegetable oil becomes more widespread, researchers have shown a strong interest in modeling the combustion process in the engine in order to understand the fundamental characteristics of vegetable oil combustion. They often use physical properties (such as density) of vegetable oil as input data in their combustion models. Regression equations as a function of temperature, percentage of blend and the chemical structure have been generally used to calculate these properties without measurements (Gülüm & Bilgin, 2016; Ramírez-Verduzco, 2011). The main objective of the present study is to investigate the effect of temperature (T) on the densities of corn oil (CO)-diesel fuel (DF) blends. Therefore five corn oil-diesel fuel samples were prepared by mixing the corn oil with commercially available Ultra Force Euro Diesel fuel on a volume base of %10, %15, %30 and %40 and the resulted fuel samples were labeled as CO10DF, CO15DF, CO30DF, and CO40DF, respectively. In addition, a regression equation was fitted to the measurements to estimate their densities METHODS Density measurement The densities of CO10DF, CO15DF, CO30DF, and CO40DF were determined at different temperatures (278.15 K-368.15 K) by means of Eq. (1) and measurements in accordance with ISO 4787 standard:
𝜌𝑏𝑙𝑒𝑛𝑑𝑠 =𝑚𝑡𝑜𝑡𝑎𝑙 −𝑚𝑝𝑦𝑐𝑛𝑜𝑚𝑒𝑡𝑒𝑟
𝑚𝑤𝑎𝑡𝑒𝑟𝜌𝑤𝑎𝑡𝑒𝑟 (1)
where ρ and m represent density and mass, respectively. In order to minimize measurement errors, all the measurements were conducted three times for each sample and the results were averaged. Also, an uncertainty analysis was carried out depending on the sensitivities of measurement devices. Uncertainty analysis The results obtained from experimental studies are generally calculated from measured physical quantities. These quantities have some uncertainties due to uncertainties of measuring tools and measurement systems. Therefore, uncertainty analysis should be

UEMK 2019 Proceedings Book 24/25 October 2019 Gaziantep University, TURKEY
160
applied to proving the reliability of the calculated results. In this study, uncertainties of the measured density values were determined by the method proposed by Kline and McClintock given in According to this method (Holman, 2001), if the result R is a given
function of the independent variables x2, x2, x3, .., xn and w1, w2, w3, …, wn are the uncertainties of each independent variables, then the uncertainty of the result wR is calculated by using the equation:
𝑤𝑅 = [(𝜕𝑅
𝜕𝑥1∙ 𝑤1)
2
+ (𝜕𝑅
𝜕𝑥2∙ 𝑤2)
2
+ (𝜕𝑅
𝜕𝑥3∙ 𝑤3)
2
+⋯+ (𝜕𝑅
𝜕𝑥𝑛∙ 𝑤𝑛)
2
]
1/2
(2)
According to Eq. (2), the highest uncertainty for measured densities was determined as 0.0417%, which means that the results are highly reliable. RESULTS AND FINDINGS Figure 1 shows the effects of temperature on densities of corn oil-diesel fuel blends. As shown in the figure, the densities, as expected, decrease with increasing temperature and there are similar trends for all fuels and the blends in the studied temperature range. According to the distributions of measured data, the following exponential model was tried to represent the variations of densities with temperature. The exponential model:
𝜌 = 𝜌(𝑇) = 𝑎𝑒𝑏𝑇 + 𝑐e𝑑𝑇 (3) where T is the temperature in K and a, b, c, and d are regression constants. Table 1 lists the measured and calculated (from Eq. (3)) densities of the blends, % errors between them, regression constants and correlation coefficients. For the exponential model, the maximum error was computed as 0.0875%. The minimum R value is 0.9998 for the exponential model. According to these results, the qualitatively and quantitatively the best agreement of the calculated and measured density values is captured by the exponential model for the investigated temperature ranges.

UEMK 2019 Proceedings Book 24/25 October 2019 Gaziantep University, TURKEY
161
Figure 1. Variation of the Density of Corn Oil-Diesel Fuel Blends with Respect to Temperature Table 1. The measured density data, relative errors, and regression constants and correlation coefficients of the exponential model
Oil fraction 𝑋 (%)
Measured, 𝜌 (𝑘𝑔 𝑚3)⁄
Temp., 𝑇 (𝐾)
278.15 283.15 288.15 293.15 298.15 303.15 308.15 313.15 318.15
10 840.50 840.29 839.66 838.81 837.98 837.15 835.49 833.82 832.17
15 844.09 843.88 843.25 842.41 841.57 840.73 839.06 837.39 835.74
30 857.49 857.27 856.63 855.77 854.92 854.07 852.37 850.68 849.00
40 866.88 866.66 866.01 865.15 864.29 863.43 861.71 860.00 858.30
Table 1. (Continued)
Oil fraction 𝑋 (%)
Measured, ρ (kg/m3)
Temperature, T (K)
323.15 328.15 333.15 338.15 343.15 348.15 353.15 358.15 363.15 368.15
10 830.53 828.07 826.44 824.01 821.60 819.20 816.81 813.64 811.29 808.17 15 834.08 831.62 829.98 827.54 825.15 822.70 820.31 817.12 814.76 811.63 30 847.32 844.81 843.15 840.67 838.21 835.76 833.32 830.09 827.69 824.51 40 856.60 854.07 852.39 849.88 847.39 844.91 842.45 839.18 836.76 833.54
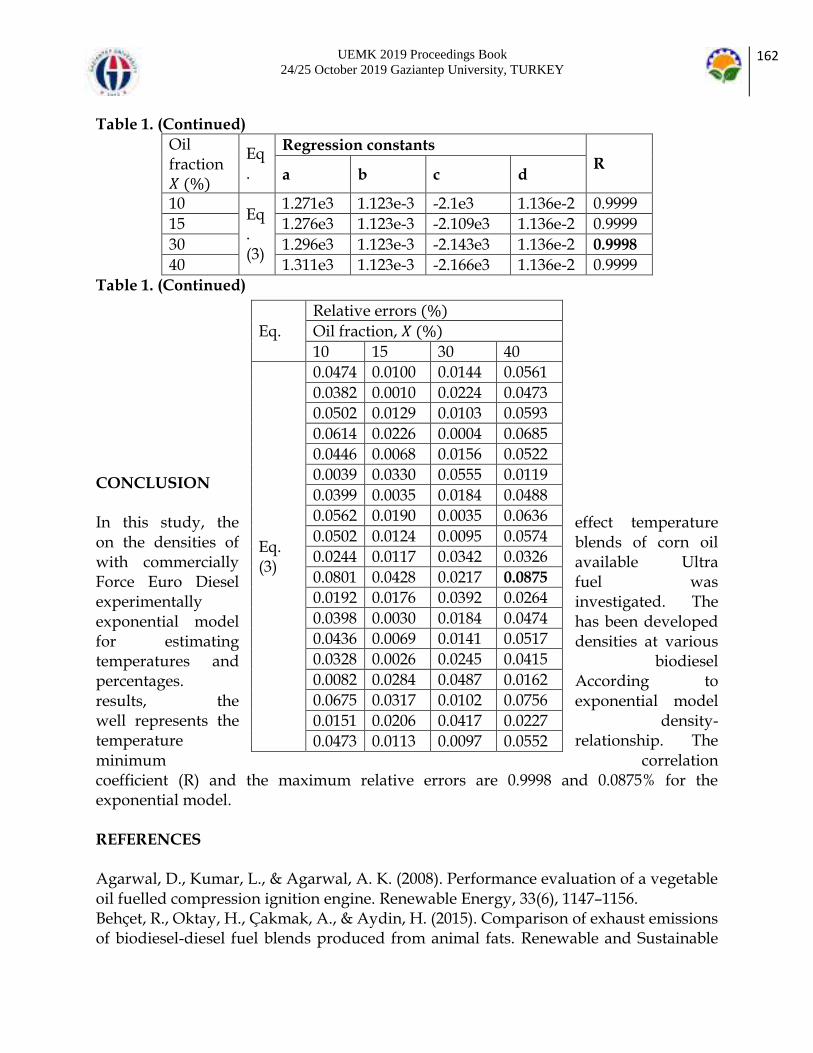
UEMK 2019 Proceedings Book 24/25 October 2019 Gaziantep University, TURKEY
162
Table 1. (Continued)
Oil fraction 𝑋 (%)
Eq.
Regression constants R
a b c d
10 Eq. (3)
1.271e3 1.123e-3 -2.1e3 1.136e-2 0.9999
15 1.276e3 1.123e-3 -2.109e3 1.136e-2 0.9999
30 1.296e3 1.123e-3 -2.143e3 1.136e-2 0.9998
40 1.311e3 1.123e-3 -2.166e3 1.136e-2 0.9999
Table 1. (Continued) CONCLUSION In this study, the effect temperature on the densities of blends of corn oil with commercially available Ultra Force Euro Diesel fuel was experimentally investigated. The exponential model has been developed for estimating densities at various temperatures and biodiesel percentages. According to results, the exponential model well represents the density-temperature relationship. The minimum correlation coefficient (R) and the maximum relative errors are 0.9998 and 0.0875% for the exponential model. REFERENCES Agarwal, D., Kumar, L., & Agarwal, A. K. (2008). Performance evaluation of a vegetable oil fuelled compression ignition engine. Renewable Energy, 33(6), 1147–1156. Behçet, R., Oktay, H., Çakmak, A., & Aydin, H. (2015). Comparison of exhaust emissions of biodiesel-diesel fuel blends produced from animal fats. Renewable and Sustainable
Eq.
Relative errors (%)
Oil fraction, 𝑋 (%)
10 15 30 40
Eq. (3)
0.0474 0.0100 0.0144 0.0561
0.0382 0.0010 0.0224 0.0473
0.0502 0.0129 0.0103 0.0593
0.0614 0.0226 0.0004 0.0685
0.0446 0.0068 0.0156 0.0522
0.0039 0.0330 0.0555 0.0119
0.0399 0.0035 0.0184 0.0488
0.0562 0.0190 0.0035 0.0636
0.0502 0.0124 0.0095 0.0574
0.0244 0.0117 0.0342 0.0326
0.0801 0.0428 0.0217 0.0875
0.0192 0.0176 0.0392 0.0264
0.0398 0.0030 0.0184 0.0474
0.0436 0.0069 0.0141 0.0517
0.0328 0.0026 0.0245 0.0415
0.0082 0.0284 0.0487 0.0162
0.0675 0.0317 0.0102 0.0756
0.0151 0.0206 0.0417 0.0227
0.0473 0.0113 0.0097 0.0552

UEMK 2019 Proceedings Book 24/25 October 2019 Gaziantep University, TURKEY
163
Energy Reviews, Vol. 46, pp. 157–165. Demirbas, A. (2008). Relationships derived from physical properties of vegetable oil and biodiesel fuels. Fuel, 87(8–9), 1743–1748. https://doi.org/10.1016/J.FUEL.2007.08.007 Gülüm, M., & Bilgin, A. (2016). Two-term power models for estimating kinematic viscosities of different biodiesel-diesel fuel blends. Fuel Processing Technology, 149, 121–130. Holman, J. P. (2001). Experimental methods for engineers. In McGraw-Hill series in mechanical engineering (7th ed.). Boston. Ramírez-Verduzco, L. F., García-Flores, B. E., Rodríguez-Rodríguez, J. E., & del Rayo Jaramillo-Jacob, A. (2011). Prediction of the density and viscosity in biodiesel blends at various temperatures. Fuel, 90(5), 1751–1761. https://doi.org/10.1016/J.FUEL.2010.12.032.

UEMK 2019 Proceedings Book 24/25 October 2019 Gaziantep University, TURKEY
164
UNDERGRADUATE INDUSTRIAL CONTROL LABORATORY EXPERIMENTAL SETUP: PART 2 TEMPERATURE CONTROL WITH PLC Cengiz TEPE Electronic and Electrical Engineering Ondokuz Mayıs University [email protected] Ertuğrul Furkan SAVAŞTAER Electronic and Electrical Engineering Ondokuz Mayıs University [email protected] İlyas EMİNOĞLU Electronic and Electrical Engineering Ondokuz Mayıs University [email protected] ABSTRACT: In this study, industrial temperature control experiment setup that teaches the use of PLC is introduced for the students who take industrial automation course and their contributions are explained to the students. Temperature control with PLC is one of the widely used applications in the industry. Therefore, in this study, it is aimed to teach students how to control temperature with PLC. The temperature of the resistance in the water tank is controlled by s7 1200 PLC. The control and monitoring of the reference and output temperature of the system is carried out via the human-machine interface. The temperature of the water is continuously measured by the PT100 temperature sensor and transferred to the PLC. Thanks to PID algorithm in PLC, water temperature is kept at reference value. The human-machine interface can also be used to observe the arrival of the water temperature to the reference value. All of the devices used in this study are widely used in industrial automation systems today. With this experiment, electrical-electronic, control, mechatronics and mechanical engineering students gain professional experience and knowledge before starting their business life. Key words: PLC, temperature control, industrial automation, PID, control engineering. LİSANS ENDÜSTRİYEL KONTROL LABORATUVARI DENEY DÜZENEĞİ: BÖLÜM 2 PLC İLE SICAKLIK DENETİMİ
UEMK 2019 Proceedings Book 24/25 October 2019 Gaziantep University, TURKEY
165
ÖZET: Bu çalışmada endüstriyel otomasyon dersini alan öğrenciler için PLC kullanımını öğreten endüstriyel sıcaklık denetimi deney düzeneği tanıtılmakta ve öğrencilere katkıları açıklanmaktadır. PLC ile sıcaklık kontrolü endüstride yaygın olarak kullanılan uygulamalardan bir tanesidir. Bu sebepten dolayı bu çalışmada öğrencilere PLC ile sıcaklık kontrolünün nasıl yapıldığının öğretilmesi amaçlanmaktadır. Gerçeklenen bu deney düzeneğinde su tankındaki rezistansın sıcaklığı s7 1200 PLC ile kontrol edilmektedir. Referans ve sistemin çıkış sıcaklığının kontrolü ve gözlemlenmesi insan-makine arayüzü üzerinden yapılmaktadır. Suyun sıcaklığı PT100 sıcaklık sensörü ile sürekli ölçülüp PLC ye aktarılır. PLC deki PID algoritması sayesinde su sıcaklığı referans değerinde tutulmaya çalışılır. İnsan-makine arayüzü ile suyun sıcaklığının referans değerine gelişi de gözlemlenebilmektedir. Bu çalışmada kullanılan cihazların tümü günümüzde endüstriyel otomasyon sistemlerinde yaygın olarak kullanılmaktadır. Yapılan bu deney düzeneği ile elektrik-elektronik, kontrol, mekatronik ve makine mühendisliği bölümü öğrencileri iş hayatlarına başlamadan önce mesleki tecrübe ve bilgi birikimi kazanmaktadırlar. Anahtar sözcükler: PLC, sıcaklık kontrolü, endüstriyel otomasyon, PID, kontrol mühendisliği GİRİŞ Günümüzde PLC ile sıcaklık kontrolü birçok endüstride yaygın olarak kullanılmaktadır. Demir-çelik gibi metallerin eritilip şekillendirilmesinde, gıda sektöründe besinlerin pişirilip dondurulmasında, tavuk çiftliklerindeki kuluçka makinalarında (Velagic, Osmic, Lutvica, & Kadic, 2010) yerlerini örnek olarak gösterebiliriz. Günümüzde sıcaklık kontrol sistemlerini tasarlamaya ve geliştirmeye yönelik birçok çalışma bulunmaktadır. Yusuf çalışmasında sıcaklık kontrolü gerekebilecek tüm sistemlerde uygulanabilecek bir otomatik kontrol sistemi tasarlamış ve simüle etmiştir. Method olarak Ziegler and Nichols PID (Proportional Integral Derivative) ayarlama metodu (Shahrokhi & Zomorrodi, 2013), PLC olarak OMRON CJIM-CPU22 ve Citect SCADA’ nın Schneider Electric v 7.3 adlı yazılımını kullanmıştır (Al Yusuf, 2018). Rata çalışmasında belli miktardaki bir sıvıyı ısıtmak için kullanılacak olan rezistansı kontrol etmek için çözümler sunmuş ve bu çözümlerin avantaj ve dezavantajlarını belirlemiştir. PLC olarak XC-CPU101 PLC, HMI olarak EATON’dan XV102 HMI ve sıcaklık sensörü olarak ta LM35 kullanmıştır (Rata & Rata, 2016). Weibin ve Qingjian çalışmalarında sıvı sıcaklığını kontrol etmek için PID kontrolü ile Bulanık kontrolü beraber kullanmışlardır. Kontrol sürecinin belli bir adımına kadar bulanık kontrol kullanılmış, sonrasında sıcaklık değeri istenen değere yaklaştığında PID kontrole geçilmiştir. Çalışmalarını MATLAB üzerinden simüle etmişlerdir (Weibin & Qingjian, 2010). Gulpanich ve arkadaşların çalışmalarında bir büyük bir de küçük endüstriyel fırının sıcaklık kontrolü deneysel olarak sağlamışlardır. İlk önce iki fırında aynı ayarlama metoduyla kontrol edilmiş (The

UEMK 2019 Proceedings Book 24/25 October 2019 Gaziantep University, TURKEY
166
Cohen-Coon PID ayarlama metodu) (Shahrokhi & Zomorrodi, 2013). Sonrasında her iki fırın içinde özelleştirilmiş kontrol yaklaşımları geliştirerek fırınların istenilen sıcaklıklara daha kısa sürede ulaşmalarını sağlamışlardır. Çalışmalarında PLC olarak Siemens S7-300’den FB58 “TCONT_CP” adlı bloğu ve sıcaklık sensörü olarak PT100 kullanmışlardır (Gulpanich, Krongratana, Srimuang, Tipsuwanporn, & Wongvanich, 2017). Velagic ve arkadaşları çalışmalarında bir kuluçka makinesi sisteminin hem simülasyonu hem de deneysel düzeneğini kurup alınan sonuçları karşılaştırmışlardır. Çalışmalarında Schneider’in Modicon M340 adlı modüler PLC’sini, NTC sıcaklık sensörünü ve Magelis XBT GT4330 adlı HMI’yı kullanmışlardır (Velagic et al., 2010). Yang ve Bian çalışmalarında bulanık kontrol ile PID kontrolünün beraber kullanılmasının sadece PID kontrolünün kullanılmasından daha verimli olduğunu deneysel olarak kanıtlanmaya çalışılmışlardır. Çalışmalarında PLC olarak Delta PLC (DVP-28SV) sıcaklık kontrolörü olarak DTC1000 kullanmışlardır (Yang & Bian, 2012). Bunların dışında bizim çalışmamızdaki gibi PLC eğitimi ihtiyacını karşılamaya yönelik çalışmalarda bulunmaktadır. Alves ve arkadaşları kurdukları PLC deney düzeneği sayesinde sıvı sıcaklığını kontrol edebilmektedirler (Alves, Brandão, & Oliveira, 2019). Bu araştırma kapsamında ise, lisans ve yüksek lisans endüstriyel kontrol laboratuvarında kullanılmak üzere PLC ile sıcaklık denetimi deney düzeneği tasarımı ve gerçeklemesi yapılmıştır. PLC ve sıcaklık denetiminin endüstri sektöründeki yaygın kullanımı ve bu bağlamda PLC kullanımını iyi bilen donanımlı mühendis ihtiyacı, öğrencilerin mezun olduktan sonra daha rahat iş bulabilmesi için bu deney düzeneğine duyulan ihtiyacın önemini ortaya koymuştur. Bu çalışmada, Siemens S7-1200 PLC, 30cm x 30cm x 50cm boyutlarında su tankı, 200 W’lık ısıtıcı, endüstriyel PT100 sıcaklık sensörü, ktp700 insan-makine arayüzü ve PID algoritması kullanılmıştır. YÖNTEM Bu çalışmada tasarlanan ve gerçeklenen deney düzeneğinin öbek çizgesi Şekil 1’de ve deney düzeneği Şekil 2’de verilmiştir. Deney düzeneğinde kullanılan devre elamanları: a) Siemens s7 1200 PLC ve Tia portal v15, b) KTP 700 HMI arayüzü, c) Su tankı ve rezistans, d) Katı hal rölesi, e) PT100 sıcaklık sensörü, f) PT100 dönüştürücüdür.
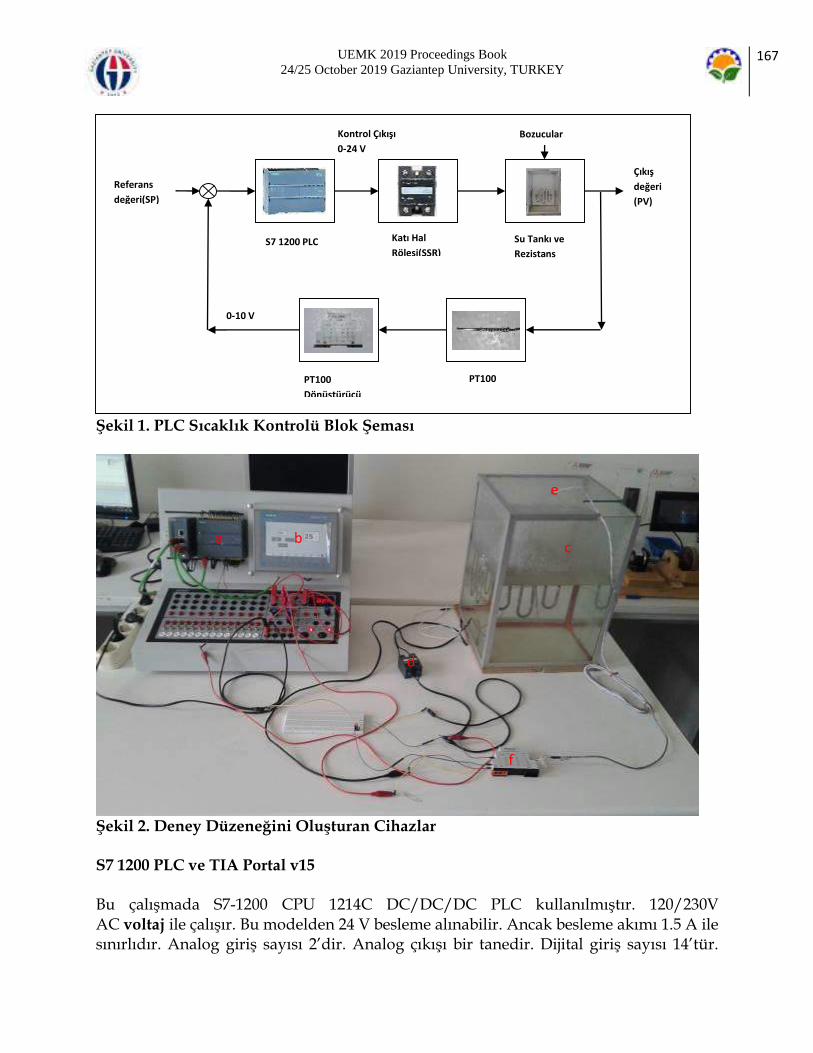
UEMK 2019 Proceedings Book 24/25 October 2019 Gaziantep University, TURKEY
167
Şekil 1. PLC Sıcaklık Kontrolü Blok Şeması
Şekil 2. Deney Düzeneğini Oluşturan Cihazlar S7 1200 PLC ve TIA Portal v15 Bu çalışmada S7-1200 CPU 1214C DC/DC/DC PLC kullanılmıştır. 120/230V AC voltaj ile çalışır. Bu modelden 24 V besleme alınabilir. Ancak besleme akımı 1.5 A ile sınırlıdır. Analog giriş sayısı 2’dir. Analog çıkışı bir tanedir. Dijital giriş sayısı 14’tür.
Referans
değeri(SP)
Çıkış
değeri
(PV)
0-10 V
Bozucular Kontrol Çıkışı
0-24 V
Su Tankı ve
Rezistans
Katı Hal
Rölesi(SSR)
PT100
Dönüştürücü
PT100
S7 1200 PLC
a
e
d
b
f
c
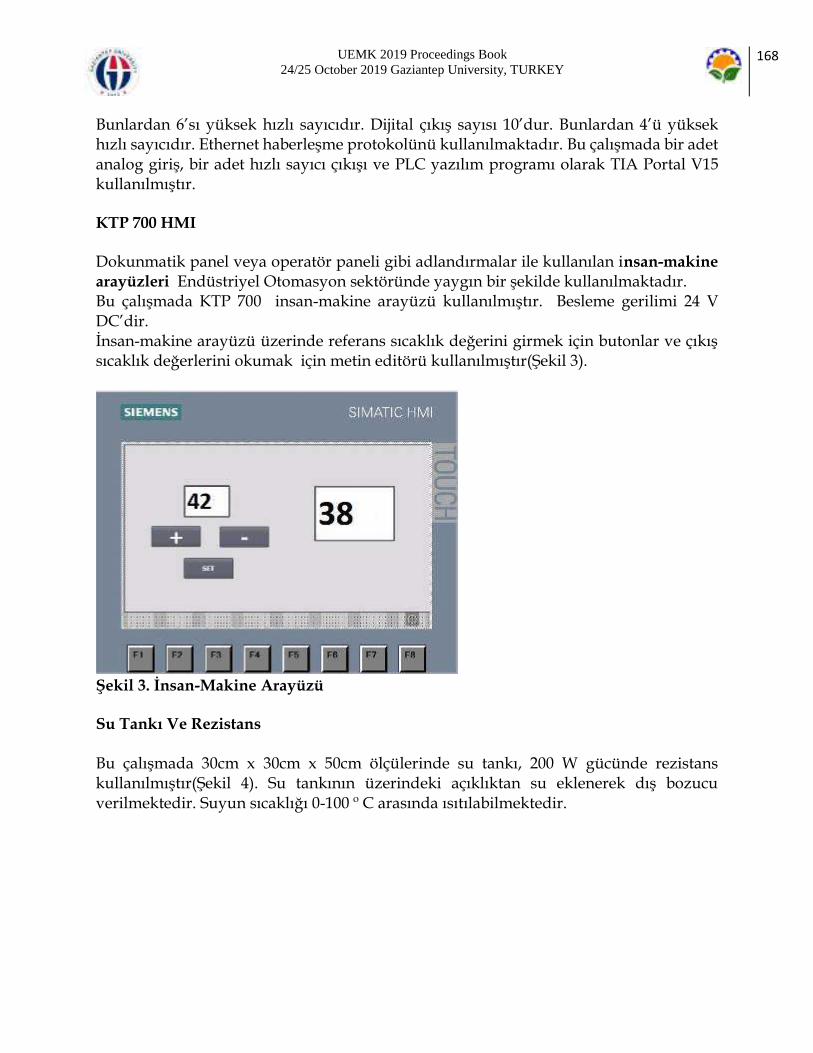
UEMK 2019 Proceedings Book 24/25 October 2019 Gaziantep University, TURKEY
168
Bunlardan 6’sı yüksek hızlı sayıcıdır. Dijital çıkış sayısı 10’dur. Bunlardan 4’ü yüksek hızlı sayıcıdır. Ethernet haberleşme protokolünü kullanılmaktadır. Bu çalışmada bir adet analog giriş, bir adet hızlı sayıcı çıkışı ve PLC yazılım programı olarak TIA Portal V15 kullanılmıştır. KTP 700 HMI Dokunmatik panel veya operatör paneli gibi adlandırmalar ile kullanılan insan-makine
arayüzleri Endüstriyel Otomasyon sektöründe yaygın bir şekilde kullanılmaktadır. Bu çalışmada KTP 700 insan-makine arayüzü kullanılmıştır. Besleme gerilimi 24 V DC’dir. İnsan-makine arayüzü üzerinde referans sıcaklık değerini girmek için butonlar ve çıkış sıcaklık değerlerini okumak için metin editörü kullanılmıştır(Şekil 3).
Şekil 3. İnsan-Makine Arayüzü Su Tankı Ve Rezistans Bu çalışmada 30cm x 30cm x 50cm ölçülerinde su tankı, 200 W gücünde rezistans kullanılmıştır(Şekil 4). Su tankının üzerindeki açıklıktan su eklenerek dış bozucu verilmektedir. Suyun sıcaklığı 0-100 º C arasında ısıtılabilmektedir.

UEMK 2019 Proceedings Book 24/25 October 2019 Gaziantep University, TURKEY
169
Şekil 4. Su Tankı Ve Rezistans Katı Hal Rölesi (SSR) Katı hal rölesi mikro elektronik ve güç elektroniği devre elemanlarından oluşan mekanik olarak temassız bir elektronik anahtardır. Katı hal rölesinin girişi, büyük bir akım yükünü sürmek için küçük bir kontrol sinyali kullanır. Deney düzeneğinde kullanılan katı hal rölesinin akımı 50 A’dir. Katı hal rölesinin bağlantı şeması Şekil 5’de gösterilmiştir.
Şekil 5. SSP1A150BDT Katı Hal Rolesi-SSR(Solid State Relay) PT100 PT100'lere Rezistans termometre adı da verilir(Şekil 6). Endüstride ve laboratuvarlarda yaygın olarak kullanılmaktadır. Özellikle hassas değer alınmak istenilen yüksek sıcaklıklarda, PT100 tercih edilirler. PT100 iletken bir telin direnç değerinin sıcaklıkla değişmesinden istifade edilerek oluşturulan bir sıcaklık algılayıcısıdır. 0 ºC devreye
Rezistans
Toprak %Q0.0
SSR

UEMK 2019 Proceedings Book 24/25 October 2019 Gaziantep University, TURKEY
170
100ohm’luk direnç uygular. Sıcaklık artışına göre değişen direnç değeriyle bulunduğu ortamdaki sıcaklık ölçülür("<pt100_datasheet.pdf>,").
Şekil 6. PT100 Sıcaklık Sensörü PT100 Dönüştürücü Kullanılan PLC de RTD modülü olmadığı için Klemsan Ascon 321 adlı PT100 dönüştürücü kullanılmıştır. Bu dönüştürücünün bağlantı şeması Şekil 7’de verilmiştir. Bu dönüştürücü ile PT100’ün sıcaklıkla değişen direnç değeri 0-10 V arası değere dönüştürülmüştür. Bu gerilim değeri giriş olarak PLC’ye verilmiştir.
Şekil 7. Klemsan ASCON 321 PT100 Dönüştürücü PLC Programı
V GND
DC+ DC- P1+
P1- P2-
Toprak
PLC
analog
giriş
Toprak
24V
PT100
kırmızı
PT100
kırmızı
PT100
beyaz
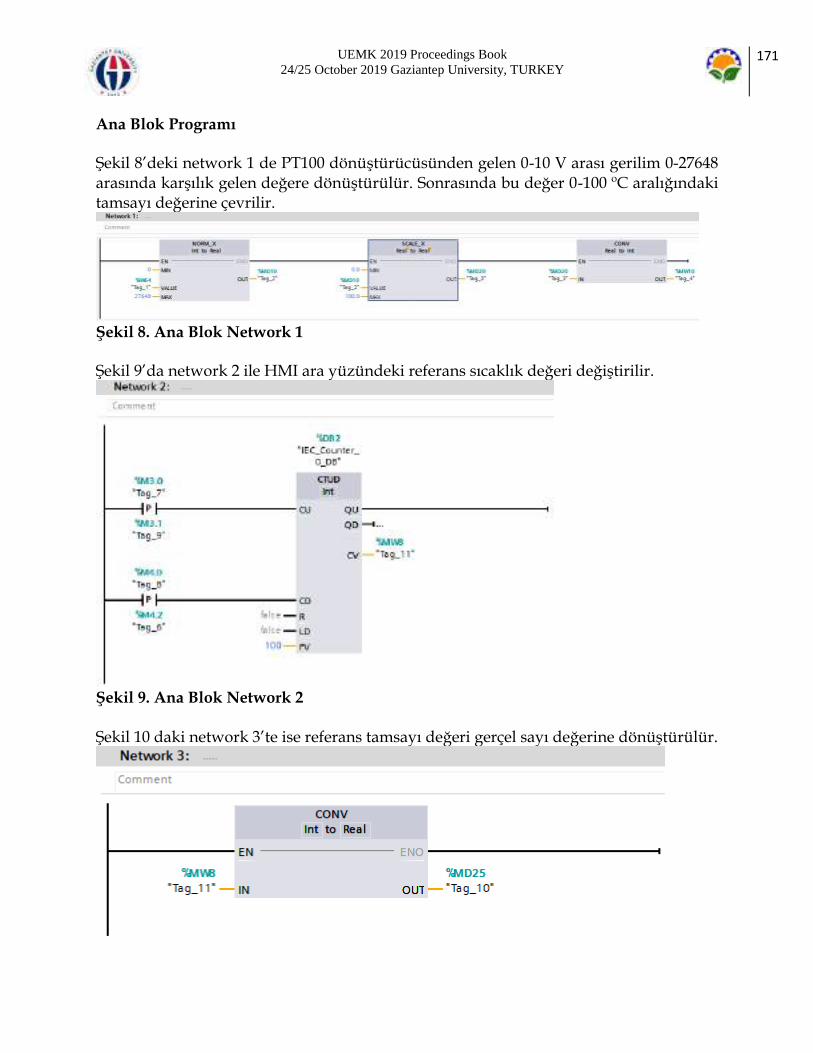
UEMK 2019 Proceedings Book 24/25 October 2019 Gaziantep University, TURKEY
171
Ana Blok Programı Şekil 8’deki network 1 de PT100 dönüştürücüsünden gelen 0-10 V arası gerilim 0-27648 arasında karşılık gelen değere dönüştürülür. Sonrasında bu değer 0-100 ºC aralığındaki tamsayı değerine çevrilir.
Şekil 8. Ana Blok Network 1 Şekil 9’da network 2 ile HMI ara yüzündeki referans sıcaklık değeri değiştirilir.
Şekil 9. Ana Blok Network 2 Şekil 10 daki network 3’te ise referans tamsayı değeri gerçel sayı değerine dönüştürülür.

UEMK 2019 Proceedings Book 24/25 October 2019 Gaziantep University, TURKEY
172
Şekil 10. Ana Blok Network 3 PID Blok Programı Şekil 11’deki network 1’de referans değerinin reel değeri ile PT100’den gelen 0-100 arası reel değer PID bloğundan geçerek SSR’a gidecek çıkışa dönüşür.
Şekil 11. PID Blok Network 1 PLC programında kullanılan etiket ve adresler Tablo 1’de verilmiştir. Tablo 1. Blok Diyagramı Etiket Ve Adresleri
Etiketler PLC Adres Açıklamaları
Tag_1 %IW64 PT100’den çıkan 0-10 V arası değerin 0-27648 arasında karşılık gelen değeri
Tag_2 %MD10 0-27648 arasındaki değerin %’lik karşılığı
Tag_3 %MD20 % değerinin reel karşılığı
Tag_4 %MW10 Reel değerin integer karşılığı
Tag_5 %Q0.0 SSR’ye giden PLC çıkışı
Tag_6 %M4.2 Referans değeri azaltma butonu bırakma
Tag_7 %M3.0 Referans değeri arttırma butonu basma
Tag_8 %M4.0 Referans değeri azaltma butonu basma
Tag_9 %M3.1 Referans değeri arttırma butonu bırakma
Tag_10 %MD25 Referans değerinin reel hali
Tag_11 %MW8 Referans değerinin integer hali

UEMK 2019 Proceedings Book 24/25 October 2019 Gaziantep University, TURKEY
173
BULGULAR Sıvı sıcaklık kontrolü deneyinde referans değeri 42 ºC ayarlanmıştır. Şekil 12’de görüldüğü üzere su tankının içindeki suyun sıcaklığı 38 ºC’ken referans değerinin 42 ºC ayarlanmasıyla yaklaşık 130 saniyede 42 ºC ulaşmıştır. 280. saniyede su tankına bozucu olarak soğuk su ilave edilmiş ve suyun sıcaklığı tekrar 33 ºC’ye düşürülmüştür. Sonrasın 325. Saniyede su sıcaklığı tekrar 42 ºC’ye ulaşmıştır. Deney düzeneğinde PID kodunda kullanılan katsayılar deneme yanılma Kp: 0.05, Ki: 0.06, Kd: 0.0 şeklinde bulunarak ayarlanmıştır.
Şekil 12. Çıkış-Referans Ve Kontrol İşareti Tablosu SONUÇ Bu çalışma, öğrencilere PLC kullanma ve program tasarlama becerilerini kazandırmayı amaçlamaktadır. Deney düzeneğindeki cihazların endüstri sektöründe yaygın olarak kullanılması öğrencilere eğitim ortamlarında öğrendiklerini iş hayatlarında uygulamalarına olanak sağlayacaktır.

UEMK 2019 Proceedings Book 24/25 October 2019 Gaziantep University, TURKEY
174
Kaynaklardaki çalışmaların bazılarında sıcaklık sensörü olarak lm35 ("<lm35_datasheet.pdf>,") kullanmıştır. Kontrol algoritması olarak PID kontrolü ile birlikte bulanık mantık (Weibin & Qingjian, 2010), (Yang & Bian, 2012) kullanılmıştır. Bu çalışmada ise endüstri sektöründe en çok tercih edilen sıcaklık sensörlerinden biri olduğu için PT100 sıcaklık sensörü kullanılmıştır. Kontrol algoritması olarak kullanımının kolay olması, iyi sonuçlar vermesi ve sanayide hala tercih edilmesi nedenlerinden dolayı PID algoritması kullanılmıştır. Bu çalışma sonucunda elektrik-elektronik, kontrol, mekatronik ve makine mühendisliği bölümü öğrencileri suyun sıcaklık denetimini, PT100 kullanımını, katı hal röle kullanımı, rezistans sürmeyi, PLC programlamayı, PLC ile analog veri girişi, PLC ile birlikte transmitter kullanmayı, PLC ile PID modülü kullanmayı kendileri uygulayarak öğrenmişlerdir. ÖNERİLER PT100 yerine başka sıcaklık sensörleri ve PID yerine farklı kontrol algoritmaları kullanılarak tekrarlanabilir. Ayrıca PLC programlamada merdiven diyagramı yerine fonksiyon blok diyagramı, komut listesi gibi programlama biçimleri kullanılarak programlanabilir. TEŞEKKÜR Bu çalışma Ondokuz Mayıs Üniversitesi tarafından Bilimsel Araştırma Projesi kapsamında desteklenmektedir (PYO.MUH.1906.17.002). Çalışmalarda destek olan lisans öğrencisi Mustafa Özçelik’e teşekkür ederiz. KAYNAKLAR Al Yusuf, S. (2018). Development of PLC and SCADA based Integrated Thermal Control System with Self/Auto-tuning Feature. Paper presented at the 2018 Condition Monitoring and Diagnosis (CMD). Alves, L. F., Brandão, D., & Oliveira, M. A. (2019). A multi-process pilot plant as a didactical tool for the teaching of industrial processes control in electrical engineering course. The International Journal of Electrical Engineering & Education, 56(1), 62-91. Gulpanich, S., Krongratana, V., Srimuang, A., Tipsuwanporn, V., & Wongvanich, N. (2017). PLC-based industrial temperature controller with different response times. Paper presented at the 2017 17th International Conference on Control, Automation and Systems (ICCAS). <lm35_datasheet.pdf>.

UEMK 2019 Proceedings Book 24/25 October 2019 Gaziantep University, TURKEY
175
<pt100_datasheet.pdf>. Rata, G., & Rata, M. (2016). Temperature control solution with PLC. Paper presented at the 2016 International Conference and Exposition on Electrical and Power Engineering (EPE). Shahrokhi, M., & Zomorrodi, A. (2013). Comparison of PID controller tuning methods. Department of Chemical & Petroleum Engineering Sharif University of Technology, 1-2. Velagic, J., Osmic, N., Lutvica, K., & Kadic, N. (2010). Incubator system identification and temperature control with PLC & HMI. Paper presented at the Proceedings ELMAR-2010. Weibin, C., & Qingjian, M. (2010). Based on PLC temperature PID-Fuzzy control system design and simulation. Paper presented at the 2010 International Conference on Information, Networking and Automation (ICINA). Yang, Y., & Bian, H. (2012). Design and Realization of Fuzzy Self-tuning PID Water Temperature Controller Based on PLC. Paper presented at the 2012 4th International Conference on Intelligent Human-Machine Systems and Cybernetics.

UEMK 2019 Proceedings Book 24/25 October 2019 Gaziantep University, TURKEY
176
UNDERGRADUATE INDUSTRIAL CONTROL LABORATORY EXPERIMENTAL SETUP: PART 1 FLOW RATE CONTROL WITH PLC Cengiz TEPE Electronic and Electrical Engineering Ondokuz Mayıs University [email protected] Osman Can ÇALIŞKAN Electronic and Electrical Engineering Ondokuz Mayıs University [email protected] İlyas EMİNOĞLU Electronic and Electrical Engineering Ondokuz Mayıs University [email protected] ABSTRACT: The aim of this study is to enable the personnel who are knowledgeable about industrial automation systems in electrical-electronics, control, mechatronics and mechanical engineering department design and can use them. For this purpose, Flow Control Experience System was prepared and realized for PLC Industrial Control Laboratories. The clearness of other important points in PLC applications is the most accurate analysis and the fastest way to reach. The work plan on this page describes how to achieve a more stable and faster PID address than an ordinary system on a computer with a PLC-enabled operation. This system is S7-1200 PLC as control unit, flow meter giving panel adjustment in single room system, inverter for driveable motor at variable speeds, asynchronous motor and pump for flooding system, valve ventilation as disruptor. Production history in an industry where experience is used. Recognize and work with devices that are used in the industry before starting a career. Key words: Flow control, PLC, PID, Induction Motor, Flow LİSANS ENDÜSTRİYEL KONTROL LABORATUVARI için DENEY DÜZENEĞİ TASARIMI: BÖLÜM 1 PLC ile AKIŞ DENETİMİ ÖZET: Bu çalışma elektrik-elektronik, kontrol, mekatronik ve makine mühendisliği bölümü öğrencilerinin endüstriyel otomasyon sistemleri hakkında bilgi sahibi olmasını

UEMK 2019 Proceedings Book 24/25 October 2019 Gaziantep University, TURKEY
177
ve sistemde yer alan araçları istenilen düzeyde kullanabilmelerini amaçlamaktadır. Bu amaç doğrultusunda Lisans Endüstriyel Kontrol Laboratuvarları için PLC ile Akış Denetim Deney Düzeneği tasarlanmış ve gerçeklenmiştir. PLC uygulamalarında diğer önemli nokta sistemin en doğru kararlılığa en hızlı şekilde ulaşabilmesidir. Bu bağlamda çalışma kapsamında PLC ile akış kontrolü gerçekleştirilecek olan bir sistemin PID kullanılarak sıradan bir sistemden daha hızlı ve doğru bir karalılığa ulaşması anlatılmaktadır. Bu çalışmada kontrol ünitesi olarak S7-1200 PLC, tek hall sensör çıkışı veren debi ölçer, motorun değişken devirlerde sürülmesi için invertör, sisteme su basmak için asenkron motor ve pompa, bozucu olarak ise vana kullanılmıştır. Deney düzeneğinde kullanılan ürünlerin tamamı endüstride kullanılan ürünlerden oluşmaktadır. Böylece öğrencilere, meslek hayatına başlamadan önce endüstride kullanılan cihazları tanıma ve bu cihazlarla çalışma imkanı sunulmuştur. Anahtar sözcükler: Akış kontrolü, PLC, PID, Asenkron motor, Debi GİRİŞ Son yıllarda Türkiye'de ve dünyada PLC uygulamalarının giderek yaygınlaştığı görülmektedir. PLC tabanlı sistemlerin endüstride başarılı sonuçlar elde etmesi bu durumun oluşmasında önemli bir faktördür. Endüstriyel alanda çeşitli uygulamalarda PLC kullanılarak akış kontrolü sağlanmaktadır. Kompleks veya basit olarak tasarlanmış sistemlerde yer alan akış kontrolü, inovasyona açık bir şekilde endüstriyel uygulamaların geniş bir alanında mevcuttur. Akış kontrolü su tedarik ağları, kanalizasyon sistemleri, kimya sanayi, petrol aktarım tesisleri gibi birçok alanda önemli bir rol oynamaktadır. Endüstriyel uygulamaların kullanım amaçlarının anlaşılabilmesi için mühendislik bilgilerinin edinildiği ilk yer olan üniversitelerde verilen eğitimin nitelikli olması gerekmektedir. Nitelikli eğitim ise teorik bilgilerin yanında uygulamalı faaliyetlerin gerçekleşmesi ile mümkündür. Bu bağlamda teorik olarak PLC eğitiminin yanında uygulamalı eğitim de önemli bir unsur haline gelmiştir (Geaney & O’Mahony, 2015; Gevorkov, Vodovozov, Lehtla, & Bakman, 2015; Q. X. Liu, 2016; Y. Liu & He, 2011; Özerdem, 2016; E. Priyanka, Maheswari, & Thangavel, 2018; Rajeswari, Suresh, & Rajeshwari, 2013; Shankar, 2008). Geverkov ve Bakman çalışmalarında PLC tabanlı bir sistem için akış kontrol uygulaması gerçekleştirmişlerdir. Çalışmalarında ABB AC500 PLC kullanmış olup, değişken frekanslı santrifüj pompa motorunun devrini kontrol etmek için invertörü, sistemin kararlılığını ölçmek için ise PID yi kullanmışlardır (Gevorkov et al., 2015). Liu ise çalışmasında uzman PID sistemine dayalı bir akış kontrol işlemi gerçekleştirmiştir. Bu sistemde S7-1500 PLC ana kontrolör olarak görev yapmaktadır (Q. X. Liu, 2016). Liu ve He çalışmalarında S7-200 PLC kullanarak su şebekesi için otomatik kontrol sistemi tasarlamışlardır. Tasarlanan sistem sıcaklık, basınç ve akış hızını kontrol etmiştir (Y. Liu & He, 2011). Priyanka ve arkadaşları çalışmalarında

UEMK 2019 Proceedings Book 24/25 October 2019 Gaziantep University, TURKEY
178
bulanık mantık PID kullanarak PLC tabanlı bir petrol boru hattı sisteminin çevrimiçi akış kontrolünü sağlamışlardır. Sistem kaskat PID ile bulanık mantık PID için gerçeklenmiş olup, uygulanan PID türüne göre çıkış cevabının dengeye ulaşma süresi gözlemlenmiştir (E. Priyanka et al., 2018). Rajeswari çalışmasında PLC ve SCADA kullanarak ilaçlarda su depolama ve dağıtım sistemi gerçekleştirmiştir. Allen Bradley Micrologix 1200 PLC kullanmıştır. Sistem ilaç sanayi için kaliteli su teminatını gerçekleştirmektedir. Sistem tarafından pH, sıcaklık, basınç, iletkenlik ve akış hızı kontrolü sağlanmıştır (Rajeswari et al., 2013). Shankar çalışmasında PLC ve SCADA kullanarak kompleks bir kazan kontrol sistemi tasarlamıştır. Tasarladığı sistem için Allen Bradley 1000 PLC kullanmış ve sistemde yer alan SCADA ekranının PLC ile bağlantısını yaparak kazan için belirlenen parametrelerin sürekli olarak takibini gerçekleştirmiştir. Yapılması gereken işlemleri devreye sokmak için kazan AC motor ile kontrol edilmiştir. Sistemin karalılığı PID kontrol ile sağlanmaktadır (Shankar, 2008). Cai ve arkadaşları yüksek sıcaklıkta ve yüksek hızda bir rüzgar tüneli için iki üniteli bir yakıt deposunun koordineli besleme işleminin akış kontrolünü gerçekleştirmişlerdir. Uygulamanın kontrolü PLC tabanlıdır. Sisteme bulanık PI adaptif çapraz bağlanma ve PI çapraz bağlanma algoritması uygulamışlardır (Cai, Yang, & Liu, 2016). Priyanka ve arkadaşları PLC tabanlı PID denetleyicisi kullanarak benzin nakil hatlarının izlenmesi üzerine bir çalışma gerçekleştirmişlerdir. Çalışmalarında kararlılık metotları olan Ziegler Nichols PID, Simple IMC-PID ve Shams IMC-PID algoritmalarını kıyaslamışlardır (E. B. Priyanka, Maheswari, & Meenakshipriya, 2016). Bu çalışmada, gerçeklenen deney düzeneğinde S7-1200 PLC üzerinden sürülen invertör aracılığıyla üç fazlı asenkron motorun devri kontrol edilerek motora bağlı olan su pompası ile sisteme su basılmıştır. Bu sistemde suyun debisi PID algoritması kullanılarak kontrol edilmiştir. Uygulanan bu yöntem ile sistemin hızlı ve doğru çıkış tepkesi oluşturması sağlanmıştır. Deney düzeneğine harici olarak eklenen valf ile bozucu etki oluşturulmuştur. Laboratuvar ortamında fiziksel bir gerçeklikle ele alınan bu çalışma teorik bilgilerin pratiğe dökülmesi adına uygun bir ortam oluşturacaktır. Yalnızca teorik olarak verilen derslerin kaliteli mühendis grupları oluşturabilmesi için güncel dünya koşullarında yeterli olmayacağı bilinmektedir. PLC ile ilgili deney setlerinin uygulama alanlarının arttırılması öğrencilerin mühendislik alanında derinlemesine bilgi edinip öğrendiklerini meslek hayatlarında uygulayabilmelerini sağlayacaktır. Bu amaç doğrultusunda çalışma kapsamında tasarlanan akış deney düzeneği, endüstriyel bir PLC uygulamasının anlaşılabilir ve gerçek hayata uygulanabilir olmasında öğrenciler için bir basamak oluşturması açısından önem taşımaktadır. YÖNTEM Deney Düzeneği Tasarımı Deney Seti Araçları

UEMK 2019 Proceedings Book 24/25 October 2019 Gaziantep University, TURKEY
179
Şekil 1’de deney düzeneğinin blok diyagramı yer almaktadır. Şekil 2’de gösterilen deney düzeneği içeriğinde kullanılan devre elemanları; a) S-7 1200 PLC, b) KTP 700 HMI arayüz, c) asenkron motor, d) invertör, e) akış ölçer sensör, f) tampon devresi, g) bozucu vana ve h) akış hattıdır.
Şekil 1. Deney Düzeneği Blok Diyagramı
Şekil 2. Deney Düzeneği S-7 1200 PLC ve TIA Portal Siemen PLC’lerin S7-200-300-400-1200-1500 olmak üzere farklı modelleri bulunmaktadır. Bu çalışmada S7-1200 CPU 1214C DC/DC/DC PLC kullanılmıştır. S7-1200’ün En belirgin özelliklerden biri de PPI haberleşme portu yerine Profinet yani Ethernet haberleşme protokolünü kullanmaktadır. Standart olarak her S7 1200 PLC üzerinde 14 sayısal giriş ve 10 sayısal çıkış bulunmaktadır. Ayrıca 2 adet 0-10 V analog giriş ve 4 adet PWM çıkışı vardır. S-7 1200 PLC’lerin yan modülleri de bulunmaktadır. Bunlar standart giriş/çıkış modülleri ve haberleşme modülleridir. PLC yazılım programı olarak TIA Portal V15 kullanılmıştır. TIA Portal giriş/çıkış, insan-makine arayüzü, sürücüler, hareket kontrolü ve motor yönetimi sistemlerini bir bütün halinde sunar. Ortak veri yönetimi ve akıllı
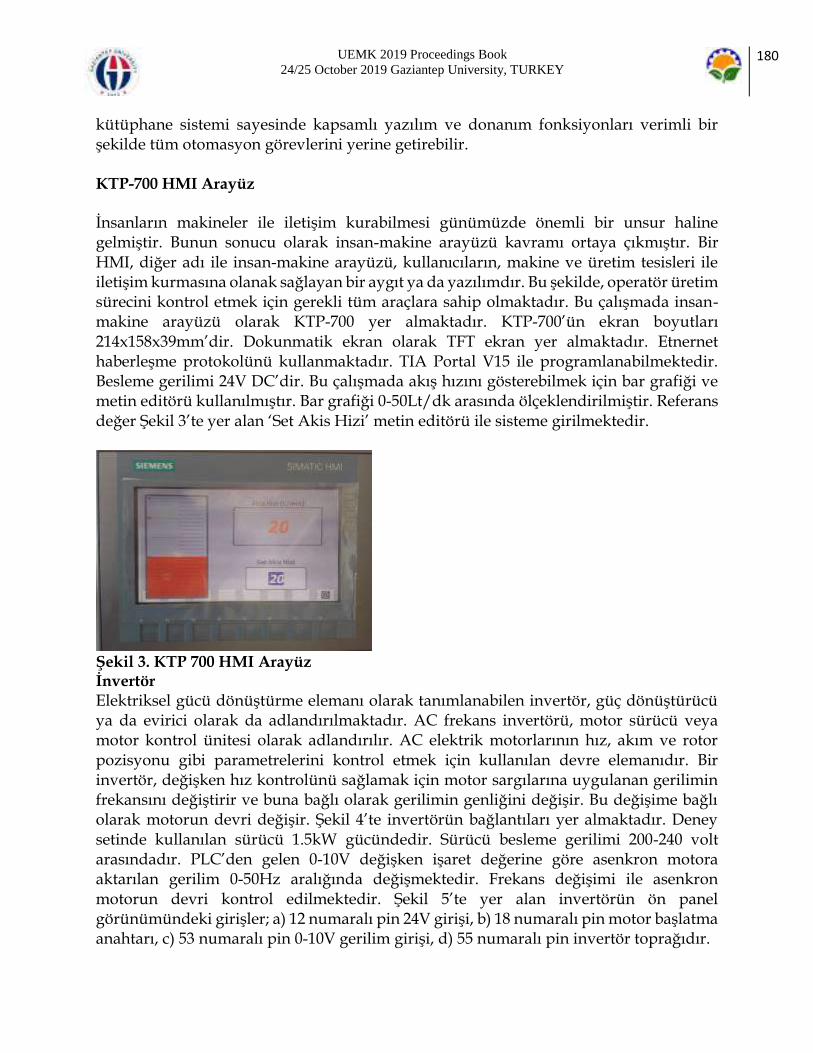
UEMK 2019 Proceedings Book 24/25 October 2019 Gaziantep University, TURKEY
180
kütüphane sistemi sayesinde kapsamlı yazılım ve donanım fonksiyonları verimli bir şekilde tüm otomasyon görevlerini yerine getirebilir. KTP-700 HMI Arayüz İnsanların makineler ile iletişim kurabilmesi günümüzde önemli bir unsur haline gelmiştir. Bunun sonucu olarak insan-makine arayüzü kavramı ortaya çıkmıştır. Bir HMI, diğer adı ile insan-makine arayüzü, kullanıcıların, makine ve üretim tesisleri ile iletişim kurmasına olanak sağlayan bir aygıt ya da yazılımdır. Bu şekilde, operatör üretim sürecini kontrol etmek için gerekli tüm araçlara sahip olmaktadır. Bu çalışmada insan-makine arayüzü olarak KTP-700 yer almaktadır. KTP-700’ün ekran boyutları 214x158x39mm’dir. Dokunmatik ekran olarak TFT ekran yer almaktadır. Etnernet haberleşme protokolünü kullanmaktadır. TIA Portal V15 ile programlanabilmektedir. Besleme gerilimi 24V DC’dir. Bu çalışmada akış hızını gösterebilmek için bar grafiği ve metin editörü kullanılmıştır. Bar grafiği 0-50Lt/dk arasında ölçeklendirilmiştir. Referans değer Şekil 3’te yer alan ‘Set Akis Hizi’ metin editörü ile sisteme girilmektedir.
Şekil 3. KTP 700 HMI Arayüz İnvertör Elektriksel gücü dönüştürme elemanı olarak tanımlanabilen invertör, güç dönüştürücü ya da evirici olarak da adlandırılmaktadır. AC frekans invertörü, motor sürücü veya motor kontrol ünitesi olarak adlandırılır. AC elektrik motorlarının hız, akım ve rotor pozisyonu gibi parametrelerini kontrol etmek için kullanılan devre elemanıdır. Bir invertör, değişken hız kontrolünü sağlamak için motor sargılarına uygulanan gerilimin frekansını değiştirir ve buna bağlı olarak gerilimin genliğini değişir. Bu değişime bağlı olarak motorun devri değişir. Şekil 4’te invertörün bağlantıları yer almaktadır. Deney setinde kullanılan sürücü 1.5kW gücündedir. Sürücü besleme gerilimi 200-240 volt arasındadır. PLC’den gelen 0-10V değişken işaret değerine göre asenkron motora aktarılan gerilim 0-50Hz aralığında değişmektedir. Frekans değişimi ile asenkron motorun devri kontrol edilmektedir. Şekil 5’te yer alan invertörün ön panel görünümündeki girişler; a) 12 numaralı pin 24V girişi, b) 18 numaralı pin motor başlatma anahtarı, c) 53 numaralı pin 0-10V gerilim girişi, d) 55 numaralı pin invertör toprağıdır.

UEMK 2019 Proceedings Book 24/25 October 2019 Gaziantep University, TURKEY
181
Şekil 4. İnvertör Bağlantı Şemaları
Şekil 5. İnvertör Ön Panel Görünümü Asenkron Motor Genel olarak AC motorlar; kaldırma, kaydırma, pompa, sürme ve delme işlemleri için gerekli olan itici gücü sağlar, endüstriyel ve ticari uygulamalardaki diğer işlemleri yerine getirir. Deney düzeneğinde yer alan asenkron pompa motoru sıvının sürekli olarak akışını gerçekleştirmektedir. Bu işlemi yerine getirirken sürücüden aldığı frekans değerine göre artan, azalan veya sabit bir devirde dönmektedir. Deney düzeneğinde yer alan asenkron motor yıldız bağlı, 50Hz, 3 fazlı, 2850 d/dk nominal hızlı ve 800W gücündedir.
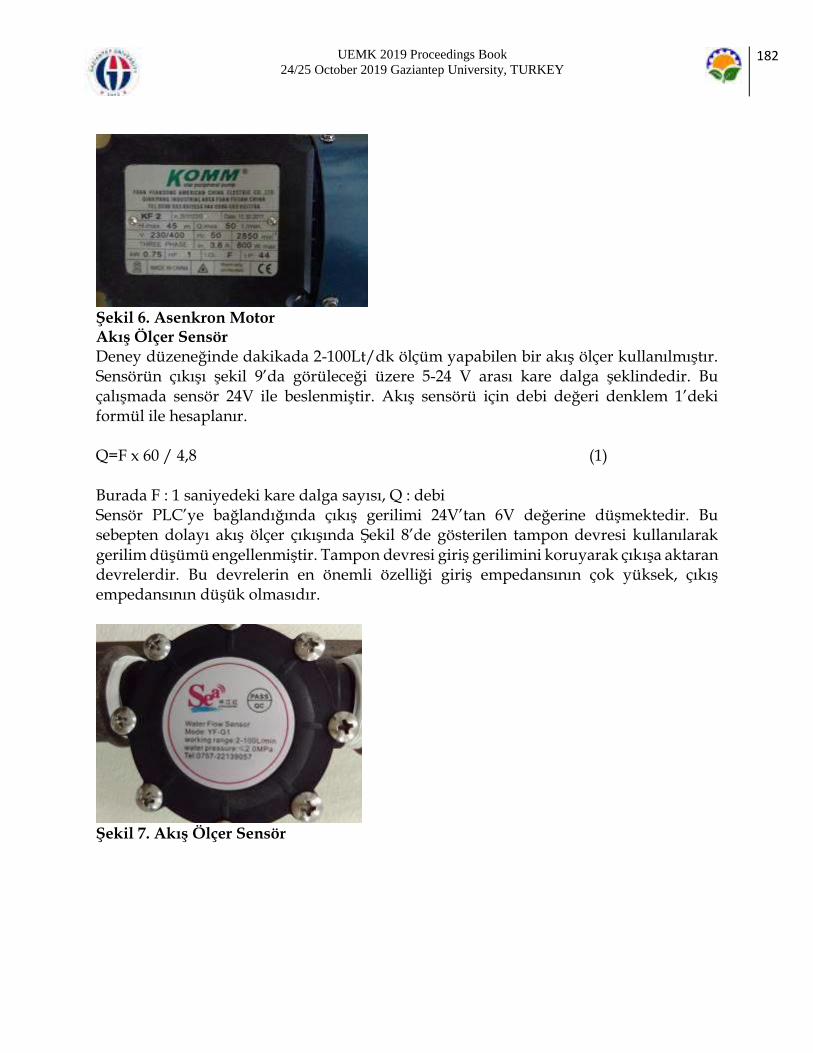
UEMK 2019 Proceedings Book 24/25 October 2019 Gaziantep University, TURKEY
182
Şekil 6. Asenkron Motor Akış Ölçer Sensör Deney düzeneğinde dakikada 2-100Lt/dk ölçüm yapabilen bir akış ölçer kullanılmıştır. Sensörün çıkışı şekil 9’da görüleceği üzere 5-24 V arası kare dalga şeklindedir. Bu çalışmada sensör 24V ile beslenmiştir. Akış sensörü için debi değeri denklem 1’deki formül ile hesaplanır. Q=F x 60 / 4,8 (1) Burada F : 1 saniyedeki kare dalga sayısı, Q : debi Sensör PLC’ye bağlandığında çıkış gerilimi 24V’tan 6V değerine düşmektedir. Bu sebepten dolayı akış ölçer çıkışında Şekil 8’de gösterilen tampon devresi kullanılarak gerilim düşümü engellenmiştir. Tampon devresi giriş gerilimini koruyarak çıkışa aktaran devrelerdir. Bu devrelerin en önemli özelliği giriş empedansının çok yüksek, çıkış empedansının düşük olmasıdır.
Şekil 7. Akış Ölçer Sensör
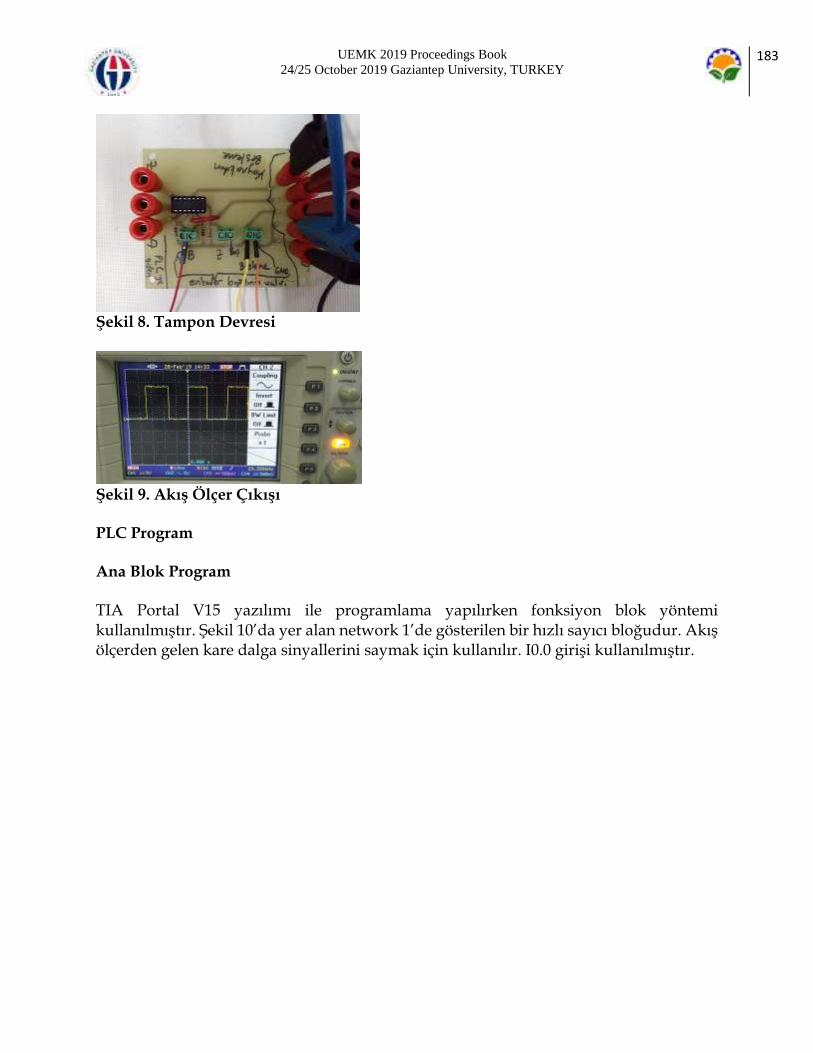
UEMK 2019 Proceedings Book 24/25 October 2019 Gaziantep University, TURKEY
183
Şekil 8. Tampon Devresi
Şekil 9. Akış Ölçer Çıkışı PLC Program Ana Blok Program TIA Portal V15 yazılımı ile programlama yapılırken fonksiyon blok yöntemi kullanılmıştır. Şekil 10’da yer alan network 1’de gösterilen bir hızlı sayıcı bloğudur. Akış ölçerden gelen kare dalga sinyallerini saymak için kullanılır. I0.0 girişi kullanılmıştır.
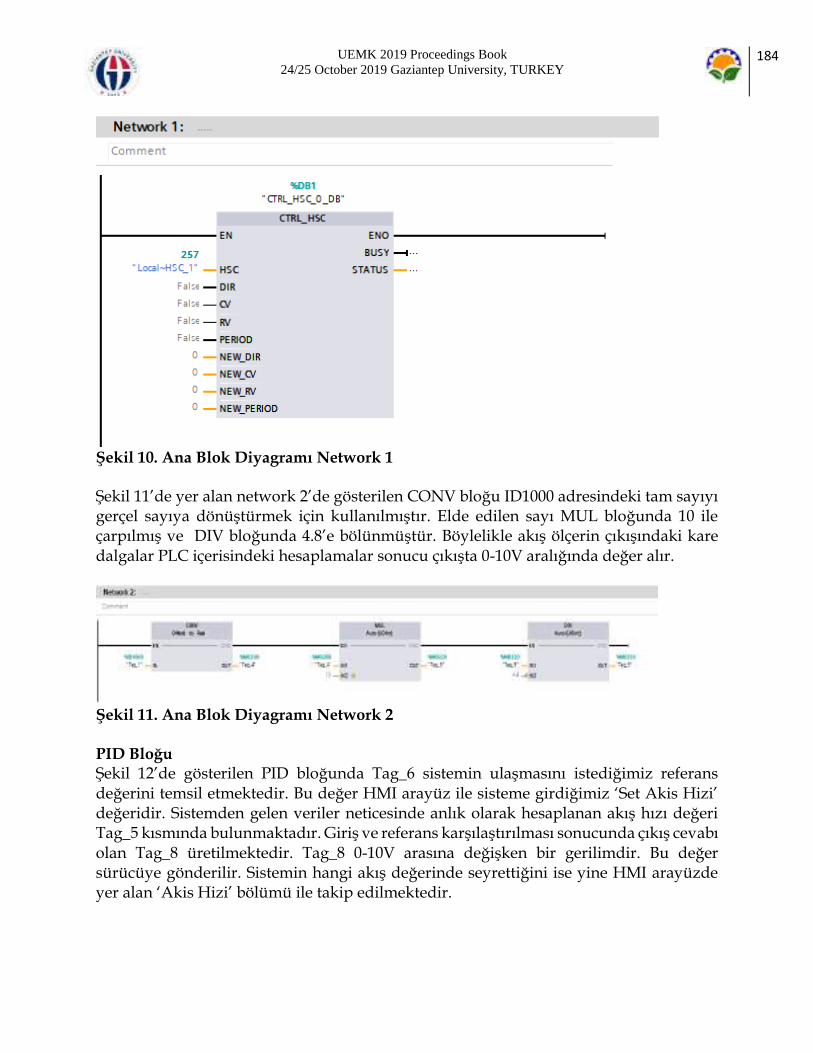
UEMK 2019 Proceedings Book 24/25 October 2019 Gaziantep University, TURKEY
184
Şekil 10. Ana Blok Diyagramı Network 1 Şekil 11’de yer alan network 2’de gösterilen CONV bloğu ID1000 adresindeki tam sayıyı gerçel sayıya dönüştürmek için kullanılmıştır. Elde edilen sayı MUL bloğunda 10 ile çarpılmış ve DIV bloğunda 4.8’e bölünmüştür. Böylelikle akış ölçerin çıkışındaki kare dalgalar PLC içerisindeki hesaplamalar sonucu çıkışta 0-10V aralığında değer alır.
Şekil 11. Ana Blok Diyagramı Network 2 PID Bloğu Şekil 12’de gösterilen PID bloğunda Tag_6 sistemin ulaşmasını istediğimiz referans değerini temsil etmektedir. Bu değer HMI arayüz ile sisteme girdiğimiz ‘Set Akis Hizi’ değeridir. Sistemden gelen veriler neticesinde anlık olarak hesaplanan akış hızı değeri Tag_5 kısmında bulunmaktadır. Giriş ve referans karşılaştırılması sonucunda çıkış cevabı olan Tag_8 üretilmektedir. Tag_8 0-10V arasına değişken bir gerilimdir. Bu değer sürücüye gönderilir. Sistemin hangi akış değerinde seyrettiğini ise yine HMI arayüzde yer alan ‘Akis Hizi’ bölümü ile takip edilmektedir.

UEMK 2019 Proceedings Book 24/25 October 2019 Gaziantep University, TURKEY
185
Şekil 12. PID Bloğu Network 1 Blok Diyagramı Etiket ve Adresleri Aşağıdaki tabloda TIA PORTAL V15 yazılımında kullanılan etiketler, adresler ve adreslerin görevleri hakkında bilgi verilmiştir. Tablo 1. PLC Etiketleri ve Adresleri
Etiketler PLC Adresi Açıklamaları
Local HSC_1 %I0.0 Akış ölçerden gelen kare dalgaların sayıldığı adres.
Tag_1 %ID1000 Kare dalgaların atandığı adres.
Tag_4 %MD200 Reel verilerin 10 ile çarpıldığı adres.
Tag_5 %MD250 Akış ölçerin kare dalgalarının 0-10V arası tanımlanması.
Tag_6 %MD300 Referans olarak girilen değer.
Tag_8 %QW80 Çıkış işaretinin adresi.
Tag_9 %MD220 Reel verilerin 4.8 ile bölündüğü adres.
BULGULAR Akış hızı kontrol deneyinde referans değer olarak 20Lt/dk değeri ayarlanmıştır. Akış kontrol ünitesi çalıştırıldıktan yaklaşık 120 saniye sonra ulaşması beklenen referans değeri elde edilmiştir. 300.sn’de bozucu valf açılarak suyun debisi 15Lt/dk değerine

UEMK 2019 Proceedings Book 24/25 October 2019 Gaziantep University, TURKEY
186
kadar indirilmiştir. Bu işlem uygulandıktan sonra bozulan işaretin 30sn içinde tekrar eski konumu olan 20Lt/dk değerine ulaştığı gözlemlenmiştir. 360. sn’den sonra bozucu valf kapatılarak suyun debisinin referans değerin üzerine çıkması sağlanmıştır. Bu işlemin ardından debi değeri 30sn kadar sonra tekrar eski referans değerine ulaşmıştır. PID algoritması ile sistem bozucu etkilere karşı ayarlanan referans değerine doğru bir şekilde oturmuştur. PID bloğunda yer alan katsayı değerleri deneme yanılma ile Kp: 1, Ki: 20, Kd: 0 şeklinde bulunarak ayarlanmıştır. Bu çalışmada endüstriyel ortamda geçerliliği halen devam eden, iyi sonuçlar veren ve kullanımının basit olmasından dolayı en sık tercih edilen denetim olan PID algoritması kullanılmıştır.
Şekil 13. Çıkış-referans İşaretinin Kontrol İşaretine Göre Değişimi SONUÇ Bu çalışma sonucunda elektrik-elektronik, kontrol, mekatronik ve makine mühendisliği bölümü öğrencileri suyun debi (Lt/dk) ölçümünü, akış sensörü kullanımını, asenkron motorun (devir/dakika) kontrolünü, PLC programlamayı, PLC çıkışından analog veri gönderimini, PLC hızlı sayıcı ile kare dalga okumayı, PLC ile PID modülü kullanmayı, PLC ile invertör kullanımını, invertör ile asenkron motor hız denetimini, sensör çıkışlarında tampon devre elamanı kullanımını kendileri uygulayarak öğrenmişlerdir. ÖNERİLER Bu çalışma farklı akış sensörleri ve PLC’ler kullanılarak tekrarlanabilir. Kontrol algoritması PID yerine bulanık mantık PID, kaskat PID ve uzman PID gibi yöntemler kullanılabilir.

UEMK 2019 Proceedings Book 24/25 October 2019 Gaziantep University, TURKEY
187
TEŞEKKÜR Bu çalışma Ondokuz Mayıs Üniversitesi tarafından Bilimsel Araştırma Projesi kapsamında desteklenmektedir (PYO.MUH.1906.17.002). Çalışmalarda destek olan lisans öğrencisi Mustafa ÖZÇELİK’e teşekkür ederiz. KAYNAKLAR Cai, C., Yang, Y., & Liu, T. (2016). Coordinated control of fuel flow-rate for a high-temperature high-speed wind tunnel. Proceedings of the Institution of Mechanical Engineers, Part G: Journal of Aerospace Engineering, 230(13), 2504-2514. doi: 10.1177/0954410015626737 Geaney, G., & O’Mahony, T. (2015). Design and evaluation of a remote PLC laboratory. International Journal of Electrical Engineering & Education, 53(3), 212-223. doi: 10.1177/0020720915622468 Gevorkov, L., Vodovozov, V., Lehtla, T., & Bakman, I. (2015). PLC-based flow rate control system for centrifugal pumps. Paper presented at the 2015 56th International Scientific Conference on Power and Electrical Engineering of Riga Technical University (RTUCON). Liu, Q. X. (2016). Design of flow control system based on expert pid. Paper presented at the 2016 International Symposium on Computer, Consumer and Control (IS3C). Liu, Y., & He, X. (2011). Design of automatic control system for waterworks based on PLC. Paper presented at the 2011 2nd International Conference on Artificial Intelligence, Management Science and Electronic Commerce (AIMSEC). Özerdem, Ö. C. (2016). Design of two experimental setups for programmable logic controller (PLC) laboratory. International Journal of Electrical Engineering & Education, 53(4), 331-340. doi: 10.1177/0020720916630325 Priyanka, E., Maheswari, C., & Thangavel, S. (2018). Online monitoring and control of flow rate in oil pipelines transportation system by using PLC based Fuzzy‐PID Controller. Flow Measurement and Instrumentation, 62, 144-151. Priyanka, E. B., Maheswari, C., & Meenakshipriya, B. (2016). Parameter monitoring and control during petrol transportation using PLC based PID controller. Journal of Applied Research and Technology, 14(2), 125-131. doi: 10.1016/j.jart.2016.03.004 Rajeswari, V., Suresh, L. P., & Rajeshwari, Y. (2013). Water storage and distribution system for pharmaceuticals using PLC and SCADA. Paper presented at the 2013 International Conference on Circuits, Power and Computing Technologies (ICCPCT). Shankar, K. G. (2008). Control of boiler operation using PLC–SCADA. Paper presented at the Proceedings of the International MultiConference of Engineers and Computer Scientists.

UEMK 2019 Proceedings Book 24/25 October 2019 Gaziantep University, TURKEY
188
THE PERFORMANCE AND EMISSION ANALYSIS OF BIODIESEL PRODUCED FROM SAFFLOWER SEED OIL IN A SINGLE CYLINDER DI DIESEL ENGINE İlker ÖRS Cihanbeyli Vocational School, Selcuk University, Konya, Turkey Automotive Application and Research Center, Selcuk University, Konya, Turkey [email protected] Murat CİNİVİZ Technology Faculty, Selcuk University, Konya, Turkey Automotive Application and Research Center, Selcuk University, Konya, Turkey [email protected] Bahar SAYIN KUL Technology Faculty, Selcuk University, Konya, Turkey [email protected] ABSTRACT: In this study, biodiesel fuel produced from safflower oil was blended in 20% and 50% with diesel fuel. The diesel fuel, biodiesel and blend fuels were tested in a single-cylinder, direct injection, four-stroke, natural aspirated diesel engine under four different engine loads and 1400 rpm engine speed. Besides, important fuel analyses of test fuels have been performed. It was found that biodiesel use resulted in slightly increment on break specific fuel consumption (up to 25.1%). However, 20% biodiesel fuel addition resulted in slightly increment on break thermal efficiency (up to 2.31%). The biodiesel also increased NOx emissions and decreased carbon monoxide, smoke and hydrocarbon emissions for the all engine loads. Key words: biodiesel, engine performance, exhaust emissions, diesel engine INTRODUCTION Diesel engines are preferred nowadays in so many sectors owing to the fact that it has better fuel economy, higher efficiency, more reliability, lower fuel cost, and longlasting capacity. Exhaust emissions from these engines are very badly affecting the human health and habitat from so many times. Moreover, due to the rise in automobile numbers on roads the fossil fuels are depleting at an alarming rate which may result in its permanent deterioration in the near future. To overcome this, researchers, and analysts are trying to find an alternative fuel which can increase the performance characteristics of the engine and decrease exhaust emissions (Goga, Chauhan, Mahla, & Cho, 2019). Vegetable oils
UEMK 2019 Proceedings Book 24/25 October 2019 Gaziantep University, TURKEY
189
have been observed to be main alternative fuels for diesel engines. But, when vegetable oils use direct, they lead to some problems in engines. These problems are arised to high density, viscosity, and poor volatility of vegetable oils. According to previous researches, biodiesel production with transesterification is the best way to use vegetable oil as a fuel in existing diesel engines. Thus, an alternative diesel fuel having lower density and viscosity can obtain. But, nevertheless it has still higher viscosity and density that exceed the standard values for conventional diesel fuel (Aydın, 2016; Chang et al., 1996; Puhan, Vedaraman, Ram, Sankarnarayanan, & Jeychandran, 2005; Szybist, Song, Alam, & Boehman, 2007; Tat et al., 2000). Many studies in literature presented that engine performance parameters of B20 and B50 fuels are lower than that diesel fuel due to biodiesel’s lower calorific values compare to diesel fuel (Çelebi & Aydın, 2018; Ilkılıç, Aydın, Behcet, & Aydin, 2011; Shrivastava, Verma, & Pugazhendhi, 2019). However, there are also studies showing that thermal efficiency values of these fuels are higher than diesel fuel owing to their oxygen content provides the proper burning of the fuel (Abed, El Morsi, Sayed, El Shaib, & Gad, 2018; Sharma & Murugan, 2015; Sidhu, Roy, & Wang, 2018). There are also studies using pure biodiesel as fuel. As performance results of these studies, higher viscosity and lower calorific value caused a drop in engine performance values (Alagu et al., 2019; Asokan, Prabu, Bade, Nekkanti, & Gutta, 2019; Channapattana, Kantharaj, Shinde, Pawar, & Kamble, 2015). On the other hand, some researchers have suggested that B100 fuel improved engine performance (Jindal, Nandwana, Rathore, & Vashistha, 2010; Muralidharan, Vasudevan, & Sheeba, 2011). Many researchers have shown that CO, HC and smoke opacity emissions were decreased, and NOx emissions was increased by use of biodiesel due its oxygen content (Abed et al., 2018; EL_Kassaby & Nemit_allah, 2013; Mohanraj & Mohan Kumar, 2013; Pali, Kumar, & Alhassan, 2015) The production of biodiesel from vegetable oils is made from species such as: castor bean, soybean, cotton, sunflower, safflower, moringa, among others that have properties and energy efficiency like the mineral diesel (de Oliveira et al., 2018). Biodiesel has some negative properties such as high density and viscosity, bad cold flow properties etc. Especially, high viscosity limit the use of biodiesel as pure fuel. Previous studies have shown that some modifications such as injection pressure and time must make on engine after 20% biodiesel content. In this study, safflower oil which can be produced with lower cost than other oil plants has been used for production of biodiesel. The obtained biodiesel has been blended different ratio with diesel fuel, and besides, it used in diesel engine as pure fuel. The results of engine performance and exhaust emission parameters obtained with use of these fuels presented. MATERIALS AND METHODS
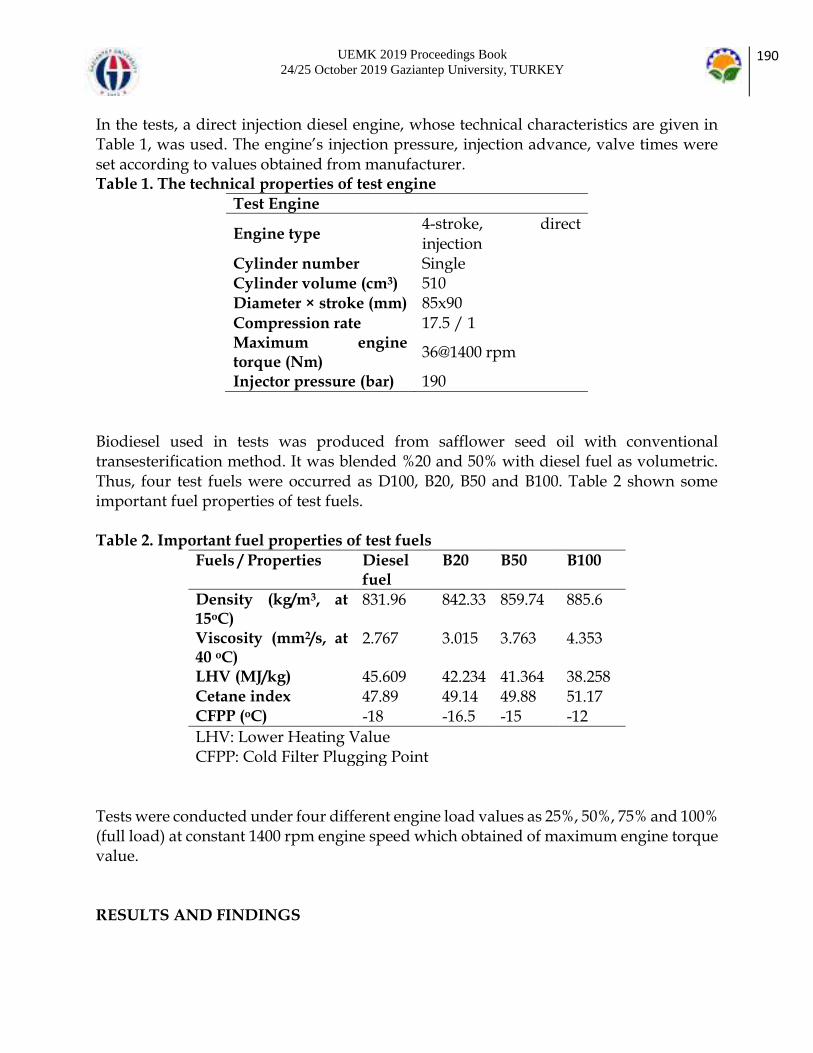
UEMK 2019 Proceedings Book 24/25 October 2019 Gaziantep University, TURKEY
190
In the tests, a direct injection diesel engine, whose technical characteristics are given in Table 1, was used. The engine’s injection pressure, injection advance, valve times were set according to values obtained from manufacturer. Table 1. The technical properties of test engine
Test Engine
Engine type 4-stroke, direct injection
Cylinder number Single Cylinder volume (cm3) 510 Diameter × stroke (mm) 85x90 Compression rate 17.5 / 1 Maximum engine torque (Nm)
36@1400 rpm
Injector pressure (bar) 190
Biodiesel used in tests was produced from safflower seed oil with conventional transesterification method. It was blended %20 and 50% with diesel fuel as volumetric. Thus, four test fuels were occurred as D100, B20, B50 and B100. Table 2 shown some important fuel properties of test fuels. Table 2. Important fuel properties of test fuels
Fuels / Properties Diesel fuel
B20 B50 B100
Density (kg/m3, at 15oC)
831.96 842.33 859.74 885.6
Viscosity (mm2/s, at 40 oC)
2.767 3.015 3.763 4.353
LHV (MJ/kg) 45.609 42.234 41.364 38.258 Cetane index 47.89 49.14 49.88 51.17 CFPP (oC) -18 -16.5 -15 -12
LHV: Lower Heating Value CFPP: Cold Filter Plugging Point
Tests were conducted under four different engine load values as 25%, 50%, 75% and 100% (full load) at constant 1400 rpm engine speed which obtained of maximum engine torque value. RESULTS AND FINDINGS

UEMK 2019 Proceedings Book 24/25 October 2019 Gaziantep University, TURKEY
191
Specific fuel consumption is the amount of fuel consumed at a given time to achieve a certain power. Thermal efficiency indicates the transformation ratio of the chemical energy of the fuel burned in the combustion chamber to the mechanical energy. Therefore, both terms are very important for interpretation of performance parameters. In Figure 1, the changes in brake specific fuel consumptions (BSFC) and thermal efficiency are shown. The main reason for the reduction up to 25.1% in BSFC values as a result of using biodiesel can be explained by the fact that biodiesel has a low calorific value than diesel fuel, which gives rise to the requirement that more fuel be consume in order to obtained the same engine power. The content of oxygen in biodiesel has been caused an increase by 2.31% on thermal efficiency for B20 fuel compare to diesel fuel. But, brake thermal efficiency values for other test fuels used of biodiesel have been decreased by 1.28% and 3.9% respectively for B50 and B100 fuels due to rise of drop in their calorific values. The major reason for the formation of CO emissions in internal combustion engines is the deficiency of the amount of oxygen in combustion chamber. Therefore, CO emissions for all test fuels decreased up to 32.1% with increase of biodiesel ratio in test fuels owing to approximately 10% oxygen in biodiesel. CO emission values increased depending on increase of engine load as shown in Figure 2 due to decrease of air amount entered in cylinder.
25 50 75 100
300
350
400
450
500
550
600
D100 B20 B50 B100
Engine Load (%)
BSF
C (g
/kW
h)
10
12
14
16
18
20
22
24
26
28 T
herm
al E
ffic
ienc
y (%
)
Figure 1. BSFC and thermal efficiency values of test fuels
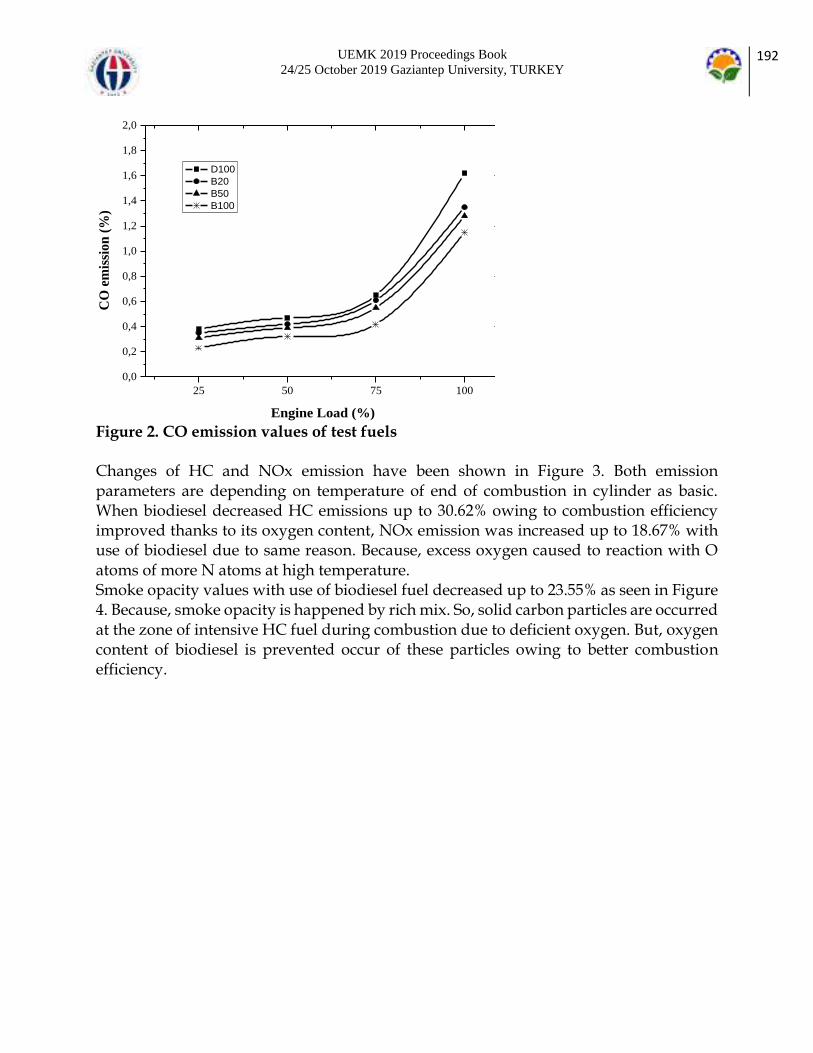
UEMK 2019 Proceedings Book 24/25 October 2019 Gaziantep University, TURKEY
192
25 50 75 1000,0
0,2
0,4
0,6
0,8
1,0
1,2
1,4
1,6
1,8
2,0
D100 B20 B50 B100
Engine Load (%)
CO
em
issi
on (%
)
Figure 2. CO emission values of test fuels Changes of HC and NOx emission have been shown in Figure 3. Both emission parameters are depending on temperature of end of combustion in cylinder as basic. When biodiesel decreased HC emissions up to 30.62% owing to combustion efficiency improved thanks to its oxygen content, NOx emission was increased up to 18.67% with use of biodiesel due to same reason. Because, excess oxygen caused to reaction with O atoms of more N atoms at high temperature. Smoke opacity values with use of biodiesel fuel decreased up to 23.55% as seen in Figure 4. Because, smoke opacity is happened by rich mix. So, solid carbon particles are occurred at the zone of intensive HC fuel during combustion due to deficient oxygen. But, oxygen content of biodiesel is prevented occur of these particles owing to better combustion efficiency.

UEMK 2019 Proceedings Book 24/25 October 2019 Gaziantep University, TURKEY
193
25 50 75 10050
75
100
125
150
175
200
225
250
275
300
325
350
375
400
D100 B20 B50 B100
Engine Load (%)
HC
em
issi
on (p
pm)
100
200
300
400
500
600
700
NO
x (p
pm)
Figure 3. HC and NOx emission values of test fuels
25 50 75 1000
1
2
3
4
5
D100 B20 B50 B100
Engine Load (%)
Smok
e O
paci
ty (m
-1)
Figure 4. Smoke opacity values of test fuels CONCLUSION The results obtained using diesel fuel, biodiesel and their blends are as follows.
Biodiesel decreased BSFC values due to its low calorific value.

UEMK 2019 Proceedings Book 24/25 October 2019 Gaziantep University, TURKEY
194
Although thermal efficiency of B50 and B100 fuels are lower according to diesel fuel due to their low calorific values, B20 fuel increased thermal efficiency owing to combustion improved by oxygen in fuel.
The oxygen content of biodiesel has been caused a decrease in all exhaust emission parameters except NOx.
Especially, B20 fuel could be used easily without any modification in diesel engines in order to it improved both exhaust emissions and thermal efficiency. But, some engine parameters such as injection pressure, injection time, injectors of different form and other changes on fuel system need to change for use of high ratio biodiesel. REFERENCES Abed, K., El Morsi, A., Sayed, M., El Shaib, A., & Gad, M. (2018). Effect of waste cooking-oil biodiesel on performance and exhaust emissions of a diesel engine. Egyptian Journal of Petroleum, 27, 985-989. Alagu, K., Venu, H., Jayaraman, J., Raju, V. D., Subramani, L., Appavu, P., & Dhanasekar, S. (2019). Novel Water Hyacinth biodiesel as a potential alternative fuel for existing unmodified diesel engine: Performance, Combustion and Emission characteristics. Energy, 179, 295-305. Asokan, M., Prabu, S. S., Bade, P. K. K., Nekkanti, V. M., & Gutta, S. S. G. (2019). Performance, combustion and emission characteristics of juliflora biodiesel fuelled DI diesel engine. Energy, 173, 883-892. Aydın, H. (2016). Scrutinizing the combustion, performance and emissions of safflower biodiesel–kerosene fueled diesel engine used as power source for a generator. Energy Conversion and Management, 117, 400-409. Chang, D. Y., Van Gerpen, J. H., Lee, I., Johnson, L. A., Hammond, E. G., & Marley, S. J. (1996). Fuel properties and emissions of soybean oil esters as diesel fuel. Journal of the American Oil Chemists' Society, 73(11), 1549-1555. Channapattana, S., Kantharaj, C., Shinde, V., Pawar, A. A., & Kamble, P. G. (2015). Emissions and performance evaluation of DI CI-VCR engine fuelled with honne oil methyl ester/diesel blends. Energy Procedia, 74, 281-288. Çelebi, Y., & Aydın, H. (2018). Investigation of the effects of butanol addition on safflower biodiesel usage as fuel in a generator diesel engine. Fuel, 222, 385-393. de Oliveira, C. V. K., Santos, R. F., Siqueira, J. A. C., Bariccatti, R. A., Lenz, N. B. G., Cruz, G. S., . . . Klajn, F. F. (2018). Chemical characterization of oil and biodiesel from four safflower genotypes. Industrial crops and products, 123, 192-196. EL_Kassaby, M., & Nemit_allah, M. A. (2013). Studying the effect of compression ratio on an engine fueled with waste oil produced biodiesel/diesel fuel. Alexandria engineering journal, 52(1), 1-11. Goga, G., Chauhan, B. S., Mahla, S. K., & Cho, H. M. (2019). Performance and emission characteristics of diesel engine fueled with rice bran biodiesel and n-butanol. Energy Reports, 5, 78-83.

UEMK 2019 Proceedings Book 24/25 October 2019 Gaziantep University, TURKEY
195
Ilkılıç, C., Aydın, S., Behcet, R., & Aydin, H. (2011). Biodiesel from safflower oil and its application in a diesel engine. Fuel processing technology, 92(3), 356-362. Jindal, S., Nandwana, B., Rathore, N., & Vashistha, V. (2010). Experimental investigation of the effect of compression ratio and injection pressure in a direct injection diesel engine running on Jatropha methyl ester. Applied Thermal Engineering, 30(5), 442-448. Mohanraj, T., & Mohan Kumar, K. M. (2013). Operating characteristics of a variable compression ratio engine using esterified tamanu oil. International Journal of Green Energy, 10(3), 285-301. Muralidharan, K., Vasudevan, D., & Sheeba, K. (2011). Performance, emission and combustion characteristics of biodiesel fuelled variable compression ratio engine. Energy, 36(8), 5385-5393. Pali, H. S., Kumar, N., & Alhassan, Y. (2015). Performance and emission characteristics of an agricultural diesel engine fueled with blends of Sal methyl esters and diesel. Energy Conversion and Management, 90, 146-153. Puhan, S., Vedaraman, N., Ram, B. V., Sankarnarayanan, G., & Jeychandran, K. (2005). Mahua oil (Madhuca Indica seed oil) methyl ester as biodiesel-preparation and emission characterstics. Biomass and Bioenergy, 28(1), 87-93. Sharma, A., & Murugan, S. (2015). Potential for using a tyre pyrolysis oil-biodiesel blend in a diesel engine at different compression ratios. Energy Conversion and Management, 93, 289-297. Shrivastava, P., Verma, T. N., & Pugazhendhi, A. (2019). An experimental evaluation of engine performance and emisssion characteristics of CI engine operated with Roselle and Karanja biodiesel. Fuel, 254, 115652. Sidhu, M. S., Roy, M. M., & Wang, W. (2018). Glycerine emulsions of diesel-biodiesel blends and their performance and emissions in a diesel engine. Applied Energy, 230, 148-159. Szybist, J. P., Song, J., Alam, M., & Boehman, A. L. (2007). Biodiesel combustion, emissions and emission control. Fuel processing technology, 88(7), 679-691. Tat, M. E., Van Gerpen, J. H., Soylu, S., Canakci, M., Monyem, A., & Wormley, S. (2000). The speed of sound and isentropic bulk modulus of biodiesel at 21 C from atmospheric pressure to 35 MPa. Journal of the American Oil Chemists' Society, 77(3), 285-289.

UEMK 2019 Proceedings Book 24/25 October 2019 Gaziantep University, TURKEY
196
INVESTIGATION OF ENERGY QUALITY IN FABRIC DYING FACILITIES Ahmed KADİFECİ University of Kahramanmaraş Sütçü İmam Granduate School of Natural and Applied Sciences Department of Electric-Electronic Engineering [email protected] ABSTRACT: The most common type of energy found in many forms on earth is electrical energy. Countries' energy consumption per capita is taken as the reference for development. The quality standards of such an important consumption item are determined by a number of internationally accepted guidelines. As a result of the advancement of technology, non-linear loads, which increase the density of use, adversely affect the quality of energy due to the semiconductor components they contain. In the textile dyeing sector, which is one of the most important parts of the textile industry, non-linear loads are used in almost every step from the beginning of the manufacturing process to the end. In this thesis, energy quality measurement of low voltage side of 4 different transformers of a fabric dyeing factory in Kahramanmaraş province is aimed to investigate the effect of the machines used on energy quality. Key words: energy quality, harmonics, flicker, ts en 50160 KUMAŞ BOYA TESİSLERİNDE ENERJİ KALİTESİNİN İNCELENMESİ
ÖZET: Yeryüzünde birçok formda bulunan enerji türlerinden en sık kullanılanı elektrik enerjisidir. Ülkelerin gelişmişlik belirtisi olarak kişi başına düşen enerji tüketimi referans alınmaktadır. Bu kadar önemli bir tüketim kaleminin kalite standartları uluslararası arenada kabul görmüş bir takım yönergelerle belirlenmiştir. Teknolojinin ilerlemesi sonucu kullanım yoğunluğu artan lineer olmayan yükler, içerdikleri yarı iletken bileşenlerden dolayı enerji kalitesine olumsuz etki etmektedir. Tekstil endüstrisinin en önemli parçalarından biri olan kumaş boyama sektöründe ise imalat sürecinin başından sonuna kadar neredeyse her adımda lineer olmayan yükler kullanılmaktadır. Bu tezde, Kahramanmaraş ilinde faaliyet gösteren bir kumaş boya fabrikasının 4 ayrı trafosunun alçak gerilim tarafında enerji kalitesi ölçümü yapılarak kullanılan makinelerin enerji kalitesine etkisinin incelenmesi hedeflenmiştir. Anahtar sözcükler: enerji kalitesi, harmonikler, fliker, ts en 50160.
UEMK 2019 Proceedings Book 24/25 October 2019 Gaziantep University, TURKEY
197
EFFICIENCY ESTIMATION OF ENERGY GENERATING COUNTRIES WITH SOLAR POWER
PLANTS BY DATA ENVELOPMENT ANALYSIS
Ufuk ALTINSOY Department of Industrial Engineering, Engineering Faculty, Kırıkkale University,Yahsihan, Kırıkkale,Turkey [email protected] Erdem AKSAKAL Department of Industrial Engineering, Engineering Faculty, Atatürk University, Yakutiye Erzurum,Turkey [email protected] ABSTRACT: Increasing population in the world, constantly developing technology, concerns about economic development and the reduction of fossil resources together with the increase in prices, and the damage caused to the ecological environment cause the countries to search for energy sources which may be an alternative to their primary energy resources. In this sense, solar energy, which is an unlimited source and has no harm to the ecological environment, is a strong alternative to classical energy sources. Countries that are dependent on non-renewable energy resources in energy production strengthen their investments in solar power generation. In this study, the efficiency status of the 9 countries that are considered as samples were evaluated with Data Envelopment Analysis (DEA) and the potential improvement targets were determined in order to enable ineffective countries to reach the effective level. Keywords: Data Envelopment Analysis, Solar Energy System, Energy Efficiency, Photovoltaic Energy GÜNEŞ ENERJİSİ SANTRALLERİ İLE ENERJİ ÜRETEN ÜLKELERİN ETKİNLİKLERİNİN VERİ ZARFLAMA ANALİZİ İLE BELİRLENMESİ ÖZET: Dünya üzerindeki nüfusun artması, sürekli gelişen teknoloji, ekonomik kalkınma kaygıları ve bunlarla beraber fosil kaynakların azalması, fiyatlarındaki artışlar ve ekolojik çevreye verdiği zararlar ülkelerin birincil enerji kaynaklarına alternatif olabilecek enerji kaynakları aramasına neden olmaktadır. Bu anlamda sınırsız bir kaynak olan ve ekolojik çevre düzenine hiçbir zararı olmayan güneş enerjisi, klasik enerji kaynakları karşısında güçlü bir alternatif olarak karşımıza çıkmaktadır. Enerji üretiminde yenilenemeyen enerji kaynaklarına bağımlı olan ülkeler, güneş enerjisinden elektrik üretimine yönelik yatırımlarını güçlendirmektedir. Bu çalışmada, örneklem olarak ele alınan 9 ülkenin Güneş Enerji Santrallerinden (GES) enerji üretimindeki etkinlik durumları Veri Zarflama Analizi (VZA) ile değerlendirilmiş, etkin olmayan ülkelerin etkin seviyeye gelebilmeleri için potansiyel iyileştirme hedefleri belirlenmiştir.

UEMK 2019 Proceedings Book 24/25 October 2019 Gaziantep University, TURKEY
198
Anahtar Kelimeler: Veri Zarflama Analizi, Güneş Enerji Sistemi, Enerji Verimliliği, Fotovoltaik Enerji GİRİŞ Dünya genelinde ülkelerin enerji ihtiyacının karşılanmasında yakın zamana kadar sıklıkla fosil yakıtlar ve nükleer santraller yardımıyla elde edilen enerji kullanılmaktaydı. Özellikle nükleer enerjinin ortaya çıkardığı problemler ve gelişen teknoloji ile beraber insana ve doğaya saygılı olacak yeni kaynak arayışları da ortaya çıkmıştır. Bu bağlamda ekonomik olduğu kadar kesintisiz ve temiz bir kaynak olan güneş, enerji üretiminde kullanılmaya başlamıştır. (Koç ve ark. 2018) Güneş enerjisi, kurulum ve kullanım kolaylığı olmasının yanı sıra çevreyi kirletmemesi ve zararlı atık oluşturmaması gibi özelliklere sahip bir yenilenebilir enerji kaynağıdır (T.C. Enerji ve Tabii Kaynaklar Bakanlığı). Güneş enerjisinin yenilenebilir enerji kaynaklarından biri olarak da ifade edilmesi sürekli bir kaynak olmasından ileri gelmektedir. Gelişmiş ülkeler kadar gelişmekte olan ülkeler de güneş enerjisinden faydalanmakta ve bu fayda oranını her geçen gün daha ileriye taşıyacak şekilde çalışmalar ortaya koymaktadırlar. (Taktak ve Mehmet, 2018). Bu bağlamda evrensel olarak ele alınmaya başlanan bu enerji türü, ülkelerin ekonomik ve politik olarak dikkate alacağı bir araç halini de almıştır. Özellikle artan dünya nüfusu ile ortaya çıkan elektrik ihtiyacı güneş enerjisinin öneminin giderek artmasına sebep olmuştur. Çevremize, geleceğimize ve insanlığa zararı olmayacak şekilde enerji ihtiyacının karşılanması, yenilenebilir enerji kaynaklarından birinin kullanılması sayesinde mümkün olabilmektedir. Yenilenebilir enerji kaynaklarının kullanımı ile çevreye daha az zarar veren sonuçların elde edilmesiyle günümüz dünyasının büyük problemlerinden biri olan iklim değişikliğinin önlenmesi hususunda da önemli mesafeler kaydetmek mümkün olabilecektir. Ülkemiz bulunduğu konum itibariyle, güneş enerjisi bakımından yüksek bir potansiyele sahiptir. Türkiye’nin güneş alma süresi sene içerisinde değişiklik gösterse de yıllık olarak yaklaşık 2 bin 741 saat (günlük ortalama 7,5 saat),olarak belirlenmiştir. Yıllık toplam gelen güneş enerjisi 1.527 kWh/m².yıl (günlük ortalama 4,18 kWh/m².gün) olduğu tespit edilmiştir. Günümüzde güneş enerjisinden çok farklı biçimlerde ve alanlarda yararlanılmaktadır. Bunlar arasında elektrik üretmek üzere güneş ışığını doğrudan elektrik enerjisine çeviren Fotovoltaik (PV) enerji sistemleri kullanılmaktadır (T.C. Enerji ve Tabii Kaynaklar Bakanlığı). Çalışmamızda kullanacağımız yöntem olan Veri Zarflama Analizi (VZA) üretim, hizmet ve finans sektörleri gibi dinamik olan uygulama alanlarına sahiptir. Enerji konusunda literatürde VZA ile ilgili çeşitli çalışmalar bulunmaktadır. Çalışmamızın özünü oluşturan Fotovoltaik enerji sistemlerinin VZA ile beraber kullanıldığı makaleleri incelediğimizde;
UEMK 2019 Proceedings Book 24/25 October 2019 Gaziantep University, TURKEY
199
Cucchiella ve Gastaldi (2014) VZA ile İtalya'daki fotovoltaik teknolojinin etkinliği, kurulu güç kapasitesi, güneş ışınımı, işletme ve yatırım yoğunluğunu girdi; enerji şiddeti ve kaçınılan CO2 miktarını çıktı olarak ele alarak değerlendirmişlerdir. Sueyoshi ve Goto (2014) Almanya ile ABD arasında hangi ülkenin daha verimli bir şekilde yenilenebilir enerji sağladığını fotovoltaik elektrik santrallerini karşılaştırarak incelemişlerdir. Mostafaeipour ve ark. (2016) Khuzestan vilayetindeki seçili 14 alanı fotovoltaik güç santrallerinin yapımı üzerine teknik-ekonomik bir fizibilite çalışmasında sıralamak için VZA, Kurumsal Karne ve Oyun Teorisi'nden oluşan bir bütünleşik yaklaşımı kullanmışlardır. Sueyoshi ve Goto (2017) çalışmalarında projeksiyon ve referans setinde benzersiz bir optimal çözüm varsayımı altında ölçeğe getiri tipinin nasıl sınıflandırılacağını VZA çerçevesinde incelemiştir. Uygulama olarak ise Amerika Birleşik Devletleri (ABD) ve Almanya'da sıklıkla “mega güneş parkları” olarak adlandırılan büyük fotovoltaik enerji santrallerindeki ölçeğe getiri tiplerinin sınıflandırmasında önerilen yaklaşımı kullanmışlardır. Villiers ve Vermeulen (2017) çalışmalarında bir fotovoltaik tesisin enerji dönüşüm performansını değerlendirmek için VZA çalışmasının sonuçlarını geleneksel yöntemlerle elde edilen sonuçlar ve yerel hava koşullarının tesis performansı üzerindeki etkilerini referans alarak incelemişlerdir. Khanjarpanah ve ark. (2018) bütünleşik bir enerji santralinin kurulması için uygun yerleşimin belirlenmesinde çift sınır ağ temelli VZA kullanan hem tek dönemli hem de çok dönemli programlamanın yapıldığı yeni bir algoritma önermişlerdir. Bu çalışmanın amacı Güneş Enerji Santralleri (GES) ile enerji üreten ülkelerin faaliyetlerinde etkin olup olmadıklarının VZA yöntemi ile değerlendirilmesidir. Çalışmanın çıktısında etkin olmayan ülkelerin, etkin olmak için ulaşmaları gereken sınıra dair gereken iyileştirme hedefleri de belirlenmeye çalışılmıştır. MATERYAL VE YÖNTEM VZA, benzer girdi değişkenleri kullanarak benzer çıktı değişkenleri elde eden, birimler arasında etkinlik analizi yapan non-parametrik bir yöntemdir. VZA ile yapılan analizde karar verme birimleri, verimliliği en iyi olan etkin karar verme birimine göre kıyaslama yapılır. Fakat VZA; Farrell (1957)’ in ağırlıklandırılmış çıktı değişkenlerinin ağırlıklandırılmış girdi değişkenleri ile oranlanması sonucunda yapılan performans ve etkinlik ölçümü ile ortaya çıkmıştır. VZA yöntemiyle aynı girdi ve çıktı değişkenleri benzer olan karar verme birimlerinin etkinlik ölçümü yapılabilir. Model çözüldükten sonra KVB’den etkinlik değeri 1 olanlar etkin KVB olarak kabul edilir. Etkinlik değeri 1’in altında ise etkin olmayan KVB olarak kabul edilir. Bu aşamadan sonra etkinlik skoru 1’in altında olan KVB etkinlik değeri 1 olan KVB’ ne benzetilmeye çalışılır (Banker ve Thrall, 1992). Diğer bir ifadeyle etkin olmayan KVB etkin olan KVB (referans küme) gibi etkin olabilmek için referans olarak belirlenen KVB’ nin girdi ve çıktı değişkenlerinin değerlerini hedeflemesi gerekmektedir.

UEMK 2019 Proceedings Book 24/25 October 2019 Gaziantep University, TURKEY
200
Bu sayede etkin olmayan KVB için potansiyel iyileştirmeler hesaplanır ve bu hesaplamalar aşağıdaki formülle yüzde olarak hesaplanabilir. PI (%) =( (Hedef Değer-Gerçekleşen Değer) / (Gerçekleşen Değer) ) x 100 VZA, “girdiye yönelimli” ve “çıktı yönelimli” olmak üzere ikiye ayrılır. Bu iki model temel olarak birbirine benzer ancak girdi yönelimli VZA modelleri mevcut çıktının elde edilebilmesi için en az girdi değişkenin kullanılması gerektiğini, çıktıya yönelimli VZA modelleri ise mevcut girdi değişkeni ile maksimum ne kadar çıktı değişkeni üretilmesi gerektiğini hesaplar (Banker ve Thrall, 1992). VZA ilk defa Charnes-Cooper-Rhodes (1978) tarafından ortaya koyulmuştur. Charnes-Cooper-Rhodes’un adlarının baş harflerinden oluşan CCR modeli ölçeğe göre sabit getiri altında KVB’lerinin etkinlik durumunu ölçmeyi hedeflemektedir. CCR modeli aşağıdaki gibi gösterilmektedir (Banker ve Thrall, 1992). UYGULAMA Çalışmanın amacı Güneş Enerji Santralleri(GES)’den enerji üreten ülkelerin bu kapsamda yaptıkları faaliyetleri etkin olarak yapıp yapmadıklarını ortaya koyabilmektir. Ayrıca etkin olmayan ülkelerin etkin olmayışlarının sebeplerini bularak etkin sınıra ulaşabilmeleri için iyileştirme hedefleri belirleyebilmektir. Çalışmada Fotovoltaik enerji sistemleri ile enerji üreten 9 Avrupa ülkesi (Avusturya, Belçika, Danimarka, Finlandiya, Norveç, Portekiz, İspanya, İsveç, Türkiye) ele alınmış ve Veri Zarflama Analizi ile etkinlik analizi yapılmıştır. Çalışmada kullanılan verilere ‘‘Uluslararası Enerji Şirketi’’ resmi internet sitesinde yayınlanmış 2018 yılı Fotovoltaik Güç Sistemleri Programı yayınından ulaşılmıştır. Kullanılan girdi ve çıktı değişkenleri elde edilebilen, güvenilir ve doğruluk ihtimali yüksek veriler doğrultusunda, daha önceki çalışmalarda kullanım şekilleri dikkate alınarak belirlenmiştir. Kullanılan girdiler, Toplam Kurulu Güç (MW), Nüfus (Milyon), Enerji Tüketimi (TWH)’dir. Kullanılan çıktılar ise Enerji üretimi (TWH), Kişi Başına Düşen Enerji Miktarı (%), Gayri Safi Milli Hâsıla (Milyar $)’dır. Etkinlik analizine başlamadan önce çalışma açısından önemli olabilecek değişkenin göz ardı edilmemesine ve verimlilik açısından ilişkisiz olan değişkenin çalışmaya dâhil edilmemesine dikkat edilmeye çalışılmıştır. Tablo 2’de çalışmada kullanılacak girdi ve çıktı değişkenleri gösterilmektedir. Tablo 2: Analizde kullanılan girdi ve çıktı kümesi
Girdi Değişkenleri Çıktı Değişkenleri
Toplam Kurulu Güç (X1) Enerji Üretimi (Y1)

UEMK 2019 Proceedings Book 24/25 October 2019 Gaziantep University, TURKEY
201
Nüfus (X2) Kişi Başına Düşen Enerji Miktarı (Y2)
Enerji Tüketimi(X3) Gayri Safi Milli Hasıla (Y3)
Yapılan çalışmada etkinlik ve verimlilik analizinde son dönemlerde çok sık uygulama alanı bulunan VZA yöntemi kullanılmıştır. Model, yazılımı Huberts Virtos tarafından geliştirilmiş olan Şekil 1’de gösterilen OSDEA-GUI programı kullanılarak çözülmüştür. Kullanılan programın anlaşılması kolay bir ara yüze sahip olması, yapılan analizi daha önceki yapılanlar ile karşılaştırma imkânı sağlaması, kontrol edilemeyen belirsiz değişkenler kullanarak analiz yapabilmesi imkânın olması, sınırsız değişken ve sınırsız KVB kullanabilmesi öne çıkan özelliklerindendir.
Şekil 1: OSDEA-GUI Programı Yapılan etkinlik analizi bazı girdi değişkenleri (güneşlenme süresi, nüfus) üzerinde kontrolün az olduğunun değerlendirilmesi ve mevcut çıktının iyileştirilmesi için en az girdinin kullanılmasını hedeflemesi sebebiyle “Çıktı Yönelimli CCR Modeli” ile gerçekleştirilmiştir. Girdi Yönelimli CCR Sabit Getirili Modeli ile yapılan hesaplamalar neticesinde Güneş Enerjisi Santrallerinden elektrik üreten 9 Avrupa ülkesinden Avusturya, Belçika, Danimarka, Norveç, İsveç’in etkin, Finlandiya, Portekiz, İspanya, Türkiye’nin etkin olmadığı görülmüştür. Analize ait etkinlik skorları Tablo 3’ te görüldüğü gibidir. Tablo 3: Girdiye yönelimli CCR modeline göre etkinlik skorları
Karar Verme Birimi (KVB) Etkinlik
Skoru Etkinlik Durumu
Avusturya (KVB1) 1 Etkin
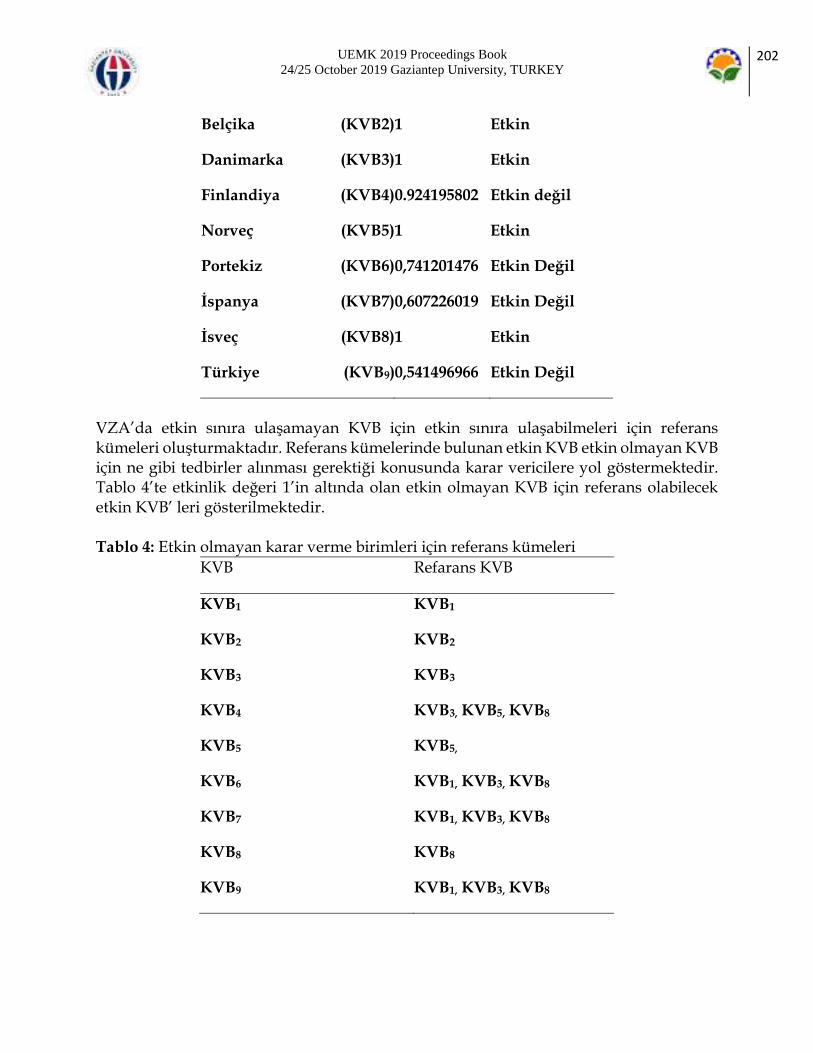
UEMK 2019 Proceedings Book 24/25 October 2019 Gaziantep University, TURKEY
202
Belçika (KVB2) 1 Etkin
Danimarka (KVB3) 1 Etkin
Finlandiya (KVB4) 0.924195802 Etkin değil
Norveç (KVB5) 1 Etkin
Portekiz (KVB6) 0,741201476 Etkin Değil
İspanya (KVB7) 0,607226019 Etkin Değil
İsveç (KVB8) 1 Etkin
Türkiye (KVB9) 0,541496966 Etkin Değil
VZA’da etkin sınıra ulaşamayan KVB için etkin sınıra ulaşabilmeleri için referans kümeleri oluşturmaktadır. Referans kümelerinde bulunan etkin KVB etkin olmayan KVB için ne gibi tedbirler alınması gerektiği konusunda karar vericilere yol göstermektedir. Tablo 4’te etkinlik değeri 1’in altında olan etkin olmayan KVB için referans olabilecek etkin KVB’ leri gösterilmektedir. Tablo 4: Etkin olmayan karar verme birimleri için referans kümeleri
KVB Refarans KVB
KVB1 KVB1
KVB2 KVB2
KVB3 KVB3
KVB4 KVB3, KVB5, KVB8
KVB5 KVB5,
KVB6 KVB1, KVB3, KVB8
KVB7 KVB1, KVB3, KVB8
KVB8 KVB8
KVB9 KVB1, KVB3, KVB8

UEMK 2019 Proceedings Book 24/25 October 2019 Gaziantep University, TURKEY
203
Etkin olmayan KVB için gösterilen referans KVB’nin lambda değerleri Tablo-5’te gösterilmiştir. Lambda değerleri birden fazla referans birimine sahip etkin olmayan KVB’nin hangi referans biriminin girdi ve çıktı değerlerini hedef alarak etkin sınıra ulaşmaya çalışacağını belirtir. Tablo 5: Etkin olmayan karar verme birimleri Lambda değerleri
KVB KVB1 KVB2 KVB3 KVB5 KVB8
KVB1 1 0 0 0 0 KVB2 0 1 0 0 0 KVB3 0 0 1 0 0 KVB4 0 0 0,053155332 0,614491232 0,01425787 KVB5 0 0 0 1 0 KVB6 0,000608698 0 0,560897089 0 0,216801225 KVB7 0,007110234 0 5,613745876 0 0,662901072 KVB8 0 0 0 0 1 KVB9 0,004460523 0 3,45728485 0 0,854662926
KVB’nin referans kümesini oluşturan etkin KVB’lerine ait lambda değerleri etkin girdi ve çıktı değerlerine ulaşmak için katkı oranını ifade etmektedir. İspanya’nın referans kümesini oluşturan ülkelere ait lambda değerleri toplamı için toplam lambda değeri 6,283757182 (0,007110234+5,613745876+0,662901072) yani %63’ lük etki oranına sahiptir. İspanya’nın etkin sınıra ulaşması için 3 referans kümesi vardır. Fakat Danimarka’nın etki değeri Avusturya ve İsveç’e kıyasla daha fazla olduğu görülmektedir. Bu sebeple İspanya etkin sınıra ulaşabilmek için Danimarka’yı referans alacaktır. Etkinlik değerleri 1’in altında olan KVB’leri için yapılacak iyileştirmeler ile etkin sınıra ulaşılabilir. Bu durum VZA’nın sağladığı en önemli faydadır. Etkinlik değeri altında kalan KVB’lerinin etkin olan KVB’lerine benzemek için ulaşmaya çalıştığı hedefe potansiyel iyileştirme hedefi denir. Potansiyel iyileştirme hedef değerleri Tablo 6’da verilmiştir. Tablo 6: Girdi ve çıktı değişkenlerine ait hedef değerler
KVB X1 X2 X3 Y1 Y2 Y3
KVB4 80 3,533966846
86 0,053155332
27,0505448
14,06628332
KVB6 581 5,538873061
48 1,349160831
29,6815382
92,28164915
KVB7 5331 40,37547809
268 14,82149925
215,735155
875,5260812
KVB9 3427 29,33048306
228 9,233662067
156,972255
553,4988261
Finlandiya, Portekiz, İspanya, Türkiye; girdi ve çıktı değişkenlerinde Tablo 6’da gösterilen değerlere göre değişiklik yapılması halinde etkin sınıra ulaşacaktır. Örneğin

UEMK 2019 Proceedings Book 24/25 October 2019 Gaziantep University, TURKEY
204
Finlandiya enerji üretimini 1,349 TWh’e yükseltirse, GSMH 29,6 Milyar $ olursa ve kişi başına düşen enerji miktarı 92,281 W/Kişi seviyesine ulaştırırsa etkin seviyeye ulaşabilir. Finlandiya’da olduğu gibi diğer etkin olmayan ülkeler de yapılacak iyileştirmelerle etkin seviyeye ulaşabilir. SONUÇ Çalışmada örneklem olarak ele alınan 9 ülkede (KVB) Güneş Enerjisinden PV yöntemi ile enerji elde etmeye yönelik etkinlik analizi yapılmıştır. Yapılan değerlendirme neticesinde 5 ülkenin ‘ETKİN’ olduğu 4 ülkenin ‘etkin olmadığı’ sonucuna ulaşılmıştır. Analiz neticesinde etkin olmayan ülkelerin etkin olabilmesi için gerekli olan potansiyel iyileştirme hedefleri tespit edilmiştir. Standart VZA yaklaşımında etkin sınırda yer almayan bir karar birimi ancak bütün girdiler hedef değerlere getirildiğinde etkin sınıra gelebilmektedir. Oysa bu durum gerçekte mümkün olmayabilir. Örneğin GSMH’yi arttırmak hemen yapılabilecek bir durum değildir. Buna müdahale etme olasılığı vardır ama kısa vadede elde edilebilecek bir sonuç değildir. Bu noktada VZA’nin her bir girdi ve çıktıyı odak noktası alarak gerçekleştirilen bir türü olan Ölçüt Odaklı VZA’nin gerçekleştirilmesi hedeflerin sadece bir girdiye veya çıktıya yönelik olarak belirlenmesi daha ulaşılabilir bir bakış açısı sunmaktadır. KAYNAKLAR Banker, R. D. ve Thrall, R. M., (1992). Estimation of returns to scale using data envelopment analysis. European Journal of Operational Research, 62, 1, 74-84. Charnes, A., Cooper, W. W. ve Rhodes, E., (1978). Measuring the efficiency of decision making units, European journal of operational research, 2, 6, 429-444. Charnes, A., Cooper, W. W. ve Rhodes, E., (1981). Evaluating program and managerial efficiency: an application of data envelopment analysis to program follow through. Management science, 27, 6, 668-697. Cingi, S. ve Tarım, A. (2000). Türk banka sisteminde performans ölçümü Dea-Malmquist Tfp endeksi uygulaması. Türkiye Bankalar Birliği Araştırma Tebliğleri Serisi, 1, 1-34. Cucchiella, F., & Gastaldi, M. (2014). Data envelopment analysis to evaluate photovoltaic plants in Italy. In Advanced Materials Research (Vol. 827, pp. 435-440). Trans Tech Publications. De Villiers, A., & Vermeulen, H. J. (2017, June). Sector performance monitoring in utility-scale solar farms using data envelopment analysis. In 2017 IEEE PES PowerAfrica (pp. 192-197). IEEE. Farrell, M.J. (1957). The Measurement of Productive Efficiency. Journal of the Royal Statistical Society, 120, 253-290. Khanjarpanah, H., Jabbarzadeh, A., & Seyedhosseini, S. M. (2018). A novel multi-period double frontier network DEA

UEMK 2019 Proceedings Book 24/25 October 2019 Gaziantep University, TURKEY
205
to sustainable location optimization of hybrid wind-photovoltaic power plant with real application. Energy Conversion and Management, 159, 175-188. Koç, A., Yağlı, H., Koç, Y., & Uğurlu, İ. (2018). Dünyada ve Türkiye’de Enerji Görünümünün Genel Değerlendirilmesi. Mostafaeipour, A., Qolipour, M., & Mohammadi, K. (2016). Evaluation of installing photovoltaic plants using a hybrid approach for Khuzestan province, Iran. Renewable and Sustainable Energy Reviews, 60, 60-74. Sueyoshi, T., & Goto, M. (2014). Photovoltaic power stations in Germany and the United States: A comparative study by data envelopment analysis. Energy Economics, 42, 271-288. Sueyoshi, T., & Goto, M. (2017). Measurement of returns to scale on large photovoltaic power stations in the United States and Germany. Energy Economics, 64, 306-320. Taktak, F., & Mehmet, I. L. I. (2018). Güneş Enerji Santrali (GES) Geliştirme: Uşak Örneği. Geomatik, 3(1), 1-21. T.C. Enerji ve Tabii Kaynaklar Bakanlığı - Güneş. (n.d.). Retrieved from https://www.enerji.gov.tr/tr-TR/Sayfalar/Gunes.
UEMK 2019 Proceedings Book 24/25 October 2019 Gaziantep University, TURKEY
206
EXPERIMENTAL INVESTIGATION OF EFFECTS ON ENGINE PERFORMANCE AND EXHAUST EMISSION PARAMETERS OF TERNARY FUEL BLEND AS DIESEL-BIODIESEL-BUTANOL Murat CİNİVİZ Technology Faculty, Selcuk University, Konya, Turkey Automotive Application and Research Center, Selcuk University, Konya, Turkey [email protected] İlker ÖRS Cihanbeyli Vocational School, Selcuk University, Konya, Turkey Automotive Application and Research Center, Selcuk University, Konya, Turkey [email protected] Bahar SAYIN KUL Technology Faculty, Selcuk University, Konya, Turkey [email protected] ABSTRACT: In this study, 5% isobutanol were added in 20% safflower biodiesel and 80% diesel fuel blend, and performance (brake specific fuel consumption and thermal efficiency) and exhaust emission parameters (CO, HC, NOx and smoke opacity) have been investigated in a single cylinder diesel engine. As results, isobutanol addition improved cold flow properties, effected negatively engine performance, CO and HC emissions, and it decreased NOx and smoke opacity values. Key words: biodiesel, isobutanol, engine performance, exhaust emissions, diesel engine INTRODUCTION The renewables energy sector is seeing increased growth especially because of the changing governmental legislations aimed at improving energy security and curbing greenhouse gas emissions (Abbas & Ansumali, 2010). Biodiesel is a viable alternative fuel for diesel engines because it is widely available, non-toxic and renewable (Wei, Cheung, & Ning, 2018). Previous studies have demonstrated that the addition of biodiesel to diesel leads to higher fuel consumption and higher nitrogen oxides (NOx) emission, lower carbon monoxide (CO), unburnt hydrocarbon (HC) and particulate matter (PM) emissions, while there is little change in the brake thermal efficiency (BTE) (Agarwal, Gupta, & Dhar, 2017; Shahir, Jawahar, & Suresh, 2015). Biodiesel can be produced from vegetable oil (or) animal fat primarily by micro emulsions with alcohols, thermal cracking

UEMK 2019 Proceedings Book 24/25 October 2019 Gaziantep University, TURKEY
207
and Transesterification with short chain alcohols in the presence of a catalyst (Prabu, Asokan, Roy, Francis, & Sreelekh, 2017). Although, nowadays, biodiesel can blend at every ratio with diesel fuel, it was presented that especially blended 20% biodiesel content can use without any modification in diesel engines (Aktaş & Şahin, 2009; Van Gerpen, Peterson, & Goering, 2007). The alcohols are used for decrease of higher NOx emission of biodiesel and improve of its cold flow properties. Methanol (Yilmaz & Sanchez, 2012), ethanol (Krishna, Salam, Tongroon, & Chollacoop, 2019), isopropyl (Tsai et al., 2014), butanol (Hosseinzadeh-Bandbafha, Tabatabaei, Aghbashlo, Khanali, & Demirbas, 2018) and pentanol (Chen, Su, He, & Xie, 2019) are alcohols use of the most commonly. These alcohols contents C atoms respectively between 1-5 number (methanol CH4, ethanol C2H6, isopropyl C3H8, butanol C4H10 and pentanol C5H12). In general, high carbon alcohols are chooses due to better mixes with diesel engine fuels. Goga et al. added 10 and 20% butanol in blend containing 20% rice bran biodiesel by volume at their study. As results, they presented that biodiesel increased brake specific fuel consumption (bsfc), besides, it increased further with butanol addition. Although, both biodiesel and butanol decreased CO and smoke emissions, biodiesel increased NOx emission, and butanol increased HC emission (Goga, Chauhan, Mahla, & Cho, 2019). According to Wei et al., butanol decreased NOx and smoke emissions, although it increased CO emission due to effected negatively combustion. Besides, low butanol addition was decreased HC emission but it increased with rise of butanol in blend (Wei et al., 2018). Karabektas et al. presented the effects of 5 – 20% butanol addition to the diesel fuel on the performance and emissions. They reported that the HC, CO and NOx emissions decreased by rise of the amount of butanol in blend (Karabektas & Hosoz, 2009). Kumar and Pali , butanol at 5 – 20% mixed with biodiesel produced from Jatropha by volumetric, and were tested in a DI diesel engine. The improve for engine performance and the significantly reduce for exhaust emissions due to reduced viscosity and more oxygen content in the fuels with addition of butanol (Kumar & Pali, 2016). Siwale et al. reported the effect of butanol-diesel blends on exhaust emissions in a diesel engine. As a result of their study, an important reduction in soot was observed as the ratio of butanol in the blend (Siwale et al., 2013). In this study, %20 biodiesel from safflower oil as volumetric blended with diesel fuel. Then, 5% butanol added in this blend fuel for lower NOx emissions and kinematic viscosity. The effects on engine performance and exhaust emissions of both biodiesel and butanol investigated. MATERIALS AND METHODS

UEMK 2019 Proceedings Book 24/25 October 2019 Gaziantep University, TURKEY
208
Biodiesel was produced with conventional transesterification method from safflower seed oil. B20 test fuel was occurred with blend of 80% diesel fuel plus 20%biodiesel. The B20Bu5 ternary blend fuel was obtained with 5% isobutanol addition in this blend. Some properties of the all test fuels given in Table 1. Table 1. Some fuel properties of test fuels
Fuels / Properties Diesel fuel
B20 B20Bu5
Density (kg/m3, at 15oC)
831.96 842.33 839.76
Viscosity (mm2/s, at 40 oC)
2.767 3.015 3.634
LHV (MJ/kg) 45.609 42.234 41.122 Cetane index 47.89 49.14 48.55 CFPP (oC) -18 -16.5 -17.5
LHV: Lower Heating Value CFPP: Cold Filter Plugging Point
Tests were conducted in a single cylinder and direct injection diesel engine at four engine load (25-50-75-100%). The features of gas analyzer used during tests presented Table 2. Table 2. The features of gas analyzer
Gases / Features Measuring range
Precision
CO (%) 0-15 ± 0.02 ppm HC (ppm) 0-2000 ± 4 ppm NOx (ppm) 0-5000 ± 25 ppm Smoke opacity (m-1)
0-10 ± 2% absolute
RESULTS AND FINDINGS Figure 1 has been shown bsfc and thermal efficiency values of test fuels as engine performance parameters. B20 fuel’s bsfc values is higher average 5.56% than diesel fuel due to lower LHV of biodiesel compare to diesel fuel. The bsfc values obtained with isobutanol addition increased according to B20 fuel by average 3%. However, biodiesel caused an increase of average 2.31% for thermal efficiency owing to decreased of pomp leaks due to its high density. But, isobutanol addition decreased thermal efficiency values
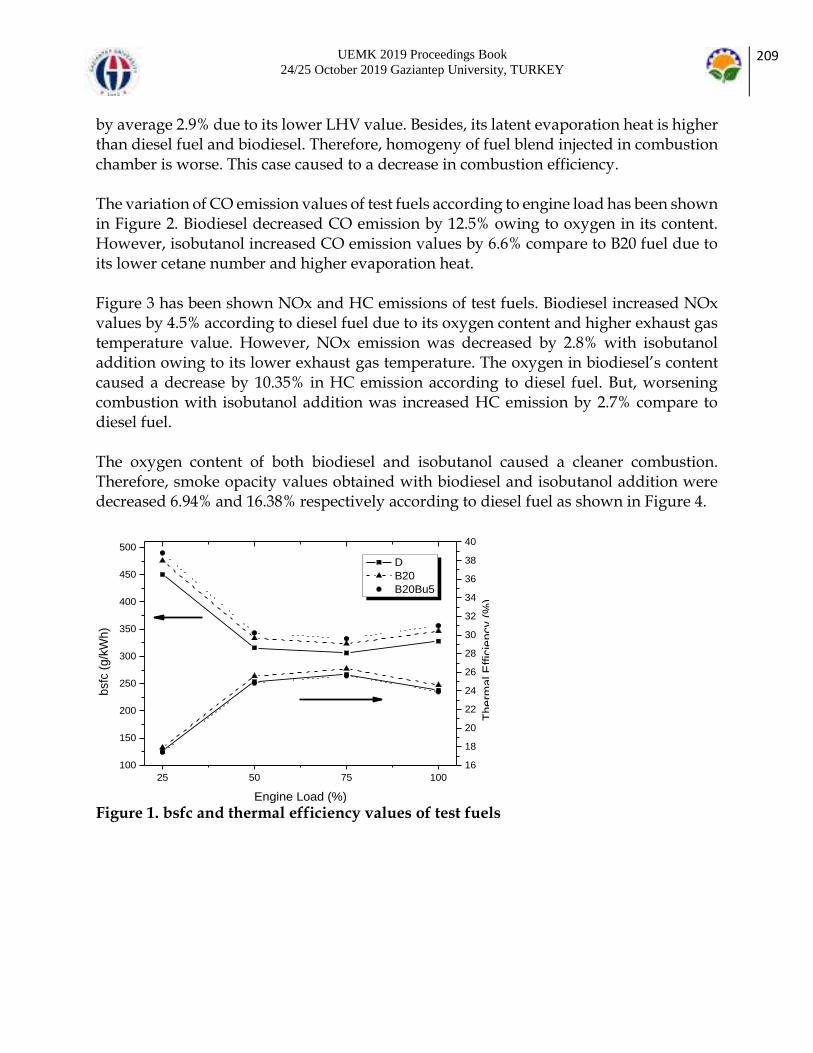
UEMK 2019 Proceedings Book 24/25 October 2019 Gaziantep University, TURKEY
209
by average 2.9% due to its lower LHV value. Besides, its latent evaporation heat is higher than diesel fuel and biodiesel. Therefore, homogeny of fuel blend injected in combustion chamber is worse. This case caused to a decrease in combustion efficiency. The variation of CO emission values of test fuels according to engine load has been shown in Figure 2. Biodiesel decreased CO emission by 12.5% owing to oxygen in its content. However, isobutanol increased CO emission values by 6.6% compare to B20 fuel due to its lower cetane number and higher evaporation heat. Figure 3 has been shown NOx and HC emissions of test fuels. Biodiesel increased NOx values by 4.5% according to diesel fuel due to its oxygen content and higher exhaust gas temperature value. However, NOx emission was decreased by 2.8% with isobutanol addition owing to its lower exhaust gas temperature. The oxygen in biodiesel’s content caused a decrease by 10.35% in HC emission according to diesel fuel. But, worsening combustion with isobutanol addition was increased HC emission by 2.7% compare to diesel fuel. The oxygen content of both biodiesel and isobutanol caused a cleaner combustion. Therefore, smoke opacity values obtained with biodiesel and isobutanol addition were decreased 6.94% and 16.38% respectively according to diesel fuel as shown in Figure 4.
25 50 75 100100
150
200
250
300
350
400
450
500
D B20 B20Bu5
Engine Load (%)
bsfc
(g/
kWh)
16
18
20
22
24
26
28
30
32
34
36
38
40
The
rmal
Effi
cien
cy (
%)
Figure 1. bsfc and thermal efficiency values of test fuels

UEMK 2019 Proceedings Book 24/25 October 2019 Gaziantep University, TURKEY
210
25 50 75 1000,0
0,2
0,4
0,6
0,8
1,0
1,2
1,4
1,6
1,8
2,0
D B20 B20Bu5
Engine Load (%)
CO
Em
issi
on (
%)
Figure 2. The variation of CO emission values of test fuels
25 50 75 100100
150
200
250
300
350
400
450
500
550
600
650
D B20 B20Bu5
Engine Load (%)
NO
x E
mis
sion
(pp
m)
50
100
150
200
250
300
350
HC
Em
issi
on (
ppm
)
Figure 3. NOx and HC emissions values of test fuels

UEMK 2019 Proceedings Book 24/25 October 2019 Gaziantep University, TURKEY
211
25 50 75 1000
1
2
3
4
5
D B20 B20Bu5
Engine Load (%)
Sm
oke
Opa
city
(m
-1)
Figure 4. Smoke opacity values of test fuels CONCLUSION Biodiesel is an optimal alternative fuel for diesel engines. But, although biodiesel’s better emission parameters according to diesel fuel, its bad cold flow properties make it difficult to use. Therefore, the addition of isobutanol as an alcohol having a high carbon atom helped to solve these problems. Although isobutanol effected performance and some emission parameters as negatively, it has been caused lower NOx and smoke opacity values. Besides, homogeny of fuel blend was provided a long time due to isobutanol has high C atom numbers. REFERENCES Abbas, A., & Ansumali, S. (2010). Global potential of rice husk as a renewable feedstock for ethanol biofuel production. BioEnergy Research, 3(4), 328-334. Agarwal, A. K., Gupta, J. G., & Dhar, A. (2017). Potential and challenges for large-scale application of biodiesel in automotive sector. Progress in Energy and Combustion Science, 61, 113-149. Aktaş, A., & Şahin, Ö. (2009). Dizel/biyodizel karışımı ile çalışan bir motorun performans ve emisyonlarını iyileştirmek için hidrojen kullanılması. Uludağ University Journal of The Faculty of Engineering, 14(1), 87-97. Chen, H., Su, X., He, J., & Xie, B. (2019). Investigation on combustion and emission characteristics of a common rail diesel engine fueled with diesel/n-pentanol/methanol blends. Energy, 167, 297-311.

UEMK 2019 Proceedings Book 24/25 October 2019 Gaziantep University, TURKEY
212
Goga, G., Chauhan, B. S., Mahla, S. K., & Cho, H. M. (2019). Performance and emission characteristics of diesel engine fueled with rice bran biodiesel and n-butanol. Energy Reports, 5, 78-83. Hosseinzadeh-Bandbafha, H., Tabatabaei, M., Aghbashlo, M., Khanali, M., & Demirbas, A. (2018). A comprehensive review on the environmental impacts of diesel/biodiesel additives. Energy Conversion and Management, 174, 579-614. Karabektas, M., & Hosoz, M. (2009). Performance and emission characteristics of a diesel engine using isobutanol–diesel fuel blends. Renewable energy, 34(6), 1554-1559. Krishna, S. M., Salam, P. A., Tongroon, M., & Chollacoop, N. (2019). Performance and emission assessment of optimally blended biodiesel-diesel-ethanol in diesel engine generator. Applied Thermal Engineering, 155, 525-533. Kumar, N., & Pali, H. S. (2016). Effects of n-Butanol Blending with Jatropha Methyl Esters on Compression Ignition Engine. Arabian Journal for Science and Engineering, 41(11), 4327-4336. Prabu, S. S., Asokan, M., Roy, R., Francis, S., & Sreelekh, M. (2017). Performance, combustion and emission characteristics of diesel engine fuelled with waste cooking oil bio-diesel/diesel blends with additives. Energy, 122, 638-648. Shahir, V., Jawahar, C., & Suresh, P. (2015). Comparative study of diesel and biodiesel on CI engine with emphasis to emissions—a review. Renewable and Sustainable Energy Reviews, 45, 686-697. Siwale, L., Kristóf, L., Adam, T., Bereczky, A., Mbarawa, M., Penninger, A., & Kolesnikov, A. (2013). Combustion and emission characteristics of n-butanol/diesel fuel blend in a turbo-charged compression ignition engine. Fuel, 107, 409-418. Tsai, J.-H., Chen, S.-J., Huang, K.-L., Lin, W.-Y., Lee, W.-J., Lin, C.-C., . . . Kuo, W.-C. (2014). Emissions from a generator fueled by blends of diesel, biodiesel, acetone, and isopropyl alcohol: Analyses of emitted PM, particulate carbon, and PAHs. Science of the total environment, 466, 195-202. Van Gerpen, J. H., Peterson, C. L., & Goering, C. E. (2007). Biodiesel: An alternative fuel for compression ignition engines: American Society of Agricultural and Biological Engineers. Wei, L., Cheung, C., & Ning, Z. (2018). Effects of biodiesel-ethanol and biodiesel-butanol blends on the combustion, performance and emissions of a diesel engine. Energy, 155, 957-970. Yilmaz, N., & Sanchez, T. M. (2012). Analysis of operating a diesel engine on biodiesel-ethanol and biodiesel-methanol blends. Energy, 46(1), 126-129.
UEMK 2019 Proceedings Book 24/25 October 2019 Gaziantep University, TURKEY
213
SUSTAINABLE GREEN BUILDING ASSESSMENT FOR SHOPPING MALLS Emine Elif NEBATİ İstanbul sabahattin zaim üniversitesi [email protected] İsmail EKMEKÇİ İstanbul ticaret üniversiesi [email protected] ABSTRACT: Competition in shopping malls, which have an important place in our social life, is increasing day by day. Therefore, management must be vital and sustainable in order to achieve success in shopping malls. In particular, it is necessary to create a safe, comfortable and clean environment for visitors and tenants, monitoring of technical services, water efficiency and energy optimization should be prioritized. In the long term, sustainability has been observed to have positive effects on both investment and the environment. Green building certificates are one of the innovative and sustainable practices that have recently become widespread. It can be said that the concept of green building is emphasized especially with the definitions of sustainable and ecological buildings. It is of great importance for both today and the future that many different units, from ventilation to lighting, heating and cooling, to building automation, create sustainable and green investments in line with a common principle. It can be said that especially in recent years, green building certification systems, which are rapidly becoming widespread in the World and Turkey, it contribute positively to the environmental performance of buildings. LEED and Breeam certificates are also some of these systems. In this study, based on all these developments, the criteria for measuring the building performance of shopping centers under the name of green building are discussed. A model was proposed based on expert opinions and literature studies. The selected criteria have been taken into consideration in many national and international green building certification systems such as ÇEDBİK, LEED, BREEAM and have been developed with some changes. With the correct structuring in shopping malls, a significant contribution can be made to the sustainable success of the shopping malls, to the profitability of both tenants and investors, and to a more effective assessment of their performance. Key words: Green buildings, Shopping malls, Performance measurement.

UEMK 2019 Proceedings Book 24/25 October 2019 Gaziantep University, TURKEY
214
PID CONTROL DESIGN FOR A COOLING SYSTEM Baris SANDAL Istanbul University-Cerrahpasa [email protected] Yuksel HACIOGLU Istanbul University-Cerrahpasa [email protected] Nurkan YAGIZ Istanbul University-Cerrahpasa [email protected] ABSTRACT: The aim of this study is to introduce a PID controlled system model for heating, ventilation and air conditioning (HVAC) that works under the disruptive effect for summer cooling operations. While HVAC system models generally include several parts of the HVAC system and/or zone model, this study deals with a zone and full model of HVAC system. The indoor air temperature and relative humidity values in the zone were acquired from two calculation loops linked to each other. Mathematical models of the air handling unit (AHU) elements from mixing box to air duct, the single zone, the disturbance effect and the proportional–integral–derivative (PID) control approach, forming our HVAC system are presented. The indoor air temperature was held within acceptable limits by a PID controller via controlling the flow of cold water passing through the cooling coil. It was observed that there is no need for humidification due to high humidity in summer weather conditions. The overall system was simulated under the summer conditions of Istanbul, Turkey and the results demonstrated that the system is successful in regulating the zone temperature at the desired level. Key words: Cooling, Dynamic Model, Disturbance, PID Controller INTRODUCTION While developing HVAC technologies, attention is given to many features such as being eco-friendly, reducing energy costs, delivering high efficiency and enabling comfort conditions. It is aimed at obtaining the most suitable design by making simulations in the design stage in order to reach the determined goals. The most realistic model of the identified system should be used for reliable simulation results. Any model proposed for an element of the HVAC system is expected to give accurate results when simulated within the operating range of the entire system. Due to the nonlinear behavior of cooling coils, they are more difficult to model than other

UEMK 2019 Proceedings Book 24/25 October 2019 Gaziantep University, TURKEY
215
components and are complicated enough to be used only in numerical simulations. Jin, Cai, Wang and Yao (2006) developed the model presented by Wang, Shi and Cai (2004) and proposed a simpler, dynamic cooling coil unit (CCU) model with six parameters and a broad variety of operation range. Wemhoff (2012) proposed a calibration methodology to optimize the PID coefficients to reduce the energy consumption of the system. It is observed that calibrated integral and proportional coefficients increase energy saving and derivative coefficient has negligible effect. Geng (1993) examined the performance of the tuning rules based on open-loop parameters and based on ultimate parameters in the HVAC control system with disturbances and processing time delays. Wang, Shi and Cai (2001) developed a simple and effective PID autotuner that can be applied to HVAC systems. The PID controller is designed based on gain- and phase-margin specifications, the autotuner identifies a second order plus dead time model based on two continuous relay feedback experiments. Koçal and Muğan (2017) designed a simulation in MATLAB Simulink environment for the HVAC system of the whole ship they dealt with and obtained the desired temperature and humidity conditions for the spaces by adding PID controller to the model. In order to develop dynamic models based on mass and energy transfer of HVAC system components, it is necessary to understand in detail the physics and operating principles of the entire system. Each element that forms the HVAC system (AHU elements, zone and outdoor weather conditions) has distinct features and is usually non-linear. The operating mode and parameters (e.g. thermal, flow, structural) of each also differ. In this study, natural ventilation was added to the HVAC system model as time-varying disturbance and PID controller attempted to maintain indoor air conditions at requested intervals. This article is organized as follows: Mathematical models of HVAC system, relative humidity, disturbance effect and PID control approach are introduced, then numerical results are discussed and the concluding remarks are presented. METHODS The detailed dynamic mathematical model of the single zone HVAC system is given in detail, the system is exposed to disturbing effect and the temperature and relative humidity values are regulated with the PID controller. Components of the HVAC system such as PID controller, disturbing effect, zone, mixing box, circulation air fan, cooling coil, humidifier, air duct are modeled. The disturbing effect is caused by natural ventilation, opening the window at a certain time and remaining open for a certain time to the variable wind speed outdoor air. Outdoor air is very hot and humid in summer conditions, so the cooling coil is the most important component of AHU in summer operating mode, as it reduces both temperature and humidity to ensure comfort conditions. The humidifier will not activate because the humidity is high in summer operating conditions. The study contains some acceptances; it is assumed that there is no friction in the air flow, it is assumed that the air mixes completely in the zone, the outdoor conditions do not change over time, the properties of components of the HVAC system
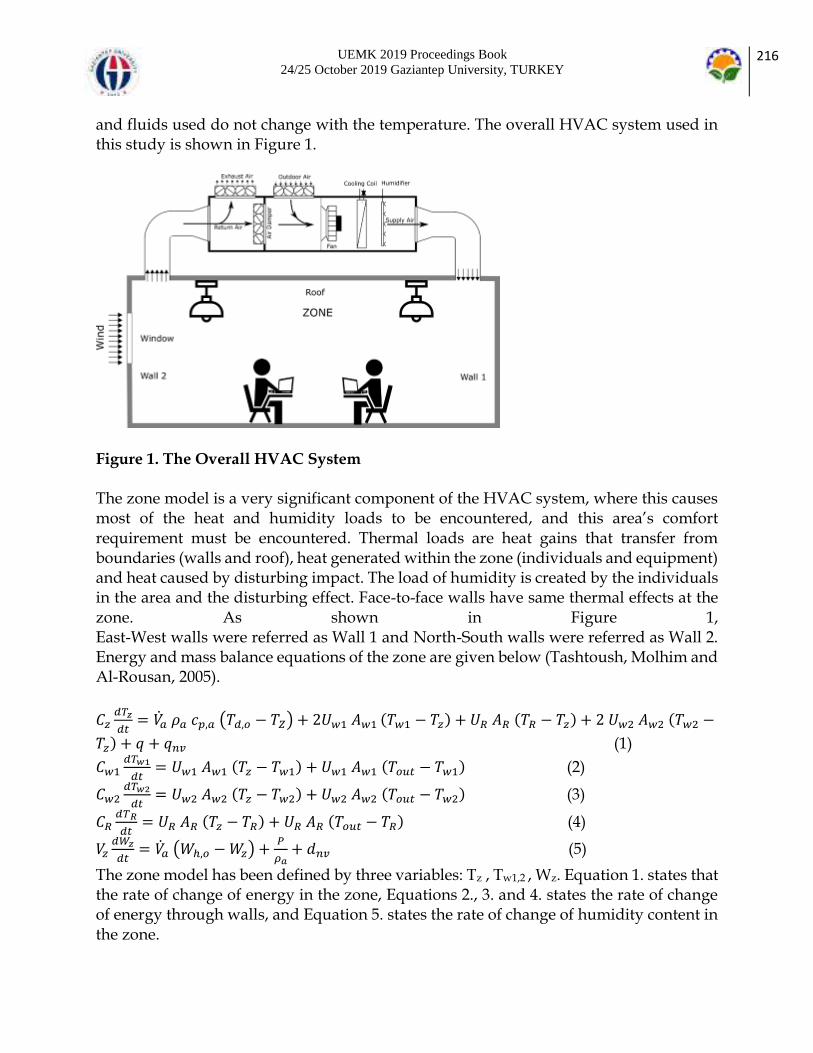
UEMK 2019 Proceedings Book 24/25 October 2019 Gaziantep University, TURKEY
216
and fluids used do not change with the temperature. The overall HVAC system used in this study is shown in Figure 1.
Figure 1. The Overall HVAC System The zone model is a very significant component of the HVAC system, where this causes most of the heat and humidity loads to be encountered, and this area’s comfort requirement must be encountered. Thermal loads are heat gains that transfer from boundaries (walls and roof), heat generated within the zone (individuals and equipment) and heat caused by disturbing impact. The load of humidity is created by the individuals in the area and the disturbing effect. Face-to-face walls have same thermal effects at the zone. As shown in Figure 1, East-West walls were referred as Wall 1 and North-South walls were referred as Wall 2. Energy and mass balance equations of the zone are given below (Tashtoush, Molhim and Al-Rousan, 2005).
𝐶𝑧𝑑𝑇𝑧
𝑑𝑡= 𝑎 𝜌𝑎 𝑐𝑝,𝑎 (𝑇𝑑,𝑜 − 𝑇𝑍) + 2𝑈𝑤1 𝐴𝑤1 (𝑇𝑤1 − 𝑇𝑧) + 𝑈𝑅 𝐴𝑅 (𝑇𝑅 − 𝑇𝑧) + 2 𝑈𝑤2 𝐴𝑤2 (𝑇𝑤2 −
𝑇𝑧) + 𝑞 + 𝑞𝑛𝑣 (1)
𝐶𝑤1𝑑𝑇𝑤1
𝑑𝑡= 𝑈𝑤1 𝐴𝑤1 (𝑇𝑧 − 𝑇𝑤1) + 𝑈𝑤1 𝐴𝑤1 (𝑇𝑜𝑢𝑡 − 𝑇𝑤1) (2)
𝐶𝑤2𝑑𝑇𝑤2
𝑑𝑡= 𝑈𝑤2 𝐴𝑤2 (𝑇𝑧 − 𝑇𝑤2) + 𝑈𝑤2 𝐴𝑤2 (𝑇𝑜𝑢𝑡 − 𝑇𝑤2) (3)
𝐶𝑅𝑑𝑇𝑅
𝑑𝑡= 𝑈𝑅 𝐴𝑅 (𝑇𝑧 − 𝑇𝑅) + 𝑈𝑅 𝐴𝑅 (𝑇𝑜𝑢𝑡 − 𝑇𝑅) (4)
𝑉𝑧𝑑𝑊𝑧
𝑑𝑡= 𝑎 (𝑊ℎ,𝑜 −𝑊𝑧) +
𝑃
𝜌𝑎+ 𝑑𝑛𝑣 (5)
The zone model has been defined by three variables: Tz , Tw1,2 , Wz. Equation 1. states that the rate of change of energy in the zone, Equations 2., 3. and 4. states the rate of change of energy through walls, and Equation 5. states the rate of change of humidity content in the zone.
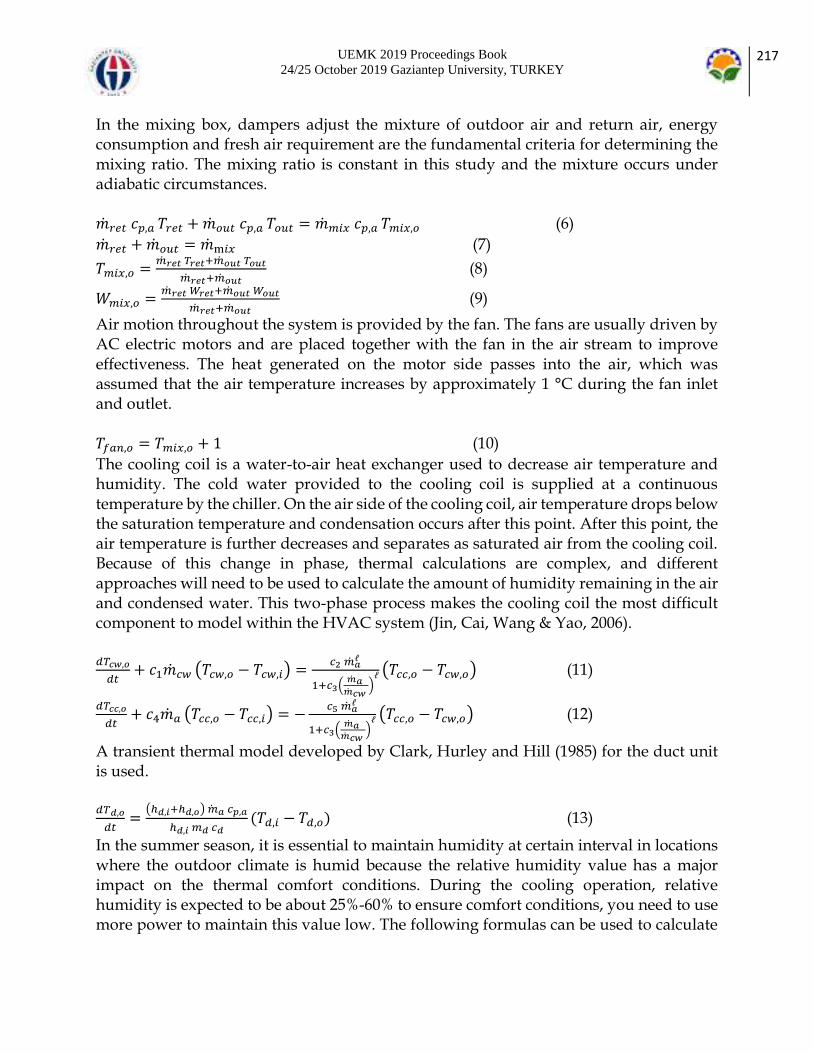
UEMK 2019 Proceedings Book 24/25 October 2019 Gaziantep University, TURKEY
217
In the mixing box, dampers adjust the mixture of outdoor air and return air, energy consumption and fresh air requirement are the fundamental criteria for determining the mixing ratio. The mixing ratio is constant in this study and the mixture occurs under adiabatic circumstances. 𝑟𝑒𝑡 𝑐𝑝,𝑎 𝑇𝑟𝑒𝑡 + 𝑜𝑢𝑡 𝑐𝑝,𝑎 𝑇𝑜𝑢𝑡 = 𝑚𝑖𝑥 𝑐𝑝,𝑎 𝑇𝑚𝑖𝑥,𝑜 (6)
𝑟𝑒𝑡 + 𝑜𝑢𝑡 = m𝑖𝑥 (7)
𝑇𝑚𝑖𝑥,𝑜 =𝑟𝑒𝑡 𝑇𝑟𝑒𝑡+𝑜𝑢𝑡 𝑇𝑜𝑢𝑡
𝑟𝑒𝑡+𝑜𝑢𝑡 (8)
𝑊𝑚𝑖𝑥,𝑜 =𝑟𝑒𝑡 𝑊𝑟𝑒𝑡+𝑜𝑢𝑡 𝑊𝑜𝑢𝑡
𝑟𝑒𝑡+𝑜𝑢𝑡 (9)
Air motion throughout the system is provided by the fan. The fans are usually driven by AC electric motors and are placed together with the fan in the air stream to improve effectiveness. The heat generated on the motor side passes into the air, which was assumed that the air temperature increases by approximately 1 °C during the fan inlet and outlet. 𝑇𝑓𝑎𝑛,𝑜 = 𝑇𝑚𝑖𝑥,𝑜 + 1 (10)
The cooling coil is a water-to-air heat exchanger used to decrease air temperature and humidity. The cold water provided to the cooling coil is supplied at a continuous temperature by the chiller. On the air side of the cooling coil, air temperature drops below the saturation temperature and condensation occurs after this point. After this point, the air temperature is further decreases and separates as saturated air from the cooling coil. Because of this change in phase, thermal calculations are complex, and different approaches will need to be used to calculate the amount of humidity remaining in the air and condensed water. This two-phase process makes the cooling coil the most difficult component to model within the HVAC system (Jin, Cai, Wang & Yao, 2006). 𝑑𝑇𝑐𝑤,𝑜
𝑑𝑡+ 𝑐1𝑐𝑤 (𝑇𝑐𝑤,𝑜 − 𝑇𝑐𝑤,𝑖) =
𝑐2 𝑎ℓ
1+𝑐3(𝑎 𝑐𝑤
)ℓ (𝑇𝑐𝑐,𝑜 − 𝑇𝑐𝑤,𝑜) (11)
𝑑𝑇𝑐𝑐,𝑜
𝑑𝑡+ 𝑐4𝑎 (𝑇𝑐𝑐,𝑜 − 𝑇𝑐𝑐,𝑖) = −
𝑐5 𝑎ℓ
1+𝑐3(𝑎 𝑐𝑤
)ℓ (𝑇𝑐𝑐,𝑜 − 𝑇𝑐𝑤,𝑜) (12)
A transient thermal model developed by Clark, Hurley and Hill (1985) for the duct unit is used. 𝑑𝑇𝑑,𝑜
𝑑𝑡=
(ℎ𝑑,𝑖+ℎ𝑑,𝑜) 𝑎 𝑐𝑝,𝑎
ℎ𝑑,𝑖 𝑚𝑑 𝑐𝑑(𝑇𝑑,𝑖 − 𝑇𝑑,𝑜) (13)
In the summer season, it is essential to maintain humidity at certain interval in locations where the outdoor climate is humid because the relative humidity value has a major impact on the thermal comfort conditions. During the cooling operation, relative humidity is expected to be about 25%-60% to ensure comfort conditions, you need to use more power to maintain this value low. The following formulas can be used to calculate
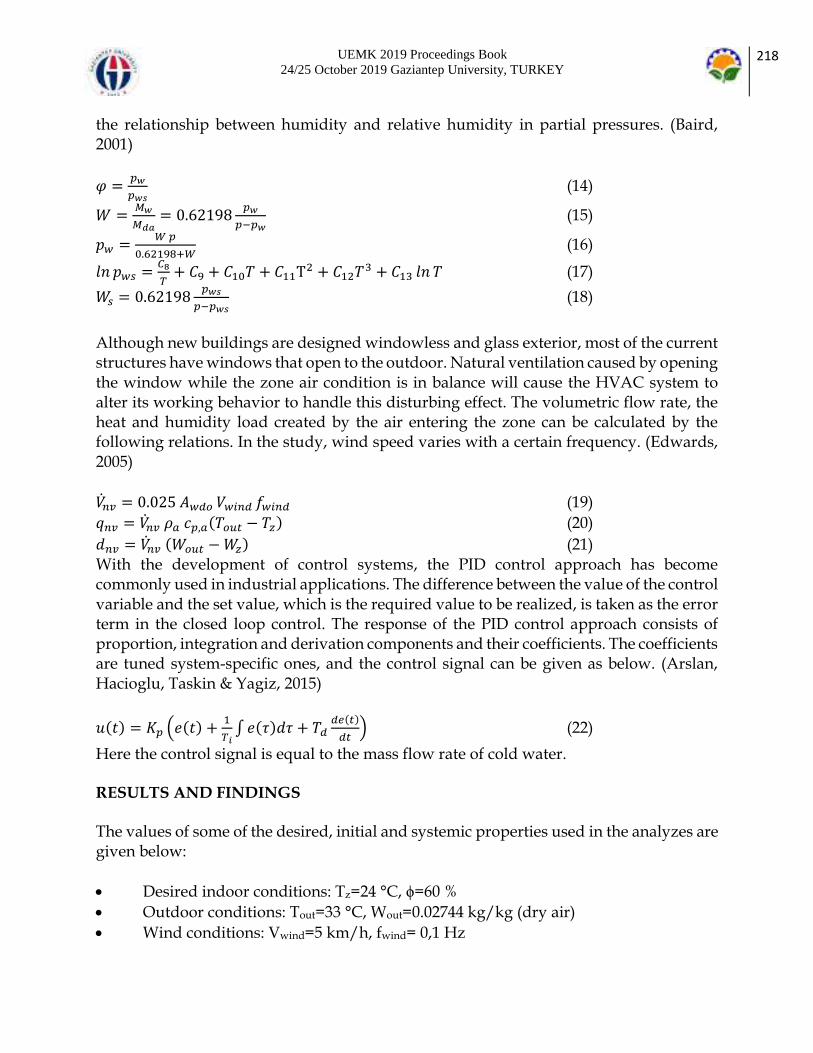
UEMK 2019 Proceedings Book 24/25 October 2019 Gaziantep University, TURKEY
218
the relationship between humidity and relative humidity in partial pressures. (Baird, 2001)
𝜑 =𝑝𝑤
𝑝𝑤𝑠 (14)
𝑊 =𝑀𝑤
𝑀𝑑𝑎= 0.62198
𝑝𝑤
𝑝−𝑝𝑤 (15)
𝑝𝑤 =𝑊 𝑝
0.62198+𝑊 (16)
𝑙𝑛 𝑝𝑤𝑠 =𝐶8
𝑇+ 𝐶9 + 𝐶10𝑇 + 𝐶11T
2 + 𝐶12𝑇3 + 𝐶13 𝑙𝑛 𝑇 (17)
𝑊𝑠 = 0.62198𝑝𝑤𝑠
𝑝−𝑝𝑤𝑠 (18)
Although new buildings are designed windowless and glass exterior, most of the current structures have windows that open to the outdoor. Natural ventilation caused by opening the window while the zone air condition is in balance will cause the HVAC system to alter its working behavior to handle this disturbing effect. The volumetric flow rate, the heat and humidity load created by the air entering the zone can be calculated by the following relations. In the study, wind speed varies with a certain frequency. (Edwards, 2005)
𝑛𝑣 = 0.025 𝐴𝑤𝑑𝑜 𝑉𝑤𝑖𝑛𝑑 𝑓𝑤𝑖𝑛𝑑 (19)
𝑞𝑛𝑣 = 𝑛𝑣 𝜌𝑎 𝑐𝑝,𝑎(𝑇𝑜𝑢𝑡 − 𝑇𝑧) (20)
𝑑𝑛𝑣 = 𝑛𝑣 (𝑊𝑜𝑢𝑡 −𝑊𝑧) (21) With the development of control systems, the PID control approach has become commonly used in industrial applications. The difference between the value of the control variable and the set value, which is the required value to be realized, is taken as the error term in the closed loop control. The response of the PID control approach consists of proportion, integration and derivation components and their coefficients. The coefficients are tuned system-specific ones, and the control signal can be given as below. (Arslan, Hacioglu, Taskin & Yagiz, 2015)
𝑢(𝑡) = 𝐾𝑝 (𝑒(𝑡) +1
𝑇𝑖∫ 𝑒(𝜏)𝑑𝜏 + 𝑇𝑑
𝑑𝑒(𝑡)
𝑑𝑡) (22)
Here the control signal is equal to the mass flow rate of cold water. RESULTS AND FINDINGS The values of some of the desired, initial and systemic properties used in the analyzes are given below:
Desired indoor conditions: Tz=24 °C, ϕ=60 %
Outdoor conditions: Tout=33 °C, Wout=0.02744 kg/kg (dry air)
Wind conditions: Vwind=5 km/h, fwind= 0,1 Hz

UEMK 2019 Proceedings Book 24/25 October 2019 Gaziantep University, TURKEY
219
The disturbance effect (opening of window) starts at 100th minute and lasts 2 minute.
Volume flow rate of the supply air: 𝑎 =0.0634 m3/s
The heat gains in the zone: 2 people each 0.15 kW, 2 lamps and 2 laptops total 1 kW
The initial conditions of zone at t=0 are set to Tz (0)=Tout and Wz (0)=Wout Figure 2 illustrates the volumetric flow rate of air entering the zone due to natural ventilation caused by opening the window at 100th minute and keeping it open for 2 minutes. This flow acts as a disturbance to the system. The temperature of the cold water supplied to the cooling coil is constant in both controlled and uncontrolled system analysis. In the uncontrolled model, the cold water flow rate was determined using the trial and error method to bring the zone temperature to the desired level. When designing the PID controller, PID coefficients were identified in multiple trials based on the designer's expertise. In the first moments of the cooling process, it is seen that the temperature of the zone reaches the desired temperature without a controller later than the system with PID controller (Figure 3). Shortly after reaching a steady state, the system is subjected to a disturbing effect. In these moments, it was later that the uncontrolled system delivered the zone temperature to the desired level compared to the system with the PID controller. The system with the controller acted in a short time by increasing the cold water flow rate. The mass flow rate of cold water passing through the cooling coil in the systems with and without controller is shown in Figure 4. Figure 5 shows the relative humidity of the zone for controlled and uncontrolled systems. Relative humidity is the proportion of humidity in the air to the highest amount of humidity available at that temperature. Therefore, its value is based on temperature and humidity. In summer operating conditions, humidification is not necessary as the humidity of outdoor air is usually high. When the humidity is high, it already condenses as it passes through the cooling coil, thereby reducing relative humidity and providing thermal comfort conditions. Initially, the humidity value in all points of the system is equal to the humidity of the outdoor air. No control algorithm is designed to adjust relative humidity in this study. Relative humidity values are calculated from the zone's humidity content and temperature. Relative humidity calculation begins with the start of the cooling process. The relative humidity is high owing to the high humidity at the beginning, the cooling coil condenses in a short time and approaches its normal values.
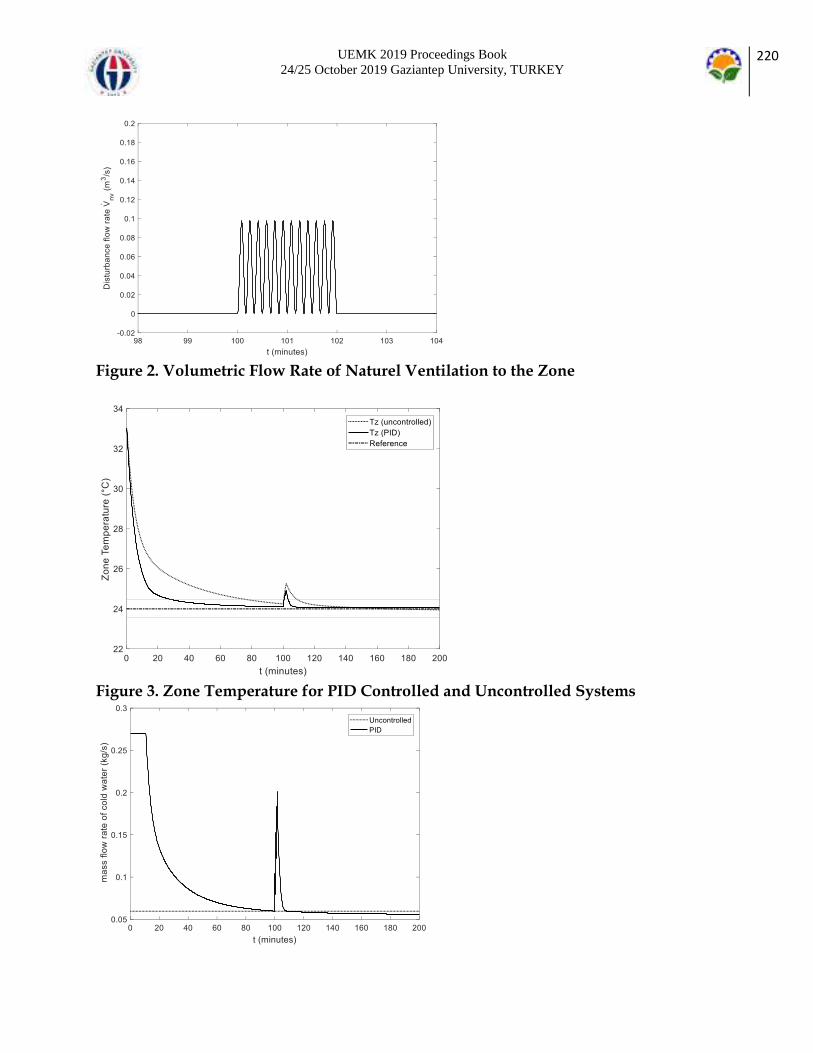
UEMK 2019 Proceedings Book 24/25 October 2019 Gaziantep University, TURKEY
220
Figure 2. Volumetric Flow Rate of Naturel Ventilation to the Zone
Figure 3. Zone Temperature for PID Controlled and Uncontrolled Systems
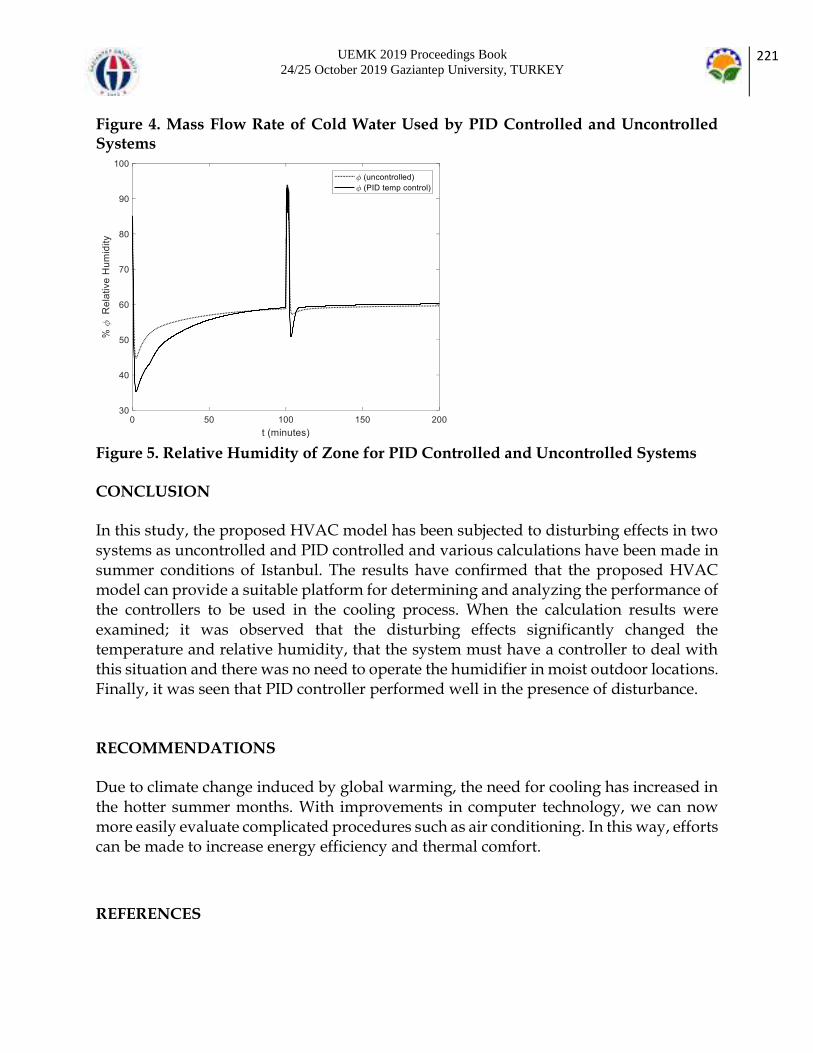
UEMK 2019 Proceedings Book 24/25 October 2019 Gaziantep University, TURKEY
221
Figure 4. Mass Flow Rate of Cold Water Used by PID Controlled and Uncontrolled Systems
Figure 5. Relative Humidity of Zone for PID Controlled and Uncontrolled Systems CONCLUSION In this study, the proposed HVAC model has been subjected to disturbing effects in two systems as uncontrolled and PID controlled and various calculations have been made in summer conditions of Istanbul. The results have confirmed that the proposed HVAC model can provide a suitable platform for determining and analyzing the performance of the controllers to be used in the cooling process. When the calculation results were examined; it was observed that the disturbing effects significantly changed the temperature and relative humidity, that the system must have a controller to deal with this situation and there was no need to operate the humidifier in moist outdoor locations. Finally, it was seen that PID controller performed well in the presence of disturbance. RECOMMENDATIONS Due to climate change induced by global warming, the need for cooling has increased in the hotter summer months. With improvements in computer technology, we can now more easily evaluate complicated procedures such as air conditioning. In this way, efforts can be made to increase energy efficiency and thermal comfort.
REFERENCES

UEMK 2019 Proceedings Book 24/25 October 2019 Gaziantep University, TURKEY
222
Arslan, Y. Z., Hacioglu, Y., Taskin, Y., & Yagiz, N. (2015). Control of a Biomimetic Robot Hand Finger: Classical, Robust, and Intelligent Approaches. In M. Habib (Ed.), Handbook of Research on Advancements in Robotics and Mechatronics (pp. 475-499). Hershey, PA: IGI Global. Baird, J. (Ed.). (2001). ASHRAE 2001 HVAC Fundamentals Handbook. Atlanta, GA: American Society of Heating, Refrigerating, and Air-Conditioning Engineers. Clark, D. R., Hurley, C. W., & Hill, C. R. (1985). Dynamic models for HVAC system components. ASHRAE Trans, 91(1), 737-751. Edwards, R., (2005). Handbook of Domestic Ventilation, Elsevier Butterworth Heinemann. Geng, G., & Geary, G. M. (1993). On performance and tuning of PID controllers in HVAC systems. Proceedings of IEEE International Conference on Control and Applications, 2, 819-824. Jin, G., Cai, W., Wang, Y., & Yao, Y. (2006). A simple dynamic model of cooling coil unit. Energy Conversion and Management, 47(15-16), 2659-2672. Koçal, T., & Muğan, A. (2017). PID Control of Humidity and Temperature Exchange in a Ship. Gemi Ve Deniz Teknolojisi, 22(209), 44-54. Retrieved from http://dergipark.org.tr/gdt/issue/34371/379733 Tashtoush, B., Molhim, M., & Al-Rousan, M. (2005). Dynamic model of an HVAC system for control analysis. Energy, 30(10), 1729-1745. Wang, Y., Cai, W., Soh, Y., Li, S., Lu, L., & Xie, L. (2004). A simplified modeling of cooling coils for control and optimization of HVAC systems. Energy Conversion and Management, 45(18-19), 2915-2930. Wang, Y., Shi, Z., & Cai, W. (2001). PID autotuner and its application in HVAC systems. Proceedings of the 2001 American Control Conference., 3, 2192-2196. Arlington, VA, USA Wemhoff, A. (2012). Calibration of HVAC equipment PID coefficients for energy conservation. Energy and Buildings, 45, 60-66.

UEMK 2019 Proceedings Book 24/25 October 2019 Gaziantep University, TURKEY
223
SUPPRESSION OF BONY STRUCTURES FROM CHEST ROENTGENS USING INDEPENDENT COMPONENT ANALYSIS Emre ÖZER Eskisehir Osmangazi University/Eskisehir Vocational School/Department of Motor Vehicles and Transportation Technologies [email protected] Semih ERGİN Eskisehir Osmangazi University/Faculty of Engineering and Architecture/Department of Electrical and Electronics Engineering [email protected] ABSTRACT: Among cancer types, lung cancer is the most common type of cancer. Chest X-ray images are commonly used to detect the disease. Early detection of lung nodules increases the success of treatment. On chest X-ray images, ribs surrounding the lungs make it difficult to identify nodules. Therefore, the ribs must be suppressed. In this study, we present a technique based on Independent Component Analysis (ICA) for the suppression of ribs. Images used in the study Japanese Society of Radiological Technology (JSRT) database. Key words: rib suppression, chest x-ray, independent component analysis, JSRT dataset INTRODUCTION Among cancer types, lung cancer is the most common cancer in the world and in our country and has the highest mortality rate (Arınç et al., 2005; Stewart & Wild, 2014). Nodules are small tissue masses in the lung that are seen as round, bright spots. Although not all of these masses cause cancer, they are found in cancer patients and are called malignant. Identification of nodules is important for cancer risk. Computed tomography (CT), Magnetic Resonance Imaging (MRI) or X-ray imaging can also be used in lung imaging. X-ray imaging is widely used to be economical. Chest X-ray images include both the lungs and ribs surrounding it. Since we are interested in the lung, it is important to detect and suppress ribs in the image. Difficulties encountered in this process; the nodules are white in color similar to the bones and the parts behind the bones are difficult to detect. There are many rib suppression studies in the literature (Ahmed et al., 2007; Nguyen & Dang, 2015; Suzuki, Abe, MacMahon, & Doi, 2006). Independent component analysis method is applied to various biomedical applications such as EEG and MEG (Hyvärinen & Oja, 2000). A chest X-ray image can be

UEMK 2019 Proceedings Book 24/25 October 2019 Gaziantep University, TURKEY
224
considered as a linear combination of soft tissue and bones. Starting from this point, we applied independent component analysis method to the images we preprocessed in our study and suppressed the bones. There are different types of ICA algorithm (Hyvarinen, 1999). In this study, we used fast fixed point algorithm (Fast ICA). In this research, we apply the method (Nguyen & Dang, 2015) that presents the usage of ICA in ribs suppression. When the ribs are suppress in the image, the soft tissue remains. In this case, it saves time for radiologists and doctors and also simplifies their work. Independent Component Analysis This technique was presented by Aapo Hyvärinen and several different implementations of ICA can be found in the literature (Hyvärinen & Oja, 2000). Independent component analysis attempts to decompose a multivariate signal into independent signals. ICA is sometimes known as blind signal separation. It is not known both the source signals and which way they are mixed. It is an effective method for finding independent and non-Gaussian components. The basic linear mixing model can be expressed mathematically as follows; x=As (1) Where x is the observation vector, s is the source vector; A is the mixing matrix. The goal is to estimate unknown A and s values using the observation vector x. The source and the number of independent components are considered equal, so that the matrix A is found as a square matrix. After estimating the matrix A, computing its inverse, W, and obtaining the independent component by: s = W x (2) METHODS ICA requires multiple observation vectors as input. In our case we have only one original image. So we need to create the second image artificially. One of the images is taken from the database and the normalization process is applied and the second image is the histogram equalization image. The method used can be summarized as in Figure 1. All operations and codes are implemented in the MATLAB environment.
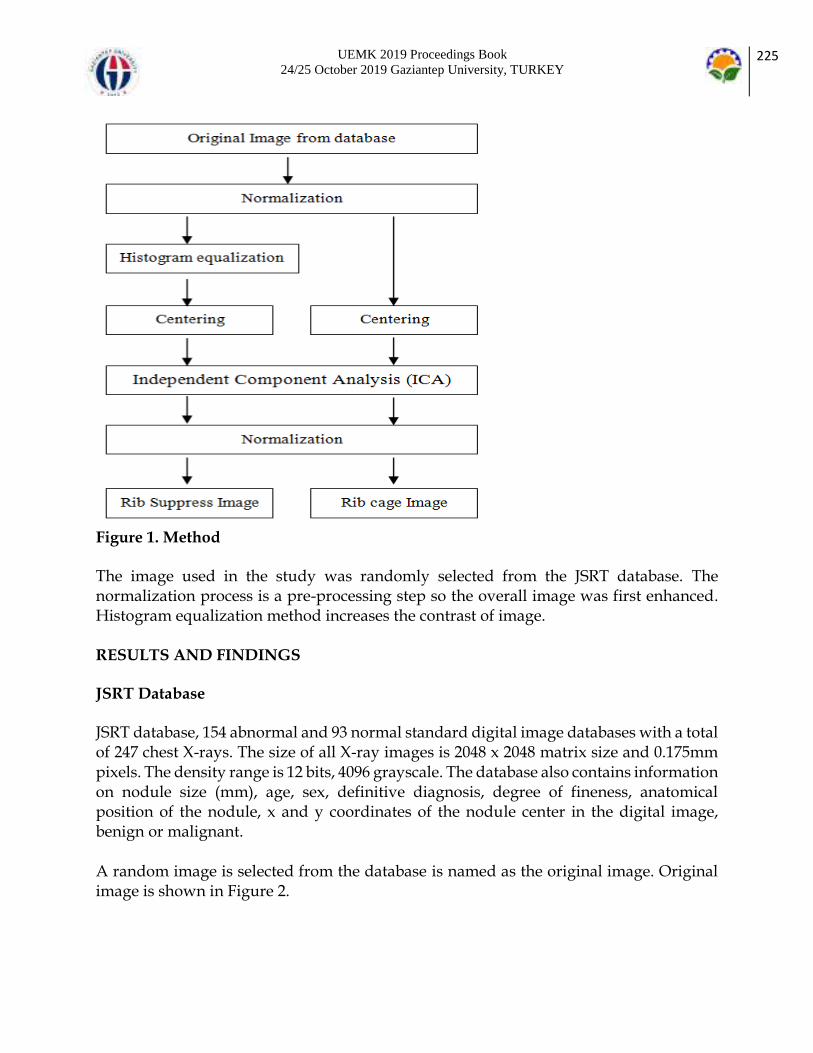
UEMK 2019 Proceedings Book 24/25 October 2019 Gaziantep University, TURKEY
225
Figure 1. Method The image used in the study was randomly selected from the JSRT database. The normalization process is a pre-processing step so the overall image was first enhanced. Histogram equalization method increases the contrast of image. RESULTS AND FINDINGS JSRT Database JSRT database, 154 abnormal and 93 normal standard digital image databases with a total of 247 chest X-rays. The size of all X-ray images is 2048 x 2048 matrix size and 0.175mm pixels. The density range is 12 bits, 4096 grayscale. The database also contains information on nodule size (mm), age, sex, definitive diagnosis, degree of fineness, anatomical position of the nodule, x and y coordinates of the nodule center in the digital image, benign or malignant. A random image is selected from the database is named as the original image. Original image is shown in Figure 2.

UEMK 2019 Proceedings Book 24/25 October 2019 Gaziantep University, TURKEY
226
Normalization method was applied to improve overall image contrast and to strengthen the edges. This is local normalization, which makes the image a zero average and a unit variable. Figure 3. shows the image after normalization.

UEMK 2019 Proceedings Book 24/25 October 2019 Gaziantep University, TURKEY
227
Images from two channels were one by one centralized. The next step is independent component analysis. Each image was transformed into a vector when applying ICA.

UEMK 2019 Proceedings Book 24/25 October 2019 Gaziantep University, TURKEY
228
After ICA, normalization was performed to the images. The image of the ribs is shown in Figure 5. and the image of rib suppress is shown in Figure 6.As shown in Figure 6. the ribs are successfully suppressed.
CONCLUSION ICA is the available method for rib suppression. In the method we used, there was no reduction in the image size, so there was no loss of information in the image. We can apply Fast ICA so that the data was initially made zero mean and whitened. Histogram equalization ensures at least one non-gauss source, one of the main ideas of the ICA method, and also convergence of ICA. Normalization applied after Independent Component Analysis makes the suppression more clear. In the future, it is aimed to detect the disease due to nodule detection using suppressed images of the bones. REFERENCES

UEMK 2019 Proceedings Book 24/25 October 2019 Gaziantep University, TURKEY
229
Ahmed, B., Rasheed, T., Khan, M. A., Cho, S. J., Lee, S., & Kim, T.-S. (2007). Rib suppression for enhancing frontal chest radiographs using independent component analysis. Paper presented at the International Conference on Adaptive and Natural Computing Algorithms. Arınç, S., Özvaran, M. K., Güngör, N., Çelik, O., Soğukpınar, Ö., Çolak, F., & Baran, R. (2005). Hastanemizde tanı alan akciğer kanserli olguların epidemiyolojik ve histolojik özellikleri. Turkiye Klinikleri Archives of Lung, 6(4), 149-152. Hyvarinen, A. (1999). Survey on independent component analysis. Neural computing surveys, 2(4), 94-128. Hyvärinen, A., & Oja, E. (2000). Independent component analysis: algorithms and applications. Neural networks, 13(4-5), 411-430. Nguyen, H. X., & Dang, T. T. (2015). Ribs suppression in chest x-ray images by using ICA method. Paper presented at the 5th International Conference on Biomedical Engineering in Vietnam. Stewart, B., & Wild, C. P. (2014). World cancer report 2014. Suzuki, K., Abe, H., MacMahon, H., & Doi, K. (2006). Image-processing technique for suppressing ribs in chest radiographs by means of massive training artificial neural network (MTANN). IEEE Transactions on medical imaging, 25(4), 406-416.

UEMK 2019 Proceedings Book 24/25 October 2019 Gaziantep University, TURKEY
230
DIELECTRIC CHARACTERIZATION OF ORGANIC LIQUIDS UNDER CONFINEMENT: A STUDY OF ACETONITRILE Adil Nadir KAPLANSEREN Pamukkale University [email protected] Can TUNCER Pamukkale University [email protected] Mehmet ORHAN Pamukkale University [email protected] Tahir CAGIN Texas A&M University [email protected] ABSTRACT: Use of organic liquids, such as Acetonitrile, in electrolyte solutions of supercapacitors are common due to low viscosities. In such applications, nanostructured surfaces enable high surface area to volume ratio in favor of capacitance as well. Therefore, effect of confinement on dielectric properties of acetonitrile is investigated numerically. For this purpose, Single Walled Carbon Nanotubes (SWCNTs) were filled with the acetonitrile by employing the isothermal-isobaric ensemble followed by canonical ensemble molecular dynamics simulations for investigating interactions between the acetonitrile and SWCNTs. Several interesting features of the acetonitrile were identified as the diameter of CNTs becomes smaller. First of all, two distinct regions were identified i.e., a core region along the longitudinal direction dominated by rarefaction effects and an interface region with relatively high density of fluid. Secondly, a preferred coordination between each pair of the C (methyl group carbon), C (nitrile group carbon) and N atoms and an ordering in the vicinity of wall are observed contrary to those of larger tubes. Last but not least, enhancement in the volume of the rarefied core in cooperation with anti-parallel dipole alignment encouraged by interface effects leads to decrease in dielectric constant considerably. Key words: Acetonitrile, SWCNT, Molecular Dynamics, Dielectric relaxation INTRODUCTION
UEMK 2019 Proceedings Book 24/25 October 2019 Gaziantep University, TURKEY
231
Despite both theoretical and experimental studies about dielectric phenomenon of neat Acetonitrile and its mixtures are available for a long time, the microscopic point of view about its behavior under confinement is not well understood if one considers its usage in electrolyte solutions in favor of lower viscosity. Uniform translational diffusion, relatively high dielectric permittivity and conductivity of the acetonitrile are other advantages for capacitors applications [1, 2, 3]. The use of less viscous organic solvents with ionic liquids promotes penetration in nano pores, which greatly enhances the operating voltage, the energy density and higher rate scalability of the capacitor [4, 5, 6, 7, 8]. Lithium perchlorate in acetonitrile enabling obstruction free nano pores [9], hybrid capacitors operating high temperatures with high cycle performance [10, 11] and nano porous carbons in an electrolyte containing acetonitrile showing good performance under extreme conditions [12] are some applications pointing out importance of acetonitrile in such a fast developing technology of supercapacitors. Although there are wide range of interests for Acetonitrile, studies investigating its dielectric behavior in molecular scale is rather limited. Recently, in reference [13], short time behavior of Acetonitrile is determined by libration of molecules and, with a larger time, the molecular motion is influenced by rotational diffusion. Investigating the capability and accuracy of some proposed models compared with the experiments [14, 15, 16, 17], structure organization of ACN and ionic liquid mixtures in nanoscale [18], dielectric relaxation of mixtures including ACN [19, 20, 21] are some studies appeared in last two decades. Although we could not address all studies concerning with the role of ACN in electrolyte mixtures and its interaction with nano-structured electrodes, use ACN in reducing the viscosity of electrolytes seems to be significant. To the author’s knowledge, there is no study addressing dielectric relaxation phenomena in confinement. These are the reasons why this study aims to investigate dielectric properties and structural organization ACN in SWCNTs. The second part of our study is organized as follows. After briefly mentioning computational methodology in the next section, dielectric properties are given each separate section followed by a conclusion. MODELING AND COMPUTATIONAL METHODOLOGY Acetonitrile was represented by a six-site model which is composed of three methyl hydrogen atoms (H), a methyl carbon atom (C1), a nitrile carbon atom (C2), and a nitrogen atom (N). Forces acting on each atom were determined by considering intra and intermolecular potentials. Intramolecular force constants and geometry parameters of the ACN were adopted from DREIDING/A force field with some revisions [22]. Pairwise interaction was taken account for the computation of intermolecular potentials. Both intra and intermolecular force field parameters are given in Table 1. Intramolecular forces acting each atom of carbon nanotube was calculated using the many-body Tersoff Potential [23]. All simulations were carried on the large scale atomic/molecular massively parallel simulator LAMMPS [24]. Simulations were
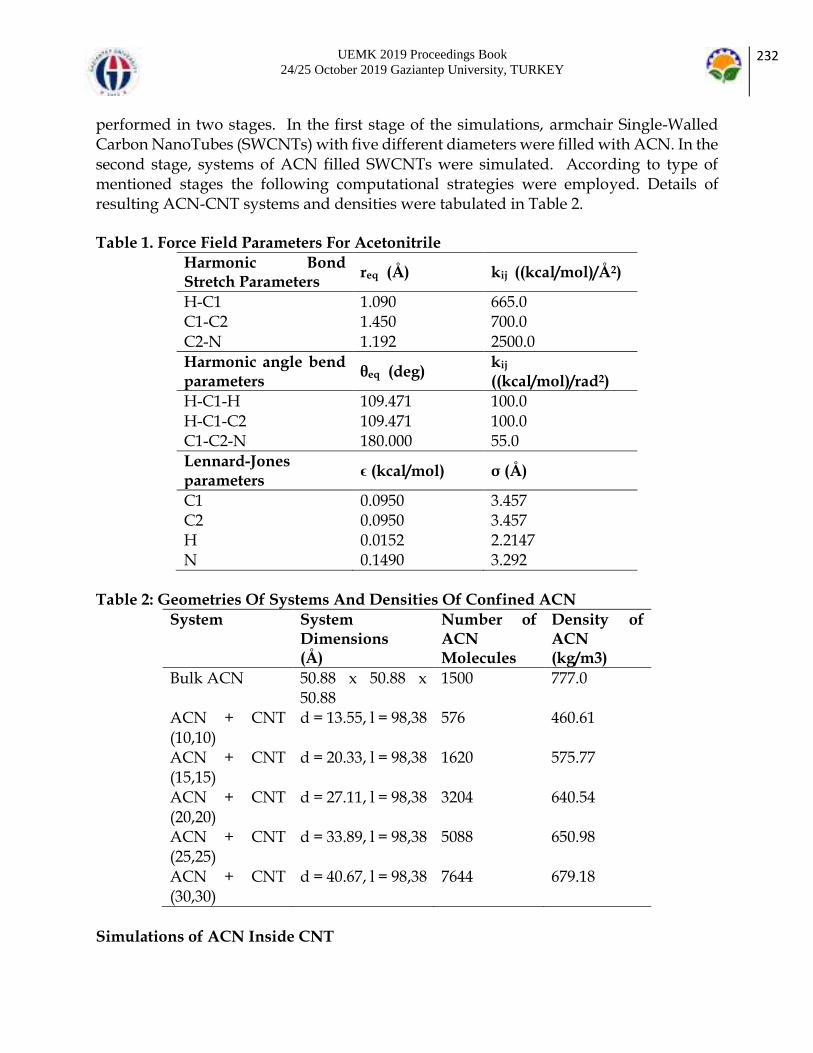
UEMK 2019 Proceedings Book 24/25 October 2019 Gaziantep University, TURKEY
232
performed in two stages. In the first stage of the simulations, armchair Single-Walled Carbon NanoTubes (SWCNTs) with five different diameters were filled with ACN. In the second stage, systems of ACN filled SWCNTs were simulated. According to type of mentioned stages the following computational strategies were employed. Details of resulting ACN-CNT systems and densities were tabulated in Table 2. Table 1. Force Field Parameters For Acetonitrile
Harmonic Bond Stretch Parameters
req (Å) kij ((kcal/mol)/Å2)
H-C1 1.090 665.0 C1-C2 1.450 700.0 C2-N 1.192 2500.0 Harmonic angle bend parameters
θeq (deg) kij ((kcal/mol)/rad2)
H-C1-H 109.471 100.0 H-C1-C2 109.471 100.0 C1-C2-N 180.000 55.0 Lennard-Jones parameters
ϵ (kcal/mol) σ (Å)
C1 0.0950 3.457 C2 0.0950 3.457 H 0.0152 2.2147 N 0.1490 3.292
Table 2: Geometries Of Systems And Densities Of Confined ACN
System System Dimensions (Å)
Number of ACN Molecules
Density of ACN (kg/m3)
Bulk ACN 50.88 x 50.88 x 50.88
1500 777.0
ACN + CNT (10,10)
d = 13.55, l = 98,38 576 460.61
ACN + CNT (15,15)
d = 20.33, l = 98,38 1620 575.77
ACN + CNT (20,20)
d = 27.11, l = 98,38 3204 640.54
ACN + CNT (25,25)
d = 33.89, l = 98,38 5088 650.98
ACN + CNT (30,30)
d = 40.67, l = 98,38 7644 679.18
Simulations of ACN Inside CNT
UEMK 2019 Proceedings Book 24/25 October 2019 Gaziantep University, TURKEY
233
CNTs were located on a rectangular parallelepiped box where periodic boundary conditions were imposed in each direction. The longitudinal length of the box was set to 98.38 Å so that interactions of ACN molecules with surround are taken place just on each open ends of CNTs. Simulation procedure for ACNCNT couple is the same as that of filling process with some exceptions. Systems were well equilibrated over 300 ps after the temperature was set to 298 K within 60 ps, and then data were collected in every 5 fs and over 110 ps and 300 ps velocities and positions of ACN molecules respectively. Molecular strain rate 100 tensors were recorded in every 0.5 fs over 1.5 ns while center of mass velocity of CNT was removed in every 150 fs. In the proceeding sections, structure, dynamic and transport properties of ACN will be exhibited systematically. RESULTS AND FINDINGS Dielectric Relaxation In this section, the authors will discuss dielectric phenomenon of the ACN under confinement. For this purpose, the system is assumed to be an isotropic, polarizable, homogeneous and continuous media. Furthermore, an external and frequency dependent electric field, E (ω), is acting on it. Now, electric displacement vector can be written as the sum of externally acting electric field and polarization field - i.e. D (ω) = ϵ0 E (ω) + P (ω) (1) where ϵ0 stands for dielectric constant of vacuum. If the dielectric properties of the system are assumed to be linear and isotropic, the polarization, P, is proportional to the electric field, E, and given by P (ω) = ϵ0 χ (ω) E (ω) (2) where χ (ω) denotes the frequency dependent dielectric susceptibility. Substituting Eqn 2 into Eqn 1 leads to D (ω) = ϵ0 (1+ χ (ω)) E (ω) = ϵ0 ϵ E (ω) = ϵα (ω) E (ω) (3)
ϵ (ω) = 𝜖𝛼 (𝜔)
𝜖0 (4)
where ϵα (ω) and ϵ (ω) are called complex absolute permittivity and complex relative permittivity of the system respectively. The complex relative permittivity is written simply ϵ (ω) = 1 + χ (ω) (5) whose real and imaginary parts, ϵ (ω) = ϵ′(ω) - i ϵ″ (ω), correspond to the relative permittivity and the dielectric loss of the system respectively.

UEMK 2019 Proceedings Book 24/25 October 2019 Gaziantep University, TURKEY
234
Dense system approach In the first case, when one considers the system as a general case that a system is dense and each dipole moment is correlated with each other, then the system is assumed to exhibit a collective dynamics in which there is a dipole-dipole interaction among the molecules. With application of linear response theory for equilibrium, the electric susceptibility in 3D is given by
𝜒 (𝜔) = 1
3𝑘𝐵𝑇
⟨𝑴(0) · 𝑴(0)⟩
𝑉𝜖0ℒ𝑖𝜔− (6)
where the operator ℒ𝑖𝜔 stands for Fourier-Laplace transform, i.e.
ℒ𝑖𝜔− = ∫ 𝑒−𝑖𝜔𝑡 (− 𝑑𝛷(𝑡)
𝑑𝑡) 𝑑𝑡
∞
0 (7)
and M(t) is vectorial sum of dipole moments of constituent molecules at time t. kB and T stand for Boltzmann constant and thermodynamic temperature respectively. V is the volume enclosed by CNTs. In this case, the correlation function is treated as
𝛷(𝑡) =〈𝑴(0) · 𝑴(𝑡)〉
〈𝑴(0) · 𝑴(0)〉 (8)
In Eq. 8, the system is assumed to be a dense system where all interactions among the molecules have been taken account. Thus, Eq. 6 leads to a solution, complex permittivity, that interaction of the dipole moment of each molecule is correlated with other molecules. Dilute system approach In the second case, cross terms between the dipole moments on different molecules are vanished and the system is assumed to be a dilute system in which the dynamics of each dipole moment is independent from the others. In such case, the correlation function is expressed in terms of orientation of the dipole moment of each molecule such that
𝛷(𝑡) =⟨∑ 𝒖𝑖(0)⋅ 𝒖𝑖(𝑡)𝑁𝑚𝑖=1 ⟩
⟨∑ 𝒖𝑖(0)⋅ 𝒖𝑖(0)𝑁𝑚𝑖=1
⟩ (9)
followed by the electric susceptibility
𝜒 (𝜔) = 1
3𝑘𝐵𝑇
⟨∑ 𝒖𝑖(0)⋅ 𝒖𝑖(0)𝑁𝑚𝑖=1
⟩
𝑉𝜖0ℒ𝑖𝜔− (10)
Where Nm and u are the number of the molecules in the system and the dipole moment of each molecule respectively.
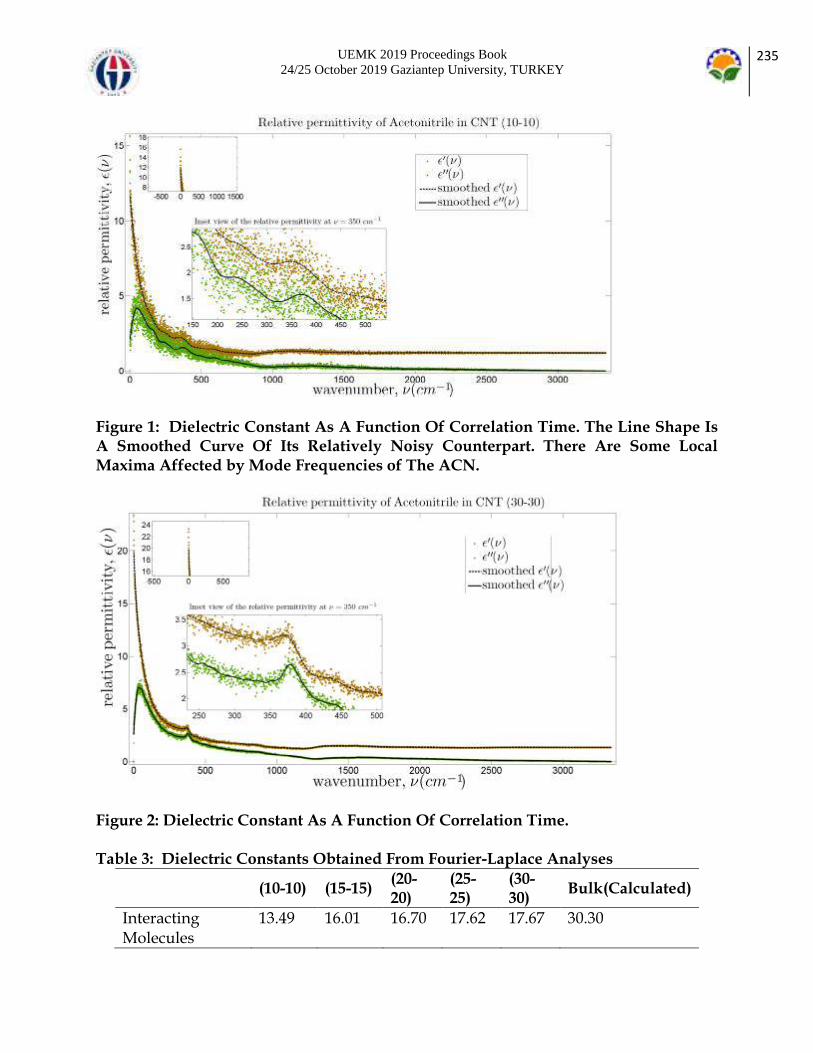
UEMK 2019 Proceedings Book 24/25 October 2019 Gaziantep University, TURKEY
235
Figure 1: Dielectric Constant As A Function Of Correlation Time. The Line Shape Is A Smoothed Curve Of Its Relatively Noisy Counterpart. There Are Some Local Maxima Affected by Mode Frequencies of The ACN.
Figure 2: Dielectric Constant As A Function Of Correlation Time. Table 3: Dielectric Constants Obtained From Fourier-Laplace Analyses
(10-10) (15-15) (20-20)
(25-25)
(30-30)
Bulk(Calculated)
Interacting Molecules
13.49 16.01 16.70 17.62 17.67 30.30

UEMK 2019 Proceedings Book 24/25 October 2019 Gaziantep University, TURKEY
236
Non-interacting Molecules
16.23 19.81 21.79 22.01 22.92 38.00
The dielectric permeability and loss for the non-interacting approximation of the ACN molecules inside the smallest and largest tubes are shown in Fig. 1 and 2 respectively. In both cases, the permeability diminishes monotonically while the dielectric loss of each case becomes maximum in a certain frequency. The permeability decreases sharply in a fairly small frequency increment where the maximum loss occurs. A strong sensitivity of the dielectric constant on the C1-C2-N bending (e-symmetry) was observed in both tubes. Other modes that affect the relaxation phenomenon were C1-H bending (e-symmetry) and C1-C2 stretching (a1-symmetry) modes. Our results show that, a remarkable decrease in static dielectric constant of ACN, ϵ(0), is observed as compared with the bulk state. The dielectric constant computed for the CNT (10-10) is 29.18 % smaller than that of the largest tube. Size dependent variation of dielectric constant under the assumptions of interacting and non-interacting molecules is summarized in Table 3.
Figure 3: A Comparison Of The Dielectric Relaxations Resulting From Approximations Of Interacting And Non-interacting Molecules Inside CNT (30-30). In order to make clear why such increase in dielectric constant was observed with increasing diameters of tubes, Kirkwood correlation factor, g factor, was introduced;
𝑔 = ∑ 〈𝑐𝑜𝑠 𝑖𝑗 〉𝑁𝑚𝑖=1 (8)
Where θij denotes the angle between the orientations of the ith and the jth dipole. The calculated correlation factor for increasing radii in each CNT is shown in Fig. 4. At first glance, it can be observed that there is no correlation between the ith molecule and the others within the first half of the radius of the CNT (10-10). This is due to strong rarefaction effects observed in the core of this CNT.

UEMK 2019 Proceedings Book 24/25 October 2019 Gaziantep University, TURKEY
237
Figure 4: Radial Variation Of Kirkwood Correlation Factor Calculated From The Eq. 5. Note That The Radius Of Each CNT Is Set To Unity. Coloured Lines Denote The Radius Of Rarefaction That Observed In The Core Region Of The Tubes. This region wherein rarefaction effects are observed becomes smaller with increasing sizes of CNTs. Beyond this critical radius, correlations starts to develop and can be represented as continuous functions. The molecules tend to direct themselves in opposite direction in the vicinity of the wall. In other words, there is an antiparallel orientation just on the region of fluid-wall interface of each CNT, which is rather limited for the CNT (15-15). It is very clear that the coupled dynamics of both rarefaction and the confinement effect decreases the dielectric constant enormously. Although the confinement in a smaller CNT encourages self-organized and directed dipoles in the direction free to move, in the axial direction for cylindrical structures, a dominant rarefaction effect tries to align rather limited number of molecules opposite to those of surface region. We believe that the main reason for sharp drops in dielectric constant is increasing fractional volume of rarefaction with smaller sizes of the CNTs.

UEMK 2019 Proceedings Book 24/25 October 2019 Gaziantep University, TURKEY
238
Figure 5: Dielectric Constant Obtained From The Fluctuation Formula. Table 4: Inertial and Relaxation Times For The Liquid Acetonitrile. Biexponential Function Was Utilized For The Fitting The Correlation Functions.
A τm (s) B τn (s)
Debye relaxation time (s)
〈τ 〉= 𝑨𝝉𝒎
𝟐 +𝑩𝝉𝒏𝟐
𝑨𝝉𝒎+𝑩𝝉𝒏
CNT(10-10),(R2 = 0.9698)
0.8750 5.078 x 10⁻¹³
0.1250 2.030 x 10⁻¹¹
1.735 x 10⁻¹¹
CNT(15-15),(R2 = 0.9597)
0.9577 3.181 x 10⁻¹³
0.0423 2.072 x 10⁻¹¹
1.545 x 10⁻¹¹
CNT(20-20),(R2 = 0.9893)
0.9603 3.481 x 10⁻¹³
0.0397 2.589 x 10⁻¹¹
1.962 x 10⁻¹¹
CNT(25-25),(R2 = 0.9937)
0.9790 3.829 x 10⁻¹³
0.0210 3.463 x 10⁻¹¹
2.298 x 10⁻¹¹
CNT(30-30),(R2 = 0.9924)
0.9775 3.283 x 10⁻¹³
0.0225 2.480 x 10⁻¹¹
1.586 x 10⁻¹¹
Bulk (calculated) 0.7100 1.077 x 10⁻¹³
0.2900 2.110 x 10⁻¹²
1.900 x 10⁻¹²
Furthermore, calculated Debye relaxation times for each system are approximately an order of magnitude greater than the bulk value (see Table 4 for calculated results). From Table 4, it can be realized that the computed dipole time correlation function data noticeably deviate from the bulk Debye relaxation behavior. Although the faster component of dielectric relaxation τm is smaller than τn, the coefficient of the faster component, the coefficient a, seems to manage relaxation phenomena. The calculated time evolution of the dipole correlation function showed that the diffusive and slower response is missed in the initial phase of the time evolution. Although the mean

UEMK 2019 Proceedings Book 24/25 October 2019 Gaziantep University, TURKEY
239
relaxation time is two order of magnitude more than the inertial component, τm, the dynamics of the system is dominated by the rotational diffusion of molecules and inertial effects which are taken place in a short time. In addition to the relaxation time, molecular reorientation dynamics in acetonitrile was analyzed through the time correlation function 𝐶𝑙(𝑡) = ⟨ 𝑃𝑙 (ū(0) ⋅ ū(𝑡)) ⟩ (6) where Pl represents lth Legendre polynomial and ū(t) = u(t) / u(t) is the unit vector of the dipole moment. The correlation functions associated with the Legendre polynomials are
C1 (t) =〈 cos θ (t)〉 (7)
𝐶2 = 1
2⋅ ⟨3 ⋅ 𝑐𝑜𝑠2 (𝑡) − 1⟩ (8)
where cos θ(t) = ū(t) · ū(0). The fitting coefficients and corresponding times were tabulated in Table 5 and 6. Table 5: l=1.
A τm (s) B τn (s)
Debye relaxation time (s)
〈τ 〉= 𝑨𝝉𝒎
𝟐 +𝑩𝝉𝒏𝟐
𝑨𝝉𝒎+𝑩𝝉𝒏
CNT (10-10) (R2 =0.9821)
0.6608 8.216 ×10⁻¹²
0.3392 4.220×10⁻¹¹ 3.285 × 10⁻¹¹
CNT (15-15) (R2 =0.9940)
0.7316 7.490 ×10⁻¹²
0.2684 2.910×10⁻¹¹ 2.019 × 10⁻¹¹
CNT (20-20) (R2 =0.9858)
0.8604 6.675 ×10⁻¹²
0.1396 4.093×10⁻¹¹ 2.375 × 10⁻¹¹
CNT (25-25) (R2 =0.9994)
0.8922 4.701 ×10⁻¹²
0.1078 2.080×10⁻¹¹ 1.030 × 10⁻¹¹
CNT (30-30) (R2 =0.9819)
0.9062 3.642 ×10⁻¹²
0.0938 3.337×10⁻¹¹ 1.811 × 10⁻¹¹
Bulk (experimental)
- - - - -
Table 6: l=2
A τm (s) B τn (s)
Debye relaxation time (s)
〈τ 〉= 𝑨𝝉𝒎
𝟐 +𝑩𝝉𝒏𝟐
𝑨𝝉𝒎+𝑩𝝉𝒏
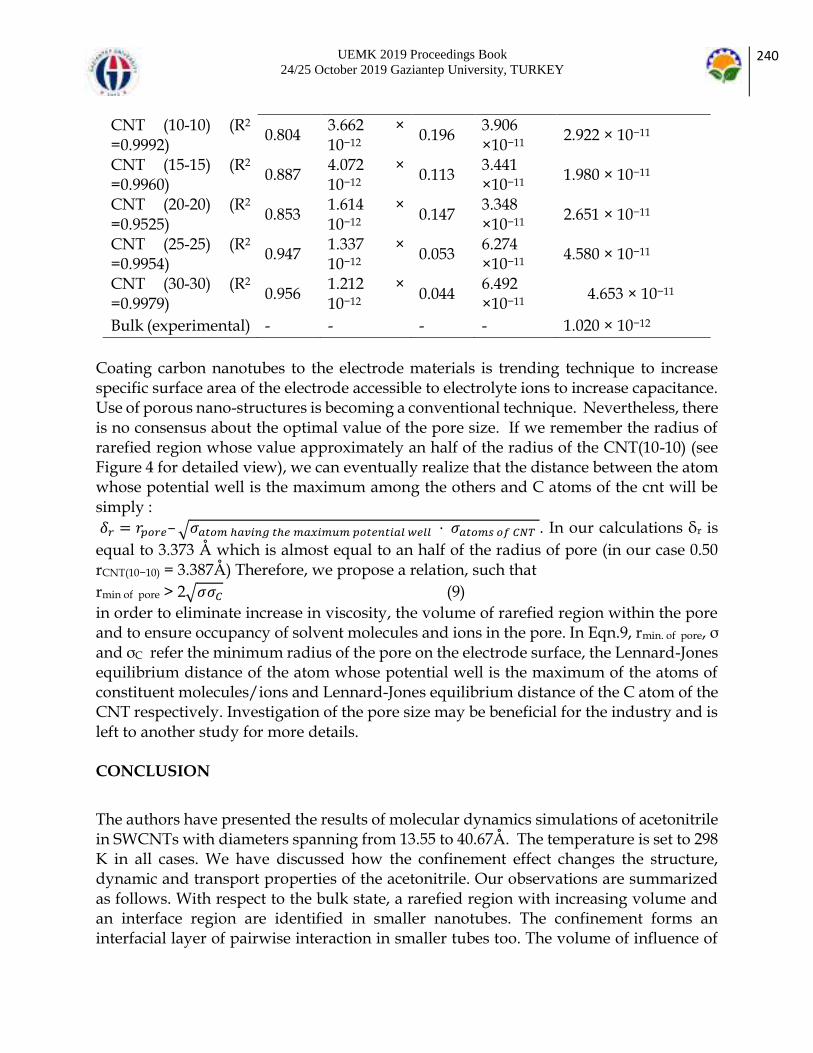
UEMK 2019 Proceedings Book 24/25 October 2019 Gaziantep University, TURKEY
240
CNT (10-10) (R2 =0.9992)
0.804 3.662 × 10⁻¹²
0.196 3.906 ×10⁻¹¹
2.922 × 10⁻¹¹
CNT (15-15) (R2 =0.9960)
0.887 4.072 × 10⁻¹²
0.113 3.441 ×10⁻¹¹
1.980 × 10⁻¹¹
CNT (20-20) (R2 =0.9525)
0.853 1.614 × 10⁻¹²
0.147 3.348 ×10⁻¹¹
2.651 × 10⁻¹¹
CNT (25-25) (R2
=0.9954) 0.947
1.337 × 10⁻¹²
0.053 6.274 ×10⁻¹¹
4.580 × 10⁻¹¹
CNT (30-30) (R2 =0.9979)
0.956 1.212 × 10⁻¹²
0.044 6.492 ×10⁻¹¹
4.653 × 10⁻¹¹
Bulk (experimental) - - - - 1.020 × 10⁻¹²
Coating carbon nanotubes to the electrode materials is trending technique to increase specific surface area of the electrode accessible to electrolyte ions to increase capacitance. Use of porous nano-structures is becoming a conventional technique. Nevertheless, there is no consensus about the optimal value of the pore size. If we remember the radius of rarefied region whose value approximately an half of the radius of the CNT(10-10) (see Figure 4 for detailed view), we can eventually realize that the distance between the atom whose potential well is the maximum among the others and C atoms of the cnt will be simply :
𝛿𝑟 = 𝑟𝑝𝑜𝑟𝑒–√𝜎𝑎𝑡𝑜𝑚 ℎ𝑎𝑣𝑖𝑛𝑔 𝑡ℎ𝑒 𝑚𝑎𝑥𝑖𝑚𝑢𝑚 𝑝𝑜𝑡𝑒𝑛𝑡𝑖𝑎𝑙 𝑤𝑒𝑙𝑙 ⋅ 𝜎𝑎𝑡𝑜𝑚𝑠 𝑜𝑓 𝐶𝑁𝑇 . In our calculations δr is
equal to 3.373 Å which is almost equal to an half of the radius of pore (in our case 0.50 rCNT(10−10) = 3.387Å) Therefore, we propose a relation, such that
rmin of pore > 2√𝜎𝜎𝐶 (9)
in order to eliminate increase in viscosity, the volume of rarefied region within the pore and to ensure occupancy of solvent molecules and ions in the pore. In Eqn.9, rmin. of pore, σ and σC refer the minimum radius of the pore on the electrode surface, the Lennard-Jones equilibrium distance of the atom whose potential well is the maximum of the atoms of constituent molecules/ions and Lennard-Jones equilibrium distance of the C atom of the CNT respectively. Investigation of the pore size may be beneficial for the industry and is left to another study for more details. CONCLUSION
The authors have presented the results of molecular dynamics simulations of acetonitrile in SWCNTs with diameters spanning from 13.55 to 40.67Å. The temperature is set to 298 K in all cases. We have discussed how the confinement effect changes the structure, dynamic and transport properties of the acetonitrile. Our observations are summarized as follows. With respect to the bulk state, a rarefied region with increasing volume and an interface region are identified in smaller nanotubes. The confinement forms an interfacial layer of pairwise interaction in smaller tubes too. The volume of influence of
UEMK 2019 Proceedings Book 24/25 October 2019 Gaziantep University, TURKEY
241
these two distinctive regions according to density of the fluid plays a vital role in the structure, transport and electrical properties of the acetonitrile. The last but the not least, dielectric properties of the ACN seems to be very sensitive both rarefaction and confinement effects. The magnitude of the dielectric constant is a function of the size of the dilute volume; i.e., increasing size which drops down the dielectric constant cooperating with the confinement effect. An antiparallel arrangement of dipoles seems to be the other reason for lower values of dielectric constant. We have used two different methods in the simulation of dielectric relaxation. In the first one, the system is treated as a system composed of interacting molecules. In the other, the system is treated as individual molecules which do not affect each other. The results of both approximations are totally different. Our simulations for the bulk state show that the assumption of non-interacting particles gives better result which constitutes well with the experimental data. Moreover, we observed that the relaxation time of the acetonitrile increases considerably compared with experiments. The relaxation process is mainly based on rotational diffusion. REFERENCES [1] Abdallah, T., Lemordant, D., & Claude-Montigny, B. (2012). Are room temperature ionic liquids able to improve the safety of supercapacitors organic electrolytes without degrading the performances? Journal of Power Sources,201, 353-359. doi:10.1016/j.jpowsour.2011.10.115 [2] Kalugin, O. N., Chaban, V. V., Loskutov, V. V., & Prezhdo, O. V. (2008). Uniform Diffusion of Acetonitrile inside Carbon Nanotubes Favors Supercapacitor Performance. Nano Letters,8(8), 2126-2130. doi:10.1021/nl072976g [3] Palm, R., Kurig, H., Tõnurist, K., Jänes, A., & Lust, E. (2013). Influence of Different Organic Solvent Additives on 1-ethyl-3-methylimidazolium Tetrafluoroborate Electrolyte Based Electrical Double Layer Capacitors. Journal of The Electrochemical Society,160(10). doi:10.1149/2.046310jes [4] Frackowiak, E. (2006). Supercapacitors based on carbon materials and ionic liquids. Journal of the Brazilian Chemical Society,17(6), 1074-1082. doi:10.1590/s0103-50532006000600003 [5] Frackowiak, E., Lota, G., & Pernak, J. (2005). Room-temperature phosphonium ionic liquids for supercapacitor application. Applied Physics Letters,86(16), 164104. doi:10.1063/1.1906320 [6] Pilathottathil, S., Thasneema, K. K., Thayyil, M. S., Pillai, M. P., & Niveditha, C. V. (2017). A high voltage supercapacitor based on ionic liquid with an activated carbon electrode. Materials Research Express,4(7), 075503. doi:10.1088/2053-1591/aa7116 [7] Tsai, W., Taberna, P., & Simon, P. (2014). Electrochemical Quartz Crystal Microbalance (EQCM) Study of Ion Dynamics in Nanoporous Carbons. Journal of the American Chemical Society,136(24), 8722-8728. doi:10.1021/ja503449w
UEMK 2019 Proceedings Book 24/25 October 2019 Gaziantep University, TURKEY
242
[8] Kötz, R., Hahn, M., Ruch, P., & Gallay, R. (2008). Comparison of pressure evolution in supercapacitor devices using different aprotic solvents. Electrochemistry Communications, 10(3), 359-362. doi:10.1016/j.elecom.2007.12.016 [9] Fleischmann, S., Jäckel, N., Zeiger, M., Krüner, B., Grobelsek, I., Formanek, P., Presser, V. (2016). Enhanced Electrochemical Energy Storage by Nanoscopic Decoration of Endohedral and Exohedral Carbon with Vanadium Oxide via Atomic Layer Deposition. Chemistry of Materials,28(8), 2802-2813. doi:10.1021/acs.chemmater.6b00738 [10] Lee, B., & Yoon, J. R. (2015). Influence of Mixed Solvent on the Electrochemical Property of Hybrid Capacitor. Journal of Nanoscience and Nanotechnology,15(11), 8849-8853. doi:10.1166/jnn.2015.11542 [11] Mo, D., Zhou, W., Ma, X., & Xu, J. (2015). Facile electrochemical polymerization of 2-(thiophen-2-yl)furan and the enhanced capacitance properties of its polymer in acetonitrile electrolyte containing boron trifluoride diethyl etherate. Electrochimica Acta,155, 29-37. doi:10.1016/j.electacta.2014.12.110 [12] Chen, X. Y., He, Y. Y., Song, H., & Zhang, Z. J. (2014). A multi-template carbonization approach to hierarchically nanoporous carbon for high-performance supercapacitors. Journal of Solid State Electrochemistry,19(1), 179-186. doi:10.1007/s10008-014-2593-x [13] Stoppa, A., Nazet, A., Buchner, R., Thoman, A., & Walther, M. (2015). Dielectric response and collective dynamics of acetonitrile. Journal of Molecular Liquids,212, 963-968. doi:10.1016/j.molliq.2015.03.045 [14] Mountain, R. D. (1997). Shear viscosity and dielectric constant of liquid acetonitrile. The Journal of Chemical Physics,107(10), 3921-3923. doi:10.1063/1.474767 [15] Guàrdia, E., Pinzón, R., Casulleras, J., Orozco, M., & Luque, F. J. (2001). Comparison of Different Three-site Interaction Potentials for Liquid Acetonitrile. Molecular Simulation,26(4), 287-306. doi:10.1080/08927020108024509 [16] Orhan, M. (2014). Dielectric and Transport Properties of Acetonitrile at Varying Temperatures: A Molecular Dynamics Study. Bulletin of the Korean Chemical Society,35(5), 1469-1478. doi:10.5012/bkcs.2014.35.5.1469 [17] Nikitin, A. M., & Lyubartsev, A. P. (2007). New six-site acetonitrile model for simulations of liquid acetonitrile and its aqueous mixtures. Journal of Computational Chemistry, 28(12), 2020-2026. doi:10.1002/jcc.20721 [18] Bardak, F., Xiao, D., Hines, L. G., Son, P., Bartsch, R. A., Quitevis, E. L., Voth, G. A. (2012). Cover Picture: Nanostructural Organization in Acetonitrile/Ionic Liquid Mixtures: Molecular Dynamics Simulations and Optical Kerr Effect Spectroscopy (ChemPhysChem 7/2012). ChemPhysChem,13(7), 1601-1601. doi:10.1002/cphc.201290029 [19] Shere, I., Pawar, V., & Mehrotra, S. (2007). Temperature dependent dielectric relaxation study of acetonitrile with chlorobenzene at microwave frequency using time domain reflectometry. Journal of Molecular Liquids,133(1-3), 116-119. doi:10.1016/j.molliq.2006.07.002

UEMK 2019 Proceedings Book 24/25 October 2019 Gaziantep University, TURKEY
243
[20] Bernardi, E., & Stassen, H. (2004). Molecular dynamics simulations of acetonitrile/dimethyl sulfoxide liquid mixtures. The Journal of Chemical Physics,120(10), 4860-4867. doi:10.1063/1.1644540 [21] Jellema, R., Bulthuis, J., & Zwan, G. V. (1997). Dielectric relaxation of acetonitrile-water mixtures. Journal of Molecular Liquids,73-74, 179-193. doi:10.1016/s0167-7322(97)00066-4 [22] Mayo, S. L., Olafson, B. D., & Goddard, W. A. (1990). DREIDING: A generic force field for molecular simulations. The Journal of Physical Chemistry,94(26), 8897-8909. doi:10.1021/j100389a010 [23]-Tersoff, J. (1990). Erratum: Modeling solid-state chemistry: Interatomic potentials for multicomponent systems. Physical Review B,41(5), 3248-3248. doi:10.1103/physrevb.41.3248.2 [24] Plimpton, S. (1995). Fast Parallel Algorithms for Short-Range Molecular Dynamics. Journal of Computational Physics,117(1), 1-19. doi:10.1006/jcph.1995.1039

UEMK 2019 Proceedings Book 24/25 October 2019 Gaziantep University, TURKEY
244
EFFECT OF CURING CONDITIONS ON THE MECHANICAL PROPERTIES OF CONVENTIONAL CONCRETE WITH HYBRID FIBER Kazim TURK Department of Civil Engineering, Inonu University [email protected] Mahmut BASSURUCU Department of Construction Technology, Darende Vocational High School, Malatya Turgut Ozal University [email protected] ABSTRACT: In this study, the effects of curing conditions on the mechanical properties of hybrid fiber reinforced concrete were investigated experimentally. Three type conventional concrete mixtures with no fiber, fiber and hybrid fiber having approximately same slump value were designed. Later, specimens produced from these concrete mixtures were exposed to different curing regimes namely standard 23±2 °C, sealed and air curing conditions. After 7 and 28 curing days, the mechanical tests were performed to determine compressive, splitting tensile, flexural strength and ultrasonic pulse velocity. Finally, the specimens cured in water had the best mechanical properties and energy absorption capacity while those of specimens cured in air were the worst. Moreover, the specimens cured in sealed condition had similar mechanical properties compared to the specimens cured in water. Key words: Macro Steel Fiber, Micro Steel Fiber, Curing Conditions, Compressive Strength, Flexure Strength INTRODUCTION Concrete is the most widely used as building material today due to its desired shape, economical and easy to find. Conventional concrete is produced by mixing aggregate, cement and water. The compressive strength of the concrete was increased considerably as results of many studies carried out by researchers and it became a material that benefited from this feature. As concrete strength increases, axial deformation capacities increase. After the peak, the stress drop is sudden and a brittle fracture is observed because of its high compressive strength. For this purpose, fiber reinforcement is used in concrete to eliminate these problems that occur in concrete, and thus, increase in the tensile strength and ductility of the concrete is provided.

UEMK 2019 Proceedings Book 24/25 October 2019 Gaziantep University, TURKEY
245
The first studies on fiber reinforced concrete were carried out in 1950 to understand the mechanical properties of fiber reinforced concrete (Hannant, 1987). Fiber reinforced concrete is defined as concrete containing randomly directed fibers (Bentur, 1989). In today’s construction industry, fiber-reinforced concrete is used in many applications such as industrial slabs, bridges, aircraft runways and precast elements. Fiber-reinforced concrete, which consists of a mixture of multiple discontinuous fiber types and conventional concrete matrix, is defined hybrid fiber-reinforced concrete (Ding et al. 2010). The view of hybrid fiber in concrete mixture was first proposed by Rossi et al. (1987). The combination of micro fibers that controls the initiation and spread of micro-cracks and macro fibers that control macro-cracks in hybrid fiber-reinforced concrete provide important advantages in terms of mechanical properties [Mobasher and Cheng, 1996]. Appropriate curing plays an important role in success optimum performance/full potential from a given concrete mixture (BCA, 1993). The study carried out by Bentz et al. shows that curing conditions have important effect on the rate of hydration of cement. In the study conducted by Yazicioglu et al., the engineering properties of self-compacting concrete (SCC) under different curing conditions were investigated experimentally. Portland cement concrete and two types of SCC i.e., SCC with fly ash and SCC with silica fume, concrete specimens are prepared and cured in three different curing conditions, namely water, sealed and air cured for the different periods of 3, 7, 14 and 28 days. The conclusions indicated that water cured specimens always give the highest values followed by those cured as sealed and in air irrespective of type and age of concrete. The essential aim of this study is to search the influence of different curing conditions on the engineering properties of hybrid and single containing fiber concrete in comparison with normal concrete by using determined test methods. MATERIALS AND METHODS Materials and mixture proportions For this study, CEM I 42.5 Type I Portland cement was used for all mixtures and the chemical composition and physical properties of Portland cement was showed in Table 1. Two different groups of aggregates were used. In the first one, the aggregate sizes were in the range of 0-5 mm and its specific gravity and water absorption values were 2.53 and 1.90%, respectively. The aggregate sizes of the second were 5 to 15 mm. The specific gravity of that group was 2.62 and water absorption was 0.50%. The grading of the total aggregate was showed in Table 2 and as can be seen the maximum aggregate size was 16 mm. The specific gravity of plasticizer based polymer used in all concrete mixtures was 1.09. Moreover, to improve the tensile strength of mixtures, macro and micro steel fibers were added to concrete mixtures as single and hybrid. The geometry of macro (Dramix 65/60) and micro (OL 13/.16) steel fibers showed in Figure 1. The properties of their geometry and mechanical were shown in Table 3. Three concrete types were selected,
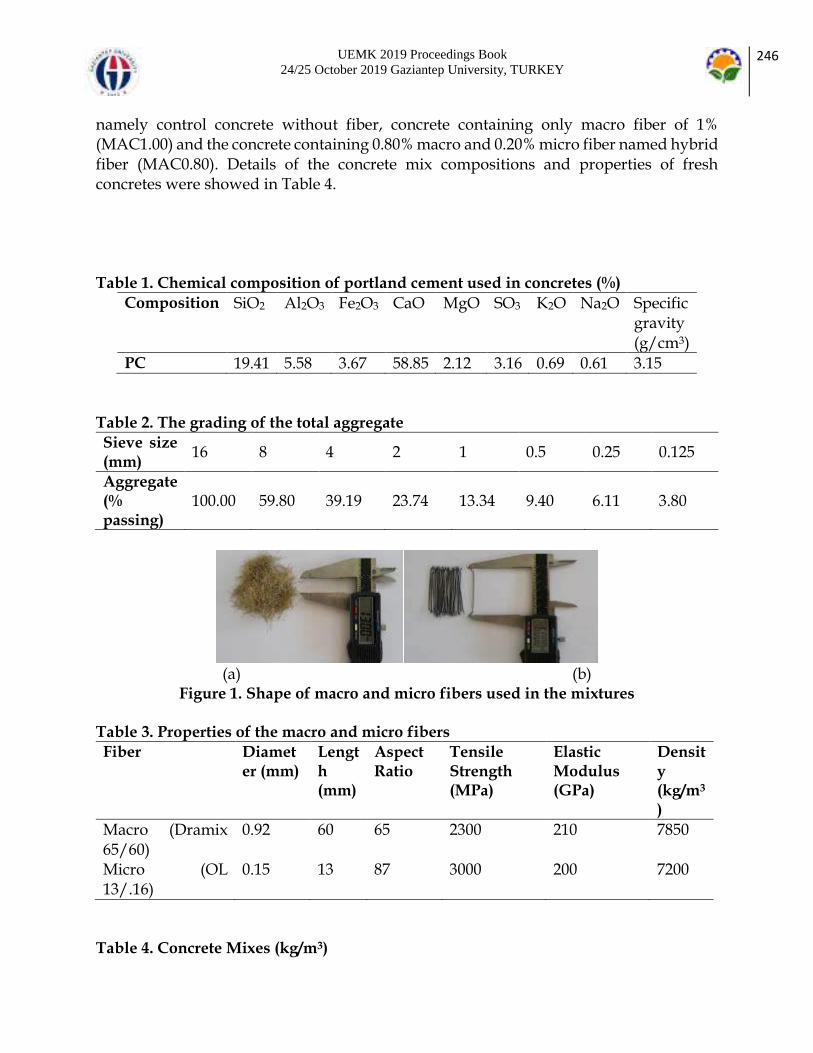
UEMK 2019 Proceedings Book 24/25 October 2019 Gaziantep University, TURKEY
246
namely control concrete without fiber, concrete containing only macro fiber of 1% (MAC1.00) and the concrete containing 0.80% macro and 0.20% micro fiber named hybrid fiber (MAC0.80). Details of the concrete mix compositions and properties of fresh concretes were showed in Table 4. Table 1. Chemical composition of portland cement used in concretes (%)
Composition SiO2 Al2O3 Fe2O3 CaO MgO SO3 K2O Na2O Specific gravity (g/cm3)
PC 19.41 5.58 3.67 58.85 2.12 3.16 0.69 0.61 3.15
Table 2. The grading of the total aggregate
Sieve size (mm)
16 8 4 2 1 0.5 0.25 0.125
Aggregate (% passing)
100.00 59.80 39.19 23.74 13.34 9.40 6.11 3.80
(a) (b)
Figure 1. Shape of macro and micro fibers used in the mixtures Table 3. Properties of the macro and micro fibers
Fiber Diameter (mm)
Length (mm)
Aspect Ratio
Tensile Strength (MPa)
Elastic Modulus (GPa)
Density (kg/m3
)
Macro (Dramix 65/60)
0.92 60 65 2300 210 7850
Micro (OL 13/.16)
0.15 13 87 3000 200 7200
Table 4. Concrete Mixes (kg/m3)

UEMK 2019 Proceedings Book 24/25 October 2019 Gaziantep University, TURKEY
247
Mixture Name
Cement Water Steel Fiber Aggregate Normal Slump
(mm) Macro Micro 0-5 mm
5-15 mm
Plasticizer
CONTROL 350 200 0 0 1025 684 8 12
MAC1.00 350 200 78.5 0 1004 670 12 12
MAC0.80 350 200 62.8 14.4 1001 668 12 9
Specimen preparation and curing of specimens All concrete specimens were cast on a vibrating table to ensure optimum compaction. The compressive strength and ultrasonic pulse velocity of the concrete mixtures were evaluated by using three cube specimens with the dimensions of 100x100x100 mm according to ASTM C39 and ASTM C597-16, respectively. To specify splitting tensile strength as per ASTM C496, cylinder specimens with the dimensions of Ø100x200 mm were used. The flexural tensile strength of the concrete mixtures were evaluated by applying four point bending test by using 80x100x300 mm prismatic specimens according to ASTM C1609. In the following day of casting, the concrete specimens were de-moulded and located in three different curing conditions, namely standard 23±2 °C water, sealed and air cured for the periods of 7 and 28 days. At the end of each curing period, a total of three specimens from all concrete mixture were tested for each mechanical property. All tests during this study were performed at 7 and 28 days for all curing conditions. The performance of MAC1.00 and MAC0.80, have been examined with respect to relevant properties of control concrete. RESULTS AND DISCUSSIONS Compressive Strength The results obtained from compressive strength tests for control concrete, MAC1.00 and MAC0.80 for all concrete ages and curing conditions were showed in Figure 2-4, respectively. It can be seen from these figures that at 7 and 28 curing days, the compressive strength of the MAC1.00 mixture containing macro steel fiber showed little reduction for all curing regimes compared to the control concrete specimens. Moreover, in the mixture of, the inclusion of micro steel fibers to MAC0.80 mixture had a positive effect on compressive strength. It was also displayed that the highest compressive strength values were derived from standard water curing followed by the sealed and air
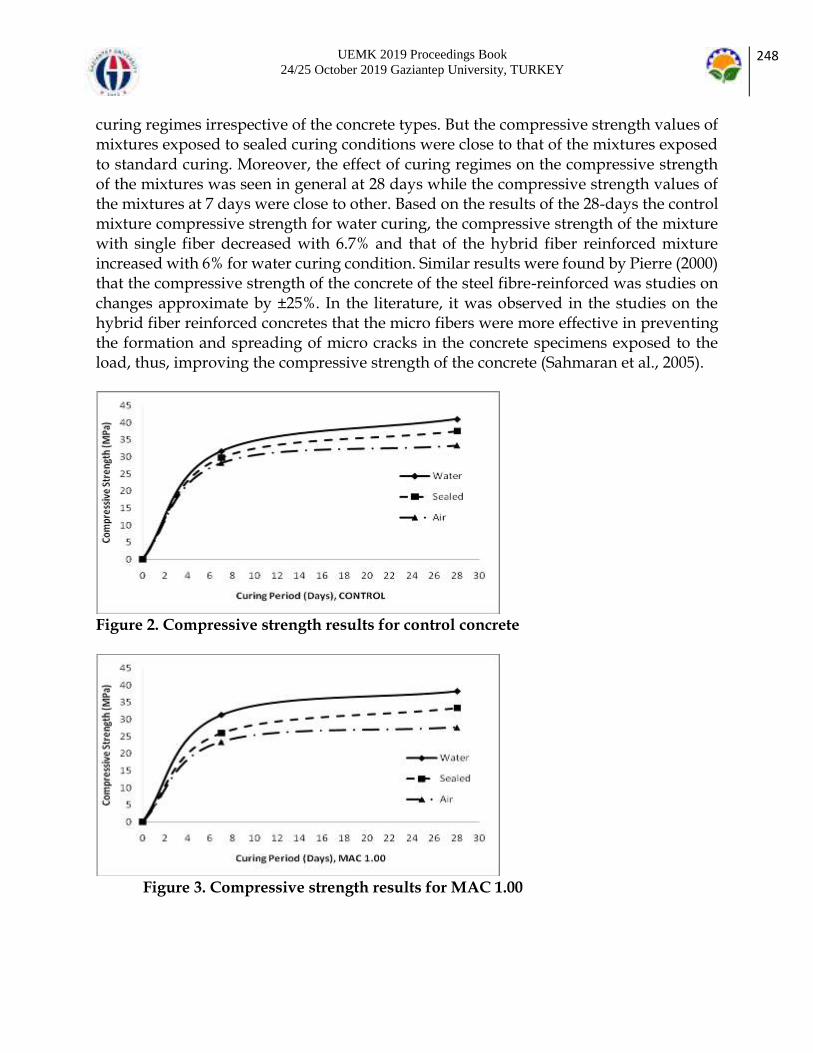
UEMK 2019 Proceedings Book 24/25 October 2019 Gaziantep University, TURKEY
248
curing regimes irrespective of the concrete types. But the compressive strength values of mixtures exposed to sealed curing conditions were close to that of the mixtures exposed to standard curing. Moreover, the effect of curing regimes on the compressive strength of the mixtures was seen in general at 28 days while the compressive strength values of the mixtures at 7 days were close to other. Based on the results of the 28-days the control mixture compressive strength for water curing, the compressive strength of the mixture with single fiber decreased with 6.7% and that of the hybrid fiber reinforced mixture increased with 6% for water curing condition. Similar results were found by Pierre (2000) that the compressive strength of the concrete of the steel fibre-reinforced was studies on changes approximate by ±25%. In the literature, it was observed in the studies on the hybrid fiber reinforced concretes that the micro fibers were more effective in preventing the formation and spreading of micro cracks in the concrete specimens exposed to the load, thus, improving the compressive strength of the concrete (Sahmaran et al., 2005).
Figure 2. Compressive strength results for control concrete
Figure 3. Compressive strength results for MAC 1.00
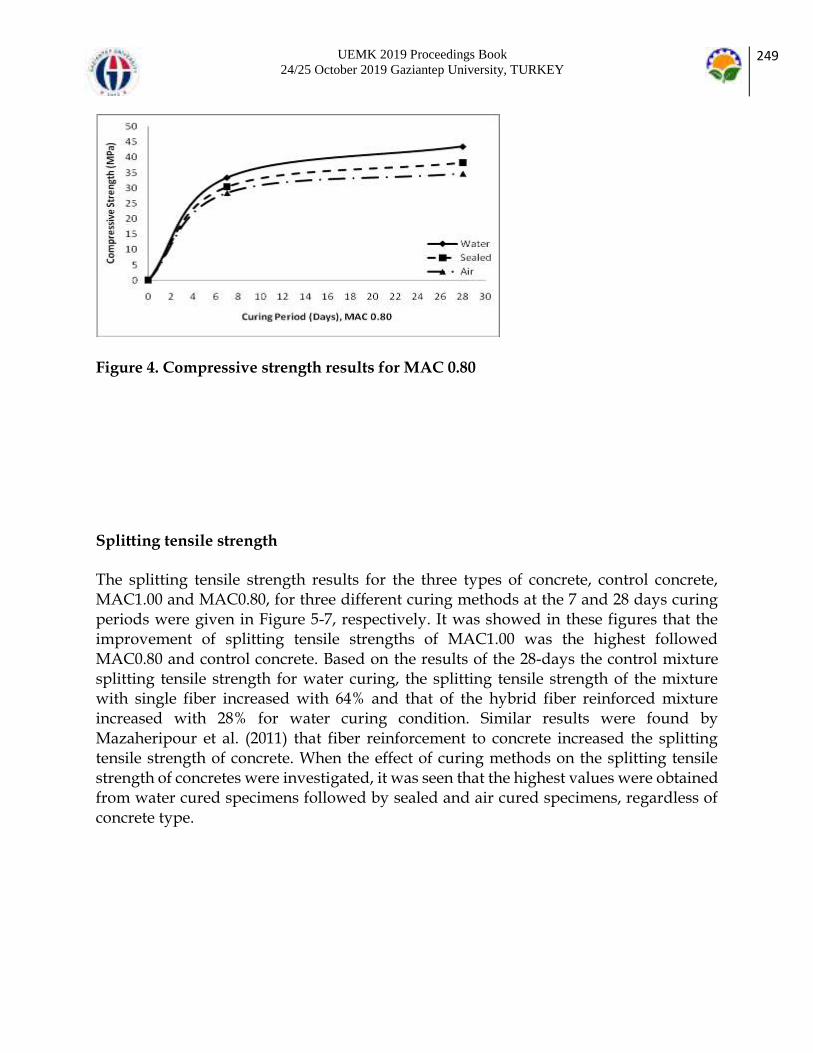
UEMK 2019 Proceedings Book 24/25 October 2019 Gaziantep University, TURKEY
249
Figure 4. Compressive strength results for MAC 0.80 Splitting tensile strength The splitting tensile strength results for the three types of concrete, control concrete, MAC1.00 and MAC0.80, for three different curing methods at the 7 and 28 days curing periods were given in Figure 5-7, respectively. It was showed in these figures that the improvement of splitting tensile strengths of MAC1.00 was the highest followed MAC0.80 and control concrete. Based on the results of the 28-days the control mixture splitting tensile strength for water curing, the splitting tensile strength of the mixture with single fiber increased with 64% and that of the hybrid fiber reinforced mixture increased with 28% for water curing condition. Similar results were found by Mazaheripour et al. (2011) that fiber reinforcement to concrete increased the splitting tensile strength of concrete. When the effect of curing methods on the splitting tensile strength of concretes were investigated, it was seen that the highest values were obtained from water cured specimens followed by sealed and air cured specimens, regardless of concrete type.
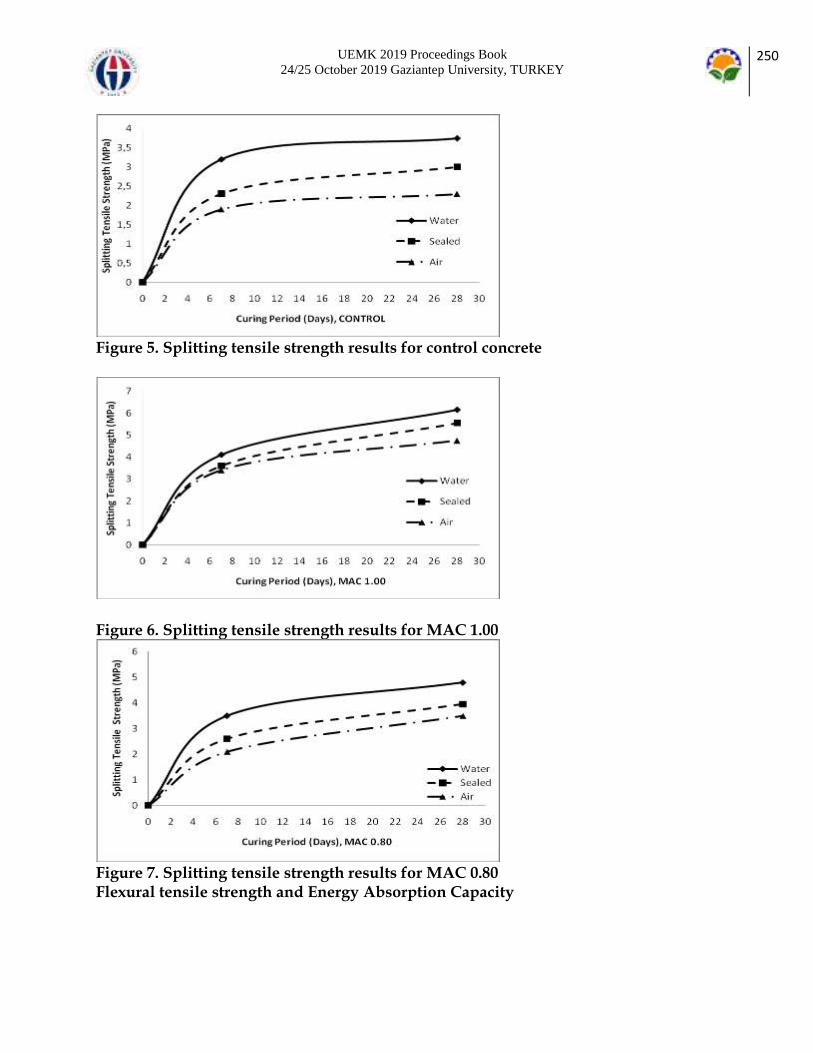
UEMK 2019 Proceedings Book 24/25 October 2019 Gaziantep University, TURKEY
250
Figure 5. Splitting tensile strength results for control concrete
Figure 6. Splitting tensile strength results for MAC 1.00
Figure 7. Splitting tensile strength results for MAC 0.80 Flexural tensile strength and Energy Absorption Capacity
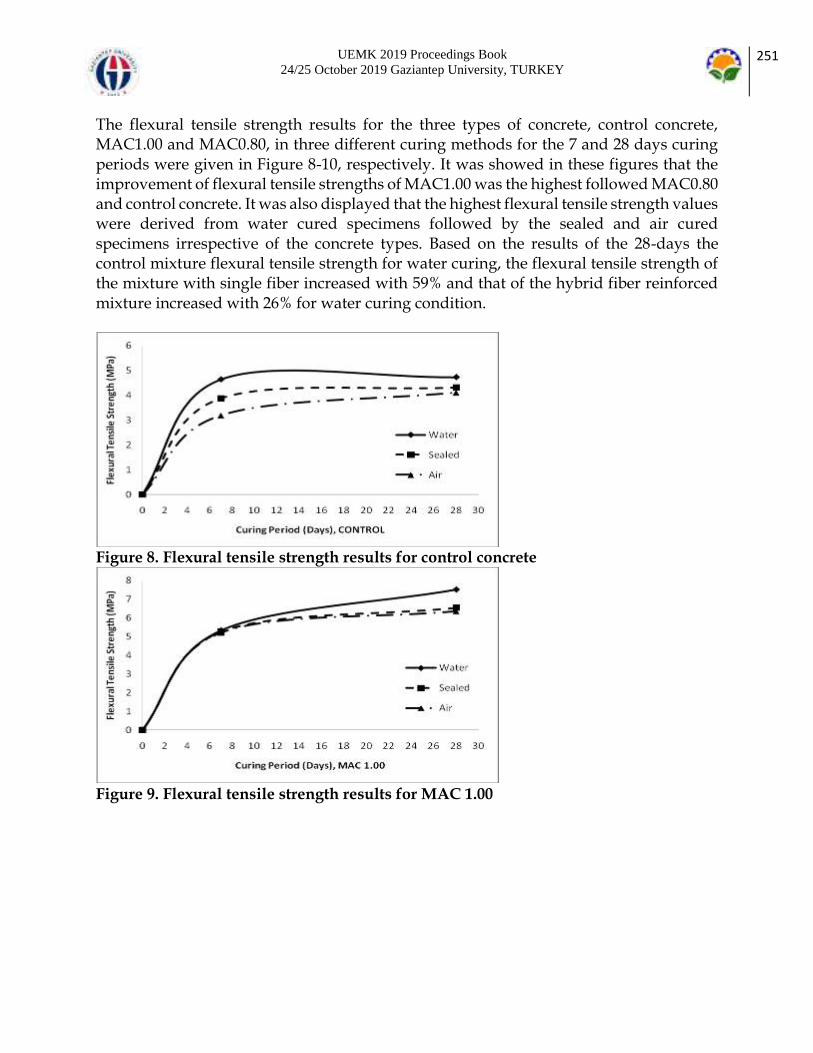
UEMK 2019 Proceedings Book 24/25 October 2019 Gaziantep University, TURKEY
251
The flexural tensile strength results for the three types of concrete, control concrete, MAC1.00 and MAC0.80, in three different curing methods for the 7 and 28 days curing periods were given in Figure 8-10, respectively. It was showed in these figures that the improvement of flexural tensile strengths of MAC1.00 was the highest followed MAC0.80 and control concrete. It was also displayed that the highest flexural tensile strength values were derived from water cured specimens followed by the sealed and air cured specimens irrespective of the concrete types. Based on the results of the 28-days the control mixture flexural tensile strength for water curing, the flexural tensile strength of the mixture with single fiber increased with 59% and that of the hybrid fiber reinforced mixture increased with 26% for water curing condition.
Figure 8. Flexural tensile strength results for control concrete
Figure 9. Flexural tensile strength results for MAC 1.00

UEMK 2019 Proceedings Book 24/25 October 2019 Gaziantep University, TURKEY
252
Figure 10. Flexural tensile strength results for MAC 0.80 The energy absorption capacity results for three types of control concrete, MAC1.00 and MAC0.80, for three different curing methods at the 7 and 28 days curing periods were showed in Figure 11-13, respectively. It was seen in these figures that the values of energy absorption capacity of MAC1.00 were the highest followed MAC0.80 and control concrete. For water curing, compared to the results of the 28-days the control mixture energy absorption capacity with 1163 N.mm, the concrete with the single fiber extremely increased with 20238 N.mm and that of the energy absorption capacity with the hybrid fiber increased with 16066 N.mm. The reason for this was that the fibers generate a mechanism with higher energy absorption capacity by preventing crack initiation and growth with effective bridging (Bentur and mindess, 1990).
Figure 11. Energy absorption capacity results for control concrete
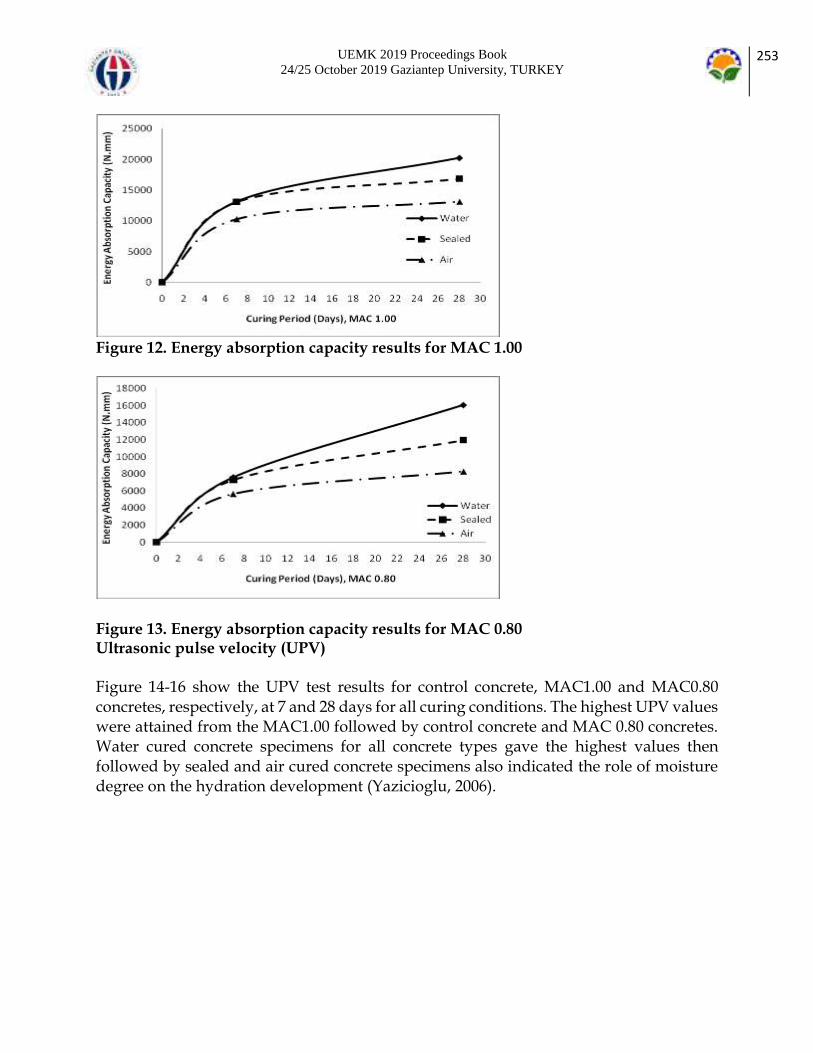
UEMK 2019 Proceedings Book 24/25 October 2019 Gaziantep University, TURKEY
253
Figure 12. Energy absorption capacity results for MAC 1.00
Figure 13. Energy absorption capacity results for MAC 0.80 Ultrasonic pulse velocity (UPV) Figure 14-16 show the UPV test results for control concrete, MAC1.00 and MAC0.80 concretes, respectively, at 7 and 28 days for all curing conditions. The highest UPV values were attained from the MAC1.00 followed by control concrete and MAC 0.80 concretes. Water cured concrete specimens for all concrete types gave the highest values then followed by sealed and air cured concrete specimens also indicated the role of moisture degree on the hydration development (Yazicioglu, 2006).
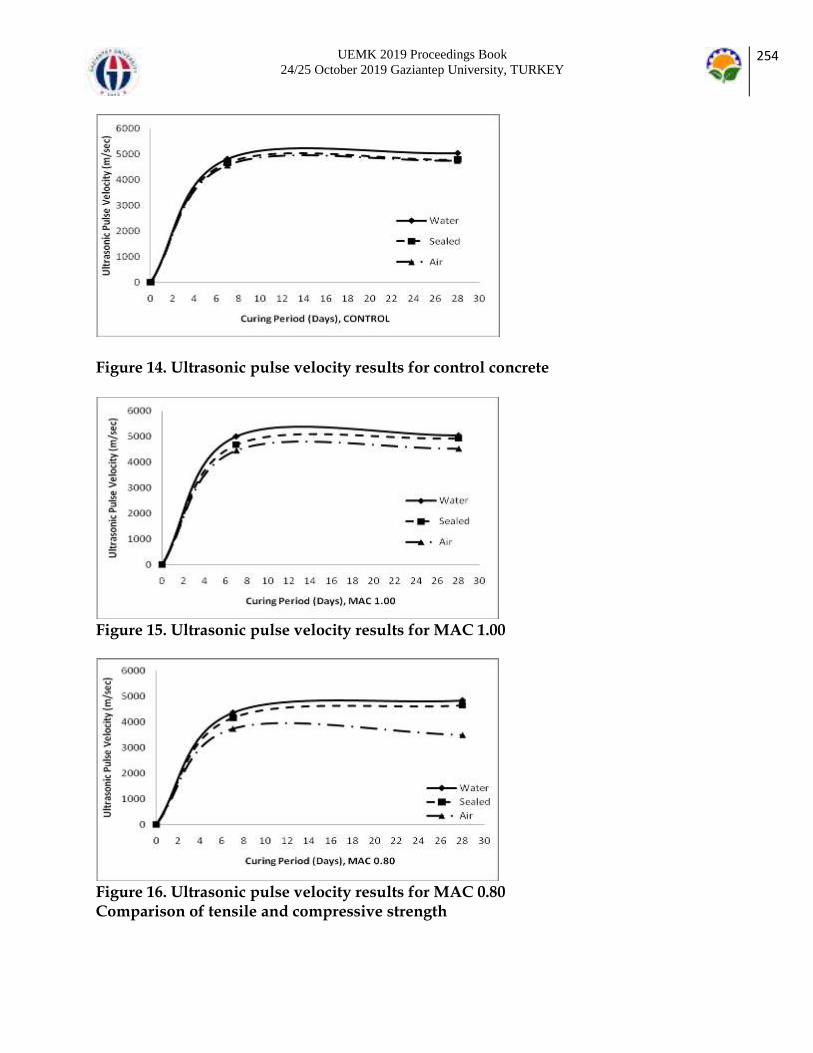
UEMK 2019 Proceedings Book 24/25 October 2019 Gaziantep University, TURKEY
254
Figure 14. Ultrasonic pulse velocity results for control concrete
Figure 15. Ultrasonic pulse velocity results for MAC 1.00
Figure 16. Ultrasonic pulse velocity results for MAC 0.80 Comparison of tensile and compressive strength
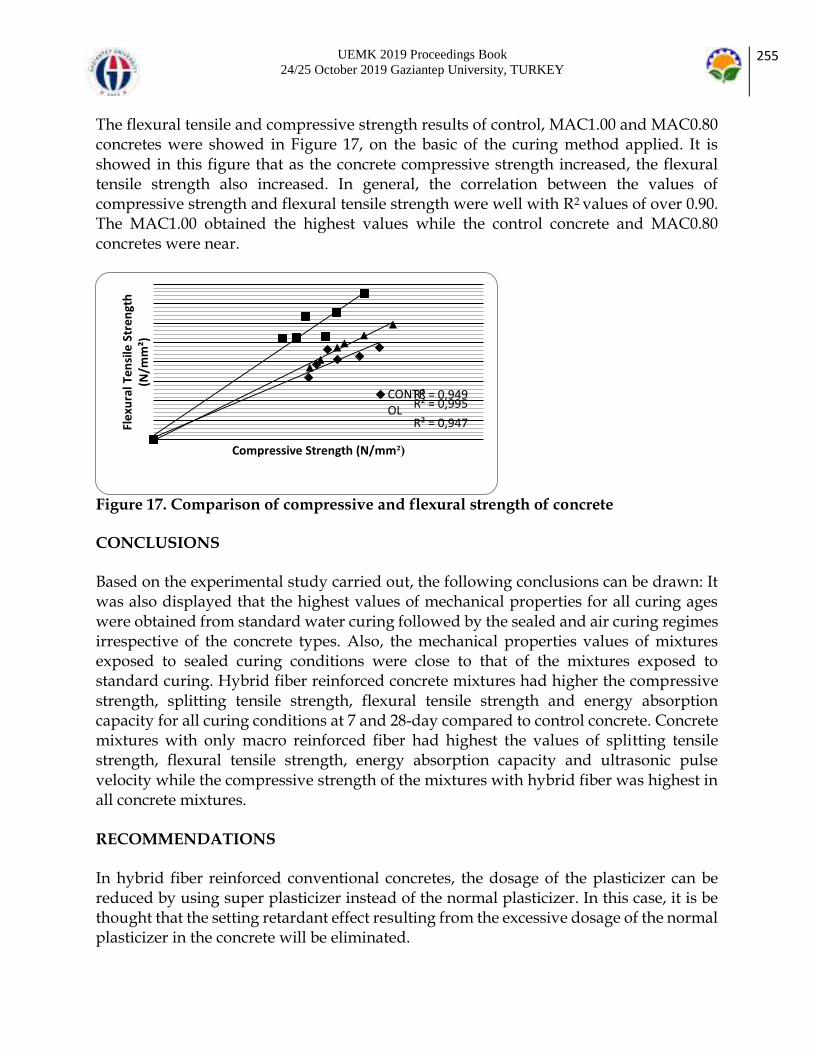
UEMK 2019 Proceedings Book 24/25 October 2019 Gaziantep University, TURKEY
255
The flexural tensile and compressive strength results of control, MAC1.00 and MAC0.80 concretes were showed in Figure 17, on the basic of the curing method applied. It is showed in this figure that as the concrete compressive strength increased, the flexural tensile strength also increased. In general, the correlation between the values of compressive strength and flexural tensile strength were well with R2 values of over 0.90. The MAC1.00 obtained the highest values while the control concrete and MAC0.80 concretes were near.
Figure 17. Comparison of compressive and flexural strength of concrete CONCLUSIONS Based on the experimental study carried out, the following conclusions can be drawn: It was also displayed that the highest values of mechanical properties for all curing ages were obtained from standard water curing followed by the sealed and air curing regimes irrespective of the concrete types. Also, the mechanical properties values of mixtures exposed to sealed curing conditions were close to that of the mixtures exposed to standard curing. Hybrid fiber reinforced concrete mixtures had higher the compressive strength, splitting tensile strength, flexural tensile strength and energy absorption capacity for all curing conditions at 7 and 28-day compared to control concrete. Concrete mixtures with only macro reinforced fiber had highest the values of splitting tensile strength, flexural tensile strength, energy absorption capacity and ultrasonic pulse velocity while the compressive strength of the mixtures with hybrid fiber was highest in all concrete mixtures. RECOMMENDATIONS In hybrid fiber reinforced conventional concretes, the dosage of the plasticizer can be reduced by using super plasticizer instead of the normal plasticizer. In this case, it is be thought that the setting retardant effect resulting from the excessive dosage of the normal plasticizer in the concrete will be eliminated.
R² = 0,947
R² = 0,949R² = 0,995
Fle
xura
l Te
nsi
le S
tre
ngt
h
(N/m
m²)
Compressive Strength (N/mm²)
CONTROL

UEMK 2019 Proceedings Book 24/25 October 2019 Gaziantep University, TURKEY
256
ACKNOWLEDGEMENT In this study, the financial support was provided by Scientific Research Projects Committee of Inonu University, Turkey (Project No: FBA-2017-776). Their support was gratefully acknowledged. REFERENCES ASTM C39 (2018). . Standard Test Method for Compressive Strength of Cylindrical Concrete Specimens, ASTM International, West Conshohocken, PA. ASTM C496 (2016). . Standard Test Method for Splitting Tensile Strength of Cylindrical Concrete Specimens, ASTM International, West Conshohocken, PA. ASTM C597-16 (2016). . Standard Test Method for Pulse Velocity Through Concrete, ASTM International, West Conshohocken, PA. ASTM C1609 (2019). . Standard Test Method for Flexural Performance of Fiber-Reinforced Concrete, ASTM International, West Conshohocken, PA. Bentur, A., Mindess, S., (1990). Fiber – reinforced cementitious composites. 1st ed. Elsevier Applied Science, London and New York. Bentur, A. (1989). Fiber – reinforced cementitious materials. Material Science of Concrete,Westerville, Ohio, The American Ceramic Society, 223-285. Bentz, D. P., Synder, K. A., Stutzman, P. E., (1997). Hydration of Portland cement: The effect of curing conditions, presented at the 10th Int. Congr. Chemistry of Cement, Sweden. British Cement Association (BCA) (1993). Curing, Concrete Series, Crowthorne, UK, 9. Ding, Y. N., You, Z., Jalali, S., (2010). Hybrid fiber influence on strength and toughness of RC beams. Composite Structures, 92(9), 2083-2089. Hannant, D. J. (1987). Fiber cements and fiber concrete. Chichester, UK:Wiley. Mazaheripour, H., Ghanbarpour, S., Mirmoradi, S. H., Hosseinpour, I., (2011). The effect of polypropylene fibres on the properties of fresh and hardened lightweight self-compacting concrete. Construction and Building Materials, 25(1), 351-358.

UEMK 2019 Proceedings Book 24/25 October 2019 Gaziantep University, TURKEY
257
Mobasher, B., Li Cheng, Y., (1996). Mechanical properties of hybrid cement based composites. American Concrete Institute Materials Journal , 93(3), 284-292. Pierre, R., (2000). Ultra High Performance Fibre Reinforced Concretes: An overview, Fifth RILEM Symposium on Fibre-Reinforced Concretes, Lyon, France. Rossi, P., Acker, P., Malier, Y., (1987). Effect of steel fibres at two different stages: the material and the structure. Material and Structures, 20(6), 436-439. Sahmaran, M., Yurtseven, A., Yaman, I., (2005). Workability of hybrid fiber reinforced self-compacting concrete. Building and Environment , 40, 1672-1677. Yazicioglu, S., Caliskan, S., Turk, K., (2006). Effect of curing conditions on the engineering properties of self-compacting concrete. Indian Journal of Engineering & Materials Sciences, 13, 25-29. Turk, K., Caliskan, S., Yazicioglu, S., (2007). Capillary water absorption of self-compacting concrete under different curing conditions. Indian Journal of Engineering & Materials Sciences, 14, 365-372.

UEMK 2019 Proceedings Book 24/25 October 2019 Gaziantep University, TURKEY
258
NUMERICAL INVESTICATION OF STRUCTURAL BEHAVIOR OF STEEL FRAMES UNDER
FIRE LOAD
Aslıhan ALGÜL Mustafa ÖZAKÇA University of Gaziantep, Gaziantep, TURKEY [email protected], [email protected] ABSTRACT: The fire event in steel structures is a critical point to be focused on. For that reason, steel structures are of particular importance in terms of fire. In these structures, the shape changes occurring during the fire are in the foreground. Steel structures have taken place in many standards on the world. Structures that can withstand up to 540°C in regulations related to fire, are characterized as durable. However, steel which has mentioned has resistance to a certain limit should not be ignored. This steel reaches half of the yield stress at room temperature at 550°C and is observed in a laboratory environment where it resist to various fire conditions. The resistance to fire time is the interval at which a structure continues to fulfill what is expected of a particular fire load. Steel structures are used especially in industrial structures. This is because the structures must have a wide span and a long height. Industrial building systems have a serious loss of life and property when the fire occurs. In order to avoid this event, design should be done based on fire and ıt should be aimed to delay the collapse period. It has been observed that these measures have greatly reduced the hazards of fire that may arise. Keywords: Steel Structures, Fire design, Industrial Building Systems INTRODUCTION Fire makes a constant danger to humans. During history, it has caused to change the historical textures, so it has lead the substances to receive new forms. The fire is in all forms of housing, office, school, factory, etc. Therefore, it can occur in anywhere at any moment. Since the possibility of a fire is always in question, the important thing is to find the elements which can cause to have a fire and take prevention in order to interfere with the fire. One of the weakest features of the steel is very sensitive to heat. Steel is not flammable as being material. When the heat goes up, rapid decreases occur of its strength and elasticity modulus. Especially, the decrease in strength values of the steel becomes obvious when the heat is above 200 °C [1]. Among the most important uses of steel structures are industrial structures. Among the reasons why industrial structure are made up of steel construction is that it is possible to cross wide openings without columns and easy to assemble conveyor and monorail lines in industrial structures. The biggest disadvantage of steel structures in this regard is fire. The resistance of steel at high temperature decreases very quickly. In industrial structures, thinner, fibre-style materials cause the temperatures in the fire to rise suddenly and the strength of steel structures to drop very quickly. This period up to the collapse of the structure is very

UEMK 2019 Proceedings Book 24/25 October 2019 Gaziantep University, TURKEY
259
important in terms of avoiding the loss of both human and property with minimal damage. I did this study to measure the effect of the scissors system in the industrial structure on this time. THE RELATION OF STEEL STRUCTURE AND FIRE The high temperatures encountered in fires lead to significant changes in mechanical properties of steel building materials and significant expansion in these materials. Experiments have shown that when the temperature increases, the flow limit in carbon steel is decreased and no residual flow limit is formed after a certain temperature. This means that when compared to normal temperatures, plastic shape changes begin to take place under lower stresses and the total shape change is greater under the same strain. After the tensile strength of steel increases slightly at 150 ~ 300 °C, it decreases rapidly at higher temperatures and falls below the safety strain at 550 °C, which is easily accessed in fires. Steel is very sensitive to heat, although it is not flammable as material, and rapid decreases can be observed in strength and elasticity modulus as heat rises. When the steel is unprotected, there can be seen some losses in its own strength and changes in own shape, while it is starting to soften at high temperatures. Therefore, it is mandatory to protect steel structural elements against fire. The resistance of unprotected steel to the fire is limited to 60 minutes. This time is the highest value, and normally this limit is even lower. The required fire resistance in steel structures is expressed in the form of fire-resistant classes which are F30 (30-59 min.), F60 (60-89 min.), F90 (90-119 min.), F120 (120-179 min.) and F180 (180 min.). This fire- resistance varies depending on the number of floors of the building, its intended use, type, fire load, and the positive effect of sprinkler systems. These deadline periods represent neither the actual fire wait times nor the time required for the escape of residents of the building. Time parameters are basically made to compare buildings for fire safety and demonstrate the durability of structural steel elements in laboratory conditions. THE STUDIES OF FIRE ON THE STEEL There has been a lot of work done in the world about fires in buildings. The main reason why these studies are widespread on steel is that steel structures lose their strength very quickly under high temperatures. In general, studies have shown that this temperature value has completely lost its strength of steel material after reaching 1000 degrees. We can examine the studies on this subject in two groups Experimental Studies: In our country, experimental studies related to fire are limited. This requires a lot of budget .This is not available in our country at the moment. Theoretical Studies: Many different programs can be used when working on fire. In the study below, a theoretical study was conducted using the SAFIR program.

UEMK 2019 Proceedings Book 24/25 October 2019 Gaziantep University, TURKEY
260
Built in Geneva, Switzerland, the Hans-Wilsdorf is a unique steel bridge. This structure is vital in terms of its resistance to fire load. Therefore an analysis was conducted through the SAFIR program to measure the sensitivity of the structure to fire. This analysis made the event more descriptive by FDS simulation of a truck burning on the bridge, resulting in significant results. As a result of the analysis, we have come to the conclusion that Hans-Wilsdorf bridge is safe in fire situations and that the structure has a really satisfactory attitude towards fire with many simulations being studied.
This result is obtained partly because the different scenarios develop in open air.
The CFD analysis was very helpful and confirmed the assumed maximal temperature expected using simplified analytcal models
The possibility to get adrabratic temperature values from the FDS model to be introduced in to the SAFIR model was very helpful [6]. Welded steel frame is one of the most suitable traditional engineering structures used today. However, the economic fire designs of these buildings are important issue. The aim of the current research is to examine the complex structural behavior of a single layer of an industrial structure during fire. This analysis focuses on advanced numerical techniques that make the system’s fire resistance more economical using the SAFIR program. This analysis outlines a complex research program to improve the FEM based design method of steel frames installed by fire action. This possibilities and advantages of combined analysis methods are presented and discussed on paper that can make the design of steel frames easier and faster for static loads and fire action. The paper presents two modelling levels to analyse steel frames under fire action and to consider the time depend joint characteristics, which can lead to a more accurate approximation of the real structural behaviour. ANALYSED STRUCTURES The most widely used types of frames in industrial structures are portal frame and truss frame. Both types of frames provide sufficient stability and adequate continuity by regulations. When determining which one will by used during the design process, the material supply time, affordability, manufactoring time, labor cost, location of cranes, monarays and conveyorlines within the structure determine the type of frames. Portal frame is short manufactoring time and low cost of workmanship are the most important reason why the portal frames are preferred. IPE and INP profiles are often used when choosing frames in portal frames due to the fact that IPE and INP profiles are more economical (the ratio of kg/m is lower than other) than HEA and HEB profiles. Truss frame is one of the most important reason for choosing truss frame is that it is much more economical than Rolling trusses in wide opening. When making this comparison, the cost of labor should be checked. Because of manufacturing time is long and workmanship is hard. In general, pipe and box profiles are preferred when selecting

UEMK 2019 Proceedings Book 24/25 October 2019 Gaziantep University, TURKEY
261
corner benches in the upper and lower headers and connectors. The material supply time is not long (since most of materials produced in Turkey are corner pipe nd box profiles). It is also suitable for welded and bolted connections. When examining the effect of frame differences in industrial structures under the fire load, first we need to design the industrial structure. For this purpose, the regulations in SAP2000 defines the clearance and axle dimensions of the structure, earthquake, snow and wind loads and determines sections of the industrial structure. The structure consisting of 6 axles with a gap of 15m in the industrial structure subject to this thesis is designed as if it will be built on the site of Civil Engineering Department of Gaziantep University and the required ground by the regulations, seismicity wind and snow load coefficients are selected accordingly. These sections are created in the WIZARD (It is the program which is used to create TEM files for the SAFIR program) after the sections are determined in the same aperture and axle ranges in the types of truss and portal frames. To create TEM files, TEM files are formed by sizing and analyzing them with using SAFIR. A sequential analysis is used to properly analyze a structure under fire. Figure 4.1 schematically shows the steps of nonlinear sequential analysis. The first stage of loading is the application of gravitational loads that are assumed to be static, smooth and constant throughout the analysis. A fake earthquake load then follows in the form of a pushover that reaches its maximum value and returns to zero in a short time Before fire loading, the properties of the structures are set to the reference temperature, but during the fire the mechanical properties change with the temperature. In this study, sequential seismic and fire analyzes were carried out using SAP2000 for thrust analysis and SAFIR for sequential analysis, including the model shown in. Turkey’s earthquake regulations and American regulations are exactly the same except for very small differences. Since Turkey does not have a design code in SAP2000 program, we choose the AISC 360-10 design code from the American regulation.
Figure 1.Portal Frame Analysis Result in SAP2000 (Determination of cross section)
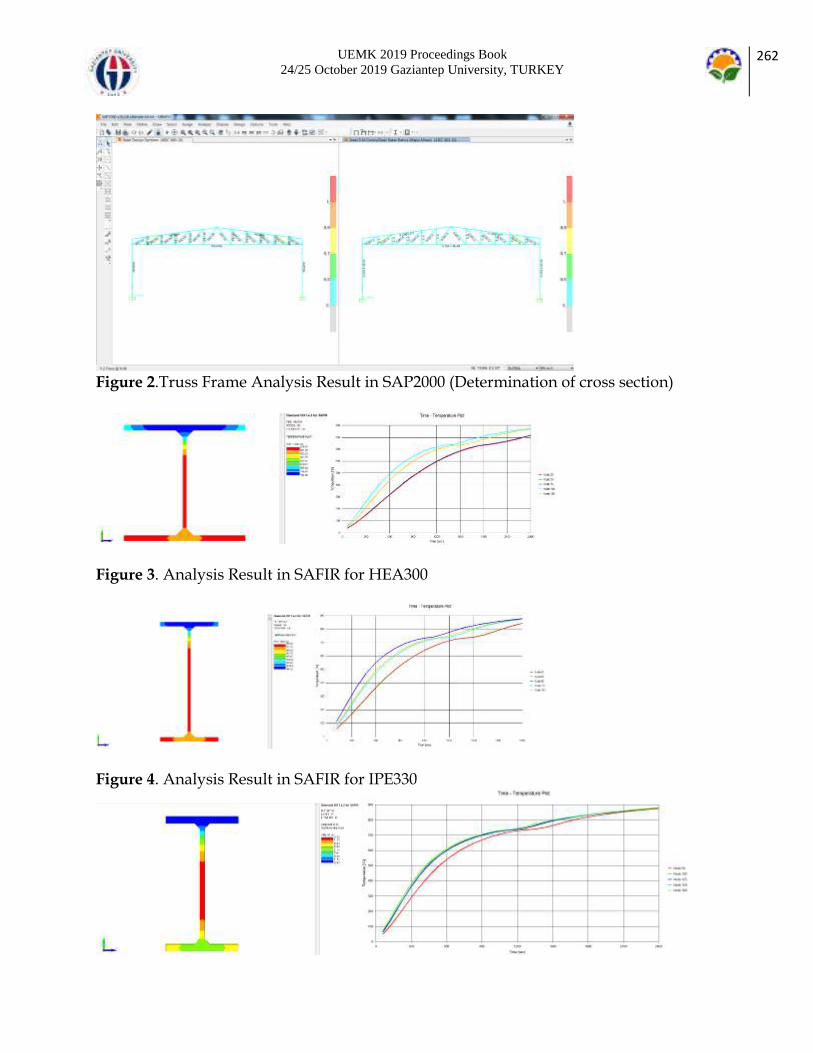
UEMK 2019 Proceedings Book 24/25 October 2019 Gaziantep University, TURKEY
262
Figure 2.Truss Frame Analysis Result in SAP2000 (Determination of cross section)
Figure 3. Analysis Result in SAFIR for HEA300
Figure 4. Analysis Result in SAFIR for IPE330

UEMK 2019 Proceedings Book 24/25 October 2019 Gaziantep University, TURKEY
263
Figure 5. Analysis Result in SAFIR for IPE120 CONCLUSION Steel structures are used in industrial structures because of their desired opening and usage areas (monorail, conveyor lines, etc.) The disadvantage of steel structures is that they do not have resistance to heat. This study was carried out to measure fire resistance times of two different truss systems with the same opening, height and axle ranges. For this purpose, in the static analysis program, sections of the industrial structure that should be used under seismicity, wind and snow loads were determined. Then, TEM files of the column and truss system were created and the system was analyzed in thermal analysis program. The program provides convenience to the design engineer in terms of cross sectional effects, design criteria and account summary tables of the elements. The designer is able to analyze the results of the data efficiently. In addition, the program clearly states the formulations used in analysis with manual. REFERENCES [1] Arda, T.S. ve Yardımcı, N. (1995), Çelik Yapı Elemanlarının Yangın Mukavemeti, İstanbul, 50s [2] TS7486 Yangından Korunma-Terimler(1989), Türk Standartları Enstitüsü, Ankara. [3] Özcan O., Sağman N. ve İnce, A. (2000), Yangınla Mücadele Eğitimi Ders Kitabı, İtfaiye Eğitim Merkezi Yayınları, İstanbul. [4] Eric Tonicello, Sylvain Desanghere, Olivier Vassart,Jean Marc Franssen (2012) Fire Analysis Of A New Steel Bridge, Conference: 7 th International Conference on Structures at Zürich [5] Fire Behaviour of Steel Industrial Hall, Laszlo Horvath,Balazs Kövesdi,Laszlo Dunai, Budapest University of Technology and Economics,Department of Structural Engineering 1111 Budapest. http://www3.hamk.fi/metnet/Budapest%202015/P04Paper_Horvath_Kovesdi_Dunai.pdf [6] J.M. Franssen.(2012) User’s Manuel for SAFIR 2011 A Computer, Program for Analysis of Structures Subjected to Fire.

UEMK 2019 Proceedings Book 24/25 October 2019 Gaziantep University, TURKEY
264
CHALLENGES ON SMART THERMOSTAT SYSTEMS IN INTELLIGENT BUILDINGS Ataberk KEŞKİŞOĞLU Atılım University, Department of Mechanical Engineering, Ankara, Turkey [email protected] Cihan TURHAN Atılım University, Department of Energy Systems Engineering, Ankara, Turkey [email protected] ABSTRACT: The main purpose of Heating, Ventilating and Air-Conditioning (HVAC) systems is to increase thermal comfort for occupants. Alongside developing technology in intelligent building sector, HVAC systems still consume 30-50% of total energy consumption of the buildings. For this reason, smart thermostats become popular in order to decrease energy consumption while building a personalized network between the occupants and HVAC systems. On the other hand, smart thermostats bring large security and efficiency concerns for the occupants. A smart thermostat generally includes temperature sensor, a user interface for displaying and receiving information to and from an occupant, a communication port with HVAC system, a processor, and a transceiver. Large numbers of expensive sensors are used to gather personalized data and communication between the occupant and HVAC system is satisfied via wireless technologies. The privacy and security of these systems are always question marks. To this aim, this paper addresses some significant challenges on using smart thermostat systems and potential threats for the occupants. The main challenges on smart thermostats can be counted as privacy, security and complexity of devices for the occupants. Key words: smart thermostats, intelligent systems, security, advanced HVAC systems INTRODUCTION Heating, Ventilating and Air-Conditioning (HVAC) systems provide thermal comfort and air-conditioning for occupants and buildings, respectively (Ashrae, 2017). Buildings are responsible for 40% of total energy consumption share in Europe while HVAC systems consume approximately 30-50% of total energy in buildings (EU, 2018). Occupant activity and behavior play vital role on energy consumption of HVAC systems. For this reason, smart thermostats received an increasing attention with the development of intelligent building concept in the last decade. Siroky et al. (Široký, Oldewurtel, Cigler,

UEMK 2019 Proceedings Book 24/25 October 2019 Gaziantep University, TURKEY
265
& Prívara, 2011) indicated that improving control algorithms of HVAC systems is more cost-effective than changing HVAC equipment with efficient ones. Smart thermostats are control systems for intelligent buildings in order to satisfy better thermal environment to the occupants (Nguyen & Aiello, 2013). The control parameters are generally indoor air temperature and flow rate. In spite of occupants use these devices to save money, smart thermostats learn occupant behaviors by proper Artificial Intelligent (AI) methods and allow occupant to control parameters remotely, in conclusion save energy (Fig.1).
Figure 1. Overview of working principle of smart thermostats A smart thermostat generally includes temperature sensor, a user interface for displaying and receiving information to and from an occupant, a communication port with HVAC system, a processor, and a transceiver. Furthermore, smart thermostats use communication procedures such as Wi-Fi, Radio-Frequency (RF) and Bluetooth which allow occupant wireless control over HVAC system. In addition, the occupant follows and controls thermal comfort parameters even on smart phones and personal computers. In conclusion, the data is stored in a web-server. Thus, thermostat learns occupant behaviors by using existing data in server. Moreover, smart thermostats understand the absence/presence of occupants with the help of Passive Infrared (PIR) sensors to decrease energy consumption when the occupant is outside of building. Gruber et al. (2015) showed that 20% of energy usage can be decreased in buildings by using PIR sensors. However, the ability to reliably detect occupancy states is limited by the lack of sensing technologies (Pisello & Asdrubali, 2014). Additionally, intense caution is requested to develop control algorithm which lays on presence of occupants since more energy can be required to satisfy fully thermal comfortable environment again when occupant come back. With the development of smart thermostats, energy engineers and architects find an opportunity to monitor energy consumption of building; on the other hand, occupants are able to interact with intelligent building. Although there are some studies on developing smart systems for intelligent buildings in literature (Feldmeir, 2009; (Ranjan

UEMK 2019 Proceedings Book 24/25 October 2019 Gaziantep University, TURKEY
266
& Scott, 2016), (Turhan, 2018)), smart thermostats are also highly used in industrial applications (Google Nest, 2018; Ecobee, 2019; Honeywell, 2019) (Fig.2).
Figure 2. Examples of commercially available smart thermostats Smart thermostat producers offer different options to the occupants not only energy control of HVAC system but also water and gas leakage controls in building. However, smart thermostats require expert users due to their complex control mechanisms. Many occupants are aware of advantageous and features of these intelligent systems ((Danassis, Siozios, Korkas, Soudris, & Kosmatopoulos, 2017)). Moreover, according to Peffer et al. (Peffer, Perry, Pritoni, Aragon, & Meier, 2013), occupants find interfaces of smart thermostats quite confusing. Smart thermostats use wireless communication technologies which can be easily intercepted by unauthorized users. Security is a serious problem on vulnerable and unreliable device such as smart thermostats. Moreover, occupants have privacy concern since the system stores there is no occupant in the building. A potential attacker could reach this information by using the wireless network. (Worthy, Matthews, & Viller, 2016) stated that trust on smart thermostats is the biggest limitation on intelligent buildings. (Awojobi & Chang, 2017) indicated that the need of smart thermostats will be increased by 30% in 2020 compared to 2015. However, smart thermostats are still expensive since they include large number of sensors. The costs of smart thermostats vary between 249$ and 469$ (Burrough & Gill, 2015). The high price is an obstacle on growing demand. Considering the increase on elderly population in Europe, adaptation of smart thermostats is a vital challenge to create intelligent buildings. This paper proposes to address some significant challenges on using smart thermostats in intelligent buildings. The focus is on not only privacy and security concerns but also social and economic aspects. The knowledge of these challenges would help occupants and smart thermostat producers to make better and more secure environments in intelligent buildings. CHALLENGES ON SMART THERMOSTATS
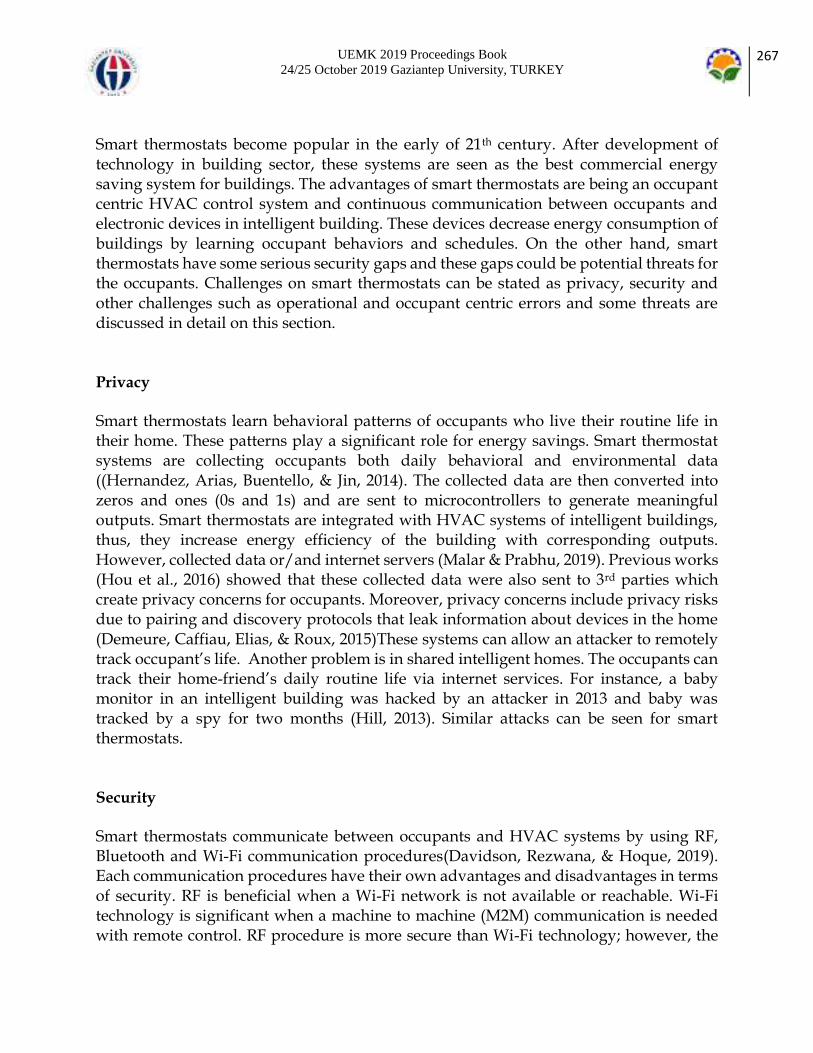
UEMK 2019 Proceedings Book 24/25 October 2019 Gaziantep University, TURKEY
267
Smart thermostats become popular in the early of 21th century. After development of technology in building sector, these systems are seen as the best commercial energy saving system for buildings. The advantages of smart thermostats are being an occupant centric HVAC control system and continuous communication between occupants and electronic devices in intelligent building. These devices decrease energy consumption of buildings by learning occupant behaviors and schedules. On the other hand, smart thermostats have some serious security gaps and these gaps could be potential threats for the occupants. Challenges on smart thermostats can be stated as privacy, security and other challenges such as operational and occupant centric errors and some threats are discussed in detail on this section. Privacy Smart thermostats learn behavioral patterns of occupants who live their routine life in their home. These patterns play a significant role for energy savings. Smart thermostat systems are collecting occupants both daily behavioral and environmental data ((Hernandez, Arias, Buentello, & Jin, 2014). The collected data are then converted into zeros and ones (0s and 1s) and are sent to microcontrollers to generate meaningful outputs. Smart thermostats are integrated with HVAC systems of intelligent buildings, thus, they increase energy efficiency of the building with corresponding outputs. However, collected data or/and internet servers (Malar & Prabhu, 2019). Previous works (Hou et al., 2016) showed that these collected data were also sent to 3rd parties which create privacy concerns for occupants. Moreover, privacy concerns include privacy risks due to pairing and discovery protocols that leak information about devices in the home (Demeure, Caffiau, Elias, & Roux, 2015)These systems can allow an attacker to remotely track occupant’s life. Another problem is in shared intelligent homes. The occupants can track their home-friend’s daily routine life via internet services. For instance, a baby monitor in an intelligent building was hacked by an attacker in 2013 and baby was tracked by a spy for two months (Hill, 2013). Similar attacks can be seen for smart thermostats. Security Smart thermostats communicate between occupants and HVAC systems by using RF, Bluetooth and Wi-Fi communication procedures(Davidson, Rezwana, & Hoque, 2019). Each communication procedures have their own advantages and disadvantages in terms of security. RF is beneficial when a Wi-Fi network is not available or reachable. Wi-Fi technology is significant when a machine to machine (M2M) communication is needed with remote control. RF procedure is more secure than Wi-Fi technology; however, the

UEMK 2019 Proceedings Book 24/25 October 2019 Gaziantep University, TURKEY
268
procedure can be easily interrupted with external sources and might cause some energy consumption problems (Decoutere, Carchon, Dehan, & Mercha, 2005). Smart thermostats generally use Wi-Fi network which allows many electronic devices to connect same link
(Zeng, Mare, Roesner, & Allen, 2017). The occupant uses a password to access Wi-Fi connected electronic devices. However, many authors indicated that occupants have security concerns with their internet connected smart thermostats(Manic, Amarasinghe, Rodriguez-Andina, & Rieger, 2016). For example, smart thermostats uses eco-mode (sleeping mode) when the occupant leaves the building and thus decrease energy consumption. However, GPS technique or PIR sensors are used to understand absence/presence of occupants and these data are stored in web-servers. Some attackers can reach this information and understand if the home is unoccupied or occupied and even understand that how many occupants live in that intelligent building. These systems have security gaps that can be hacked to remotely accessible (Lee, Lin, & Owe, 2019). Once it is hacked it gives continuous information about occupants’ location, motion activity within the home or sleeping condition. Other challenges 1. Smart thermostats have structural errors which lead energy consumption increase and thermal discomfort (Nägele, Kasper, & Girod, 2017). Big limitations of smart thermostats are their sleeping or eco-modes. These modes are activated with the occupant absence and/or sensing no motion in the building. Smart thermostat would be useless when occupant who has an amnesia or a baby that requires intense care during whole night. Smart thermostat cannot learn extreme behaviors which creates thermal discomfort and more energy consumption. 2. Some smart thermostats track location of occupants via GPS technologies in order to adjust set-temperature of HVAC system. However, a guest in intelligent building can ruin training period of smart thermostat. For instance, if the occupant deactivates the system, it will lead more energy consumption. If the occupant uses smart thermostat, the behavioral pattern will be guest’s pattern. This training error will affect testing period and lead wrong decisions for HVAC system. 3. All smart thermostat systems use operation networks. The main module of these devices acts like the brain of the network and unfortunately can only deal with limited tasks. Considering the aim of smart thermostat is to decrease energy consumption and increase thermal comfort, the main module must be connected in the main room for energy efficiency. The challenge is if an occupant lives in a residence which has more than one room, the set-temperature of HVAC system will only be adjusted for the main room. Producers still sell extra parts apart from the main system just for plugging the other

UEMK 2019 Proceedings Book 24/25 October 2019 Gaziantep University, TURKEY
269
rooms. Therefore, it will not only increase energy consumption but also the canalize occupants to buy extra sensors. 4. Behavioral patterns update itself once a week(Moustaka, Theodosiou, Vakali, Kounoudes, & Anthopoulos, 2019). Extreme or intense conditions are always ignored in smart thermostats. For example, an occupant could be sick and could need extra care for heating/cooling condition. In current systems, these possibilities are ignored and it will be annoying for the occupants to set temperature manually. 5. Smart thermostats use memory cards in their systems. Memory card contains all the collected data for intelligent building. Then, they provide communication between the occupants and HVAC system. However, memory cards are a big threat for these systems. Firstly, all smart thermostats require power for proper operation. Most of the cases, the power is supplied from batteries or directly from the city grid. Batteries could be a problem for the zones that cannot be changed easily. Secondly, if the thermostat is connected to city grid and the electricity goes off, smart thermostats reboot themselves. The challenge is losing behavioral patterns of occupants and the system needs to train itself again. This period is very time-consuming and requires more energy. Another issue is the internet crashes. Continuous data transfer is obtained from the occupants such as their location and clock information etc. Case of connection lost, smart thermostat systems will not operate accurately and cause thermal discomfort or energy loss. 6. Smart thermostats use occupancy detectors. Occupancy detectors are often falsely triggered by pets. Especially cats are curious animals, they will try to attack or play with smart thermostat systems. Also, some of the smart thermostat systems are integrated with security systems which have PIR sensors. False movement detection may not only trigger smart thermostat systems but also security system of building. Since smart thermostat systems are beneficial because of their energy-saving potential, a false trigger may cause a serious decrease in energy saving potential. 7. Smart thermostats learn occupant behaviors. These behaviors are updated once a week when smart thermostats sense a difference in the occupant’s behavior. If the occupant has not any daily routine, these systems become unreliable. If smart thermostat system cannot develop meaningful data, HVAC system will use more energy. 8. One of the main challenges of smart thermostat is initial cost. Main thermostat system is around $250 but it is not 100% effective when occupants only have this system alone. For higher effectiveness companies are selling additional sensors for each room. Each sensor is around $80. Higher energy efficiency requires large number of sensors, therefore, investment costs are high and the pay-back periods are long.

UEMK 2019 Proceedings Book 24/25 October 2019 Gaziantep University, TURKEY
270
9. For highest efficiency, smart thermostat systems are continuously communicating with occupants via Mobil applications installed into smart phones. This communication requirement causes some problems where the elder population is higher such as European countries (Europe Populatin, 2019).Elder occupants use less technology compared with younger populations. Separate from this situation, most of the old people do not have smart phones, which are required for efficiency gain in smart thermostat systems. The setup process of smart thermostat systems is also complicated for elders. It requires several cable connection, Wi-Fi or radiofrequency settings, etc. Therefore, these systems are not easily integrated with elders and would not be beneficial for them. 10. Thermal comfort is necessary for humans, animals, and plants. Almost all systems are designed for thermal comfort of occupants, however, thermal comfort of pets and plants are also significant. Smart thermostat systems go sleeping or eco-modes when occupants are not present in the building. Animals and plants do not have any chance to change their location. Eco-mode settings would be harmful for them. Humidity would change fast or temperature would be unbearable. RECOMMANDATIONS In this section, some recommendations are indicated about the challenges of smart thermostats. Some minor changes on the system can be effective to overcome problems mentioned above. Privacy Occupant behavioral data is stored both in the cloud network and memory card of smart thermostat systems. Some attackers can easily hack internet-connected systems. Cloud transmission is obtained by a Wi-Fi network and has security vulnerability by an external interruption. Ethernet cables are not easy to interrupt and may be used for the internet connection of smart thermostats. Smart thermostat system uses mobile applications to communicate with occupants. Smart phones became mainstream and reached out to almost everybody in the 21st century. Malwares are getting developed for smart phones too. Since smart thermostat systems got all your behavioral data it is highly risky for occupants to carry these pieces of information with them. We recommend companies to encrypt their data and develop an encrypted mobile application for the occupant. Companies should also create a secure network for domestic communication between smart systems. Security

UEMK 2019 Proceedings Book 24/25 October 2019 Gaziantep University, TURKEY
271
RF communication is more secure than Wi-Fi communication. On the other hand, RF can be interrupted with other electronic devices in intelligent building. For instance, all microwaves outflow radiation which interferes with the RF. Similarly, television receivers use RF and transmitters also interfere with the RF. The recommendations are a careful installation of these electronic devices and get regular maintenance. This solution will decrease interruptions and develop a smooth communication path. Creating a secure internet network is vital if smart thermostat uses Wi-Fi communication between occupants and HVAC systems. To shatter security concerns of occupant, producers should generate a secure internet and Wi-Fi networks for just smart thermostat systems. Another security issue is GPS module of smart thermostat systems. GPS is required for pre-heating of residences or post-deactivate of HVAC systems. Any external interfere will provide occupants current position information to 3rd parties. Occupants can de-activate this module and create a message-based communication. Occupants should be able to communicate with the system via short message services (SMS). After leaving/arriving the building, occupants could send SMS to smart thermostat systems and adjust the set-temperature. A simple notification will be sent to occupants for reminding to use this service. Other challenges Behavioral pattern is focused on occupants in intelligent building but the system often fails when a guest exists. The training period of smart thermostat becomes longer and time-consuming. Producers can add extra devices which are operated according to guest’s schedule. It is worth to note that smart thermostat should take into multi-user interactions consideration. Most of the smart thermostats update themselves once a week when smart thermostats sense a difference in the occupant’s behavior. Update periods can be shortened by the producers in order to decrease energy consumption since daily routines of occupant can change time to time. Occupancy detection is satisfied with the help of PIR sensors in smart thermostat systems. PIR sensors can be falsely triggered by pets. Producers should include more sensitive sensors that discriminate occupants from pets. Pets and babies are often curious which often try to reach smart thermostat systems. For security, producers should install the smart thermostat systems higher. Thus, pets and babies could not reach the smart thermostat easily.
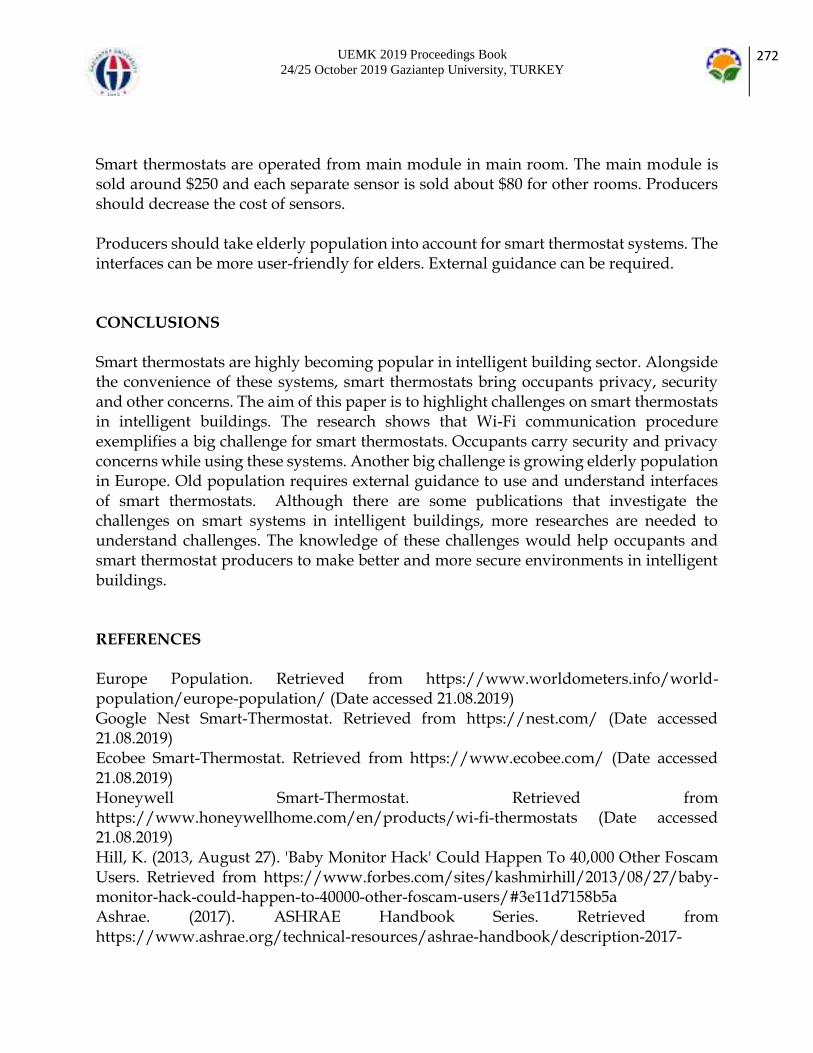
UEMK 2019 Proceedings Book 24/25 October 2019 Gaziantep University, TURKEY
272
Smart thermostats are operated from main module in main room. The main module is sold around $250 and each separate sensor is sold about $80 for other rooms. Producers should decrease the cost of sensors. Producers should take elderly population into account for smart thermostat systems. The interfaces can be more user-friendly for elders. External guidance can be required. CONCLUSIONS Smart thermostats are highly becoming popular in intelligent building sector. Alongside the convenience of these systems, smart thermostats bring occupants privacy, security and other concerns. The aim of this paper is to highlight challenges on smart thermostats in intelligent buildings. The research shows that Wi-Fi communication procedure exemplifies a big challenge for smart thermostats. Occupants carry security and privacy concerns while using these systems. Another big challenge is growing elderly population in Europe. Old population requires external guidance to use and understand interfaces of smart thermostats. Although there are some publications that investigate the challenges on smart systems in intelligent buildings, more researches are needed to understand challenges. The knowledge of these challenges would help occupants and smart thermostat producers to make better and more secure environments in intelligent buildings. REFERENCES Europe Population. Retrieved from https://www.worldometers.info/world-population/europe-population/ (Date accessed 21.08.2019) Google Nest Smart-Thermostat. Retrieved from https://nest.com/ (Date accessed 21.08.2019) Ecobee Smart-Thermostat. Retrieved from https://www.ecobee.com/ (Date accessed 21.08.2019) Honeywell Smart-Thermostat. Retrieved from https://www.honeywellhome.com/en/products/wi-fi-thermostats (Date accessed 21.08.2019) Hill, K. (2013, August 27). 'Baby Monitor Hack' Could Happen To 40,000 Other Foscam Users. Retrieved from https://www.forbes.com/sites/kashmirhill/2013/08/27/baby-monitor-hack-could-happen-to-40000-other-foscam-users/#3e11d7158b5a Ashrae. (2017). ASHRAE Handbook Series. Retrieved from https://www.ashrae.org/technical-resources/ashrae-handbook/description-2017-

UEMK 2019 Proceedings Book 24/25 October 2019 Gaziantep University, TURKEY
273
ashrae-handbook-fundamentals Awojobi, A., & Chang, H. (2017). Security and Privacy Issues with Smart Thermostats – A First Look. Burrough, M., & Gill, J. (2015). Smart thermostat security: turning up the heat. Retrieved from https://burrough.org/papers/523-Final-Paper.pdf Danassis, P., Siozios, K., Korkas, C., Soudris, D., & Kosmatopoulos, E. (2017). A low-complexity control mechanism targeting smart thermostats. Energy and Buildings, 139, 340–350. https://doi.org/10.1016/J.ENBUILD.2017.01.013 Davidson, C., Rezwana, T., & Hoque, M. A. (2019). Smart Home Security Application Enabled by IoT: BT - Smart Grid and Internet of Things (A.-S. K. Pathan, Z. M. Fadlullah, & M. Guerroumi, eds.). Cham: Springer International Publishing. Decoutere, S., Carchon, G., Dehan, M., & Mercha, A. (2005). Passive on-chip components: Trends and challenges for RF applications. Microelectronic Engineering, 82(3–4), 503–513. https://doi.org/10.1016/J.MEE.2005.07.050 Demeure, A., Caffiau, S., Elias, E., & Roux, C. (2015). Building and Using Home Automation Systems: A Field Study. https://doi.org/10.1007/978-3-319-18425-8_9 EU. (2018). Energy performance of buildings and Directive 2012/27/EU on energy efficiency (Text with EEA relevance). Official Journal of the European Union, 156(75), 1–17. Retrieved from https://eur-lex.europa.eu/legal-content/EN/TXT/PDF/?uri=CELEX:32018L0844&from=EN Hernandez, G., Arias, O., Buentello, D., & Jin, Y. (2014). Smart Nest Thermostat : A Smart Spy in Your Home. Black Hat USA, 1–8. Hou, L., Zhao, S., Xiong, X., Zheng, K., Chatzimisios, P., Hossain, M. S., & Chen, W. (2016). Internet of Things Cloud: Architecture and Implementation. IEEE Communications Magazine, 54(11), 32–39. https://doi.org/10.1109/MCOM.2016.1600398CM Lee, M.-C., Lin, J.-C., & Owe, O. (2019). PDS: Deduce elder privacy from smart homes. Internet of Things, 7, 100072. https://doi.org/10.1016/J.IOT.2019.100072 Malar, M. B. B. A., & Prabhu, J. (2019). An analysis of security issues in cloud computing. International Journal of Civil Engineering and Technology, 10(2), 2138–2153. Manic, M., Amarasinghe, K., Rodriguez-Andina, J. J., & Rieger, C. (2016). Intelligent Buildings of the Future: Cyberaware, Deep Learning Powered, and Human Interacting. IEEE Industrial Electronics Magazine, 10(4), 32–49. https://doi.org/10.1109/MIE.2016.2615575 Moustaka, V., Theodosiou, Z., Vakali, A., Kounoudes, A., & Anthopoulos, L. G. (2019). Εnhancing social networking in smart cities: Privacy and security borderlines. Technological Forecasting and Social Change, 142, 285–300. https://doi.org/10.1016/J.TECHFORE.2018.10.026 Nägele, F., Kasper, T., & Girod, B. (2017). Turning up the heat on obsolete thermostats: A simulation-based comparison of intelligent control approaches for residential heating systems. Renewable and Sustainable Energy Reviews, 75, 1254–1268. https://doi.org/https://doi.org/10.1016/j.rser.2016.11.112

UEMK 2019 Proceedings Book 24/25 October 2019 Gaziantep University, TURKEY
274
Nguyen, T. A., & Aiello, M. (2013). Energy intelligent buildings based on user activity: A survey. Energy and Buildings, 56, 244–257. https://doi.org/10.1016/J.ENBUILD.2012.09.005 Peffer, T., Perry, D., Pritoni, M., Aragon, C., & Meier, A. (2013). Facilitating energy savings with programmable thermostats: evaluation and guidelines for the thermostat user interface. Ergonomics, 56(3), 463–479. https://doi.org/10.1080/00140139.2012.718370 Pisello, A. L., & Asdrubali, F. (2014). Human-based energy retrofits in residential buildings: A cost-effective alternative to traditional physical strategies. Applied Energy, 133, 224–235. https://doi.org/10.1016/J.APENERGY.2014.07.049 Ranjan, J., & Scott, J. (2016). ThermalSense: determining dynamic thermal comfort preferences using thermographic imaging. https://doi.org/10.1145/2971648.2971659 Široký, J., Oldewurtel, F., Cigler, J., & Prívara, S. (2011). Experimental analysis of model predictive control for an energy efficient building heating system. Applied Energy, 88(9), 3079–3087. https://doi.org/10.1016/J.APENERGY.2011.03.009 Turhan, C. (2018). Development of energy-efficient personalized thermal comfort driven control in HVAC systems. Retrieved from http://openaccess.iyte.edu.tr/handle/11147/7166 Worthy, P., Matthews, B., & Viller, S. (2016). Trust me: Doubts and concerns living with the internet of things. DIS 2016 - Proceedings of the 2016 ACM Conference on Designing Interactive Systems: Fuse, 427–434. https://doi.org/10.1145/2901790.2901890 Zeng, E., Mare, S., Roesner, F., & Allen, P. G. (2017). End User Security and Privacy Concerns with Smart Homes End User Security & Privacy Concerns with Smart Homes. (Soups). Retrieved from https://www.usenix.org/conference/soups2017/technical-sessions/presentation/zeng.

UEMK 2019 Proceedings Book 24/25 October 2019 Gaziantep University, TURKEY
275
EFFECT OF SHEAR SPAN AND REINFORCEMENT RATIO ON NORMAL AND
HIGH STRENGTH REINFORCED CONCRETE ONE WAY SLAB
Sara Sh. Alhilali Department of Civil Engineering, University of Gaziantep, Turkey [email protected] Bahaa H. Al-Abbas Department of Civil Engineering, University of Kerbala, Iraq [email protected] Mustafa ÖZAKÇA Department of Civil Engineering, University of Gaziantep, Turkey [email protected] ABSTRACT: This paper investigates the flexural behavior, ultimate load carrying capacity, deflection, and cracking for High-Strength Concrete (HSC) and Normal-Strength Concrete (NSC) one way solid slab. For this, reinforced concrete slabs with rectangular in cross-section and nominally 3500 mm long, 600 mm width, and 150 mm thickness with a clear span (distance between supports) of 3300 mm are analyzed. Nonlinear finite element analysis (FEA) under four points loading are carried out. These types of slabs could be analyzed numerically by using software program ANSYS19.1. The parameters studied in this research are the concrete strength (NSC with 𝑓𝑐
′=34 MPa and HSC with 𝑓𝑐′ =52 and
𝑓𝑐′ =70 MPa), different shear span to effective depth ratios (a/d), and effective of tensile
longitudinal reinforcement ratio. The results indicated that increasing the amount of reinforcement ratio for HSC improved the peak load carrying capacity and reducing the mid-span deflection ductility as compared to NSC with the same reinforcement configuration. The numerical findings also point out that the ultimate capacity of these slabs reduces with increasing the ratio (a/d) for (6, 8, and 10) respectively. Peak load obtained from FEA were verified by comparison with previous experimental research and had good correlation with the experimental result. Keywords: reinforced concrete slab, ANSYS, flexural behavior, nonlinear finite element. INTRODUCTION The one way solid slab is a unique efficient structural system. The possibility of producing one-way simply supported slab with NSC and HSC has opened now opportunities for structural designers. It is economically important and widely used in structural applications such as roofs, floors, and walls. A significant amount of research

UEMK 2019 Proceedings Book 24/25 October 2019 Gaziantep University, TURKEY
276
has previously focused on behavior of reinforced concrete members built with HSC (Li & Aoude 2019, Mohebi et al 2019, Al-Shamiri et al 2019). In the past many of researchers studies on the structural behavior of HSC and NSC simply supported slab. Al-Azzawi, & Abed (2017) tested one way solid slab for different shear span to depth ratios (a/d) (2, 2.5, and 3) and the results showed that the ultimate load carrying capacity of the slab reduces with increasing the ratio (a/d) under flexural failure. Mahmoud (2015) have carried out the nonlinear FEA of 16 flat-slab models using ANSYS10 software for studying the shear reinforcement behavior on flat slab. In this research parameters studied are slab thickness and punching shear reinforcement. Shehab et al (2017) carried out experimental work and nonlinear FEA by using ANSYS program for studying the opening ratio effect on solid one way slab. They showed that the FEA results had a good agreement with the experimental results. Al-Azzawi & Abed (2006) reported a series of modeling by software ANSYS for simply supported solid NSC (concrete strength as 25, 38, and 45 MPa) slab. They reported that, the compressive strength increases caused increase in cracking and peak load. Qin et al (2017) studied on effect of different reinforcement ratio on the flexural performance. They noted that ductility of reinforced concrete beam specimens are reduced by decreasing the hybrid reinforcement ratio. The objective of paper is to investigate the flexural behavior, ultimate load carrying capacity, deflection, and cracking for HSC and NSC one way solid slab using nonlinear FEA. ANALYTICAL PROGRAM The analytical program consisted of analyses of 27 full-scale one-way spanning slab. All slabs were rectangular in cross-section and nominally 3500 × 600 × 150 mm with a clear span of 3300 mm as shown in Figure 1. These slabs specimens were separated to three sets according to concrete strength in which 𝑓𝑐
′ =34 MPa for NSC , 𝑓′𝑐= 52 MPa and 𝑓′𝑐= 70 MPa for HSC and each of them included three types of shear span to effective depth ratio (a/d) (6, 8, and 10) and different steel reinforcement ratio (0.22, 0.34 and 0.5). Details and description of analyzed specimens are shown in Table 1.
Fig.1 Details of specimens
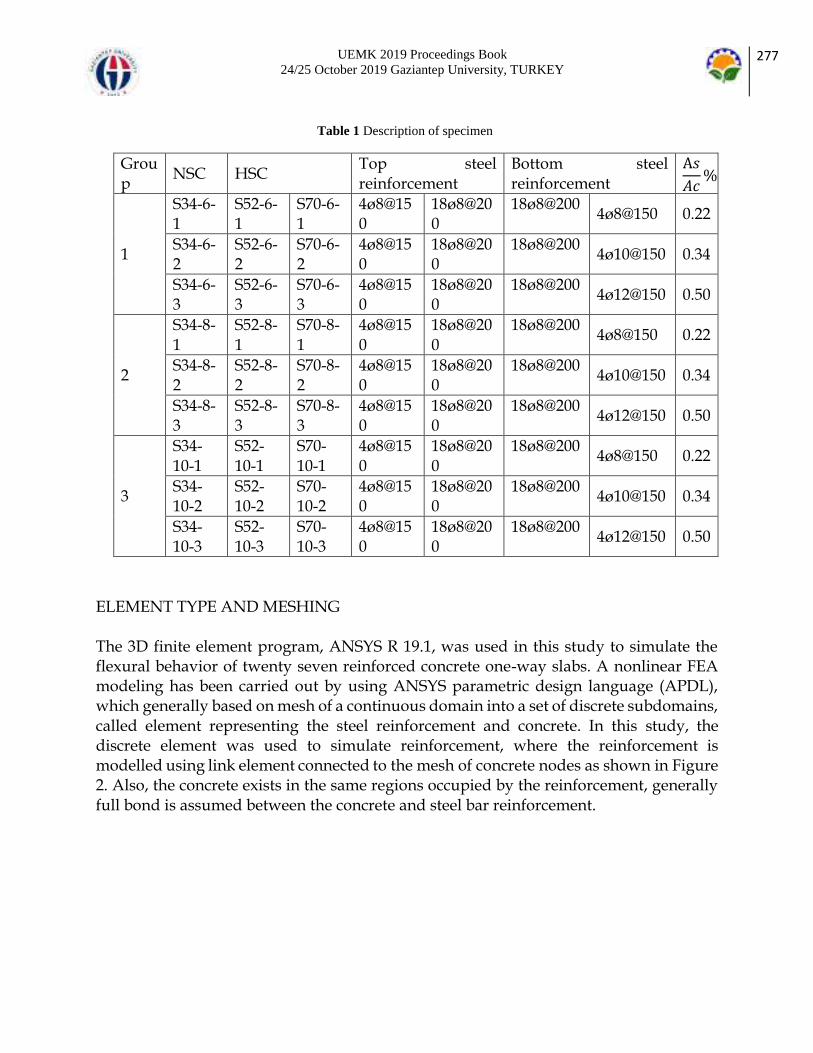
UEMK 2019 Proceedings Book 24/25 October 2019 Gaziantep University, TURKEY
277
Group
NSC HSC Top steel reinforcement
Bottom steel reinforcement
A𝑠
𝐴𝑐%
1
S34-6-1
S52-6-1
S70-6-1
4ø8@150
18ø8@200
18ø8@200 4ø8@150 0.22
S34-6-2
S52-6-2
S70-6-2
4ø8@150
18ø8@200
18ø8@200 4ø10@150 0.34
S34-6-3
S52-6-3
S70-6-3
4ø8@150
18ø8@200
18ø8@200 4ø12@150 0.50
2
S34-8-1
S52-8-1
S70-8-1
4ø8@150
18ø8@200
18ø8@200 4ø8@150 0.22
S34-8-2
S52-8-2
S70-8-2
4ø8@150
18ø8@200
18ø8@200 4ø10@150 0.34
S34-8-3
S52-8-3
S70-8-3
4ø8@150
18ø8@200
18ø8@200 4ø12@150 0.50
3
S34-10-1
S52-10-1
S70-10-1
4ø8@150
18ø8@200
18ø8@200 4ø8@150 0.22
S34-10-2
S52-10-2
S70-10-2
4ø8@150
18ø8@200
18ø8@200 4ø10@150 0.34
S34-10-3
S52-10-3
S70-10-3
4ø8@150
18ø8@200
18ø8@200 4ø12@150 0.50
ELEMENT TYPE AND MESHING The 3D finite element program, ANSYS R 19.1, was used in this study to simulate the flexural behavior of twenty seven reinforced concrete one-way slabs. A nonlinear FEA modeling has been carried out by using ANSYS parametric design language (APDL), which generally based on mesh of a continuous domain into a set of discrete subdomains, called element representing the steel reinforcement and concrete. In this study, the discrete element was used to simulate reinforcement, where the reinforcement is modelled using link element connected to the mesh of concrete nodes as shown in Figure 2. Also, the concrete exists in the same regions occupied by the reinforcement, generally full bond is assumed between the concrete and steel bar reinforcement.
Table 1 Description of specimen

UEMK 2019 Proceedings Book 24/25 October 2019 Gaziantep University, TURKEY
278
Fig.2 Discrete model for reinforced concrete Concrete was modeled using (SOLID65) 3D 8-node solid elements. The feature of this element is the ability to account the behavior of nonlinear material, and also capable of prevent the perpendicular cracking in three directions creep, plastic deformation and crushing. The element having three degrees of freedom at each node in the x, y & z directions is defined by eight nodes as shown in Figure 3(a). The steel reinforcement are represented by (LINK180), this element is a uniaxial tension–compression have three degrees of freedom at each node, and also capable of plastic deformation. Figure 3(b) explain the geometry of LINK180. The element (SOLID185) as shown in Figure 3(c) is used for modeling the steel plates with three degrees of freedom at each node in the x, y & z directions. The element is capable of hyper elasticity, plasticity, stress stiffening, large deflection, creep, and large strain capabilities.
(a) SOLID65 (b) LINK180 (c) SOLID185
Fig.3 The type of element used for FEA modelling
Four types of concrete mesh solid slab are used to find the best mesh density (1260, 2400, 5040, & 9000 element) as shown in Figure 4.

UEMK 2019 Proceedings Book 24/25 October 2019 Gaziantep University, TURKEY
279
MATERIAL MODELS Multi-linear isotropic properties are required for solid65 element to model the
behavior of concrete. The failure of concrete define by multi-linear material uses von
Mises criterion along with the (Warnk & Willam 1974). Modulus of elasticity of
concrete (𝐸𝑐) based on Eq (1) for NSC & HSC.
𝐸𝑐 = 4700√𝑓𝑐 for NSC and 𝐸𝑐 = 5700√𝑓𝑐 for HSC (1)
(a) 1260 elements (size 100×25mm) (b) 2400 elements (size 75×25)
(c) 5040 element (size 50×25) (d) 9000 element (size 35×25)
Fig.4 Finite element meshing
The compressive strength of concrete considered in present study was 34, 52 & 70 MPa
with 0.2 Poisson’s ratio. The uniaxial stress-strain relationship for NSC in compression
as shown in Figure 5(a) are required for software and construct in Eq (2) (Gere and
Timoshenko, 1997)
f =Ec∗ε
1+(ε
εₒ)²
ε0 =2fc
Ec Ec =
f
ε0 (2)
While the stress-strain curve for HSC shown in Figure 5(b) using Eq 3 (Sargin 1971).
fc =fc′ A(
ε
εco)+(D−1)(
ε
εco)²
1+(A−2)(ε
εco)+D(
ε
εco)²
Eit = 5975√fc D = 0.65 − 7.25fc`10⁻ᶟ A =
Eit∗εco
fc` εco =
0.0024 (3)

UEMK 2019 Proceedings Book 24/25 October 2019 Gaziantep University, TURKEY
280
(a) Stress-strain curve for NSC, (Gere and
Timoshenko1997) (b) Stress-strain curve for HSC,
(Sargin 1971)
Fig.5 Stress strain curve for NSC and HSC The shear transfer coefficients are ranged from (0.0 to 1.0), with 0.0 for smooth crack and 1.0 for rough crack. The various values attempted for shear transfer coefficients open crack Bt and closed crack Bc within a range between (0.15 to 0.9) for Bt and (0.5 to 0.9) for Bc. In this study, Bt and Bc were set to 0.2 and 0.8 respectively (Shehab & El-Awady, 2017). These values were achieving a good converging results. The uniaxial cracking strength is calculated using (Al-Azzawi & Abed, 2017):
fct = o. 5√fc (3)
The steel reinforcement element was assumed to be bilinear isotropic inelastic material and agreeing in tension and compression as shown in Figure 6. Poisson’s ratio of 0.3 was used for all reinforcement types, LINK180 and SOLID185 in linear isotropic material, while the young modulus was 200 GPa for desecrate steel bar and 2000 GPa for support plate.
Fig.6 Stress-strain curve for steel
LOADS AND BOUNDARY CONDITIONS
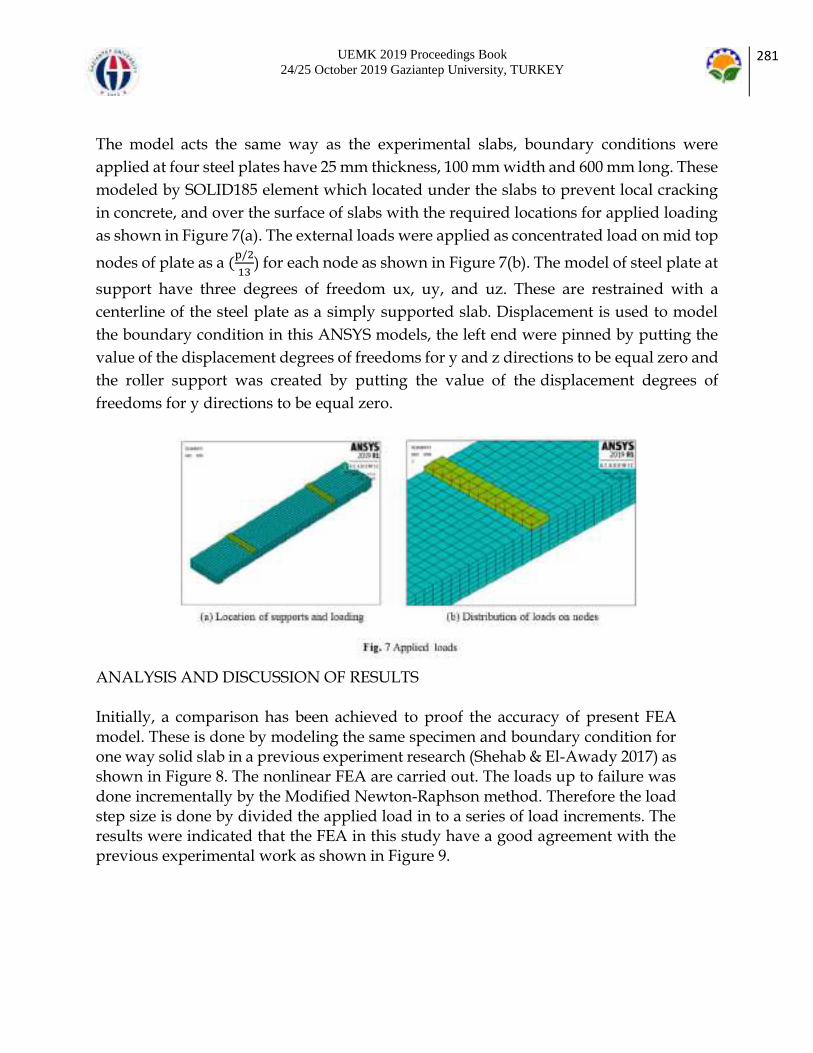
UEMK 2019 Proceedings Book 24/25 October 2019 Gaziantep University, TURKEY
281
The model acts the same way as the experimental slabs, boundary conditions were
applied at four steel plates have 25 mm thickness, 100 mm width and 600 mm long. These
modeled by SOLID185 element which located under the slabs to prevent local cracking
in concrete, and over the surface of slabs with the required locations for applied loading
as shown in Figure 7(a). The external loads were applied as concentrated load on mid top
nodes of plate as a (p/2
13) for each node as shown in Figure 7(b). The model of steel plate at
support have three degrees of freedom ux, uy, and uz. These are restrained with a
centerline of the steel plate as a simply supported slab. Displacement is used to model
the boundary condition in this ANSYS models, the left end were pinned by putting the
value of the displacement degrees of freedoms for y and z directions to be equal zero and
the roller support was created by putting the value of the displacement degrees of
freedoms for y directions to be equal zero.
ANALYSIS AND DISCUSSION OF RESULTS Initially, a comparison has been achieved to proof the accuracy of present FEA model. These is done by modeling the same specimen and boundary condition for one way solid slab in a previous experiment research (Shehab & El-Awady 2017) as shown in Figure 8. The nonlinear FEA are carried out. The loads up to failure was done incrementally by the Modified Newton-Raphson method. Therefore the load step size is done by divided the applied load in to a series of load increments. The results were indicated that the FEA in this study have a good agreement with the previous experimental work as shown in Figure 9.

UEMK 2019 Proceedings Book 24/25 October 2019 Gaziantep University, TURKEY
282
Fig. 8 The cantilever end one way solid reinforced concrete slab (Shehab & El-Awady 2017)
After verifying present FEA model, the flexural behavior, ultimate load carrying capacity, deflection, and cracking for HSC and NSC simple supported one way solid slab investigated in detail. First of all convergence analyses are carried out. The optimum results are obtained when the model have adequate number of elements. This is achieved when an increase in the mesh density cannot cause significant effect on the results as shown in Figure 10. Therefore, in this study can be concluded that the different elements number can be neglected when the number increase from (5040) to (9000), since (50mm) was selected in the modelling of all slabs.

UEMK 2019 Proceedings Book 24/25 October 2019 Gaziantep University, TURKEY
283
Fig. 10 Convergence of results The FEA are repeated for three type of concrete (fc
′ = 34, fc′ = 52, and fc
′ = 70 MPa). The vertical deflection in y direction corresponding to ultimate slab strength is obtained at the center of the mid-span. The main cracks for modeling slabs specimens obvious at middle third as line with width of the slab from bottom face, all slabs exhibited flexural failure as shown in Figure 11. The equivalent normal stresses in longitudinal steel reinforcement was exceed the yielding of 420 N/mm² in all slabs sections as shown in Figure 12. Results are presented in Table 2. The minimum 11.61 kN and maximum 28.37 kN crack loads occurred at the specimens S34-10-1 and S70-6-3 respectively. The cracking load increases when the strength of concrete and reinforcement ratio increase and (a/d) ratio decreases. The similar behavior is observed for peak load. The minimum 5.55 mm and maximum 20.30 mm cracking deflections found at the specimen S52-10-3 and S70-6-1 respectively. It is noted that cracking deflection and peak load deflection decreases when the reinforcement ratio and (a/d) ratio increase. The load of (19.477, 23.85, and 27.6425) kN are caused the first crack in the mid-span location with deflection of (16.3721, 18.4165, 20.306) mm slabs (S34-6-1, S52-6-1, and S70-6-1) respectively. The increasing in applied load resulted in more distributed crack in constant zone of moment. A peak load of (36.95, 38.45, and 41.463) were reached after considerable yielding of stress with deflection of (119.116, 194.687, and 221.895) respectively. The cracking loads, deflection at first crack, ultimate loads and ultimate deflections for slabs in (a/d) ratio equal to 8 and 10 are decreasing in compare with (a/d) ratio equal to 6, with notes that whenever the load increasing the deflection increased also for the same (a/d) ratio and different in concrete strength as shown in Table 2. The failure mode behavior for crack patterns are similar for all groups and shown in specimens up to compression.
0
20
40
60
80
100
120
140
0 2000 4000 6000 8000 10000
mid
-spa
n de
flec
tion
mm
no.of element

UEMK 2019 Proceedings Book 24/25 October 2019 Gaziantep University, TURKEY
284
(a) S70-6-1 (b) S52-10-3
Fig. 11 Crack pattern
(a) S70-6-3 (b) S34-10-1
Fig.12 Equivalent normal stresses in longitudinal steel reinforcement
Specimen Cracking load (kN)
Cracking deflection (mm)
ultimate load (kN)
ultimate deflection (mm)
S34-6-1 19.47 16.37 34.48 129.96
S34-6-2 19.78 11.10 47.98 98.65
S34-6-3 20.10 8.13 64.91 89.65
S52-6-1 23.85 18.41 38.45 194.68
S52-6-2 24.04 12.55 52.84 139.58
S52-6-3 24.35 9.42 68.35 95.42
S70-6-1 27.64 20.30 41.46 221.89
S70-6-2 27.76 13.78 56.06 183.26
S70-6-3 28.37 10.94 71.37 163.60
S34-8-1 14.53 12.01 26.16 106.98
S34-8-2 14.76 8.97 36.36 88.72
S34-8-3 15.26 7.08 47.96 67.42
Table 2 Results of FEA

UEMK 2019 Proceedings Book 24/25 October 2019 Gaziantep University, TURKEY
285
S52-8-1 17.79 14.16 30.99 161.59
S52-8-2 17.99 9.78 41.99 139.39
S52-8-3 18.19 7.35 51.99 82.50
S70-8-1 20.60 16.19 33.40 211.73
S70-8-2 20.76 12.84 45.09 172.74
S70-8-3 21.01 8.52 59.36 154.01
S34-10-1 11.61 9.25 21.21 88.68
S34-10-2 11.85 6.66 28.95 67.91
S34-10-3 12.01 5.53 39.23 56.47
S52-10-1 14.17 11.58 26.42 152.22
S52-10-2 14.37 6.62 31.57 81.37
S52-10-3 14.75 5.55 40.75 73.37
S70-10-1 16.46 11.18 27.96 206.57
S70-10-2 16.78 8.19 36.36 150.68
S70-10-3 16.80 6.58 43.00 68.74
PARAMETRIC STUDY A) Effect of (a/d): The analyzing of reinforced concrete solid slab is carried with different values of shear span to effective depth ratio. Three values of a/d are used as (6, 8, & 10) for normal and high strength concrete and these results are shown in Figure 13 which indicated that the increasing of (a/d) ratio the ultimate load decrease with decrease the deflection for the same reinforcement ratio and concrete strength solid slab.
(a) fc′=34MPa and
reinforcement ratio 0.22 (b) fc
′=52MPa and reinforcement ratio 0.22
(c) fc′=70MPa and
reinforcement ratio 0.22 B) Effect of compressive strength: The concrete slab under (a/d) equal (6, 8, and 10) was selected to investigate the influence of concrete grade on load-deflection behavior curve for the slab. It has been done by using different value of compressive strength as (fc
′ =34, fc′ =52, and fc
′ =70) MPa. The results shown in Figure 14 obtain from these study explained that the increases of concrete stiffness caused increasing in cracking and ultimate loads with increasing the mid-span deflection.
Fig.13 Effect of (a/d) ratio

UEMK 2019 Proceedings Book 24/25 October 2019 Gaziantep University, TURKEY
286
(a) (a/d) ratio = 6 and reinforcement ratio 0.22
(b) (a/d) ratio = 8 and reinforcement ratio 0.22
(c) (a/d) ratio =10 and reinforcement ratio 0.22
C) Effect of steel reinforcement ratio: Three types of steel bar size ø8, ø10, and ø12 are corresponding to reinforcement ratios 0.22, 0.34, and 0.5 respectively. The results shown in Figure 15 explained for the NSC & HSC the ultimate load for slab section was improved against less of deflection in the same (a/d) ratio with the increased of steel reinforcement, while these increasing for different (a/d) ratio are decreased the peak load and deflection.
(a) fc
′ =34MPa (b) fc′ =52MPa (c) fc
′ = 70MPa CONCLUSIONS
The increasing of (a/d) ratio from 6 to 8 and 10 for the same concrete strength and reinforcement ratio lead to decreasing the ultimate load and mid-span deflection.
The longitudinal steel bars at tension zone caused increasing in the peak load and reduction in deflection if the bar size are increasing from ø8 to ø10 and ø12 respectively.
The concrete grade have an influence on cracking, ultimate strength, and deformed shape. The change of concrete properties from normal to high strength results
Fig. 15 Effect of reinforcement ratio
Fig.14 Effect of 𝑓𝑐′

UEMK 2019 Proceedings Book 24/25 October 2019 Gaziantep University, TURKEY
287
in increase the concrete strength and deflection, while the (a/d) and reinforcement ratio are remain constant.
In high strength concrete solid slab the fc′ equal to 70 MPa have more stiff results
if we compared with fc′ equal to 52 MPa.
The FEA with increasing reinforcement ratio (As/Ac) from 0.22 to 0.34 and 0.5 respectively lead to decreasing in ultimate load and deflection for the different (a/d) ratio in RC slab
The cracks for one way solid RC slab commenced at middle third with flexural failure mode.
Maximum ultimate deflection equal 221.89 mm in specimen of (S70-6-1) due to the increase in compressive strength beside minimum steel reinforcement this allow specimen to more deform with ductility more than others. The vice versa with respect to the specimen (S34-10-3) which have the minimum ultimate deflection (56.47mm) REFERENCES ACI318-14 (2014). Building Code Requirements for Structural Concrete (ACI 318-14) and Commentary, Detroit, U.S.A. Al-Azzawi, A. A. & Abed, S. A. (2006). Numerical analysis of reinforced concrete hollow-core slabs. ARPN Journal of Engineering and Applied Sciences, 11(5), 9284=9296. Al-Azzawi, A. A. & Abed, S. A. (2017). Investigation of the behavior of reinforced concrete hollow-core thick slabs. Comput. Concrete, 19(5), 567-577. Al-Shamiri, A. K., Kim, J. H., Yuan, T. F., & Yoon, Y. S. (2019). Modeling the compressive strength of high-strength concrete: An extreme learning approach. Construction and Building Materials, 208, 204-219. Li, Y., & Aoude, H. (2019). Blast response of beams built with high-strength concrete and high-strength ASTM A1035 bars. International Journal of Impact Engineering, 130, 41-67. Mohebi, Z. H., Bahnamiri, A. B., & Dehestani, M. (2019). Effect of polypropylene fibers on bond performance of reinforcing bars in high strength concrete. Construction and Building Materials, 215, 401-409. Mahmoud, A. M. (2015). Finite element implementation of punching shear behaviors in shear-reinforced flat slabs. Ain Shams Engineering Journal, 6(3), 735-754. Qin, R., Zhou, A., & Lau, D. (2017). Effect of reinforcement ratio on the flexural performance of hybrid FRP reinforced concrete beams. Composites Part B: Engineering, 108, 200-209. Sargin, M., Ghosh, S. K., & Handa, V. K. (1971). Effects of lateral reinforcement upon the strength and deformation properties of concrete. Magazine of Concrete Research, 23(75-76), 99-110.

UEMK 2019 Proceedings Book 24/25 October 2019 Gaziantep University, TURKEY
288
Shehab, H. K., Eisa, A. S., & El-Awady, K. A. (2017). Strengthening of cutouts in existing one-way Spanning RC Flat slabs using CFRP sheets. International Journal of Concrete Structures and Materials, 11(2), 327-341.
UEMK 2019 Proceedings Book 24/25 October 2019 Gaziantep University, TURKEY
289
INNOVATIVE AND ENVIRONMENTALLY FRIENDLY TWO DIMENSIONAL MATERIAL: BOROPHENE Hakan ÇELEBİ Aksaray University [email protected] İsmail ŞİMŞEK Aksaray University Tolga BAHADIR Aksaray University Şevket TULUN Aksaray University [email protected] Melayib BİLGİN Aksaray University ABSTRACT: After the discovery of graphene, numerous theoretical and experimental studies have been conducted to explore alternative two-dimensional (2D) materials in both energy and the environment. In these examinations, more efficient than graphene, mechanical, electronic and optical properties are tried to synthesize a variety of two-dimensional materials (silicene, almanen, stanen, phosphorene, arsenene, antimonene and borophen etc.). The main focus of these synthesis studies is not only to discover new materials, but also to integrate these materials into nano-scale applications in different fields and to improve their performance. In addition to developments in the production of new two-dimensional materials recently, there have been exciting developments in borofen synthesis. borofen has various potential applications due to its unique physical and chemical properties. In this review, physicochemical structure of boron, similarity with carbon, synthesis methods are examined with emphasis on the literature. In addition, other materials used, the development process and application areas of borofen (energy and environmental sectors) were evaluated. Keywords: boron; borofen; energy applications; two-dimensional materials YENİLİKÇİ VE ÇEVRE DOSTU İKİ BOYUTLU MALZEME: BOROFEN

UEMK 2019 Proceedings Book 24/25 October 2019 Gaziantep University, TURKEY
290
ÖZET: Grafenin keşfinden sonra, hem enerji hem de çevre alanında alternatif iki boyutlu (2B) materyalleri araştırmaya yönelik çok sayıda teorik ve deneysel çalışma yapılmıştır. Bu incelemelerde, grafenden daha verimli, mekanik, elektronik ve optik özelliklerinin üst seviyede olduğu çeşitli iki boyutlu malzemeler (silisen, almanen, stanen, fosforen, arsenen, antimonen ve borofen gibi) sentezlenmeye çalışılmıştır. Bu sentezleme çalışmalarının ana odağı sadece yeni malzemeleri keşfetmek değil aynı zamanda, bu malzemeleri farklı alanlarda nano ölçekli uygulamalara entegre etmek ve performanslarını artırmakta büyük önem taşımaktadır. Yeni iki boyutlu malzemelerin üretimindeki gelişmelere ek olarak, son zamanlarda borofen sentezi ile ilgili heyecan verici gelişmeler de yaşanmıştır. Borofen eşsiz fiziksel ve kimyasal özellikleri nedeniyle çeşitli potansiyel uygulamalara sahiptir. Bu derlemede, literatürde yapılan çalışmalara vurgu yaparak borun fizikokimyasal yapısı, karbon ile olan benzerliği, sentezleme yöntemleri incelenmiş ayrıca kullanılan diğer materyaller, borofenin gelişim süreci ve uygulama alanları (enerji ve çevre sektörleri) değerlendirilmiştir. Anahtar sözcükler: bor; borofen; enerji uygulamaları; iki boyutlu malzemeler GİRİŞ Grafenin mekanik ve ısı iletimi özelliklerinden dolayı silisen, almanen, fosforen, geçiş metali diklorojenitler, arsenen ve antimonen gibi iki boyutlu malzemeler, son on yılda büyük ölçüde ilgi çekmeye başlamıştır. İki boyutlu (2B) materyaller, dikkate değer ve geniş potansiyel uygulamaları nedeniyle şu anda en ilginç araştırma konuları arasında sayılmaktadır (Ma vd., 2016; Elia vd., 2016; Mortazavi vd., 2016; Ji vd., 2016; Bhimanapati vd., 2015; Zhu vd., 2015). Bu yeni malzeme sınıfına ilgi, başarılı grafen üretiminden ve düzlem biçimindeki karbon atomlarının petek kafesinden kaynaklanmaktadır. Eşsiz fiziksel ve kimyasal özellikleri nedeniyle, 2B malzemeler, elektronik cihazlarda, enerji ve çevre alanında geniş uygulama potansiyeli göstermektedir (Osumi vd., 2016; Larcher & Tarascon, 2015; Raccichini vd., 2015). Bu iki boyutlu (2B) malzemeler, elektronik, fotonik, enerji dönüşümü ve depolama ve biyomedikal teknolojilerde geniş bir uygulama yelpazesinde kullanılan istisnai fiziksel özelliklere sahiptirler. Borofen, grafenin bor atomu analoğudur (Feng vd., 2016; Mannix vd., 2015; Ogitsu vd., 2013). Borun, malzemelerin özelliklerini ayarlamak için yaygın olarak bir katkı maddesi olarak kullanıldığı bilinmektedir. Saf bor, basit düzlemsel moleküller ve kafes benzeri fullerenler oluşturan, karbona belirgin şekilde benzer yapısından dolayı nanomalzeme alanında büyük önem arz etmektedir (Şekil 1). Daha önce yapılan deneysel ve teorik çalışmalar, iki boyutlu (2D) bor tabakalarının, bor atomuna benzer bir atomik yapı ortaya koyduğunu göstermektedir. Bugüne kadar, nano-yapılı bor allotroplarının deneysel araştırmaları, oldukça seyrektir. Bununla birlikte, sayısız teorik çalışma borofeni incelemiştir (Li vd., 2015; Le & Nguyen, 2015; Zhang vd., 2015; Peng vd., 2015; Shirodkar
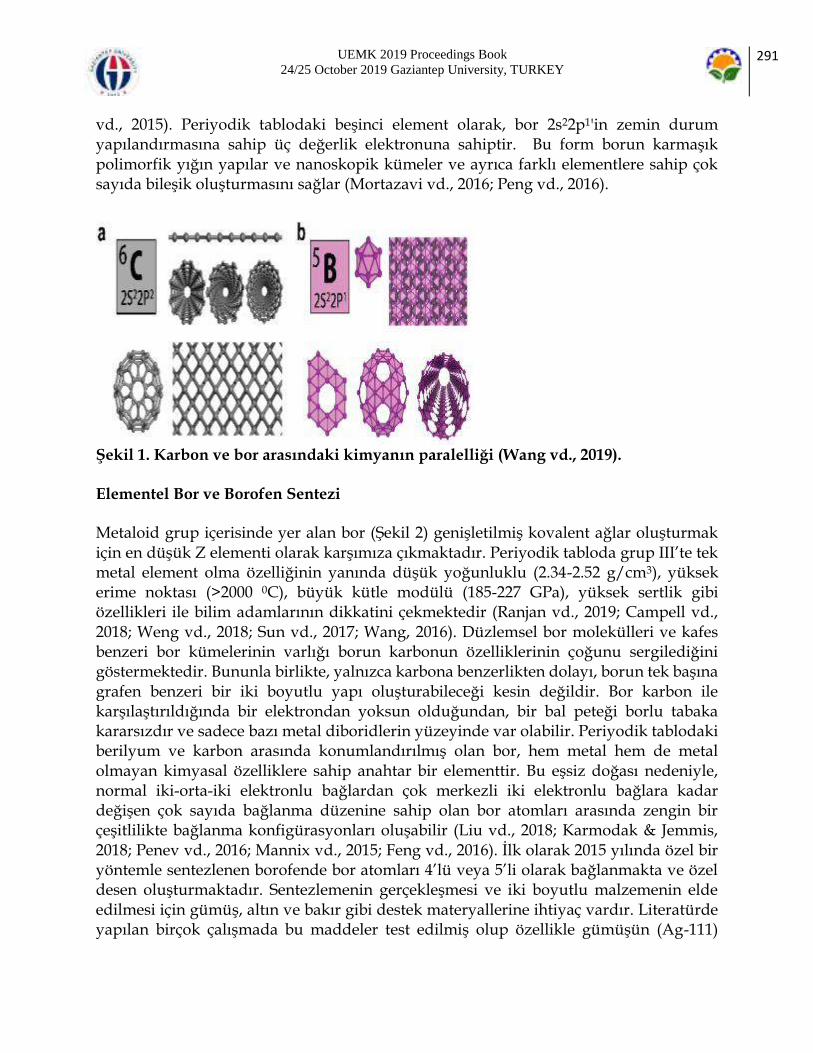
UEMK 2019 Proceedings Book 24/25 October 2019 Gaziantep University, TURKEY
291
vd., 2015). Periyodik tablodaki beşinci element olarak, bor 2s22p1'in zemin durum yapılandırmasına sahip üç değerlik elektronuna sahiptir. Bu form borun karmaşık polimorfik yığın yapılar ve nanoskopik kümeler ve ayrıca farklı elementlere sahip çok sayıda bileşik oluşturmasını sağlar (Mortazavi vd., 2016; Peng vd., 2016).
Şekil 1. Karbon ve bor arasındaki kimyanın paralelliği (Wang vd., 2019). Elementel Bor ve Borofen Sentezi Metaloid grup içerisinde yer alan bor (Şekil 2) genişletilmiş kovalent ağlar oluşturmak için en düşük Z elementi olarak karşımıza çıkmaktadır. Periyodik tabloda grup III’te tek metal element olma özelliğinin yanında düşük yoğunluklu (2.34-2.52 g/cm3), yüksek erime noktası (>2000 0C), büyük kütle modülü (185-227 GPa), yüksek sertlik gibi özellikleri ile bilim adamlarının dikkatini çekmektedir (Ranjan vd., 2019; Campell vd., 2018; Weng vd., 2018; Sun vd., 2017; Wang, 2016). Düzlemsel bor molekülleri ve kafes benzeri bor kümelerinin varlığı borun karbonun özelliklerinin çoğunu sergilediğini göstermektedir. Bununla birlikte, yalnızca karbona benzerlikten dolayı, borun tek başına grafen benzeri bir iki boyutlu yapı oluşturabileceği kesin değildir. Bor karbon ile karşılaştırıldığında bir elektrondan yoksun olduğundan, bir bal peteği borlu tabaka kararsızdır ve sadece bazı metal diboridlerin yüzeyinde var olabilir. Periyodik tablodaki berilyum ve karbon arasında konumlandırılmış olan bor, hem metal hem de metal olmayan kimyasal özelliklere sahip anahtar bir elementtir. Bu eşsiz doğası nedeniyle, normal iki-orta-iki elektronlu bağlardan çok merkezli iki elektronlu bağlara kadar değişen çok sayıda bağlanma düzenine sahip olan bor atomları arasında zengin bir çeşitlilikte bağlanma konfigürasyonları oluşabilir (Liu vd., 2018; Karmodak & Jemmis, 2018; Penev vd., 2016; Mannix vd., 2015; Feng vd., 2016). İlk olarak 2015 yılında özel bir yöntemle sentezlenen borofende bor atomları 4’lü veya 5’li olarak bağlanmakta ve özel desen oluşturmaktadır. Sentezlemenin gerçekleşmesi ve iki boyutlu malzemenin elde edilmesi için gümüş, altın ve bakır gibi destek materyallerine ihtiyaç vardır. Literatürde yapılan birçok çalışmada bu maddeler test edilmiş olup özellikle gümüşün (Ag-111)
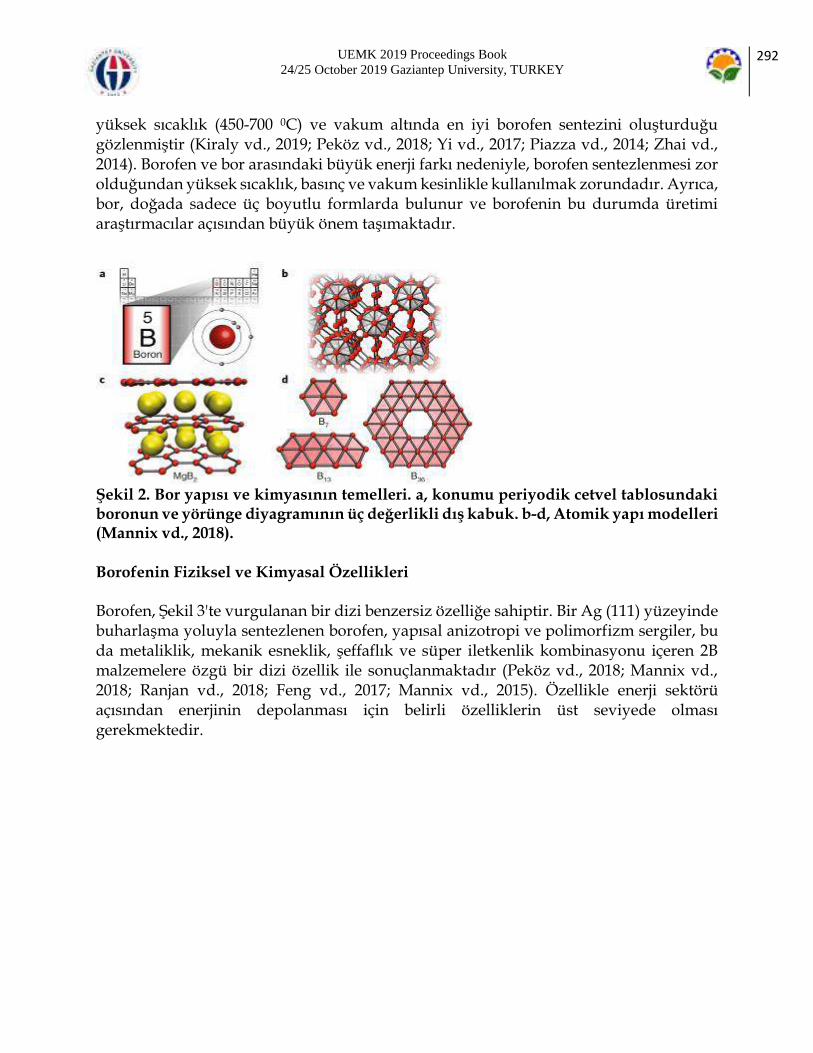
UEMK 2019 Proceedings Book 24/25 October 2019 Gaziantep University, TURKEY
292
yüksek sıcaklık (450-700 0C) ve vakum altında en iyi borofen sentezini oluşturduğu gözlenmiştir (Kiraly vd., 2019; Peköz vd., 2018; Yi vd., 2017; Piazza vd., 2014; Zhai vd., 2014). Borofen ve bor arasındaki büyük enerji farkı nedeniyle, borofen sentezlenmesi zor olduğundan yüksek sıcaklık, basınç ve vakum kesinlikle kullanılmak zorundadır. Ayrıca, bor, doğada sadece üç boyutlu formlarda bulunur ve borofenin bu durumda üretimi araştırmacılar açısından büyük önem taşımaktadır.
Şekil 2. Bor yapısı ve kimyasının temelleri. a, konumu periyodik cetvel tablosundaki boronun ve yörünge diyagramının üç değerlikli dış kabuk. b-d, Atomik yapı modelleri (Mannix vd., 2018). Borofenin Fiziksel ve Kimyasal Özellikleri Borofen, Şekil 3'te vurgulanan bir dizi benzersiz özelliğe sahiptir. Bir Ag (111) yüzeyinde buharlaşma yoluyla sentezlenen borofen, yapısal anizotropi ve polimorfizm sergiler, bu da metaliklik, mekanik esneklik, şeffaflık ve süper iletkenlik kombinasyonu içeren 2B malzemelere özgü bir dizi özellik ile sonuçlanmaktadır (Peköz vd., 2018; Mannix vd., 2018; Ranjan vd., 2018; Feng vd., 2017; Mannix vd., 2015). Özellikle enerji sektörü açısından enerjinin depolanması için belirli özelliklerin üst seviyede olması gerekmektedir.
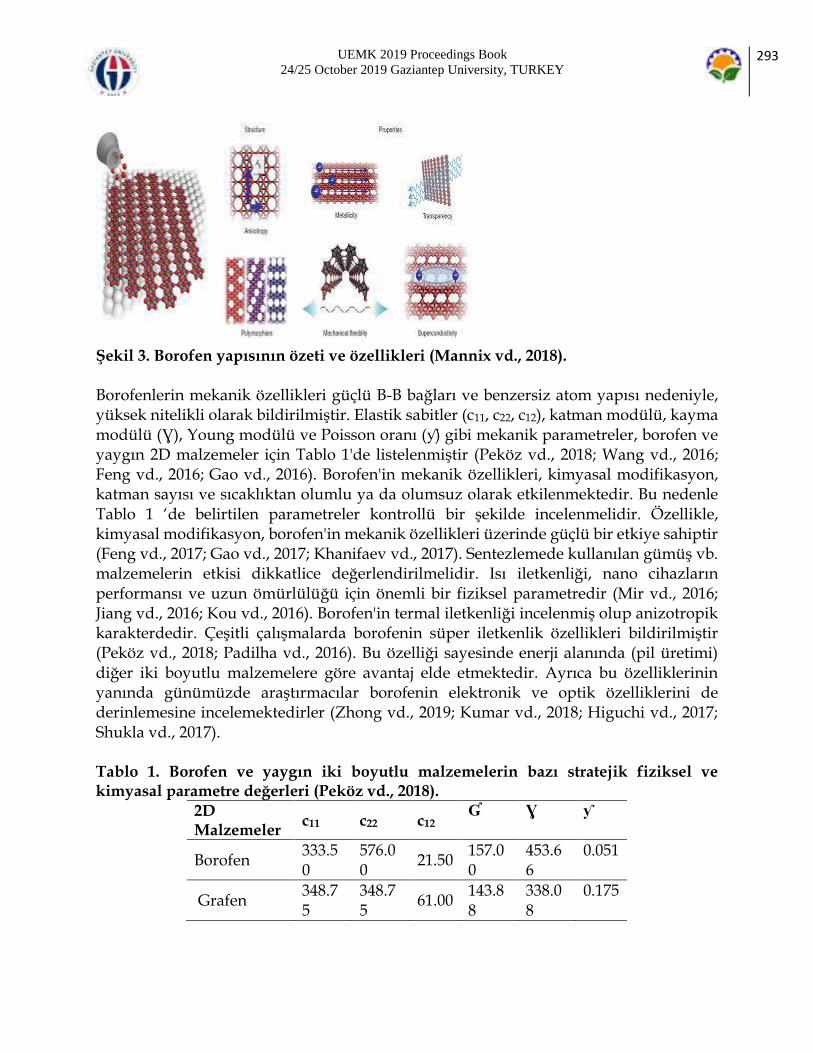
UEMK 2019 Proceedings Book 24/25 October 2019 Gaziantep University, TURKEY
293
Şekil 3. Borofen yapısının özeti ve özellikleri (Mannix vd., 2018). Borofenlerin mekanik özellikleri güçlü B-B bağları ve benzersiz atom yapısı nedeniyle, yüksek nitelikli olarak bildirilmiştir. Elastik sabitler (c11, c22, c12), katman modülü, kayma modülü (Ɣ), Young modülü ve Poisson oranı (ƴ) gibi mekanik parametreler, borofen ve yaygın 2D malzemeler için Tablo 1'de listelenmiştir (Peköz vd., 2018; Wang vd., 2016; Feng vd., 2016; Gao vd., 2016). Borofen'in mekanik özellikleri, kimyasal modifikasyon, katman sayısı ve sıcaklıktan olumlu ya da olumsuz olarak etkilenmektedir. Bu nedenle Tablo 1 ‘de belirtilen parametreler kontrollü bir şekilde incelenmelidir. Özellikle, kimyasal modifikasyon, borofen'in mekanik özellikleri üzerinde güçlü bir etkiye sahiptir (Feng vd., 2017; Gao vd., 2017; Khanifaev vd., 2017). Sentezlemede kullanılan gümüş vb. malzemelerin etkisi dikkatlice değerlendirilmelidir. Isı iletkenliği, nano cihazların performansı ve uzun ömürlülüğü için önemli bir fiziksel parametredir (Mir vd., 2016; Jiang vd., 2016; Kou vd., 2016). Borofen'in termal iletkenliği incelenmiş olup anizotropik karakterdedir. Çeşitli çalışmalarda borofenin süper iletkenlik özellikleri bildirilmiştir (Peköz vd., 2018; Padilha vd., 2016). Bu özelliği sayesinde enerji alanında (pil üretimi) diğer iki boyutlu malzemelere göre avantaj elde etmektedir. Ayrıca bu özelliklerinin yanında günümüzde araştırmacılar borofenin elektronik ve optik özelliklerini de derinlemesine incelemektedirler (Zhong vd., 2019; Kumar vd., 2018; Higuchi vd., 2017; Shukla vd., 2017). Tablo 1. Borofen ve yaygın iki boyutlu malzemelerin bazı stratejik fiziksel ve kimyasal parametre değerleri (Peköz vd., 2018).
2D Malzemeler
c11 c22 c12 Ɠ Ɣ ƴ
Borofen 333.50
576.00
21.50 157.00
453.66
0.051
Grafen 348.75
348.75
61.00 143.88
338.08
0.175

UEMK 2019 Proceedings Book 24/25 October 2019 Gaziantep University, TURKEY
294
Fosforen 186.80
44.61 31.23 41.82 103.6
4 0.434
Silisen 68.30 68.30 23.30 22.50 60.60 0.341
Germanen 46.40 46.10 13.10 16.70 42.70 0.282
Borofenin Uygulama Alanları Borofenin enerji ve arıtma malzemesi olarak uygulanması son yıllarda büyük önem kazanmış olup özellikle yenilenebilir enerji alanında aktif olarak değerlendirilmektedir. Borofen grafenden daha esnek daha güçlü olmasıyla öne çıkmaktadır. Oldukça hafif ve reaktif niteliktedir. Böylece elektron depolamak gibi işlemlerde kullanıma elverişlidir. Bu durum ise borofeni lityum, sodyum, potasyum, aliminyum ve magnezyum iyon bataryaları için oldukça işlevli bir anot haline getirmektedir (Chen vd., 2018; Jiang vd., 2018; Zhao vd., 2016). Ayrıca yüksek yüzey aktivitesi ve diğer malzemelerden daha hafif olmasından dolayı umut verici bir elektrot kaynağı ve süper bir kapasitör olmaktadır (Kumar vd., 2018; Mannix vd., 2018; Kondo, 2017). En hafif 2D malzeme olan borofen aynı zamanda hidrojen yakalama ve tutma açısından en iyi materyal olarak dikkat çekmektedir. Ağırlığının %15’ine kadar hidrojen tutabilen nitelikte olup katalizör olarak da kullanılmakta ve bu sayede hidrojen atomlarının hidrojen iyonlarına dönüşmesini sağlamaktadır (Wang vd., 2019). Bu durum ise su tabanlı enerji sistemleri için yeni bir uygulama teknolojisidir. Hidrojen depolama ile ilgili birçok çalışmada borofen incelenmiştir. Borofen, sensör sektöründe de geniş bir uygulama potansiyeli göstermektedir (Mannix vd., 2018; Shukla vd., 2017; Peng vd., 2017). Borofen'in etanol, formaldehit ve hidrojen siyanür tespiti için bir sensör olarak kullanılabileceği çeşitli çalışmalarda bildirilmiştir. Bazı metallerin (Li, Na, K, Ca, Mg, Al) borofen üzerindeki adsorpsiyon yetenekleri ile ilgili yapılan çalışmalarda başarılı sonuçlar elde edilmiştir (Şekil 4) (Zhang & Cheng, 2019; Rao vd., 2017). Bu sonuçlar ışığında çevre kirliliğinde büyük yer tutan su ortamlarındaki ağır metallerin ve diğer kirletici gruplarının adsorpsiyon yöntemi ile arıtımında borofen yeni bir adsorbent malzeme olarak karşımıza çıkmaktadır. Su sektöründe hem arıtım hem de içme suyu kalitesi açısından günümüzde kullanılan klasik membran reaktörlerin dizaynında da grafen, borofen gibi iki boyutlu malzemeler kullanılarak daha fazla verim ve kaliteli su elde edilebilir.
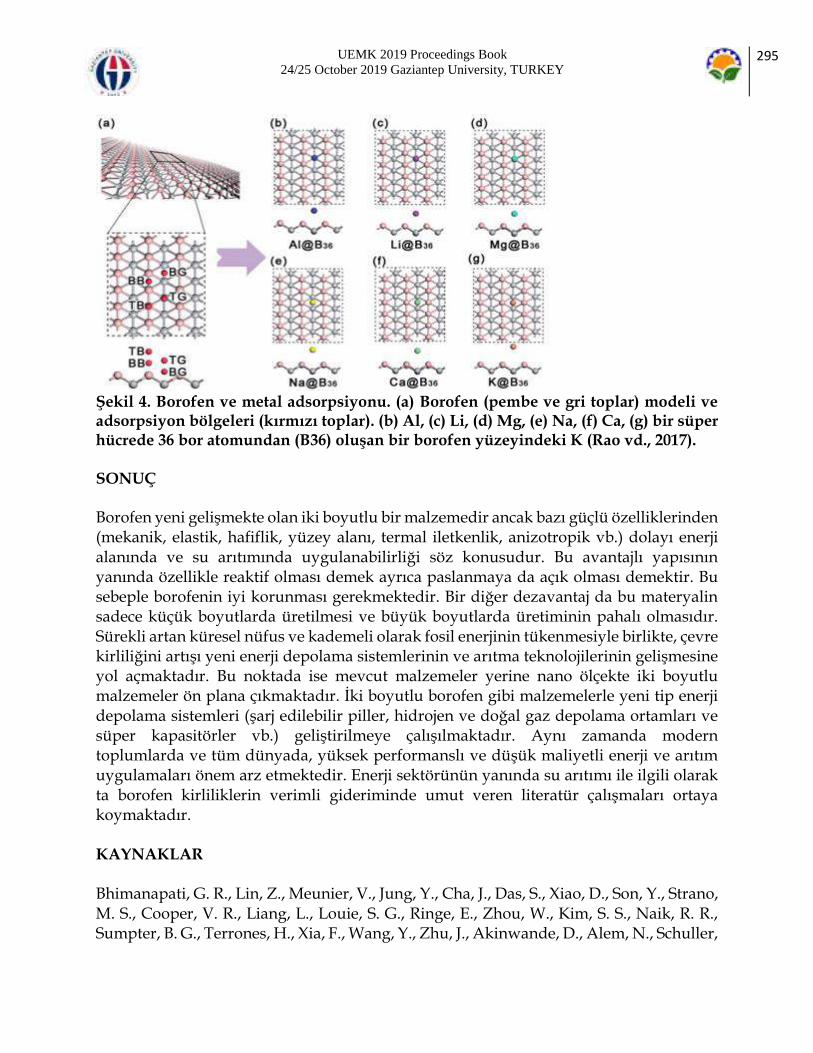
UEMK 2019 Proceedings Book 24/25 October 2019 Gaziantep University, TURKEY
295
Şekil 4. Borofen ve metal adsorpsiyonu. (a) Borofen (pembe ve gri toplar) modeli ve adsorpsiyon bölgeleri (kırmızı toplar). (b) Al, (c) Li, (d) Mg, (e) Na, (f) Ca, (g) bir süper hücrede 36 bor atomundan (B36) oluşan bir borofen yüzeyindeki K (Rao vd., 2017). SONUÇ Borofen yeni gelişmekte olan iki boyutlu bir malzemedir ancak bazı güçlü özelliklerinden (mekanik, elastik, hafiflik, yüzey alanı, termal iletkenlik, anizotropik vb.) dolayı enerji alanında ve su arıtımında uygulanabilirliği söz konusudur. Bu avantajlı yapısının yanında özellikle reaktif olması demek ayrıca paslanmaya da açık olması demektir. Bu sebeple borofenin iyi korunması gerekmektedir. Bir diğer dezavantaj da bu materyalin sadece küçük boyutlarda üretilmesi ve büyük boyutlarda üretiminin pahalı olmasıdır. Sürekli artan küresel nüfus ve kademeli olarak fosil enerjinin tükenmesiyle birlikte, çevre kirliliğini artışı yeni enerji depolama sistemlerinin ve arıtma teknolojilerinin gelişmesine yol açmaktadır. Bu noktada ise mevcut malzemeler yerine nano ölçekte iki boyutlu malzemeler ön plana çıkmaktadır. İki boyutlu borofen gibi malzemelerle yeni tip enerji depolama sistemleri (şarj edilebilir piller, hidrojen ve doğal gaz depolama ortamları ve süper kapasitörler vb.) geliştirilmeye çalışılmaktadır. Aynı zamanda modern toplumlarda ve tüm dünyada, yüksek performanslı ve düşük maliyetli enerji ve arıtım uygulamaları önem arz etmektedir. Enerji sektörünün yanında su arıtımı ile ilgili olarak ta borofen kirliliklerin verimli gideriminde umut veren literatür çalışmaları ortaya koymaktadır. KAYNAKLAR Bhimanapati, G. R., Lin, Z., Meunier, V., Jung, Y., Cha, J., Das, S., Xiao, D., Son, Y., Strano, M. S., Cooper, V. R., Liang, L., Louie, S. G., Ringe, E., Zhou, W., Kim, S. S., Naik, R. R., Sumpter, B. G., Terrones, H., Xia, F., Wang, Y., Zhu, J., Akinwande, D., Alem, N., Schuller,

UEMK 2019 Proceedings Book 24/25 October 2019 Gaziantep University, TURKEY
296
J. A., Schaak, R. E., Terrones, M., Robinson, J. A. (2015). Recent advances in two-dimensional materials beyond graphene. ACS Nano, 9, 11509-11539. Campbell, G. P., Mannix, A. J., Emery, J. D., Lee, T. L., Guisinger, N. P., Hersam, M. C., Bedzyk, M. J. (2018). Resolving the chemically discrete structure of synthetic borophene polymorphs. Nano Letters, 18, 2816-2821. Chen, X., Shen, X., Li, B., Peng, H. J., Cheng, X. B., Li, B. Q., Zhang, X. Q., Huang, J. Q., Zhang, Q. (2018). Ion-solvent complexes promote gas evolution from electrolytes on a sodium metal anode. Angewandte Chemie International Edition, 57, 734-737. Elia, G. A., Marquardt, K., Hoeppner, K., Fantini, S., Lin, R., Knipping, E., Peters, W., Drillet, J. F., Passerini, S., Hahn, R. (2016). An overview and future perspectives of aluminum batteries. Advanced Materials, 28, 7564-7579. Feng, B., Sugino, O., Liu, R. Y., Zhang, J., Yukawa, R., Kawamura, M., Limori, T., Kim, H., Hasegawa, Y., Li, H., Chen, L., Wu, K., Kumigashira, H., Komori, F., Chiang, T. C., Meng, S., Matsuda, I. (2017). Dirac fermions in borophene. Physical Review Letters, 118, 096401. Feng, B., Zhang, J., Zhong, Q., Li, W., Li, S., Li, H., Cheng, P., Meng, S., Chen, L., Wu, K. (2016). Experimental realization of two-dimensional boron sheets. Nature Chemistry, 8, 563-568. Gao, M., Li, Q. Z., Yan, X. W., Wang, J. (2017). Prediction of phononmediated superconductivity in borophene. Physical Review B, 95, 024505. Higuchi, T., Heide, C., Ullmann, K., Weber, H. B., Hommelhoff, P. (2017). Light-field-driven currents in graphene. Nature, 550, 224-228. Ji, J., Song, X., Liu, J., Yan, Z., Huo, C., Zhang, S., Su, M., Liao, L., Wang, W., Ni, Z., Hao, Y., Zeng, H. (2016). Two-dimensional antimonene single crystals grown by van der waals epitaxy. Nature Communications, 7, 13352. Jiang, H. R., Lu, Z., Wu, M. C., Ciucci, F., Zhao, T. S. (2016). Borophene: a promising anode material offering high specific capacity and high rate capability for lithium-ion batteries. Nano Energy, 23, 97-104. Jiang, N., Li, B., Ning, F., Xia, D. (2018). All boron-based 2D material as anode material in Li-ion batteries. Journal of Energy Chemistry, 27, 1651-1654. Karmodak, N., & Jemmis, E. D. (2018). Metal templates and boron sources controlling borophene structures: An Ab initio study. Journal of Physical Chemistry,122, 2268-2274. Khanifaev, J., Pekoz, R., Konuk, M., Durgun, E. (2017). The interaction of halogen atoms and molecules with borophene. Physical Chemistry Chemical Physics, 19, 28963-28969. Kiraly, B., Liu, X., Wang, L., Zhang, Z., Mannix, A. J., Fisher, B. L., Yakobson, B. I., Hersam, M. C., Guisinger, N. P. (2019). Borophene synthesis on Au(111). ACS Nano, 13, 3816-3822. Kondo, T. (2017). Recent progress in boron nanomaterials. Science and Technology of Advanced Materials, 18, 780-804. Kou, L., Ma, Y., Tang, C., Sun, Z., Du, A., Chen, C. (2016). Auxetic and ferroelastic borophane: a novel 2D material with negative possion’s ratio and switchable dirac transport channels. Nano Letters, 16, 7910-7914.
UEMK 2019 Proceedings Book 24/25 October 2019 Gaziantep University, TURKEY
297
Kumar, K. S., Choudhary, N., Jung, Y., Thomas, J. (2018). Recent advances in two-dimensional nanomaterials for supercapacitor electrode applications. ACS Energy Letters, 3, 482-495. Larcher, D., & Tarascon, J. M. (2015). Towards greener and more sustainable batteries for electrical energy storage. Nature Chemistry, 7, 19-29. Le, M. Q., & Nguyen, D. T. (2015). The role of defects in the tensile properties of silicene. Applied Physics A, 118, 1437-1445. Li, X. B., Xie, S. Y., Zheng, H., Tian, W. Q., Sun, H. B. (2015). Boron based two-dimensional crystals: theoretical design, realization proposal and applications. Nanoscale, 7, 18863-18871. Liu, X., Zhang, Z., Wang, L., Yakobson, B. I., Hersam, M. C. (2018). Intermixing and periodic self-assembly of borophene line defects. Nature Materials, 17, 783-788. Ma, F., Jiao, Y., Gao, G., Gu, Y., Bilic, A., Chen, Z., Du, A. (2016). Graphene-like two-dimensional ionic boron with double dirac cones at ambient condition. Nano Letters, 16, 3022-3028. Mannix, A. J., Zhang, Z., Guisinger, N. P., Yakobson, B. I., Hersam, M. C. (2018). Borophene as a prototype for synthetic 2D materials development. Nature Nanotechnology, 13, 444-450. Mannix, A. J., Zhou, X. F., Kraly, B., Wood, J. D., Alducin, D., Myers, B. D., Liu, X., Fisher, B. L., Santiago, U., Guest, J. R., Yacaman, M. J., Ponce, A., Oganov, A. R., Hersam, M. C., Guisinger, N. P. (2015). Synthesis of borophenes: anisotropic, two-dimensional boron polymorphs. Science, 350, 1513-1516. Mir, S. H., Chakraborty, S., Jha, P. C., Warna, J., Soni, H., Jha, P. K., Ahuja, R. (2016). Two-dimensional boron: lightest catalyst for hydrogen and oxygen evolution reaction. Applied Physics Letters, 109, 053903. Mortazavi, B., Fan, Z., Pereira, L. F. C., Harju, A., Rabczuk, T. (2016). Amorphized graphene: A stiff material with low thermal conductivity. Carbon, 103, 318-326. Mortazavi, B., Rahaman, O., Dianat, A., Rabzcuk, T. (2016). Mechanical responses of borophene sheets: a first-principles study. Physical Chemistry Chemical Physics, 18, 27405-27413. Ogitsu, T., Schwegler, E., Galli, G. (2013). Bernstein, M. (2002). At the crossroads of the chemistry of boron and the physics of frustration. Chemical Reviews, 113, 3425-3449. Osumi, S., Saito, S., Dou, C., Matsuo, K., Kume, K., Yoshikawa, H., Awaga, K., Yamaguchi, S. (2016). Boron-doped nanographene: Lewis acidity, redox properties, and battery electrode performance. Chemical Scinece, 7, 219-227. Padilha, J. E.; Miwa, R. H.; Fazzio, A. (2016). Directional Dependence of the Electronic and Transport Properties of 2D Borophene and Borophane. Physical Chemistry Chemical Physics, 18, 25491-25496. Peköz, R., Konuk, M., Kilic, M. E., Durgun, E. (2018). Two-dimensional fluorinated boron sheets: mechanical, electronic, and thermal properties. ACS Omega, 3, 1815-1822. Penev, E. S., Kutana, A., Yakobson, B. I. (2016). Can two-dimensional boron superconduct. Nano Letters, 16, 2522-2526.
UEMK 2019 Proceedings Book 24/25 October 2019 Gaziantep University, TURKEY
298
Peng, B., Zhang, H., Shao, H., Ning, Z., Xu, Y., Ni, G., Lu, H., Zhang, D. W., Zhu, H. (2017). Stability and strength of atomically thin borophene from first principles calculations. Materials Research Letters, 5, 399-407. Peng, B., Zhang, H., Shao, H., Xu, Y., Zhang, R., Zhu, H. (2016). The electronic, optical, and thermodynamic properties of borophene from first-principles calculations. Journal of Materials Chemistry C, 4, 3592-3598. Peng, Q., Han, L., Wen, X., Liu, S., Chen, Z., Lian, J., De, S. (2015). Mechanical properties and stabilities of a-boron monolayers. Physical Chemistry Chemical Physics, 17, 2160-2168. Piazza, Z. A., Hu, H. S., Li, W. L., Zhao, Y. F., Li, J. (2014). Planar hexagonal B36 as a potential basis for extended single-atom layer boron sheets. Nature Communications, 5, 3113. Raccichini, R., Varzi, A., Passerini, S., Scrosati, B. (2015). The role of graphene for electrochemical energy storage. Nature Materials, 14, 271-279. Ranjan, P., Agrawal, S., Sinha, A., Rao, T. R., Balakrishnan, J., Thakur, A. D. (2018). A low-cost non-explosive synthesis of graphene oxide for scalable applications. Scientific Reports, 8, 12007. Ranjan, P., Sahu, T. K., Bhushan, R., Yamijala, S. SRKC., Late, D. J., Kumar, P., Vinu, A. (2019). Freestanding borophene and its hybrids. Advanced Materials, 31, 1900353. Rao, D., Zhang, L., Meng, Z., Zhang, X., Wang, Y., Qiao, G., Shen, X., Xia, H., Liu, J., Lu, R. (2017). Ultrahigh energy storage and ultrafast ion diffusion in borophene-based anodes for rechargeable metal ion batteries. Journal of Materials Chemistry A, 5, 2328-2338. Shirodkar, S. N., Waghmare, U. V., Fisher, T. S., Grao-Crespo, R. (2015). Engineering the electronic bandgaps and band edge positions in carbon-substituted 2D boron nitride: a first-principles investigation. Physical Chemistry Chemical Physics, 17, 13547-13552. Shukla, V., Warna, J., Jena, N. K., Grigoriev, A., Ahuja, R. (2017). Toward the realization of 2D borophene based gas sensor. The Journal of Physical Chemistry, 121, 26869-26876. Sun, X., Liu, X., Yin, J., Yu, J., Li, Y., Hang, Y., Zhou, X., Yu, M., Li, J., Tai, G., Guo, W. (2017). Two-dimensional boron crystals: structural stability, tunable properties, fabrications and applications. Advanced Functional Materials, 27, 1-22. Wang, H., Li, Q., Gao, Y., Miao, F., Zhou, X. F., Wan, G. (2016). Strain effects on borophene: ideal strength, negative Possion’s ratio and phonon instability. New Journal of Physics, 18, 73016. Wang, L.S. (2016). Photoelectron spectroscopy of size-selected boron clusters: from planar structures to borophenes and borospherenes. International Reviews Physical Chemistry, 35, 69-142. Wang, Z. Q., Lü, T. Y., Wang, H. Q., Feng, Y. P., Zheng, J. C. (2019). Review of borophene and its potential applications. Frontiers Physics, 14, 33403. Weng, Q., Li, G., Feng, X., Nielsch, K., Golberg, D., Schmidt, O. G. (2018). Electronic and optical properties of 2D materials constructed from light atoms. Advanced Materials, 30, 1801600.

UEMK 2019 Proceedings Book 24/25 October 2019 Gaziantep University, TURKEY
299
Yi, W. C., Liu, W., Botana, J., Zhao, L., Liu, Z., Liu, J. Y., Miao, M. S. (2017). Honeycomb boron allotropes with dirac cones: a true analogue to graphene. Journal of Physical Chemistry Letters, 8, 2647. Zhai, H. J., Zhao, Y. F., Li, W. L., Chen, Q., Bai, H., Hu, H. S., Piazza, Z. A., Tian, W. J., Lu, H. G., Wu, Y. B., Mu, Y. W., Wei, G. F., Liu, Z. P., Li, J., Li, S. D. (2014). Observation of an all-boron fullerene. Nature Chemistry, 6, 727-731. Zhang, Y., & Cheng, X. (2019). Hydrogen adsorption property of Na-decorated boron monolayer: a first principles investigation. Physica E: Low-dimensional Systems and Nanostructures, 107, 170-176. Zhang, Z., Yang, Y., Gao, G., Yakobson, B. I. (2015). Two-dimensional boron monolayers mediated by metal substrates. Angewandte Chemie International Edition, 54, 13022-13026. Zhao, T., Wang, Q., Jena, P. (2016). Cluster-inspired design of high-capacity anode for Li-ion batteries. ACS Energy Letters, 1, 202-208. Zhong, C., Wu, W., He, J., Ding, G., Liu, Y., Li, D., Yang, S. A., Zhang, G. (2019). Two-dimensional honeycomb borophene oxide: strong anisotropy and nodal loop transformation. Nanoscale, 11, 2468. Zhu, F. f., Chen, W. j., Xu, Y., Gao, C. l., Guan, D. d., Liu, C. h., Qian, D., Zhang, S. C., Jia, J. f. (2015). Epitaxial growth of two-dimensional stanene. Nature Materials, 10, 1020-1025.

UEMK 2019 Proceedings Book 24/25 October 2019 Gaziantep University, TURKEY
300
THE ROLE OF SAFETY CONCERN AND NUTRITIONAL
QUALITY IN ORGANIC FOOD
Chi-Ching LEE
İstanbul Sabahattin Zaim University,The Faculty of Engineering and Natural Sciences, The Department of Food Engineering, Halkalı Cad. No: 2 Halkalı, Küçükçekmece, İstanbul 34303, Turkey [email protected] ABSTRACT: Global consumption and market of organic food products are boosting significantly over the past several decades. According to previous studies, the reasons include of the concern of the quality and safety in conventional food products, the development of health consciousness, the awareness of contamination in the food chain and environment, animal welfare and ethical motives, and personal life values. Organic agriculture is well-defined in the regulation of the European Union, the United States, Australia, Japan, and other many countries. Based on the definition of UN Food and Agriculture Organization (FAO), the main characteristics of organic agriculture are production of high nutritional quality foodstuffs in sufficient quantity, promotion of animal respect and natural cyclic systems, no use of chemical fertilizers/ pesticide/ herbicide, maintenance of environmental sustainability, and avoidance of genetically modified (GM) crops. The aim of this study is to evaluate and compare the nutritional value of organic and conventional food. Moreover, the toxicological and microbiological data will be reviewed including contamination of pathogenic microorganisms, phytochemicals, and mycotoxins. For the nutritional quality of organic food, they contain more polyunsaturated acid, more minerals like iron magnesium, and more antioxidants such as phenolic compounds and salicylic acid than the conventional produce. For animal products, organic beef contains more lean meat than conventional counterparts. For food safety concern, the contamination of pathogenic microorganisms and mycotoxins is no significant difference between organic and conventional foodstuffs. The phytochemical residue was not detected among more than 94% of organic food. However, 41% of usual food products were examined to have chemical contaminants. In summary, organic farming systems showed the capacity to provide foods with high quality standards. I recommend that the global organic agriculture should be developed and improved continuously to accomplish sustainable food production for the benefit of all mankind. Keywords: organic food, nutritional quality, food safety, contaminants.
UEMK 2019 Proceedings Book 24/25 October 2019 Gaziantep University, TURKEY
301
DETECTION OF SCHIZOPHRENIA ON EEG SIGNALS BY
USING RELATIVE WAVELET ENERGY AS A FEATURE
EXTRACTOR
Zülfikar ASLAN Fen Bilimleri Enstitüsü, Dicle Üniversitesi, Diyarbakır, Türkiye [email protected] Mehmet AKIN Elektrik-Elektronik Mühendisliği, Mühendislik Fakültesi, Dicle Üniversitesi, Diyarbakır [email protected] ABSTRACT: Detecting diseases by use of EEG signals has been a widely used technique in the literature and still one of the most prominent research topics. In this study, feature extraction is done by using Relative Wavelet Energy method on EEG recordings of healthy samples and schizophrenia patients in order to investigate performance of the method on detecting the schizophrenia disease. In the first step, low band components of the signal are obtained by using wavelet transformation. Then, Relative Wavelet Energy method is applied to each of these bands in order to extract features. These features are fed to the K-Nearest Neighbors (KNN) algorithm to evaluate the classification performance. As a result, extracted features helped the classifier to classify with a performance of nearly 90% accuracy. Key words: Wavelet, Relative Wavelet Energy, Schizophrenia, Knn EEG SİNYALLERİNDE GÖRECELİ DALGACIK ENERJİSİ YÖNTEMİYLE ÖZELLİK ÇIKARIMI YAPILARAK ŞİZOFRENİ TESPİTİ ÖZET: EEG sinyalleri üzerinden hastalık tespiti literatürde pek çok uygulama alanı bulmuş ve halen önemini koruyan konulardan birisidir. Bu çalışmada, şizofreni hastası ve sağlıklı bireylere ait EEG sinyalleri üzerinde göreceli dalgacık enerjisi yöntemiyle özellik çıkarımı yapılarak şizofreni tespitindeki başarımı gözlemlenmiştir. İlk olarak sinyal öncelikle dalgacık dönüşümü uygulanarak sinyalin alt bant bileşenleri elde edilmiştir. Sonrasında elde edilen bu alt bant bileşenlerine göreceli dalgacık dönüşümü enerjisi yöntemi uygulanarak özellik çıkarımları yapılmıştır. Elde edilen özellik değerleri knn (en yakın k komşu) sınıflandırma algoritması kullanılarak başarımları

UEMK 2019 Proceedings Book 24/25 October 2019 Gaziantep University, TURKEY
302
değerlendirilmiştir. Sonuç olarak elde edilen özellik çıkarımları ile 90% civarında başarı elde edildiği gözlemlenmiştir. Anahtar sözcükler: Dalgacık Dönüşümü, Göreceli Dalgacık Dönüşümü Enerjisi, Şizofreni, En yakın k komşu GİRİŞ Şizofreni, belirli beyin sistemleri ve fonksiyonlarından ziyade, beyindeki psişik aktiviteyi bozan bir hastalıktır. Araştırmacılar uzun zamandır şizofreninin insan beyni üzerindeki değişimleri ile ilgilenmektedir. İnsan beynindeki histolojik ve fizyolojik değişiklikler hakkında önemli veriler bilgiler elde etmişlerdir. Şizofreninin farklı evrelerinde beynin farklı kısımları arasındaki ilişkilerin olduğunu tespit etmişlerdir(Lewis and Gonzalez-Burgos 2000; Selemon and Goldman-Rakic 1999). Şizofreni, nüfusun % 1'inin yaşadığı zihinsel bir hastalıktır. Amerikan Psikiyatri Birliği'nin (American Psychiatric Association 1994; WHO 2011) tanı kriterlerine göre, hastalar yanılgı, halüsinasyonlar veya düzensiz konuşma gibi bazı karakteristik semptomlar göstermektedir. Şizofrenik hastaların EEG sinyallerinin analizi literatürde de önemli bir yer bulmuştur. Bazı araştırmalarda (Jeong et al. 1998; Shao, Fan, and Li 2007), iki şizofrenik hasta grubunun ve kontrol katılımcılarının EEG sinyallerine doğrusal olmayan yöntemler uygulanmıştır. İki grup arasındaki sonuçlar, dinamik süreçte farklılıklar göstermiştir. Hornero ve diğ. (Hornero et al. 2006) katılımcılardan zaman serileri oluşturmak için rastgele boşluk tuşuna basmalarını istemişlerdir. Elde edilen sonuçlar şizofrenik hastalar tarafından oluşturulan zaman serilerinin kontrol grubuna göre daha düşük bir karmaşıklığa sahip olduğunu göstermiştir. İlginç bir testte, rasgele sayı üretimi için (Rosenberg et al. 1990), katılımcılardan birkaç kez 1'den 10'a kadar bir sayı seçmeleri istenmiştir. Sayıların üretiminin bir kuraldan yoksun olması, yani mümkün olduğunca rastgele olması gerekiyordu. Bu yapılan çalışmada şizofreni hastalarının tekrarlı olmaya meyilli olduklarını buldular. Pressman ve diğ. (Pressman, A., Peled, A., & Geva 2000) şizofreni hastalarında çalışma belleği görevi sırasında senkronizasyon değişim yeteneği olmadığını gösterdiler. Böylece beyin aktivitesinde, özellikle frontal ve temporal kanallarda bir fark olduğunu belirtmişlerdir. Cherif ve diğ. (Cherif et al. 2004) şizofreni hastalarının sağlıklı katılımcılarla karşılaştırıldığında gözünü tek bir yerde tutma görevlerinde anormallik gösterdiklerini belirtmişlerdir. Gaser ve diğ. (Gaser et al. 1999) şizofrenik hastalarda yapısal beyin değişikliklerini tasvir etmişlerdir. Ayrıca, Keil ve ark. (Keil et al. 1998) şizofrenik hastalarda ritmik parmak salınımları göstermişlerdir. Paulus ve diğ. (Paulus, Geyer, and Braff 1999) , şizofreni ve kontrol grubu olan hastalarda ikili yanıt elde etmek için bir uyaranın 500 rasgele sağ veya sol görünüşünü öngörmekten oluşan basit bir seçim görevi

UEMK 2019 Proceedings Book 24/25 October 2019 Gaziantep University, TURKEY
303
gerçekleştirmiştir. Karşılıklı ve çaprak karşılıklı olarak bilgi uyguladıktan sonra, hastalar tarafından oluşturulan yanıt dizilerinin kontrol grubundakilerden daha yüksek derecede bir bağımlılık gösterdiğini göstermişlerdir. Sabeti ve diğ. (Sabeti et al. 2007) şizofrenik ve sağlıklı kişilerden elde edilen EEG sinyallerine PCA tabanlı özellik çıkarım yaptıktan sonra, elde edilen özellik değerlerini sınıflandırmışlardır. Borisov ve diğ. (Borisov et al. 2005) 39 sağlıklı ve 45 şizofreni hastası olmak üzere 84 genç bireyden alınan EEG sinyallerini, kafa derisindeki yerleşim yerlerine göre kategorize etmiş ve ilgili kanallardan alınan sinyallerden özellik çıkarım yaparak sınıflandırma işlemi uygulamıştır. Kategorize edilmiş kanalların sınıflandırma başarımları karşılaştırılmıştır. Bu çalışmada öncelikle elimizde bulunan sağlıklı ve şizofreni hastası bireylere ait EEG kayıtları öncelikle dalgacık dönüşü ile alt bant kanallarına ayrılmış sonrasında ise bu alt bant kanallarına göreceli dalgacık dönüşümü enerjisi yöntemi uygulanarak özellik çıkarımları yapılmıştır. Farklı Daubechies türünde (dB2, dB6 gibi) dalgacık dönüşümü yapılarak en iyi başarım sonucunu veren özellikler elde edilmiştir. Elde edilen bu alt bant kanallarına göreceli dalgacık dönüşüm enerjisi yöntemi uygulanarak özellik çıkarımları yapılmıştır. Elde edilen özellik değerleri en yakın k komşu sınıflandırma algoritması ile sınıflandırılmıştır. Farklı n değerleri için sonuçlar değerlendirilmiş ve en iyi başarım olarak 90% civarında başarım elde edilmiştir. Veri Seti Bu çalışmada kullanılan şizofreni hastalığını içeren EEG kayıtları, benzer şizofrenik bozukluğa sahip 45 çocuğa aittir. Tüm hastaların tanıları Ruh Sağlığı Araştırma Merkezi (MHRC) uzmanları tarafından doğrulanmıştır. MHRC muayenesi yapılan hastaların hiçbirisi kemoterapi görmemiştir. Hastaların en küçüğü 10 yıl 8 aylık ve en büyüğü de 14 yaşındadır. Kontrol grubu (sağlıklı örnekler) ise en küçüğü 11 yaş ve en büyüğü 13 yaş 9 aylık olan 39 sağlıklı öğrenciyi içermektedir. Her iki gruptaki çocukların ortalama yaşı 12 yıl 3 aydır (Borisov et al. 2005). EEG kayıtları, denekler uyanık, rahat ve gözleri kapalı iken kafalarına bağlı 16 elektrot ile alınmıştır. Her kanaldan alınan veri 7680 uzunluğunda tek boyutlu bir dizi yapısındadır. YÖNTEM 39 sağlıklı ve 45 şizofreni hastası bireylerden alınan 16 kanallı EEG verisi üzerinde öncelikle Dalgacık dönüşümü uygulanarak alt bant kanalları elde edilmiştir. Sonrasında elde edilen bu alt bant kanalları üzerinde göreceli dalgacık dönüşümü enerjisi yöntemi kullanılarak özellik çıkarımları yapılmıştır. Elde edilen özellik vektörleri en yakın k komşu sınıflandırma algoritmasıyla sınıflandırılmıştır. Bu çalışmada uygulanan yöntem Şekil1’ de gösterilmektedir.
EEG Sinyali Dalgacık Dönüşümü
(Wavelet)
Göreceli Wavelet
Enerjisi (RWT) Özellik Seçimi
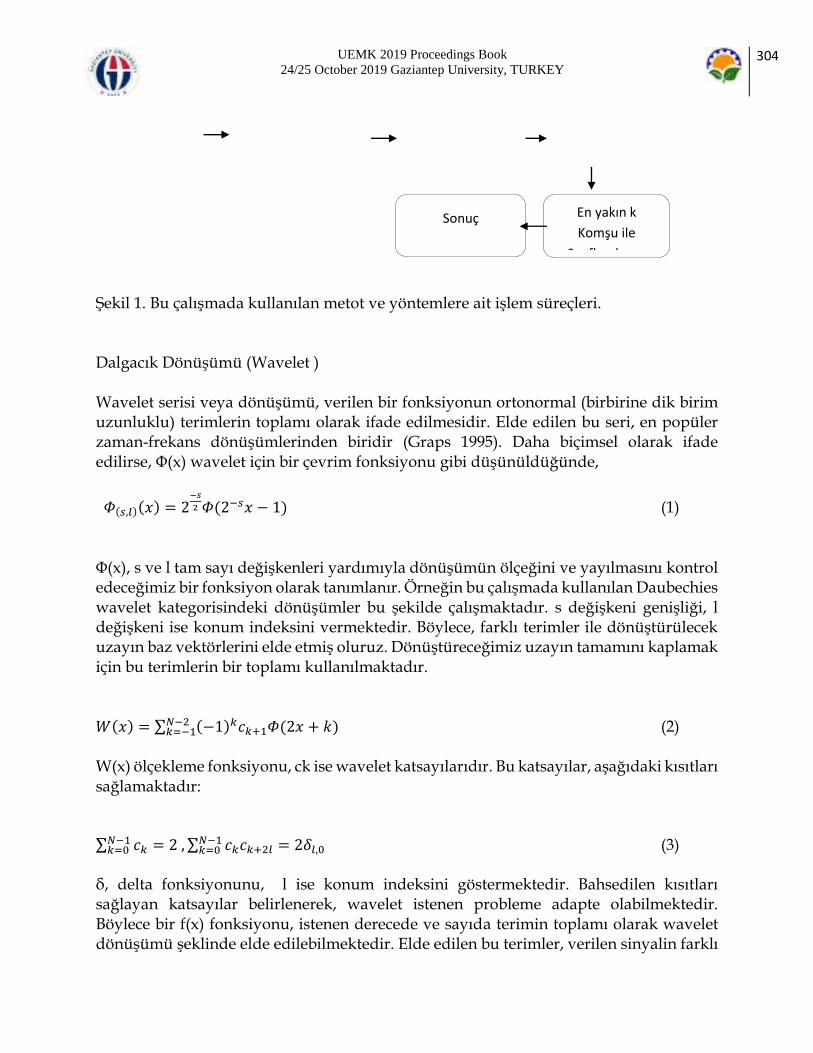
UEMK 2019 Proceedings Book 24/25 October 2019 Gaziantep University, TURKEY
304
Şekil 1. Bu çalışmada kullanılan metot ve yöntemlere ait işlem süreçleri. Dalgacık Dönüşümü (Wavelet ) Wavelet serisi veya dönüşümü, verilen bir fonksiyonun ortonormal (birbirine dik birim uzunluklu) terimlerin toplamı olarak ifade edilmesidir. Elde edilen bu seri, en popüler zaman-frekans dönüşümlerinden biridir (Graps 1995). Daha biçimsel olarak ifade edilirse, Φ(x) wavelet için bir çevrim fonksiyonu gibi düşünüldüğünde,
𝛷(𝑠,𝑙)(𝑥) = 2−𝑠
2 𝛷(2−𝑠𝑥 − 1) (1)
Φ(x), s ve l tam sayı değişkenleri yardımıyla dönüşümün ölçeğini ve yayılmasını kontrol edeceğimiz bir fonksiyon olarak tanımlanır. Örneğin bu çalışmada kullanılan Daubechies wavelet kategorisindeki dönüşümler bu şekilde çalışmaktadır. s değişkeni genişliği, l değişkeni ise konum indeksini vermektedir. Böylece, farklı terimler ile dönüştürülecek uzayın baz vektörlerini elde etmiş oluruz. Dönüştüreceğimiz uzayın tamamını kaplamak için bu terimlerin bir toplamı kullanılmaktadır. 𝑊(𝑥) = ∑ (−1)𝑘𝑐𝑘+1𝛷(2𝑥 + 𝑘)
𝑁−2𝑘=−1 (2)
W(x) ölçekleme fonksiyonu, ck ise wavelet katsayılarıdır. Bu katsayılar, aşağıdaki kısıtları sağlamaktadır: ∑ 𝑐𝑘𝑁−1𝑘=0 = 2 , ∑ 𝑐𝑘𝑐𝑘+2𝑙
𝑁−1𝑘=0 = 2𝛿𝑙,0 (3)
δ, delta fonksiyonunu, l ise konum indeksini göstermektedir. Bahsedilen kısıtları sağlayan katsayılar belirlenerek, wavelet istenen probleme adapte olabilmektedir. Böylece bir f(x) fonksiyonu, istenen derecede ve sayıda terimin toplamı olarak wavelet dönüşümü şeklinde elde edilebilmektedir. Elde edilen bu terimler, verilen sinyalin farklı
En yakın k
Komşu ile
Sınıflandırma
Sonuç
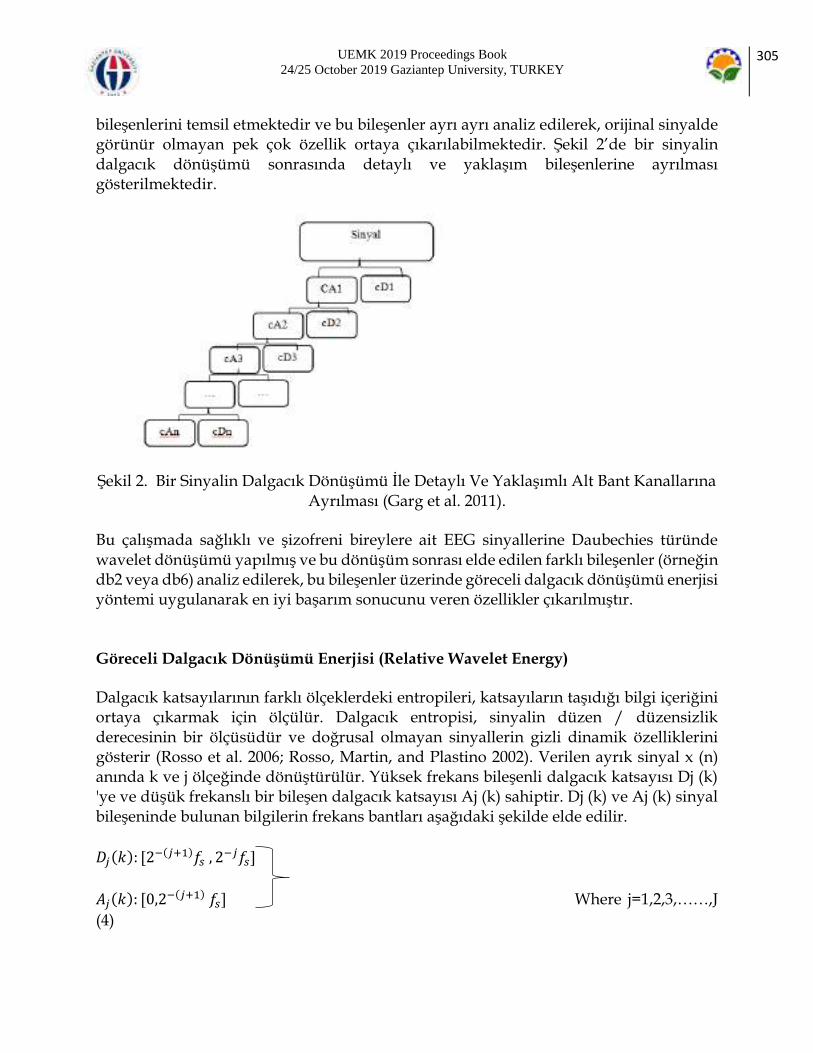
UEMK 2019 Proceedings Book 24/25 October 2019 Gaziantep University, TURKEY
305
bileşenlerini temsil etmektedir ve bu bileşenler ayrı ayrı analiz edilerek, orijinal sinyalde görünür olmayan pek çok özellik ortaya çıkarılabilmektedir. Şekil 2’de bir sinyalin dalgacık dönüşümü sonrasında detaylı ve yaklaşım bileşenlerine ayrılması gösterilmektedir.
Şekil 2. Bir Sinyalin Dalgacık Dönüşümü İle Detaylı Ve Yaklaşımlı Alt Bant Kanallarına Ayrılması (Garg et al. 2011).
Bu çalışmada sağlıklı ve şizofreni bireylere ait EEG sinyallerine Daubechies türünde wavelet dönüşümü yapılmış ve bu dönüşüm sonrası elde edilen farklı bileşenler (örneğin db2 veya db6) analiz edilerek, bu bileşenler üzerinde göreceli dalgacık dönüşümü enerjisi yöntemi uygulanarak en iyi başarım sonucunu veren özellikler çıkarılmıştır. Göreceli Dalgacık Dönüşümü Enerjisi (Relative Wavelet Energy) Dalgacık katsayılarının farklı ölçeklerdeki entropileri, katsayıların taşıdığı bilgi içeriğini ortaya çıkarmak için ölçülür. Dalgacık entropisi, sinyalin düzen / düzensizlik derecesinin bir ölçüsüdür ve doğrusal olmayan sinyallerin gizli dinamik özelliklerini gösterir (Rosso et al. 2006; Rosso, Martin, and Plastino 2002). Verilen ayrık sinyal x (n) anında k ve j ölçeğinde dönüştürülür. Yüksek frekans bileşenli dalgacık katsayısı Dj (k) 'ye ve düşük frekanslı bir bileşen dalgacık katsayısı Aj (k) sahiptir. Dj (k) ve Aj (k) sinyal bileşeninde bulunan bilgilerin frekans bantları aşağıdaki şekilde elde edilir.
𝐷𝑗(𝑘): [2−(𝑗+1)𝑓𝑠 , 2
−𝑗𝑓𝑠]
𝐴𝑗(𝑘): [0,2−(𝑗+1) 𝑓𝑠] Where j=1,2,3,……,J
(4)
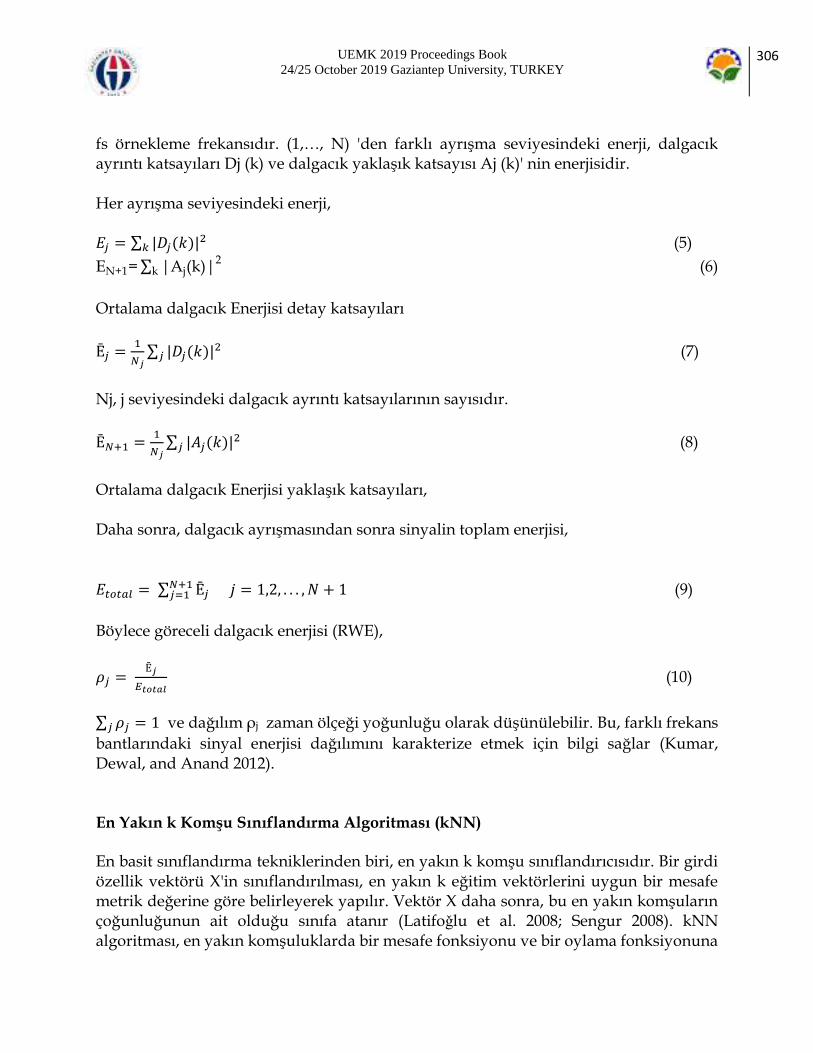
UEMK 2019 Proceedings Book 24/25 October 2019 Gaziantep University, TURKEY
306
fs örnekleme frekansıdır. (1,…, N) 'den farklı ayrışma seviyesindeki enerji, dalgacık ayrıntı katsayıları Dj (k) ve dalgacık yaklaşık katsayısı Aj (k)' nin enerjisidir. Her ayrışma seviyesindeki enerji, 𝐸𝑗 = ∑ |𝐷𝑗(𝑘)|
2𝑘 (5)
EN+1=∑ |Aj(k)|2
k (6)
Ortalama dalgacık Enerjisi detay katsayıları
Ē𝑗 =1
𝑁𝑗∑ |𝐷𝑗(𝑘)|
2𝑗 (7)
Nj, j seviyesindeki dalgacık ayrıntı katsayılarının sayısıdır.
Ē𝑁+1 =1
𝑁𝑗∑ |𝐴𝑗(𝑘)|
2𝑗 (8)
Ortalama dalgacık Enerjisi yaklaşık katsayıları, Daha sonra, dalgacık ayrışmasından sonra sinyalin toplam enerjisi,
𝐸𝑡𝑜𝑡𝑎𝑙 = ∑ Ē𝑗𝑁+1𝑗=1 𝑗 = 1,2, . . . , 𝑁 + 1 (9)
Böylece göreceli dalgacık enerjisi (RWE),
𝜌𝑗 = Ē𝑗
𝐸𝑡𝑜𝑡𝑎𝑙 (10)
∑ 𝜌𝑗𝑗 = 1 ve dağılım ρj zaman ölçeği yoğunluğu olarak düşünülebilir. Bu, farklı frekans
bantlarındaki sinyal enerjisi dağılımını karakterize etmek için bilgi sağlar (Kumar, Dewal, and Anand 2012). En Yakın k Komşu Sınıflandırma Algoritması (kNN) En basit sınıflandırma tekniklerinden biri, en yakın k komşu sınıflandırıcısıdır. Bir girdi özellik vektörü X'in sınıflandırılması, en yakın k eğitim vektörlerini uygun bir mesafe metrik değerine göre belirleyerek yapılır. Vektör X daha sonra, bu en yakın komşuların çoğunluğunun ait olduğu sınıfa atanır (Latifoǧlu et al. 2008; Sengur 2008). kNN algoritması, en yakın komşuluklarda bir mesafe fonksiyonu ve bir oylama fonksiyonuna
UEMK 2019 Proceedings Book 24/25 October 2019 Gaziantep University, TURKEY
307
dayanmaktadır, kullanılan metrik Öklid uzaklığıdır. En yakın k komşu sınıflandırıcısı, optimum değerler k (Duda, Hart, and Stork 1998) için iyi bir performans sergilediği söylenen klasik parametrik olmayan denetimli sınıflandırmacıdır. Çoğu öğreticili öğrenme algoritması gibi, kNN algoritması bir eğitim aşamasından ve bir test aşamasından oluşur. Eğitim aşamasında, veri noktaları n-boyutlu bir alanda verilir. Bu eğitim veri noktalarında, sınıflarını belirten onlarla ilişkili etiketler bulunur. Test aşamasında, etiketlenmemiş veriler verilir ve algoritma etiketlenmemiş noktaya en yakın k (en önceden sınıflandırılmış) veri noktalarının listesini oluşturur. Algoritma daha sonra o listenin çoğunluğunun sınıfını döndürür (Hall 1998; Morgan, D. P., & Scofield 1991) . En yakın k komşu algoritması aşağıdaki adımlardan oluşmaktadır (El-Dahshan, Hosny, and Salem 2010) : 1.Uygun bir mesafe metriğini belirleyin. 2.Eğitim aşamasında: P tüm eğitim verilerini P çiftlerine (seçilen özelliklere göre) depolayın, burada P = (yi, ci), i = 1, ..., n, yi bir eğitim modeli Eğitim verileri seti, ci karşılık gelen sınıf ve n, eğitim kalıpları miktarıdır. 3.Test aşamasında: Yeni özellik vektörü ile depolanan tüm özellikler (eğitim verileri) arasındaki mesafeleri hesaplayın. 4. En yakın komşular seçilir ve yeni örneği sınıf için oy kullanmaları istenir. Test aşamasında verilen doğru sınıflandırma algoritmanın doğruluğunu değerlendirmek için kullanılır. Eğer bu tatmin edici değilse, makul bir doğruluk düzeyi elde edilinceye kadar k değeri ayarlanabilir. BULGULAR Sağlıklı ve hasta bireylerden alınan 16 kanallı EEG kayıtlarından her birine öncelikle Daubechies türünde dalgacık dönüşümü uygulanmaktadır. Dalgacık dönüşümü sonucunda elde edilen alt bant kanallarından en iyi performansı veren Daubechies türünü belirlemek için farklı Daubechies (db2, dB6 gibi) türleri denenmiştir. En iyi başarım sonucu verecek olan dalgacık dönüşümü ile elde edilen değerler üzerinde, sonrasında göreceli dalgacık dönüşüm enerjisi yöntemi kullanılarak özellik çıkarımı yapılmıştır. Her bireye ait 16 kanallı EEG verisinde her kanaldan alınan veri 4780 uzunluğu tek boyutlu bir dizidir. Özellik çıkarımı sonucunda her kanaldan 218 uzunluğunda özellik vektörleri elde edilmiş. Elde edilen özellik vektörleri en yakın k komşu sınıflandırma algoritması kullanılarak sınıflandırılmıştır. Farklı k değerleri için farklı başarım sonuçları elde edilmiştir ve sonuçlar Şekil 3’de gösterilmektedir. Şekilde de görüldüğü üzere en yüksek başarım k=1 değeri için 94,1% olarak elde edilmiştir. Ancak sınıflandırma işleminde çapraz doğrulama (Cross Validation=10 değeri için) yapıldığında başarım oranı 95,2% olarak elde edilmiştir.

UEMK 2019 Proceedings Book 24/25 October 2019 Gaziantep University, TURKEY
308
Şekil 3. Farklı n Değerleri İçin En Yakın k Komşu Sınıflandırma Algoritmasının Başarım Sonuçları. SONUÇ Bu çalışmada şizofreni hastalığına sahip hastaların EEG kayıtları Dalgacık dönüşümü ve göreceli dalgacık enerjisi metotlarıyla analiz edilmiştir. Bu analiz sonucu elde edilen özellikler, bir sınıflandırıcıya verilerek, ilgili özelliklerin hastalığı ayırt edici özelliğe sahip olup olmadıkları incelenmiştir. Sonuç olarak, kullanılan en yakın k komşu sınıflandırıcısında başarım 90% civarında elde edilmektedir. Bu da bize ilgili analiz yönteminin EEG sinyalindeki tanı amaçlı önemli özellikleri koruyabildiğini göstermektedir. Çalışmada kullanılan metot bize şizofreni hastalarının normal bireylerden ayırt edilebilmesini sağlayacak bir uzman sistem tasarlanabileceğini göstermekte ve bu yöndeki çalışmaları teşvik edici olarak öne çıkmaktadır. Sonraki çalışmalarda, bu çalışmadaki metodoloji baz alınarak, şizofreni hastalığının teşhisi, tespiti veya buna benzer alanlarda klinik çalışanlara yardımcı olabilecek karar destek sistemlerinin geliştirilmesi oldukça olası görünmektedir. KAYNAKLAR American Psychiatric Association. 1994. “Diagnostic and Statistical Manual of Mental Disorders American Psychiatric Association.” Washington, DC. Borisov, S. V., A. Ya Kaplan, N. L. Gorbachevskaya, and I. A. Kozlova. 2005. “Analysis of EEG Structural Synchrony in Adolescents with Schizophrenic Disorders.” Human Physiology. Cherif, R., A. Nait-Ali, J.F. Motsch, and M.O. Krebs. 2004. “A Parametric Analysis of Eye Tremor Movement during Ocular Fixation, Applied to Schizophrenia.” Duda, Richard O, Peter E Hart, and David G Stork. 1998. “Pattern Classification ( 2nd Ed .).” Computational Complexity.
94,1%
83,1%
88,0%
85,6%
89,2%88,0% 88,1%
89,3% 89,3% 89,3%
76,0%78,0%80,0%82,0%84,0%86,0%88,0%90,0%92,0%94,0%96,0%
1 2 3 4 5 6 7 8 9 10
Başarım Yüzdesi
UEMK 2019 Proceedings Book 24/25 October 2019 Gaziantep University, TURKEY
309
El-Dahshan, El Sayed Ahmed, Tamer Hosny, and Abdel Badeeh M. Salem. 2010. “Hybrid Intelligent Techniques for MRI Brain Images Classification.” Digital Signal Processing: A Review Journal. Garg, Girisha, Vijander Singh, J R P Gupta, and A P Mittal. 2011. International Journal of Biomedical Signal Processing RELATIVE WAVELET ENERGY AS A NEW FEATURE EXTRACTOR FOR SLEEP CLASSIFICATION USING EEG SIGNALS. Gaser, Christian et al. 1999. “Detecting Structural Changes in Whole Brain Based on Nonlinear Deformations Application to Schizophrenia Research.” NeuroImage. Graps, Amara. 1995. “An Introduction to Wavelets.” IEEE Computational Science and Engineering. Hall, M. 1998. “Correlation-Based Feature Selection for Machine Learning.” Waikato Uni. Hornero, Roberto et al. 2006. “Variability, Regularity, and Complexity of Time Series Generated by Schizophrenic Patients and Control Subjects.” IEEE Transactions on Biomedical Engineering. Jeong, Jaeseung et al. 1998. “Nonlinear Analysis of the EEG of Schizophrenics with Optimal Embedding Dimension.” Medical Engineering and Physics. Keil, Andreas, Thomas Elbert, Brigitte Rockstroh, and William J. Ray. 1998. “Dynamical Aspects of Motor and Perceptual Processes in Schizophrenic Patients and Healthy Controls.” Schizophrenia Research. Kumar, Yatindra, Mohan Lal Dewal, and Radhey Shyam Anand. 2012. “Relative Wavelet Energy and Wavelet Entropy Based Epileptic Brain Signals Classification.” Biomedical Engineering Letters. Latifoǧlu, Fatma, Kemal Polat, Sadik Kara, and Salih Güneş. 2008. “Medical Diagnosis of Atherosclerosis from Carotid Artery Doppler Signals Using Principal Component Analysis (PCA), k-NN Based Weighting Pre-Processing and Artificial Immune Recognition System (AIRS).” Journal of Biomedical Informatics. Lewis, David A., and Guillermo Gonzalez-Burgos. 2000. “Intrinsic Excitatory Connections in the Prefrontal Cortex and the Pathophysiology of Schizophrenia.” Brain Research Bulletin. Morgan, D. P., & Scofield, C. L. 1991. “Neural Networks and Speech Processing.” In Neural Networks and Speech Processing Springer(Boston, MA.): (pp. 329-348). Paulus, Martin P., Mark A. Geyer, and David L. Braff. 1999. “Long-Range Correlations in Choice Sequences of Schizophrenic Patients.” Schizophrenia Research. Pressman, A., Peled, A., & Geva, A. B. 2000. “SYNCHRONIZATION ANALYSIS OF MULTI-CHANNEL EEG OF SCHIZOPHRENIC DURING WORKING-MEMORY TASKS.” In 21st IEEE Convention of the Electrical and Electronic Engineers in Israel. Proceedings (Cat. No. 00EX377) April: 337–41. Rosenberg, Stewart et al. 1990. “Random Number Generation by Normal, Alcoholic and Schizophrenic Subjects.” Psychological Medicine. Rosso, O. A. et al. 2006. “EEG Analysis Using Wavelet-Based Information Tools.” Journal of Neuroscience Methods.

UEMK 2019 Proceedings Book 24/25 October 2019 Gaziantep University, TURKEY
310
Rosso, O. A., M. T. Martin, and A. Plastino. 2002. “Brain Electrical Activity Analysis Using Wavelet-Based Informational Tools.” Physica A: Statistical Mechanics and its Applications. Sabeti, M., R. Boostani, S. D. Katebi, and G. W. Price. 2007. “Selection of Relevant Features for EEG Signal Classification of Schizophrenic Patients.” Biomedical Signal Processing and Control. Selemon, Lynn D., and Patricia S. Goldman-Rakic. 1999. “The Reduced Neuropil Hypothesis: A Circuit Based Model of Schizophrenia.” Biological Psychiatry. Sengur, Abdulkadir. 2008. “An Expert System Based on Principal Component Analysis, Artificial Immune System and Fuzzy k-NN for Diagnosis of Valvular Heart Diseases.” Computers in Biology and Medicine. Shao, Chenxi, Jinfeng Fan, and Shaobin Li. 2007. “Nonlinear Characteristics and Qualitative Analysis of Sleep EEG.” In 2007 1st International Conference on Bioinformatics and Biomedical Engineering, ICBBE,. WHO. 2011. “International Statistical Classification of Diseases and Related Health Problems - 10th Revision.” World Health Organisation.

UEMK 2019 Proceedings Book 24/25 October 2019 Gaziantep University, TURKEY
311
URBAN TRANSFORMATION PROJECT USING
ANALYTICAL HIERARCHY PROCESS (AHP): CASE OF
SANLIURFA
Mehmet TOPDAĞ
Şanlıurfa Büyükşehir Belediyesi İmar ve Şehircilik Dai. Bşk. [email protected] Hüseyin Zahit SELVİ, İlkay BUĞDAYCI Necmettin Erbakan Üniversitesi Mühendislik Mimarlık Fakültesi Harita Mühendisliği Bölümü, [email protected] , [email protected]
ABSTRACT: As a natural result of developing science and technology, it can be said that it is very easy to access data today. However, it is very important to reach the most accurate data in the shortest time. Particularly in the decisions such as urban transformation and disaster management where decisions are very important, it is necessary to make the right decision by considering all the necessary criteria. It is known that analyzing spatial data with the support of GIS (Geographical Information System) makes a significant contribution to decision-makers. Multi-criteria decision-making methods can provide significant contributions, especially when multiple criteria affect the decision. Urban transformation projects are located the complex problems in which more than one spatial criteria affect the decision-making process. In this study, it is aimed to determine the areas where priority urban transformation is needed from Yesildirek, Sehitlik, Hizmali, Karakoyun neighborhoods in Haliliye District of Sanliurfa Province by Analytical Hierarchy (AHP), which is a multi-criteria decision making method. Thus, the importance of using GIS and multi-criteria decision making methods will be introduced in order to make an accurate urban transformation decision according to objective criteria. Key Words: Geographical Information Systems, Urban Transformation, multi criteria data analysis ANALİTİK HİYERARŞİ YÖNTEMİYLE (AHP) KENTSEL DÖNÜŞÜM UYGULAMASI: ŞANLIURFA ÖRNEĞİ ÖZET: Gelişen bilim ve teknolojinin doğal sonucu olarak, günümüzde veriye ulaşmanın oldukça kolay olduğu söylenebilir. Ancak bu verilerden en doğrusuna en kısa sürede ulaşmak oldukça önem taşımaktadır. Özellikle belirlenen kararların çok önemli olduğu kentsel dönüşüm, afet yönetimi gibi kararlarda gerekli tüm kriterlerin dikkate alınarak
UEMK 2019 Proceedings Book 24/25 October 2019 Gaziantep University, TURKEY
312
doğru karar verilmesi gerekmektedir. Mekânsal verilerin CBS (Coğrafi Bilgi Sistemi) desteğiyle analiz edilmesinin, karar vericilere önemli katkı sağladığı bilinmektedir. Özellikle birden fazla kriterin, kararı etkilediği durumlarda, çok kriterli karar verme yöntemleri önemli katkılar sunabilmektedir. Kentsel dönüşüm projeleri de birden fazla mekânsal kriterin karar verme sürecini etkilediği karmaşık problemler arasında yer almaktadır. Bu çalışmada çok kriterli karar verme yöntemlerinden Analitik Hiyerarşi (AHP) yöntemiyle, Şanlıurfa İli Haliliye İlçesinde bulunan Yeşildirek, Şehitlik, Hızmalı, Karakoyun mahallelerinden, öncelikli Kentsel Dönüşüme ihtiyaç duyulan alanların belirlenmesi amaçlanmaktadır. Böylece objektif kriterlere göre doğru bir kentsel dönüşüm yapılabilmesi için CBS ve çok kriterli karar verme yöntemlerinin kullanılmasının önemi ortaya konulacaktır. Anahtar kelimeler: Coğrafi Bilgi Sistemi, Kentsel Dönüşüm, Çok Kriterli Veri Analizleri. GİRİŞ Kentler, toplumsal olarak sürekli bir gelişmeyi içerisinde barındıran ve toplumda yer alan bireylerin, yerleşme, barınma, eğlenme gibi temel yaşamsal ihtiyaçlarının karşılandığı; pek az sayıda bireyin tarımsal faaliyetlerde bulunduğu; nüfus önünden kırsaldan daha yoğun olan ve insanların sosyalleşebildiği yerleşme birimidir (Keleş, 1987;70). Kentler, toplumsal yaşama biçim verirler. Kentlerde tıpkı diğer varlıklar gibi, doğan, büyüyen, gelişen ve eskiyen toplumsal birimlerdir. Kentsel dönüşüm, birçok etmene bağlı olarak, sosyal yaşamın her anında ve alanında sürekli bir değişim özelliğini barındıran süreç olarak tanımlanmakta olup; makro ölçekten, mikro ölçeğe uzanan ve bir bütünlük arz eden kavram olan dönüşüm olgusunun birçok faktörünü (sosyal, psikolojik, kültürel, politik, ekonomik, felsefi vb.) bir arada barındırmaktadır (Arabulan, 2015: 8). Kentsel dönüşüm ifadesi ilk olarak, 18. yüzyıldan itibaren ortaya çıkan ve endüstri devriminin sonucunda oluşan, sosyal ve ekonomik çöküntü bölgelerinin rehabilite edilmesi ve yenileştirmesi amacıyla gerçekleştirilen çalışmaların genel bir ifadesi olarak tanımlanabilmektedir. Kentsel dönüşüm çalışmaları, kentin nüfus yoğunluğunda artma olduğu ya da dar gelir gruplarının iyi olmayan şartlarda yaşam sürdürdüğü konut ve endüstri alanlarında, şehre ekonomik yönde olumlu biçimde katkı sağlayacak projelerin geliştirilmesi biçiminde uygulanabildiği görülebilmektedir (Özkul, 2017: 5). Daha açık bir ifadeyle kentsel dönüşüm ve gelişim uygulamaları, kentlerin eskiyen, yıpranmış ve sefalet yuvası haline gelmiş bölgelerinin daha sağlıklı, modern, yaşanabilir alanlar haline getirilmesi; kentin büyümesi ile kent içinde kalan sanayi alanlarının kentin dışına çıkarılması sonucu boşalan yerlerin halkın yararına düzenlenmesi, yıpranmış kent alanlarının restorasyonu yapılarak, toplumun hizmetine kazandırılması ve olası bir doğal
UEMK 2019 Proceedings Book 24/25 October 2019 Gaziantep University, TURKEY
313
afet sonrasında zarar görme riski olan alanların iyileştirilmesi gibi nedenlerle gerçekleştirilmektedir. Örneğin deprem, Türkiye`nin önemli bir gerçeği konumundadır ve kimi dönemlerde maalesef mal ve can ayıplarına neden olmaktadır. Depremlerin bir doğa olayı olarak ciddi afetlere dönüşmesi kentsel dönüşüm süreçlerinde depreme dayanıklı, güvenli konutların yapılmasını önemli bir amaç haline getirmektedir. (TMMOB, 2012). Karar verme pozisyonundaki idarecilerin, yeni yaşam alanlarını oluşturma ve kaçak yapılaşma ile mücadele noktasındaki gecikmeleri, gecekondu yerleşkelerinin oluşmasının temel sebeplerindendir. Gecekondu yaşam alanı, plansız, fen ve bilim normlarına uymayan düzensiz bir yaşam alanı oluşturmaktadır. Diğer yandan bölgenin alt yapısının yetersiz oluşu, çevresel etmenlere bağlı olarak sağlık sorunlarına neden olabilmektedir. Günümüzde bilhassa gecekondu alanları için, görmek istediğimiz modern kent görüntüsünü, kentsel dönüşüm projeleri ile kazanabildiği, yukarıdaki tanımlamalardan anlaşılabilmektedir. Ancak kentsel dönüşüm projeleri için, gerek projelendirme noktasında, gerek inşaat maliyeti göz önünde bulundurulduğunda; yüksek bir bütçenin ayrılması gerektiği aşikârdır. Kentte yer alan bütün bir gecekondu alanının dönüşümü mümkün olamıyor ise, idare tarafından öncelikli kriterler belirlenerek bu doğrultuda Çok Kriterli Veri Analizleri Yönetimleriyle, var olan gecekondu alanlarından öncelikli dönüşüme ihtiyaç duyulan alanların belirlenmesi gerekmektedir. Şanlıurfa İli 1980’li yıllar ile birlikte, özellikle GAP çalışmalarının doğal sonucu olarak sulu tarıma geçilmesiyle, tarımsal anlamda cazibeli bir konuma gelmiştir. Ancak geçen zamanın etkisiyle nüfus ve sanayideki gelişime paralel olarak kentleşme oranı % 50 lerden, % 92 oranlarına yükselmiştir. Bu süre zarfındaki kentleşme oranında anormal artış, kentleşmeyle beraber, çevre sorunları ve sosyolojik sorunların önünü açmıştır (URL 1). Bu çalışma ile, Şanlıurfa Büyükşehir Belediye Başkanlığı tarafından 5393 sayılı Belediye kanunun 73. maddesi gereği, kentin çöküntü, eskimiş bölgelerinden kentsel dönüşüm ihtiyaç duyulan öncelikli olarak dönüşümün yapılması gereken alanların tespiti amaçlanmaktadır. Kentsel dönüşüme ihtiyacı bulunan alanlar; Plansız ve ruhsatsız alanlar, diğer bir ifadeyle gecekondu alanları, Planlı alanlarda yer alan ruhsatsız yapılar olarak belirlenmiştir. Kentsel dönüşümün genel amaçları aşağıdaki şekilde sıralanabilir; Kentin geçmişten bu yana sahip olduğu kimlik ile fiziki şartlar arasında bir bağın oluşturulması gerekmektedir. Kentlerin birtakım sorunları yaşamalarının ve kötü koşulları altında yaşama durumunun ortaya çıkmasının en önemli nedenlerinden biri, toplumsal alanda görülen sorunlardır. Bu nedenle kentsel dönüşüm projelerinin oluşturulmasında toplumsal (sosyal ve ekonomik) sorunların incelenmesi, çözüm önerilerinin geliştirilmesi ve elde edilen sonuçlar dikkate alınarak düzenlenmesi gerekir.
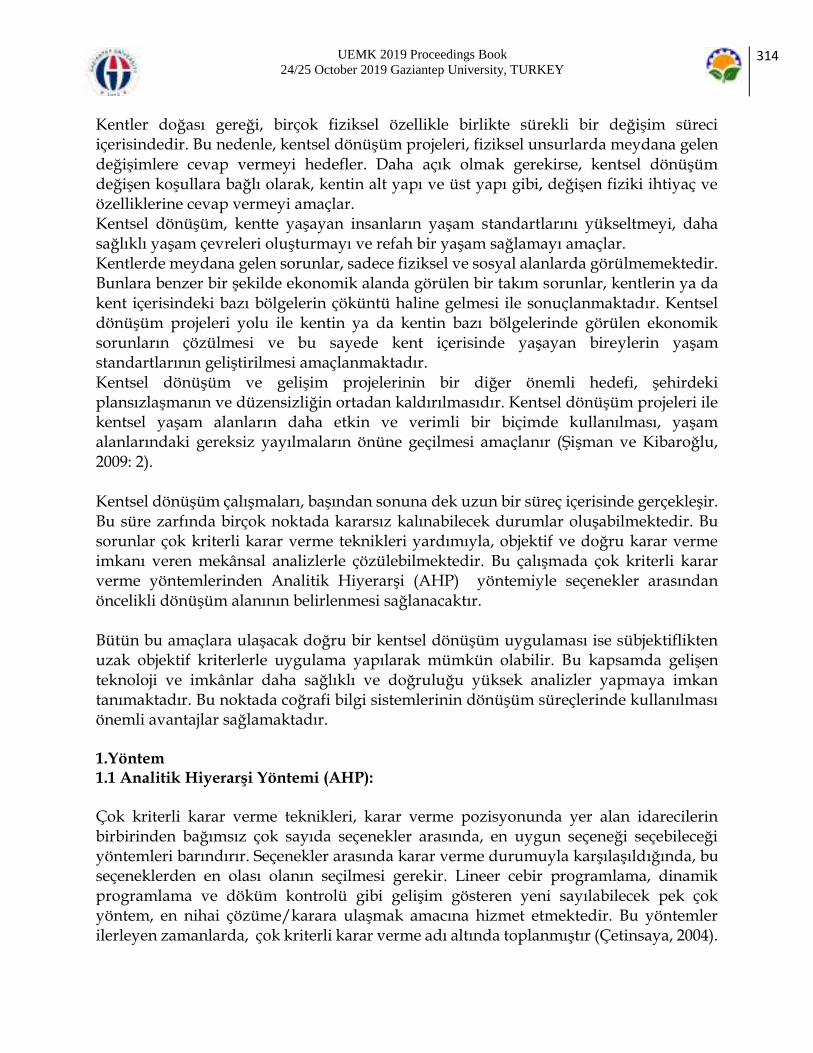
UEMK 2019 Proceedings Book 24/25 October 2019 Gaziantep University, TURKEY
314
Kentler doğası gereği, birçok fiziksel özellikle birlikte sürekli bir değişim süreci içerisindedir. Bu nedenle, kentsel dönüşüm projeleri, fiziksel unsurlarda meydana gelen değişimlere cevap vermeyi hedefler. Daha açık olmak gerekirse, kentsel dönüşüm değişen koşullara bağlı olarak, kentin alt yapı ve üst yapı gibi, değişen fiziki ihtiyaç ve özelliklerine cevap vermeyi amaçlar. Kentsel dönüşüm, kentte yaşayan insanların yaşam standartlarını yükseltmeyi, daha sağlıklı yaşam çevreleri oluşturmayı ve refah bir yaşam sağlamayı amaçlar. Kentlerde meydana gelen sorunlar, sadece fiziksel ve sosyal alanlarda görülmemektedir. Bunlara benzer bir şekilde ekonomik alanda görülen bir takım sorunlar, kentlerin ya da kent içerisindeki bazı bölgelerin çöküntü haline gelmesi ile sonuçlanmaktadır. Kentsel dönüşüm projeleri yolu ile kentin ya da kentin bazı bölgelerinde görülen ekonomik sorunların çözülmesi ve bu sayede kent içerisinde yaşayan bireylerin yaşam standartlarının geliştirilmesi amaçlanmaktadır. Kentsel dönüşüm ve gelişim projelerinin bir diğer önemli hedefi, şehirdeki plansızlaşmanın ve düzensizliğin ortadan kaldırılmasıdır. Kentsel dönüşüm projeleri ile kentsel yaşam alanların daha etkin ve verimli bir biçimde kullanılması, yaşam alanlarındaki gereksiz yayılmaların önüne geçilmesi amaçlanır (Şişman ve Kibaroğlu, 2009: 2). Kentsel dönüşüm çalışmaları, başından sonuna dek uzun bir süreç içerisinde gerçekleşir. Bu süre zarfında birçok noktada kararsız kalınabilecek durumlar oluşabilmektedir. Bu sorunlar çok kriterli karar verme teknikleri yardımıyla, objektif ve doğru karar verme imkanı veren mekânsal analizlerle çözülebilmektedir. Bu çalışmada çok kriterli karar verme yöntemlerinden Analitik Hiyerarşi (AHP) yöntemiyle seçenekler arasından öncelikli dönüşüm alanının belirlenmesi sağlanacaktır. Bütün bu amaçlara ulaşacak doğru bir kentsel dönüşüm uygulaması ise sübjektiflikten uzak objektif kriterlerle uygulama yapılarak mümkün olabilir. Bu kapsamda gelişen teknoloji ve imkânlar daha sağlıklı ve doğruluğu yüksek analizler yapmaya imkan tanımaktadır. Bu noktada coğrafi bilgi sistemlerinin dönüşüm süreçlerinde kullanılması önemli avantajlar sağlamaktadır. 1.Yöntem 1.1 Analitik Hiyerarşi Yöntemi (AHP): Çok kriterli karar verme teknikleri, karar verme pozisyonunda yer alan idarecilerin birbirinden bağımsız çok sayıda seçenekler arasında, en uygun seçeneği seçebileceği yöntemleri barındırır. Seçenekler arasında karar verme durumuyla karşılaşıldığında, bu seçeneklerden en olası olanın seçilmesi gerekir. Lineer cebir programlama, dinamik programlama ve döküm kontrolü gibi gelişim gösteren yeni sayılabilecek pek çok yöntem, en nihai çözüme/karara ulaşmak amacına hizmet etmektedir. Bu yöntemler ilerleyen zamanlarda, çok kriterli karar verme adı altında toplanmıştır (Çetinsaya, 2004).

UEMK 2019 Proceedings Book 24/25 October 2019 Gaziantep University, TURKEY
315
Yalnızca 1 adet kriter ölçü alınarak alternatifler değerlendirilebilirken, karar verme işi göreceli olarak daha kolay yapılabilmektedir. Fakat kriter sayısının artması ile birlikte, karar verme işlemi çok daha zor boyutlara ulaşabilmektedir. AHP kullanımı, seçenekler ile alt seçenekler arasında ikili mukayeseye dayanarak, birbirilerine olan üstünlüklerin belirlenmesi ile sonuca ulaştırır. Bu bilgiler ışığında, belirlenen kriterlere bağlı olarak en etkin seçimin alternatifler arasında yapılabilmesini sağlar. AHP de, hiyerarşik yapının (Şekil 1) oluşturulması ilk adımdır. Belirlenen amaç doğrultusunda kriterler ve ona ait olan alt bilgileri içeren hiyerarşik yapı oluşturulur. Hiyerarşiye bakıldığında en tepede nihai amacın, ortada ele alınacak kriterlerin ve en altta ise değerlendirilecek alternatiflerin olduğu görülmektedir.
Şekil 1: Hiyerarşik Yapı
1.2. Seçenekler Ülkemizde kentsel dönüşüme yönelik yerel yönetimler tarafından benimsenen tanım ve amaç; sağlıksız ve eskimiş konutlar ile birlikte, plansız olarak gelişmiş yerleşimlerin, kent merkezlerinde kalan sanayi alanlarının kaldırılması sonucu tamamen atıl vaziyette kalan ya da iyileştirilmesi ve yeni ihtiyaçlar doğrultusunda tekrardan halka kazandırılması gereken kentsel fonksiyonların, yeni ihtiyaçlar doğrultusunda geliştirilmesi ve yenilenmesi yoluyla yerleşim yerlerinin günümüz koşullarına uygun biçimde daha yaşanabilir, sürdürülebilir ve modern kent merkezleri halini almasıdır (Demirkıran 2008,8s.). Yukarıdaki tanıma göre Şanlıurfa Büyükşehir Belediyesi sınırları içerinde kalan Şehitlik, Hızmalı, Karakoyun ve Yeşildirek mahallelerinin kentsel dönüşüme ihtiyaç duyacağı gözlemlenebilmektedir. Bu çalışmada Şanlıurfa ili Haliliye İlçesi sınırlarında kalan, Şekil 2 de belirtilen bu mahallelerde, belirlenen kriterlere göre en uygun çalışma alanın belirlenmesi hedeflenmektedir.

UEMK 2019 Proceedings Book 24/25 October 2019 Gaziantep University, TURKEY
316
Şekil 2: Kentsel Dönüşüm Alanlarının Kent İçindeki Konumları 2.1. Kriterlerin Belirlenmesi ve Uygunluk Haritalarının Oluşturulması En uygun dönüşüm alanının belirlenmesi sürecinde, dikkat edilmesi gereken hususların belirlenmesi ve irdelenmesi ile ikili mukayeseler büyük önem arz etmektedir. Bu kapsamda çalışma alanı seçilirken deprem, sıcaklık, nemlilik, hakim rüzgar yönü unsuru, yağış miktarı gibi beklenmedik olası durumlarda dikkate alınmış ve incelenmiştir. Bütün bu çalışmalar ışığında veri karmaşasını önlemek ve çalışmanın işlevselliği ve anlaşılırlığını sağlamak amacıyla farklı alanlarda farklı özellik gösteren kriterler hesaplamaya katılmıştır. Bu noktada öncelikli dönüşüm alanının belirlenmesi sürecinde; 1-Mülkiyet bilgisi (Özel, kamu) 2-Parsel bilgileri 3-Yapı miktarı (kat adetleri) 4-Yapının yıpranma oranları

UEMK 2019 Proceedings Book 24/25 October 2019 Gaziantep University, TURKEY
317
5-Kent merkezindeki konumları 6- Maliyet 7-Jeolojik 8-Eğim 9-Sıcaklık kriterleri üzerinde durulacaktır. AHP Hiyerarşik yapısı oluşturulduktan sonra kriterlerin kendi aralarında ikili mukayesesi ile karşılaştırma karar matrisleri oluşturulur. Bu matrislerin oluşturulmasında ( Saaty, 1980 ) tarafından önerilen 1-9 önem skalası kullanılmaktadır. Tablo 1: Önem Skalası
Önem Derecesi Tanım Açıklama
1 Eşit derecede önemli
İki seçenek eşit derecede öneme sahiptir.
3 Orta derecede önemli
Tecrübe ve yargı, bir kriteri diğerinden önemli saymaktadır.
5 Kuvvetli derecede önemli
Tecrübe ve yargı, bir kriteri diğerine karşı oldukça üstün saymaktadır.
7 Çok kuvvetli derecede önemli
Bir kriter, diğer bir kriterden üstün sayılmaktadır.
9 Kesin önemli Bir kriteri diğer bir kriterden üstün olduğunu ortaya koyan çok sayıda kanıt bulunmaktadır.
2-4-6-8 Ara değerler Anlaşma gerektiğinde kullanılabilecek iki ardışık yargı arasındaki değerleri ifade etmektedir.
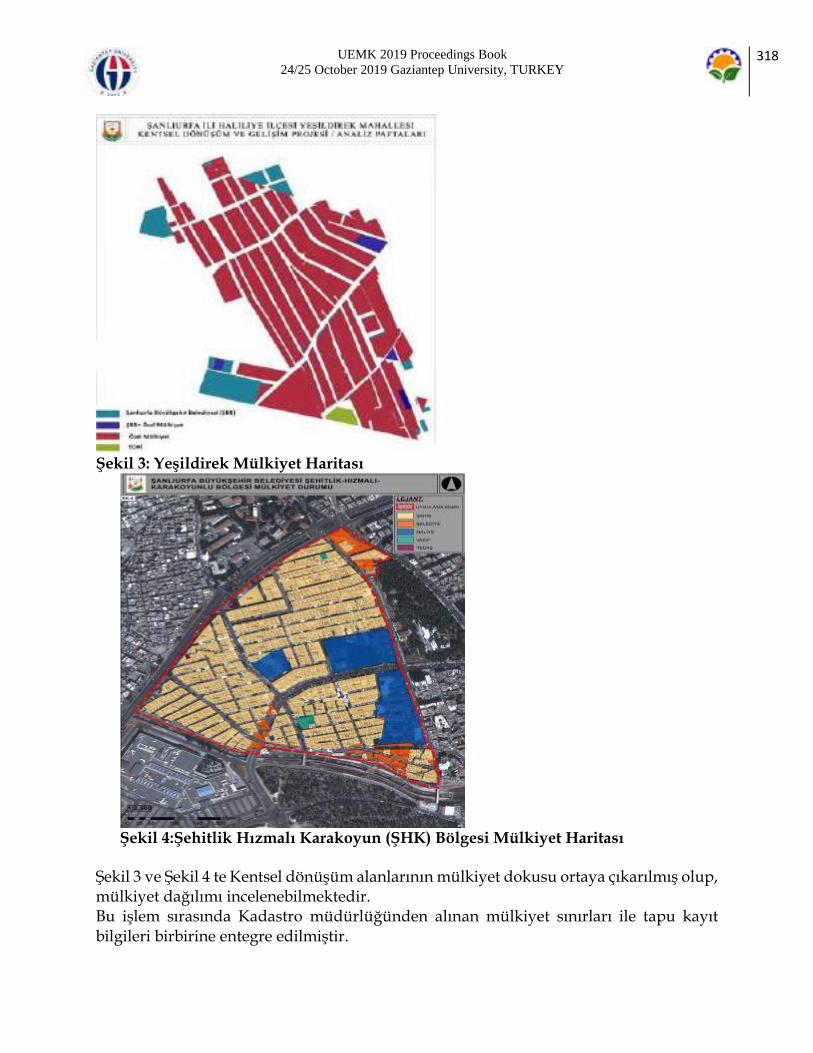
UEMK 2019 Proceedings Book 24/25 October 2019 Gaziantep University, TURKEY
318
Şekil 3: Yeşildirek Mülkiyet Haritası
Şekil 4:Şehitlik Hızmalı Karakoyun (ŞHK) Bölgesi Mülkiyet Haritası Şekil 3 ve Şekil 4 te Kentsel dönüşüm alanlarının mülkiyet dokusu ortaya çıkarılmış olup, mülkiyet dağılımı incelenebilmektedir. Bu işlem sırasında Kadastro müdürlüğünden alınan mülkiyet sınırları ile tapu kayıt bilgileri birbirine entegre edilmiştir.
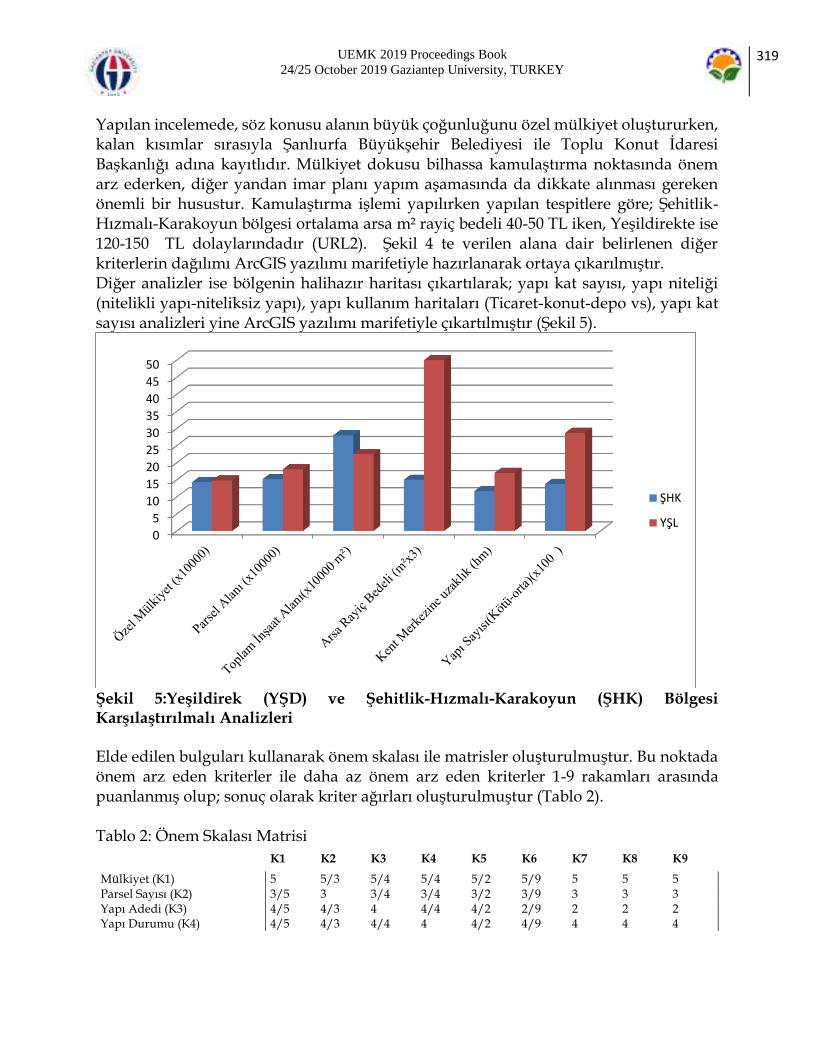
UEMK 2019 Proceedings Book 24/25 October 2019 Gaziantep University, TURKEY
319
Yapılan incelemede, söz konusu alanın büyük çoğunluğunu özel mülkiyet oluştururken, kalan kısımlar sırasıyla Şanlıurfa Büyükşehir Belediyesi ile Toplu Konut İdaresi Başkanlığı adına kayıtlıdır. Mülkiyet dokusu bilhassa kamulaştırma noktasında önem arz ederken, diğer yandan imar planı yapım aşamasında da dikkate alınması gereken önemli bir husustur. Kamulaştırma işlemi yapılırken yapılan tespitlere göre; Şehitlik-Hızmalı-Karakoyun bölgesi ortalama arsa m² rayiç bedeli 40-50 TL iken, Yeşildirekte ise 120-150 TL dolaylarındadır (URL2). Şekil 4 te verilen alana dair belirlenen diğer kriterlerin dağılımı ArcGIS yazılımı marifetiyle hazırlanarak ortaya çıkarılmıştır. Diğer analizler ise bölgenin halihazır haritası çıkartılarak; yapı kat sayısı, yapı niteliği (nitelikli yapı-niteliksiz yapı), yapı kullanım haritaları (Ticaret-konut-depo vs), yapı kat sayısı analizleri yine ArcGIS yazılımı marifetiyle çıkartılmıştır (Şekil 5).
Şekil 5:Yeşildirek (YŞD) ve Şehitlik-Hızmalı-Karakoyun (ŞHK) Bölgesi Karşılaştırılmalı Analizleri Elde edilen bulguları kullanarak önem skalası ile matrisler oluşturulmuştur. Bu noktada önem arz eden kriterler ile daha az önem arz eden kriterler 1-9 rakamları arasında puanlanmış olup; sonuç olarak kriter ağırları oluşturulmuştur (Tablo 2). Tablo 2: Önem Skalası Matrisi
K1 K2 K3 K4 K5 K6 K7 K8 K9
Mülkiyet (K1) 5 5/3 5/4 5/4 5/2 5/9 5 5 5 Parsel Sayısı (K2) 3/5 3 3/4 3/4 3/2 3/9 3 3 3 Yapı Adedi (K3) 4/5 4/3 4 4/4 4/2 2/9 2 2 2 Yapı Durumu (K4) 4/5 4/3 4/4 4 4/2 4/9 4 4 4
0
5
10
15
20
25
30
35
40
45
50
ŞHK
YŞL

UEMK 2019 Proceedings Book 24/25 October 2019 Gaziantep University, TURKEY
320
Kent Merkezine Göre Konumları (K5)
2/5 2/3 2/4 2/4 2 4/9 2 2 2
Maliyet (K6) 9/5 9/2 9/4 9/4 9/2 9 9 9 9 Jeolojik(K7) 1/5 1/3 1/4 1/4 1/2 1/9 1 1 1 Eğim (K8) 1/5 1/3 1/4 1/4 1/2 1/9 1 1 1 Sıcaklık (K9) 1/5 1/3 1/4 1/4 1/2 1/9 1 1 1
Yukarıdaki matris önem skalası marifetiyle 1 ila 9 rakamları arasında puanlanarak oluşturulmuştur. Puan sistemine göre 9 puanı, kriterler içerisinde en önemli olanı simgelemektedir. Puanlamada uzman görüşleri de dikkate alınarak; mülkiyet kriteri 5, parsel sayısı 3, yapı kat adedi 4, yapı durumu kriteri 4, kent merkezine göre konumları 2, maliyet ise 9 rakamı ile puanlanmıştır. Jeolojik durum, eğim ve sıcaklık değerleri ise bölgesel anlamda standart olarak kabul edilmektedir ve 1 rakamı ile puanlanmıştır. Jeolojik durum; MTA verilerine göre araştırma sahası barınak yapımı için uygun özelliklere sahip olan kalker ve bazalt kayaçlar yönünden zengindir. temeli oluşturan Bazalt ve Alüvyonal zemin jeolojik ve jeoteknik özellikleri, literatür bilgileri ve arazi gözlemleri birlikte değerlendirildiğinde, bu malzemenin temel oluşturmada herhangi bir sorun yaratmayacağı anlaşılmış ve uygun yerleşim alanlarındandır (URL 4). Eğim analizi; Çalışma alanı ve yakın çevresinin eğimi %13 yani yaklaşık yatay durumdadır. Çalışma alanındaki jeolojik birimlerin tekdüze bir özellik gösterdiği belirlenmiştir (URL3). Sıcaklık analizi; İklim bölgeye has karasal iklimdir. Bölgede kışlar soğuk ve yağışlı, yazlar sıcak ve kurak geçmektedir. Kontinental (kara) iklim özelliğinden ötürü sıcaklık farklılıkları görülmektedir. Bölgede en soğuk aylar Ocak-Şubat ayları olup, ortalama sıcaklık derecesi 11.5 °C; en sıcak aylar ise Temmuz-Ağustos olup ortalama sıcaklık derecesi 46.3 °C ve yıllık ortalama sıcaklık derecesi 18.2 °C dir (URL 5). Maliyet kriterinin projenin yürütülmesi noktasında, en önemli kriter olduğu açık biçimde görülmektedir (Şekil 6).

UEMK 2019 Proceedings Book 24/25 October 2019 Gaziantep University, TURKEY
321
Şekil 6: Kriter Ağırlıkları SONUÇ Kentsel dönüşüm ve gelişim projelerinin öncelikli olarak, bütüncül bir dönüşüm ile birlikte bölgeye yeni bir çehre kazandırdığı aşikârdır. Özellikle şehrin merkezinde kalarak prestij kazanan; fakat kentin eskimiş, düzensiz, estetik bir görüntüye sahip olmayan; daha genel bir ifadeyle sorun teşkil eden bölgelerin yenilenmesine imkan sağlamaktadır. Kent merkezinde bulunan gecekondu alanları, kent merkezinin dışında kalan ya da kırsalda yer alan gecekondu bölgelerine yönelik getirilebilecek çözümlerle çözülemez. Bu nedenle kentsel dönüşüm uygulanabilecek bölgelerde, uyumlu ve modern bir kent imajı ile bütünleşebilecek, bulunduğu kente prestij kazandırabilecek tasarımlarla şekillenen dönüşüm işlemi tasarlanmalıdır. Diğer yandan barındırdıkları gecekondulu nüfusun sosyal, yaşamsal, ekonomi ve diğer problemlerini çözüme kavuşturmalıdır. Dönüşüm ancak sağlıklı veri envanteri, akılcı çözüm ve sağlam bir irade ile sağlanabilmektedir. Dönüşüm uygulamalarında coğrafi bilgi sistemlerinin kullanımı, sağlıklı projelerin tasarımı noktasında önem arz etmektedir. Bu noktadan yola çıkılarak bölgelerin, kadastral durumları, halihazır durumları vs. kriterleri tek tek ele alınmıştır. Kriterlerden maliyet kısmı üzerinde yapılan araştırmada; Şehitlik-Hızmalı-Karakoyun (ŞHK) bölgesinin ortalama arsa rayiç bedeli (m²) 40-50 TL, Yeşildirek (YŞD) bölgesi ise ağırlıklı olarak (m²) 120-150 TL olduğu Haliliye İlçe Belediye Başkanlığından öğrenilmiştir (URL2). Bu çalışmada yapılan bütün mekânsal analizlere altlık teşkil etmesi bakımından, CBS ye atfedilen önem bir kez daha gözler önüne serilmiştir. Çalışma alanında AHP yöntemiyle yapılan mekânsal analizler sonucunda Şehitlik-Hızmalı-Karakoyun bölgesinin % 59, Yeşildirek bölgesinin % 41 oranında öncelikli dönüşüme ihtiyaç duyduğu sonucuna varılmıştır (Şekil 7).
0
5
10
15
20
25
30
35
Mülkiyet ParselSayısı
Yapı adedi Yapı
durumuKent
merkezineuzaklık
Maliyet Jeolojikdurum
Eğim Sıcaklık
Kriter Ağırlık Grafiği (%)

UEMK 2019 Proceedings Book 24/25 October 2019 Gaziantep University, TURKEY
322
Şekil 7:Sonuç Grafiği Ayıca karar verme pozisyonundaki idarecilerin, herhangi bir kararsızlık anında problemlere karşı çözüm için ihtiyaç duyulan ve bu ihtiyaçları bilimsel ve matematiksel temele dayanan ikili mukayeseler ile AHP yönteminin ne denli işlevli bir yöntem olduğu görülmektedir.
Şekil 8: ŞHK Bölgesi İmar Planı Haritası
Kentsel Dönüşüm Öncelik Oranı
ŞHK
YŞD

UEMK 2019 Proceedings Book 24/25 October 2019 Gaziantep University, TURKEY
323
KAYNAKLAR Arabulan, S. (2015). Kentsel Dönüşüm Kapsamında Kimliğin Yeniden Kazanımı: Edirne - Karaağaç Örneği, Basılmamış Doktora Tezi, Trakya Üniversitesi Fen Bilimleri Enstitüsü, Edirne. Çetinsaya, V., 2004. “Çok Kriterli Kaynak Tahsisi Problemlerinin Optimizasyonunda Bulanık Karar Verme Yöntemlerinin Uygulanması”, Yıldız teknik Üniversitesi, Fen Bilimleri Enstitüsü Yüksek Lisans Tezi. Daşkıran, F., Ak, S. (2015). 6306 Sayılı Kanun Kapsamında Kentsel Dönüşüm, Yönetim ve Ekonomi Araştırmaları Dergisi, Cilt: 13, Sayı: 3. Demirkıran S. (2008). Türkiye’de Kentsel Dönüşüm Uygulamalarında Yerel Yönetimin rolü konulu Yüksek Lisans Tezi. Keleş R. (1984) “Kentlesme Ve Konut Politikası”, Ankara, Ankara Üniversitesi Siyasal Bilgiler Fakültesi Yayınları. Saaty T.L.,1980. “The Analytic Hierarcy Process” New York, McGraw-Hill. Şişman, A., Kibaroğlu, D. (2009). Dünyada Ve Türkiye’de Kentsel Dönüşüm Uygulamaları, TMMOB Harita ve Kadastro Mühendisleri Odası 12. Türkiye Harita Bilimsel ve Teknik Kurultayı, Ankara. TMMOB, (2012). Kentsel Dönüşüm Nedir?, TMMOB İnşaat Mühendisleri Odası, Ankara. Özkul, M. (2017). Dünyada Ve Türkiye’de Kentsel Dönüşüm Projelerinin Finansman Yöntemleri, Uzmanlık Tezi, İller Bankası Anonim Şirketi, Ankara URL1: https://www.karacadag.gov.tr/Planlama/Dosya/www.karacadag.gov.tr_31_BX0B70CW_sanliurfa_kentlesme_yasam_kalitesi_ve_kentsel_donusum_danisma_toplantisi_2014__2018.pdf URL 2: https://www.turkiye.gov.tr/haliliye-belediyesi-arsa-rayic URL 3: https://www.sanliurfa.bel.tr/birim/8/142/imar-ve-sehircilik-dairesi-baskanligi URL 4: http://www.mta.gov.tr/v3.0/ URL 5: https://www.mgm.gov.tr/veridegerlendirme/il-ve-ilceler-istatistik.aspx?m=SANLIURFA.
UEMK 2019 Proceedings Book 24/25 October 2019 Gaziantep University, TURKEY
324
APPLICATION OF ENERGY AND EXERGY ANALYSES TO
AN SI ENGINE OPERATED AT DIFFERENT ENGINE LOADS
WITH BIOFUEL-GASOLINE BLENDS
Bahar SAYIN KUL Selcuk University, Mechanical Engineering Department, Konya, Turkey
[email protected] İlker ÖRS Selcuk University, Department of Motor Vehicles and Transportation Technologies, Konya, Turkey
[email protected] Murat CİNİVİZ
Selcuk University, Mechanical Engineering Department, Konya, Turkey
[email protected] ABSTRACT: In this study, energy and exergy analyzes were applied to a single cylinder four stroke SI engine operated with base gasoline, biofuel-gasoline blends under different test conditions. The blends abbreviated as E10 and M10 prepared to contain 90% gasoline-10% ethanol, 90% gasoline-10% methanol. The engine test carried out under different engine loads varied from 2 Nm to 4 Nm for 2500 constant engine speed. It is found that maximum energy and exergy efficiencies are obtained as by 0.161, 0.201, 0.148% and 0.148, 0.186, 0.137% at 2.5 Nm for gasoline, E10, M10 respectively. Exergy destruction rate increases with increase in engine load and load-averaged values of gasoline, E10, M10 are found as 3.23, 2.91, 3.28 kW. Key words: Ethanol, Methanol, Gasoline, Energy Analysis, Exergy Analysis INTRODUCTION Alcohols such as ethanol and methanol are two interesting liquid biofuels with widespread usage for spark ignition (SI) engine powered vehicles (El-Emam & Desoky, 1985; Kowalewicz, 1993; Yüksel & Yüksel, 2004).One of the most important common characteristics of these fuels is that they can be used directly without requiring any major changes in the construction of the engine. But it seems that the operation of the engine at different test conditions with these alcohols is limited only by energy analysis. Energy
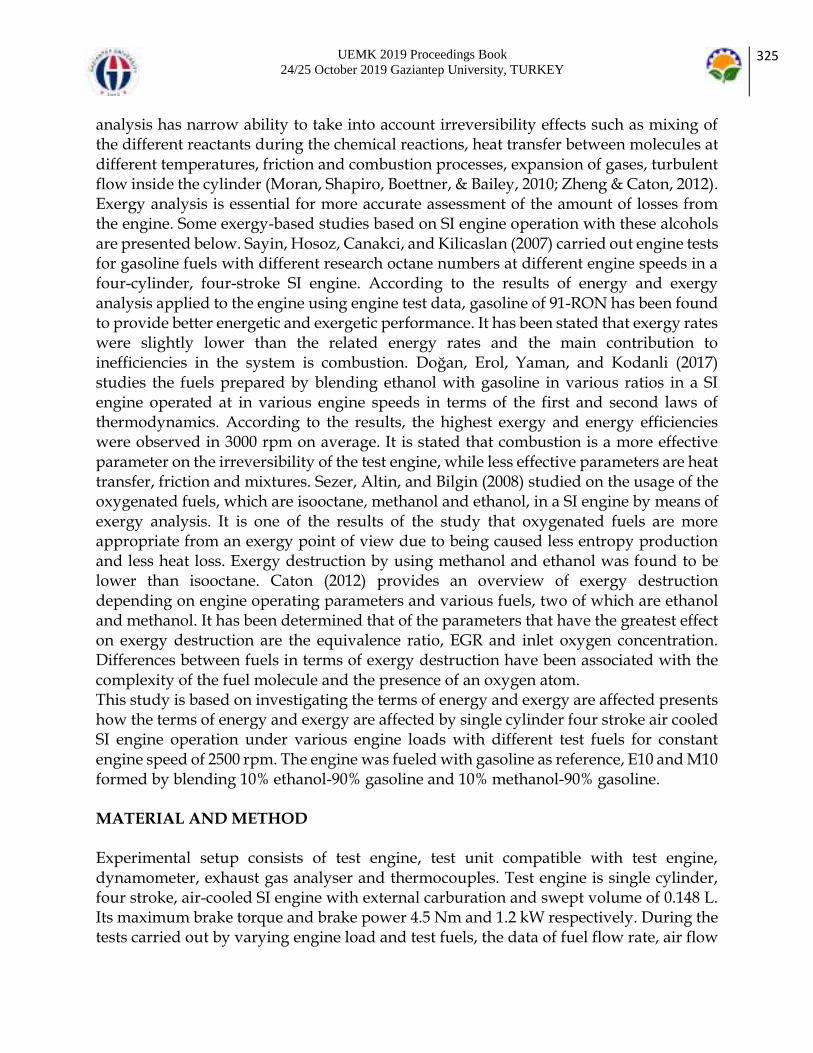
UEMK 2019 Proceedings Book 24/25 October 2019 Gaziantep University, TURKEY
325
analysis has narrow ability to take into account irreversibility effects such as mixing of the different reactants during the chemical reactions, heat transfer between molecules at different temperatures, friction and combustion processes, expansion of gases, turbulent flow inside the cylinder (Moran, Shapiro, Boettner, & Bailey, 2010; Zheng & Caton, 2012). Exergy analysis is essential for more accurate assessment of the amount of losses from the engine. Some exergy-based studies based on SI engine operation with these alcohols are presented below. Sayin, Hosoz, Canakci, and Kilicaslan (2007) carried out engine tests for gasoline fuels with different research octane numbers at different engine speeds in a four-cylinder, four-stroke SI engine. According to the results of energy and exergy analysis applied to the engine using engine test data, gasoline of 91-RON has been found to provide better energetic and exergetic performance. It has been stated that exergy rates were slightly lower than the related energy rates and the main contribution to inefficiencies in the system is combustion. Doğan, Erol, Yaman, and Kodanli (2017) studies the fuels prepared by blending ethanol with gasoline in various ratios in a SI engine operated at in various engine speeds in terms of the first and second laws of thermodynamics. According to the results, the highest exergy and energy efficiencies were observed in 3000 rpm on average. It is stated that combustion is a more effective parameter on the irreversibility of the test engine, while less effective parameters are heat transfer, friction and mixtures. Sezer, Altin, and Bilgin (2008) studied on the usage of the oxygenated fuels, which are isooctane, methanol and ethanol, in a SI engine by means of exergy analysis. It is one of the results of the study that oxygenated fuels are more appropriate from an exergy point of view due to being caused less entropy production and less heat loss. Exergy destruction by using methanol and ethanol was found to be lower than isooctane. Caton (2012) provides an overview of exergy destruction depending on engine operating parameters and various fuels, two of which are ethanol and methanol. It has been determined that of the parameters that have the greatest effect on exergy destruction are the equivalence ratio, EGR and inlet oxygen concentration. Differences between fuels in terms of exergy destruction have been associated with the complexity of the fuel molecule and the presence of an oxygen atom. This study is based on investigating the terms of energy and exergy are affected presents how the terms of energy and exergy are affected by single cylinder four stroke air cooled SI engine operation under various engine loads with different test fuels for constant engine speed of 2500 rpm. The engine was fueled with gasoline as reference, E10 and M10 formed by blending 10% ethanol-90% gasoline and 10% methanol-90% gasoline. MATERIAL AND METHOD Experimental setup consists of test engine, test unit compatible with test engine, dynamometer, exhaust gas analyser and thermocouples. Test engine is single cylinder, four stroke, air-cooled SI engine with external carburation and swept volume of 0.148 L. Its maximum brake torque and brake power 4.5 Nm and 1.2 kW respectively. During the tests carried out by varying engine load and test fuels, the data of fuel flow rate, air flow

UEMK 2019 Proceedings Book 24/25 October 2019 Gaziantep University, TURKEY
326
rate, exhaust emissions, ambient temperature, surface temperature, exhaust temperature were noted on test unit. Temperatures were read with the help of K type thermocouples. The carbon monoxide (CO) and carbon dioxide (CO2), hydrocarbon (HC), nitrogen oxide (NOx) emissions was measured by Mobydic 5000 exhaust gas analyzer. When gasoline, one of the test fuels, is supplied from an oil station and others were formed by blending ethanol and methanol with gasoline in the specified proportions. During the application of the mass, energy and exergy balances, formulated as in Eq. (1-3), SI engine is thought to be as an open thermodynamic system with continuous flow.
. . .
f a exhm m m (1)
. . .
f exh lostE W E E (2)
. .
. . . . .
f W exh ht destA A A A A (3)
The parameters needed for exergy balance are calculated by the following related equations.
. .(1.0401 0.1728 0.0432 0.2169 (1 2.0628 ))f f u
h o hA m H
c c c c
(4)
WA W
.
(5)
,
. .
0 0
1 1
[( ( ) ( ) ) ( ln )]exh i exh
n ni
i i i a i i a i eii i
yA m a h h T s s RT a
y
(6)
. .(1 )ht
alost
es
TA E
T (7)
By replacing an exergy term in the exergy balance, the exergy destruction rate attributed to irreversibilities, is calculated. RESULTS AND FINDINGS Energy exergy distributions for gasoline, E10 and M10 fuels are presented in the following figures. When both the energy and exergy distributions of all test fuels were examined, a gradual increase was observed with the increase of the load for both distributions. The meaning of increased fuel energy and exergy rate with the addition of ethanol and methanol when the lower heating values decreases is: the flow rate of fuel entering the engine to obtain the same power has increased. It has been found that the lost energy rate has the largest share among the energy distributions. In terms of exergy distributions, the term with the highest rate is exergy destruction. Exergy rate through heat transfer is the term following exergy destruction as second one. Exhaust exergy was the next term in the ranking.
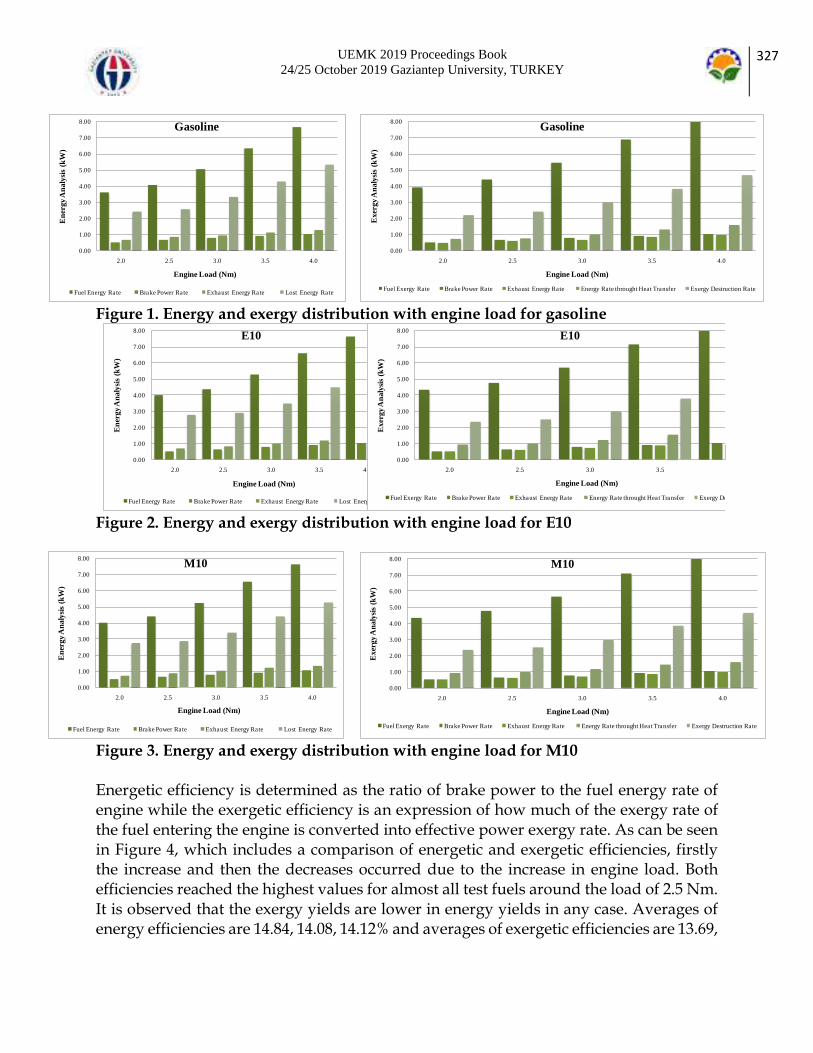
UEMK 2019 Proceedings Book 24/25 October 2019 Gaziantep University, TURKEY
327
Figure 1. Energy and exergy distribution with engine load for gasoline
Figure 2. Energy and exergy distribution with engine load for E10
Figure 3. Energy and exergy distribution with engine load for M10 Energetic efficiency is determined as the ratio of brake power to the fuel energy rate of engine while the exergetic efficiency is an expression of how much of the exergy rate of the fuel entering the engine is converted into effective power exergy rate. As can be seen in Figure 4, which includes a comparison of energetic and exergetic efficiencies, firstly the increase and then the decreases occurred due to the increase in engine load. Both efficiencies reached the highest values for almost all test fuels around the load of 2.5 Nm. It is observed that the exergy yields are lower in energy yields in any case. Averages of energy efficiencies are 14.84, 14.08, 14.12% and averages of exergetic efficiencies are 13.69,
0.00
1.00
2.00
3.00
4.00
5.00
6.00
7.00
8.00
2.0 2.5 3.0 3.5 4.0
Ene
rgy
Ana
lysi
s (k
W)
Engine Load (Nm)
Gasoline
Fuel Energy Rate Brake Power Rate Exhaust Energy Rate Lost Energy Rate
0.00
1.00
2.00
3.00
4.00
5.00
6.00
7.00
8.00
2.0 2.5 3.0 3.5 4.0
Exe
rgy
Ana
lysi
s (k
W)
Engine Load (Nm)
Gasoline
Fuel Exergy Rate Brake Power Rate Exhaust Energy Rate Energy Rate throught Heat Transfer Exergy Destruction Rate
0.00
1.00
2.00
3.00
4.00
5.00
6.00
7.00
8.00
2.0 2.5 3.0 3.5 4.0
Ene
rgy
Ana
lysi
s (k
W)
Engine Load (Nm)
E10
Fuel Energy Rate Brake Power Rate Exhaust Energy Rate Lost Energy Rate
0.00
1.00
2.00
3.00
4.00
5.00
6.00
7.00
8.00
2.0 2.5 3.0 3.5 4.0
Exe
rgy
Ana
lysi
s (k
W)
Engine Load (Nm)
E10
Fuel Exergy Rate Brake Power Rate Exhaust Energy Rate Energy Rate throught Heat Transfer Exergy Destruction Rate
0.00
1.00
2.00
3.00
4.00
5.00
6.00
7.00
8.00
2.0 2.5 3.0 3.5 4.0
Ene
rgy
Ana
lysi
s (k
W)
Engine Load (Nm)
M10
Fuel Energy Rate Brake Power Rate Exhaust Energy Rate Lost Energy Rate
0.00
1.00
2.00
3.00
4.00
5.00
6.00
7.00
8.00
2.0 2.5 3.0 3.5 4.0
Exe
rgy
Ana
lysi
s (k
W)
Engine Load (Nm)
M10
Fuel Exergy Rate Brake Power Rate Exhaust Energy Rate Energy Rate throught Heat Transfer Exergy Destruction Rate

UEMK 2019 Proceedings Book 24/25 October 2019 Gaziantep University, TURKEY
328
12.98, 13.00 % by load for gasoline, E10 and M10 respectively. That is, both ethanol addition and metanol addition reduce energetic and exergetic efficiencies, but further reduction occurs in the case of the usage of methanol in fuel.
Figure 4. Energetic and exergetic efficiencies with engine load CONCLUSION The results of this study investigating the energetic and exergetic performance of a single cylinder four stroke SI engine fueled with gasoline, E10 (10% ethanol and 90% gasoline) and M10 (10% methanol and 90% gasoline) . Engine was operated with these at various engine loads of 2, 2.5, 3, 3.5,4 Nm and constant engine speed of 2500 rpm are as follows. It was observed that all energy and energy parameters were affected in ascending direction by increasing engine load. Although fuel energy and exergy rate increases with ethanol or methanol addition, losses also increases while engine brake power remains constant (for engine operation with different fuels under the same load). Exergy rates have been found to have a similar tendency with the related energy rates. Among exergy terms, the order from highest to low is as follows: exergy destruction rate, exergy rate through heat transfer and exhaust exergy rate while the lost energy rate is remarkable for energy analysis. The addition of alcohol reduced both energy and exergy yields. Ethanol may be preferred instead of metanol as alcohol since energetic and exergetic efficiencies are slightly higher. REFERENCES Caton, J. A. (2012). Exergy destruction during the combustion process as functions of operating and design parameters for a spark‐ignition engine. International Journal of Energy Research, 36(3), 368-384. Doğan, B., Erol, D., Yaman, H., & Kodanli, E. (2017). The effect of ethanol-gasoline blends on performance and exhaust emissions of a spark ignition engine through exergy analysis. Applied Thermal Engineering, 120, 433-443. doi:https://doi.org/10.1016/j.applthermaleng.2017.04.012

UEMK 2019 Proceedings Book 24/25 October 2019 Gaziantep University, TURKEY
329
El-Emam, S. H., & Desoky, A. A. (1985). A study on the combustion of alternative fuels in spark-ignition engines. International Journal of Hydrogen Energy, 10(7), 497-504. doi:https://doi.org/10.1016/0360-3199(85)90079-5 Kowalewicz, A. (1993). Methanol as a fuel for spark ignition engines: a review and analysis. Proceedings of the Institution of Mechanical Engineers, Part D: Journal of Automobile Engineering, 207(1), 43-52. Moran, M. J., Shapiro, H. N., Boettner, D. D., & Bailey, M. B. (2010). Fundamentals of engineering thermodynamics: John Wiley & Sons. Sayin, C., Hosoz, M., Canakci, M., & Kilicaslan, I. (2007). Energy and exergy analyses of a gasoline engine. International Journal of Energy Research, 31(3), 259-273. Sezer, I., Altin, I., & Bilgin, A. (2008). Exergetic analysis of using oxygenated fuels in spark-ignition (SI) engines. Energy & Fuels, 23(4), 1801-1807. Yüksel, F., & Yüksel, B. (2004). The use of ethanol–gasoline blend as a fuel in an SI engine. Renewable Energy, 29(7), 1181-1191. Zheng, J., & Caton, J. A. (2012). Second law analysis of a low temperature combustion diesel engine: Effect of injection timing and exhaust gas recirculation. Energy, 38(1), 78-84. doi:https://doi.org/10.1016/j.energy.2011.12.034.

UEMK 2019 Proceedings Book 24/25 October 2019 Gaziantep University, TURKEY
330
FLEXURAL STRENGTH OF AUTOCLAVED AERATED
CONCRETE PANELS REINFORCED WITH STEEL REBARS
Derya BAKBAK The Grand National Assembly of Turkey (TBMM) [email protected] Ahmet Emin KURTOGLU Istanbul Rumeli University [email protected] ABSTRACT: Autoclaved aerated concrete (AAC) provides superior material characteristics such as high thermal insulation and low density. Also, AAC is considered to be environment friendly and it reduces the design and transportation costs thanks to lightweight nature. In this study, reinforced aerated concrete panels (RAACPs) were tested by cyclic and monotonic loading procedures. Two point bending test is applied using universal testing machine with a maximum capacity of 500 kN. Displacement controlled testing procedure is conducted both for monotonic and cyclic loading. Load and mid-span deflection are measured. The results show that ultimate load is higher for monotonic loading case and is achieved slightly faster as compared to cyclic loading. The performance of RAACPs under seismic loading is expected to be superior since the performance under cyclic loading is close to that of monotonic loading. This superior performance is attributed to the low density and homogenous nature of AAC. Thus, this provides a significant advantage in the areas where earthquake risk exist. Key words: lightweight concrete, autoclaved aerated concrete, reinforced concrete panel, cyclic loading INTRODUCTION Autoclaved aerated concrete (AAC) is a type of lightweight concrete made of cement or lime mortar containing air voids entrapped in the matrix by means of an expansion agent. It has been used in the construction industry for non-structural and structural applications since mid-1920s. By volume, 70-80% of AAC consists of air voids, resulting in lower density which minimizes the design cost and labor (Thongtha, 2014). The materials generally used in the production of AAC are (i) siliceous material (silica flour or finely ground siliceous sand), (ii) binding material (Portland cement with quick lime),

UEMK 2019 Proceedings Book 24/25 October 2019 Gaziantep University, TURKEY
331
(iii) aluminum powder and (iv) entrapping agent (Desai, 2002). AAC is considered to be environmentally friendly material as it reduces 70% and 40% energy per material volume as compared to normal concrete and bricks, respectively. It also provides high thermal insulation and eliminate the requirement of using extra insulation material (Qu and Zao 2017, Bonakdar 2013). Production of AAC panel elements with reinforcement can offer an alternative for low-rise precast construction. 60% of new building constructions in Europe are built with different types of AAC elements (Taghipour et al., 2018). In the housing industry in China, reinforced AAC materials for exterior walls are preferred to other materials (Taghipour et al., 2018). For reinforced AAC (RAAC) elements, steel bar cages are manufactured by spot-welding of steel bars to the U-shaped links. The cages are treated with protective coating against corrosion. Earlier studies on the mechanical properties of RAAC members are very limited. Matsumura (1984) investigated the Shear behavior of reinforced autoclaved lightweight cellular concrete members. Aroni and Cividini (1989) studied the shear strength of reinforced slabs made of autoclaved aerated concrete without shear reinforcement. Alengaram et al. (2010) studied on foamed aerated concrete reinforced beams with palm kernel shell as aggregate. Taghipour et al. (2018) studied the seismic behavior of reinforced AAC vertical load-bearing wall panels under constant axial load and two-way cyclic lateral displacement excursions. Kurtoglu and Bakbak (2019) proposed models to predict the shear strength of reinforced aerated concrete slabs via support vector machines and artificial neural networks. EXPERIMENTAL WORK Reinforced AAC panels (RAACPs) were produced by YTONG Gaziantep firm, Gaziantep, Turkey. All production processes are made in accordance with TS EN 12602 standard. Two panel specimens were prepared. (Fig. 1) Both specimens had identical properties such as mechanical performance, reinforcement geometry and placement. Each RAACP specimen has a dimension of 1000 mm length, 600 mm width and 200 mm depth. Top and bottom reinforcement details are shown in Fig. 1.
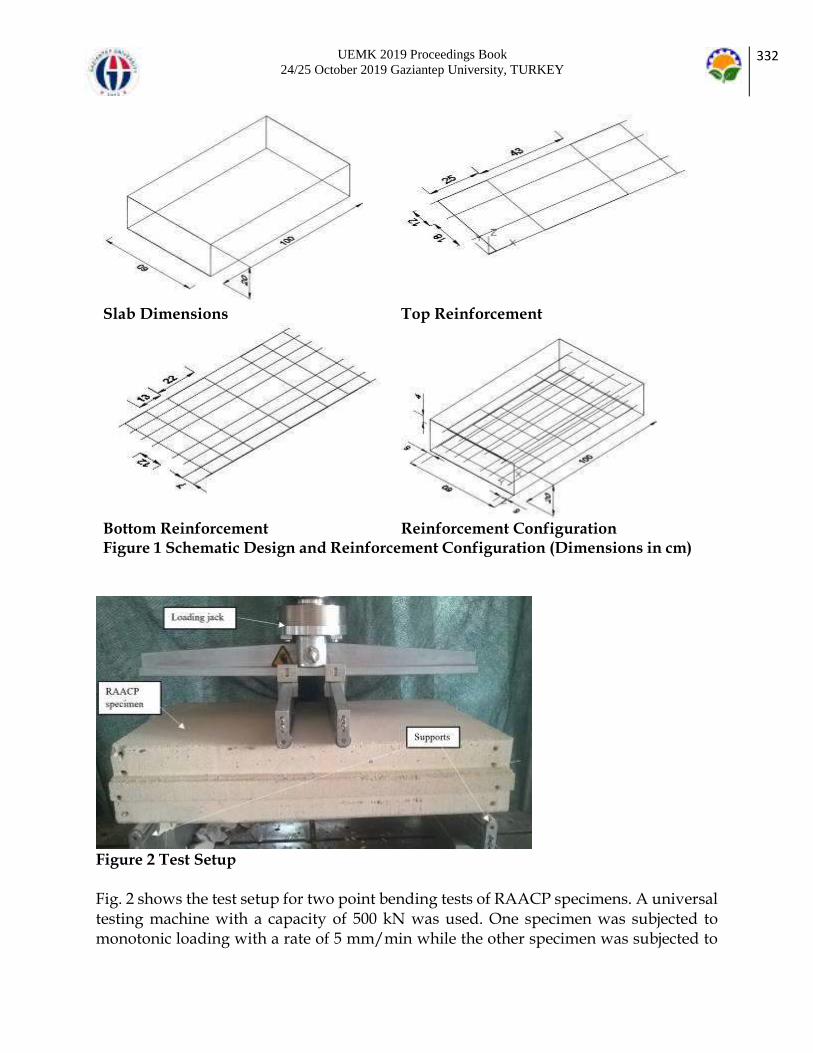
UEMK 2019 Proceedings Book 24/25 October 2019 Gaziantep University, TURKEY
332
Slab Dimensions Top Reinforcement
Bottom Reinforcement Reinforcement Configuration Figure 1 Schematic Design and Reinforcement Configuration (Dimensions in cm)
Figure 2 Test Setup Fig. 2 shows the test setup for two point bending tests of RAACP specimens. A universal testing machine with a capacity of 500 kN was used. One specimen was subjected to monotonic loading with a rate of 5 mm/min while the other specimen was subjected to
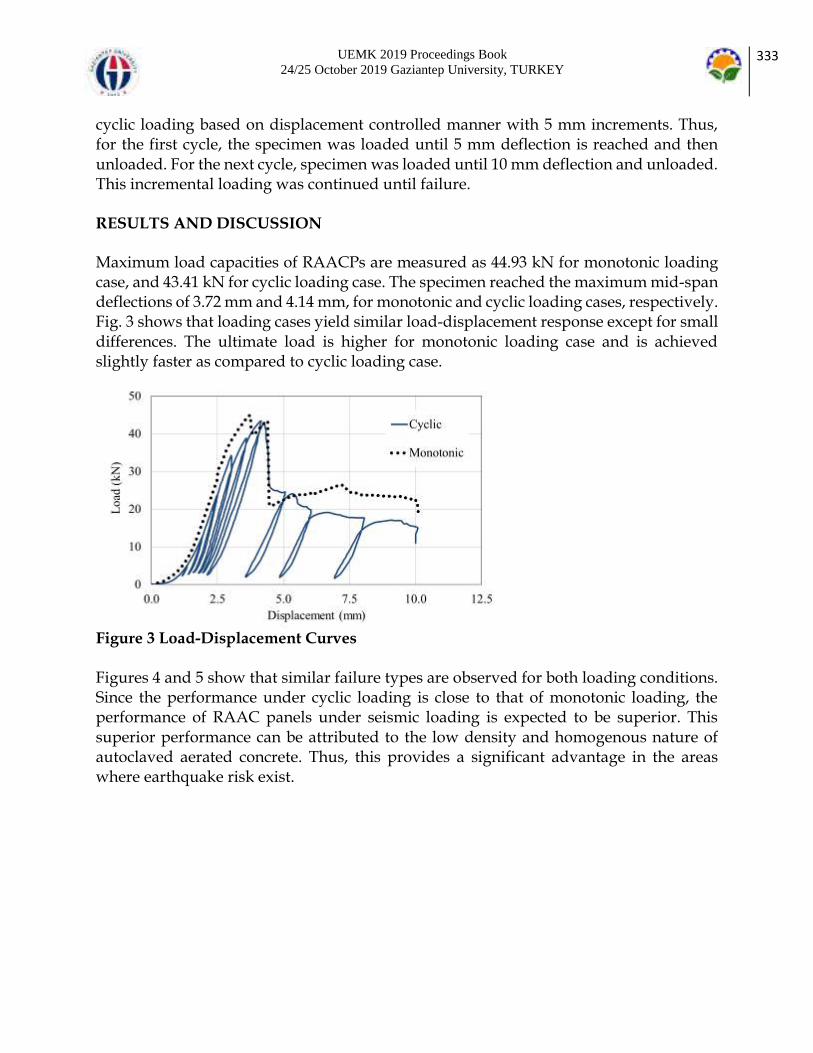
UEMK 2019 Proceedings Book 24/25 October 2019 Gaziantep University, TURKEY
333
cyclic loading based on displacement controlled manner with 5 mm increments. Thus, for the first cycle, the specimen was loaded until 5 mm deflection is reached and then unloaded. For the next cycle, specimen was loaded until 10 mm deflection and unloaded. This incremental loading was continued until failure. RESULTS AND DISCUSSION Maximum load capacities of RAACPs are measured as 44.93 kN for monotonic loading case, and 43.41 kN for cyclic loading case. The specimen reached the maximum mid-span deflections of 3.72 mm and 4.14 mm, for monotonic and cyclic loading cases, respectively. Fig. 3 shows that loading cases yield similar load-displacement response except for small differences. The ultimate load is higher for monotonic loading case and is achieved slightly faster as compared to cyclic loading case.
Figure 3 Load-Displacement Curves Figures 4 and 5 show that similar failure types are observed for both loading conditions. Since the performance under cyclic loading is close to that of monotonic loading, the performance of RAAC panels under seismic loading is expected to be superior. This superior performance can be attributed to the low density and homogenous nature of autoclaved aerated concrete. Thus, this provides a significant advantage in the areas where earthquake risk exist.

UEMK 2019 Proceedings Book 24/25 October 2019 Gaziantep University, TURKEY
334
Figure 4 Failed RAACP (cyclic loading)
Figure 5 Failed RAACP (monotonic loading) ACKNOWLEDGMENTS Authors would like to thank YTONG Gaziantep firm and Dr. Ali Khaled HUSSEIN for their support and sponsorship of the tests. REFERENCES

UEMK 2019 Proceedings Book 24/25 October 2019 Gaziantep University, TURKEY
335
Alengaram, U. J., Mahmud, H., Jumaat, M. Z., & Shirazi, S. M. (2010). Effect of aggregate size and proportion on strength properties of palm kernel shell concrete. International Journal of the Physical Sciences, 5(12), 1848-1856. Aroni, S., & Cividini, B. (1989). Shear strength of reinforced aerated concrete slabs. Materials and Structures, 22(6), 443-449. Bonakdar, A., Babbitt, F., & Mobasher, B. (2013). Physical and mechanical characterization of fiber-reinforced aerated concrete (FRAC). Cement and Concrete Composites, 38, 82-91. Desai, S. (2002). Reinforced autoclaved aerated concrete roof slabs. In Innovations and Developments In Concrete Materials And Construction: Proceedings of the International Conference held at the University of Dundee, Scotland, UK on 9–11 September 2002 (pp. 523-532). Thomas Telford Publishing. Kurtoğlu, A. E., & Bakbak, D. (2019). Modeling the Shear Strength of Reinforced Aerated Concrete Slabs via Support Vector Regression. International Journal of Engineering Technologies, 5(1), 6-14. Kurtoğlu, A. E., & Bakbak, D. (2019). Shear Resistance of Reinforced Aerated Concrete Slabs: Prediction via Artificial Neural Networks, Journal of Sustainable Construction Materials and Technologies, In press. Matsumura, A. (1984). Shear strength and behavior of reinforced autoclaved lightweight cellular concrete members. Trans. Architect. Inst. Jpn, 343, 13-23. Taghipour, A., Canbay, E., Binici, B., Aldemir, A., Uzgan, U., & Eryurtlu, Z. (2018). Seismic behavior of reinforced autoclaved aerated concrete wall panels. ce/papers, 2(4), 259-265. Thongtha, A., Maneewan, S., Punlek, C., & Ungkoon, Y. (2014). Investigation of the compressive strength, time lags and decrement factors of AAC-lightweight concrete containing sugar sediment waste. Energy and Buildings, 84, 516-525. TS EN 12602, (2011). Önyapımlı donatılı gazbeton yapı elemanları, Türk Standartları Enstitüsü, (in Turkish). Qu, X., & Zhao, X. (2017). Previous and present investigations on the components, microstructure and main properties of autoclaved aerated concrete–A review. Construction and Building Materials, 135, 505-516.

UEMK 2019 Proceedings Book 24/25 October 2019 Gaziantep University, TURKEY
336
DECENTRALIZED CONTROL STRATEGY FOR FUEL CELL
INVERTERS WITH GRID INTEGRATION
Mustafa İNCİ İskenderun Technical University, Department of Mechatronics Engineering, 31200, İskenderun, Hatay [email protected] ABSTRACT: In order to simplify the grid connection of fuel cells and obtain high performance, this study presents a single-stage cascaded fuel cell inverter system with grid interconnection. For this, a decentralized power flow control strategy is performed in a single stage cascaded fuel cell inverter system. In the system structure, inputs of cascaded inverters are directly connected to each fuel cell stack, and inverters are series-connected at the output-side. This output is integrated with an electrical grid. With this topology, additional dc-dc converter is eliminated from the system, and presented a low-cost solution with a reliable structure is presented. For this, a module control strategy based on current control is implemented in each inverter structure. The performance results of the system are obtained by using Simulink program. In the designed system, it is connected to local resistive loads, which become active at different durations. In this way, the system is tested for different load conditions. Simulation results show the applicability of the designed system under changeable load conditions. Also, harmonic analysis of supplied current is performed up to 25th component. Key words: Decentralized control, fuel cells, single-stage system, grid integration. INTRODUCTION With the changes in the energy industry, interest in the renewable energy field is increasing day by day. Renewable energy supported by photovoltaic systems, wind turbines and fuel cells, has become more important over the years (Dhakouani, Znouda, & Bouden, 2019; Samy, Barakat, & Ramadan, 2019). Among these, the obvious advantages of fuel cells make them applicable in a variety of applications. Fuel cells are devices with superior features such as high efficiency and low emissions (İnci & Türksoy, 2019). In recent years, fuel cells with increasing power ratings have been applied for the integration of electrical grids with single or photovoltaic/wind energy units (Sun, Jin, Pan, Shen, & Lee, 2019). The integration of electrical grids with fuel cells and/or photovoltaic/wind units are known as grid-connected renewable systems.

UEMK 2019 Proceedings Book 24/25 October 2019 Gaziantep University, TURKEY
337
In conventional grid-connected systems, fuel cells are connected to utility-grids through dc-dc converter, inverter, filter and transformer (optional) (Hatziadoniu, Lobo, Pourboghrat, & Daneshdoost, 2002; Kyoungsoo & Rahman, 1998; Mazumder, Burra, Huang, Tahir, & Acharya, 2010), as shown in Figure 1. For conventional PV systems, dc voltages at fuel cells’ outputs are generally stepped up to higher voltage levels, and centralized inverter is used to convert dc voltage into ac voltage for the grid integration (Chandrasekaran & Gokdere, 2004; Nymand & Andersen, 2010). However, the system reliability is fairly low and a central inverter is required for this structure type (Luo et al., 2018).
Figure 1. Conventional grid-connected fuel cell system In order to improve the system stability and reduce the system cost, a grid-connected single-stage fuel cell inverter system is proposed in this paper. In this study, a high step-up dc-dc conversion is eliminated and additional dc-dc converter is removed in the system structure, which increases system reliability with a low-cost solution (Jafarian, Kim, & Parkhideh, 2018). In the presented system, the output voltage of each module is controlled independently and each inverter is connected to separate output filter (Al-Shetwi, Sujod, & Blaabjerg, 2018). The key properties of the grid-connected single-stage PV inverter system in this study are described as follows: Total output voltage of fuel cell inverters at the point of common coupling (PCC) is equal to the summation of produced ac voltages of each fuel cell inverter. The complete number of fuel cell inverter is specified by the operating voltage of local fuel cell stacks. Single-stage grid-connected fuel cell system reduces dc / dc power conversion connection (Luo et al., 2018). Also, it has a high conversion efficiency, low-cost advantages and suitable for medium power applications. Compared with a conventional system, the system reliability is increased. Also, the presented system can generate output voltage/current with low distortion through multi-inverter control. The paper structure is organized as follows: The system configuration and system elements are given in “System structure”. The control strategy is presented in “Module Control Method”. The performance and case studies are given in “Simulation results”. A short brief is given in “Conclusion”. SYSTEM STRUCTURE
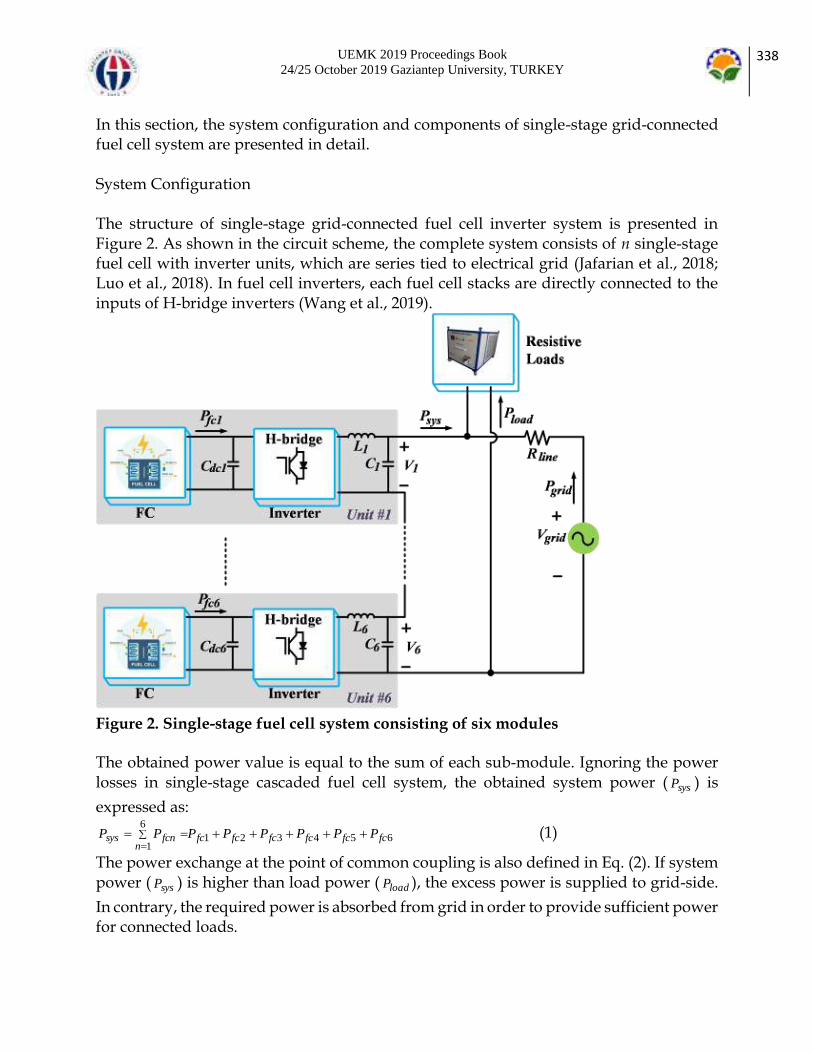
UEMK 2019 Proceedings Book 24/25 October 2019 Gaziantep University, TURKEY
338
In this section, the system configuration and components of single-stage grid-connected fuel cell system are presented in detail. System Configuration The structure of single-stage grid-connected fuel cell inverter system is presented in Figure 2. As shown in the circuit scheme, the complete system consists of n single-stage fuel cell with inverter units, which are series tied to electrical grid (Jafarian et al., 2018; Luo et al., 2018). In fuel cell inverters, each fuel cell stacks are directly connected to the inputs of H-bridge inverters (Wang et al., 2019).
Figure 2. Single-stage fuel cell system consisting of six modules The obtained power value is equal to the sum of each sub-module. Ignoring the power losses in single-stage cascaded fuel cell system, the obtained system power ( sysP ) is
expressed as:
6543216
1fcfcfcfcfcfc
nfcnsys PPPPPPPP
(1)
The power exchange at the point of common coupling is also defined in Eq. (2). If system power ( sysP ) is higher than load power ( loadP ), the excess power is supplied to grid-side.
In contrary, the required power is absorbed from grid in order to provide sufficient power for connected loads.

UEMK 2019 Proceedings Book 24/25 October 2019 Gaziantep University, TURKEY
339
0 gridloadsys PPPP (2)
System Components In the designed system, proton exchange membrane fuel cell (PEMFC) is used in the energy generation unit, which is high efficient (İnci & Türksoy, 2019). The dynamic operation of PEMFC is expressed according to open-circuit voltage ( ocV ), internal
resistive voltage ( ohmicV ) and polarization voltage ( dV ) (Chen, Han, Li, Liu, & Peng, 2014;
Li, Chen, Liu, Zhou, & Ma, 2015).
docfc VVVV (3) The extended-expression of ocV is given as (Li et al., 2015):
OH
OHococ P
PP
zF
RT
zFTVKV
2
2/122ln
43,44)298( (4)
cK is a fixed numeric quantity in ( 1/ sAkmol ).
T is the temperature in Kelvin. F is faraday.
oV is an electromotive force for a pressure value.
The ohmic overvoltage is given below:
ohmicfcohmic RiV (5)
dV is the absolute polarization overvoltage and expressed below(Li et al., 2015):
)/ln( ofcd iiANV (6)
N is the quantity of cells. A is Tafel slope
oi is exchange current.
The nominal power rating of PEMFC is 3.12 kW which its operating point is defined as 60 A, 52 V. The electrical characteristics of used PEMFC is introduced in Figure 3.

UEMK 2019 Proceedings Book 24/25 October 2019 Gaziantep University, TURKEY
340
Figure 3. Electrical characteristics of PEMFC in the designed system The most well-known inverter structure to generate a single-phase ac voltage is H-bridge inverter, also called as a full-bridge inverter. The equivalent scheme of an H-bridge inverter is shown in Figure 4. As shown in the scheme, it includes four switching elements in order to convert dc voltage into ac voltage.
Figure 4. H-bridge inverter connected to the single-stage cascaded fuel cell system In an H-bridge inverter topology, the output ac voltage ( nV ) is the difference between two
points. It is expressed as (Kang, Park, Cho, & Kim, 2005):
yxn VVV (7)
Dc energy generated by the fuel cell is converted into ac form by using inverter units. In the system, full (H) bridge inverter is used as dc-ac converter. The output voltage of an H-bridge inverter is defined as (Kim, 2017):

UEMK 2019 Proceedings Book 24/25 October 2019 Gaziantep University, TURKEY
341
non
nn tnVtV
sin
1 (8)
An H-bridge inverter provides ac load voltage with rms value corresponding to ninety percent of input dc voltage (Kim, 2017).
dcdc
rmsn VV
V 9.04
2
1_1
(9)
The single-stage fuel cell inverters are series-connected, the voltage at point of common coupling is the summation of output voltages. It is calculated as:
6
1nnsys VV (10)
For the designed system, n is 6. Therefore, output voltage is:
6543216
1VVVVVVVV
nnsys
(11)
MODULE CONTROL METHOD This section presents the decentralized power flow control method used in the single-stage fuel cell system. In cascaded system structure, it includes six series inverter modules, and it is aimed to control each inverter module smoothly by keeping dc-link voltage constant at 52 V. In the designed system, total power supplied to load/grid is the sum of power values of each module. For this, all modules are designed and controlled symmetrically. Figure 5 introduces the detailed control block of the decentralized control method for each module (Jafarian et al., 2018; Luo et al., 2018).
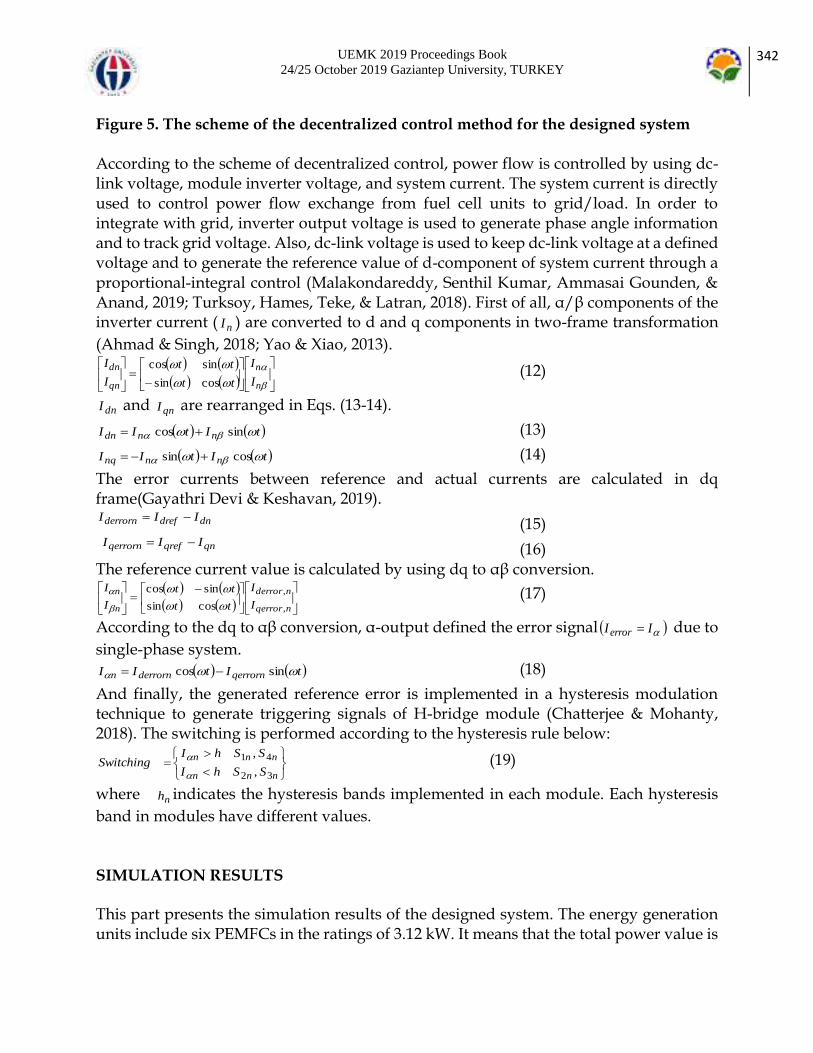
UEMK 2019 Proceedings Book 24/25 October 2019 Gaziantep University, TURKEY
342
Figure 5. The scheme of the decentralized control method for the designed system According to the scheme of decentralized control, power flow is controlled by using dc-link voltage, module inverter voltage, and system current. The system current is directly used to control power flow exchange from fuel cell units to grid/load. In order to integrate with grid, inverter output voltage is used to generate phase angle information and to track grid voltage. Also, dc-link voltage is used to keep dc-link voltage at a defined voltage and to generate the reference value of d-component of system current through a proportional-integral control (Malakondareddy, Senthil Kumar, Ammasai Gounden, & Anand, 2019; Turksoy, Hames, Teke, & Latran, 2018). First of all, α/β components of the inverter current ( nI ) are converted to d and q components in two-frame transformation
(Ahmad & Singh, 2018; Yao & Xiao, 2013).
n
n
qn
dn
I
I
tt
tt
I
I
cossin
sincos (12)
dnI and qnI are rearranged in Eqs. (13-14).
tItII nndn sincos (13)
tItII nnnq cossin (14)
The error currents between reference and actual currents are calculated in dq frame(Gayathri Devi & Keshavan, 2019).
dndrefderrorn III (15)
qnqrefqerrorn III (16)
The reference current value is calculated by using dq to αβ conversion.
nqerror
nderror
n
n
I
I
tt
tt
I
I
,
,
cossin
sincos
(17)
According to the dq to αβ conversion, α-output defined the error signal IIerror due to
single-phase system.
tItII qerrornderrornn sincos (18)
And finally, the generated reference error is implemented in a hysteresis modulation technique to generate triggering signals of H-bridge module (Chatterjee & Mohanty, 2018). The switching is performed according to the hysteresis rule below:
nnn
nnn
SShI
SShISwitching
32
41
,
,
(19)
where nh indicates the hysteresis bands implemented in each module. Each hysteresis
band in modules have different values. SIMULATION RESULTS This part presents the simulation results of the designed system. The energy generation units include six PEMFCs in the ratings of 3.12 kW. It means that the total power value is

UEMK 2019 Proceedings Book 24/25 October 2019 Gaziantep University, TURKEY
343
equal to 18.72 kW for nominal condition. Fuel cells are connected to single-phase 220 Vrms/50 Hz electrical grid, which its peak value is 311 V. Also three loads (load 1=4 Ω, load 2=5 Ω, load 3= 3 Ω) are connected to the point of common coupling. For this, the system is modeled by using Simulink environment program. The designed system is tested for different load situations. The situations are given as follows: State 1: no-load condition between 0.0 s and 0.5 s State 2: load 1 is active between t=0.5 s and 1.0 s State 3: load 1 and load 2 are active between t=1.0 s and 1.7 s State 4: load 2 is active between t=1.7 s and 2.1 s State 5: load 2 and load 3 are active between t=2.1 s and 2.5 s Figure 6 presents the fuel cell voltage and inverter voltage for each module. Fuel cell voltage is equal to 52 V at output. Inverter converts fuel cell voltage in dc form into ac form. Figure 7 shows system currents, load currents and grid currents for five states. It is clear that loads don’t draw currents from the system/grid for first state. All of system currents flow into the grid-side. When load 1 becomes active at t=0.5 s, the current value increases at load-side. The excess power is supplied to grid for state 2. In state 3, Load 2 turns on at t=1.0 s, and the loads consume more power compared to previous states. Thus, the grid current reduces to lower values in comparison with state 2. In state 4, load 1 is turned off while load 2 is active. Therefore, the excess power supplied to grid increases. In state 5, load 2 and load 3 become active. This state cause more power consumed by loads.

UEMK 2019 Proceedings Book 24/25 October 2019 Gaziantep University, TURKEY
344
Figure 6. Fuel cell and inverter voltages for each module Figure 8 shows the curve of load currents versus grid currents for different states. For state 1, grid current is 118.2 A while load current is zero. In state 2, load current increases to 78.1 A and grid current decreases to 39.3 A. The current values of load and grid are 140.5 A and 24.1 A for state 3, respectively. In state 4, 117.4 A and 54.7 A are values of load and grid currents. In state 5, the values of load/grid currents are 166.3 and 47.9 A. The power values of system, load and grid are presented in Figure 9. As shown in the results, it is performed at no-load condition for first state. The system power is constant and it is equal to 18.1 kW for all states. The supplied power to grid is 18.4 kW. Then, load 1 is active and consumed load power increases. Load power is equal to 12.1 kW for state 1. When load 2 is turned on, the consumed load power increases to 21.9 kW. Also, the extra power is consumed from grid and its value 3.45 kW. In state 4, load 2 is active and excess power is supplied to grid. In state 5, load 2 and load 3 are in on-state. In this state, a power in the rating of 7.5 kW is consumed from the grid.
1.17 1.18 1.19 1.2 1.21 1.22 1.23 1.240
10
20
30
60V
1.17 1.18 1.19 1.2 1.21 1.22 1.23 1.24
40
60
-60
-40
-20
0
20
1.16
fcn
Vn
40
50
VV
Time (s)
Fuel Cell Voltage
Inverter Voltage
( )
( )
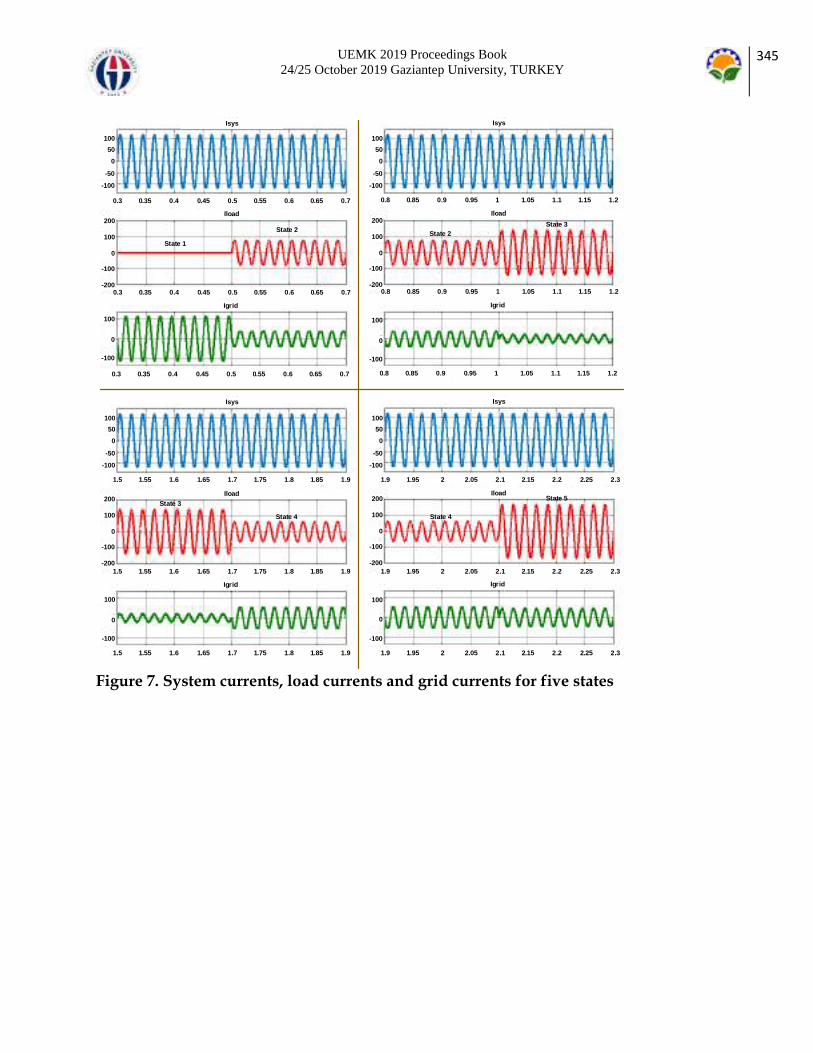
UEMK 2019 Proceedings Book 24/25 October 2019 Gaziantep University, TURKEY
345
Figure 7. System currents, load currents and grid currents for five states
Isys Isys
Iload Iload
Igrid Igrid
Isys Isys
Iload Iload
Igrid Igrid
100
50
0
-50
-100
100
50
0
-50
-100
100
50
0
-50
-100
100
50
0
-50
-100
200
100
0
-100
-200
200
100
0
-100
-200
200
100
0
-100
-200
200
100
0
-100
-200
100
0
-100
100
0
-100
0.3 0.35 0.4 0.45 0.5 0.55 0.6 0.65 0.7 0.8 0.85 0.9 0.95 1 1.05 1.1 1.15 1.2
0.3 0.35 0.4 0.45 0.5 0.55 0.6 0.65 0.7 0.8 0.85 0.9 0.95 1 1.05 1.1 1.15 1.2
0.3 0.35 0.4 0.45 0.5 0.55 0.6 0.65 0.7 0.8 0.85 0.9 0.95 1 1.05 1.1 1.15 1.2
100
0
-100
100
0
-100
1.5 1.55 1.6 1.65 1.7 1.75 1.8 1.85 1.9 1.9 1.95 2 2.05 2.1 2.15 2.2 2.25 2.3
1.5 1.55 1.6 1.65 1.7 1.75 1.8 1.85 1.9 1.9 1.95 2 2.05 2.1 2.15 2.2 2.25 2.3
1.5 1.55 1.6 1.65 1.7 1.75 1.8 1.85 1.9 1.9 1.95 2 2.05 2.1 2.15 2.2 2.25 2.3
State 1
State 2 State 2State 3
State 3
State 4 State 4
State 5
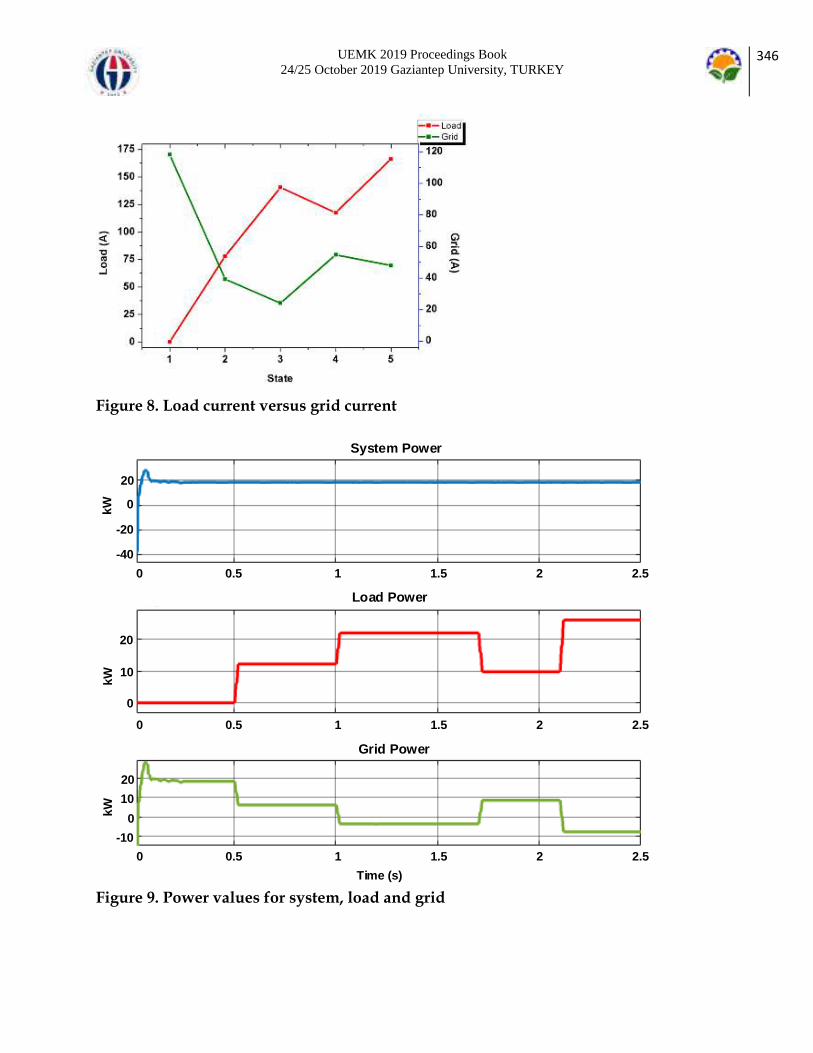
UEMK 2019 Proceedings Book 24/25 October 2019 Gaziantep University, TURKEY
346
Figure 8. Load current versus grid current
Figure 9. Power values for system, load and grid
0 0.5 1 1.5 2 2.5
0 0.5 1 1.5 2 2.5
0 0.5 1 1.5 2 2.5
System Power
Load Power
Grid Power
20
0
-20
-40
20
10
0
20
10
0
-10
Time (s)
kWkW
kW
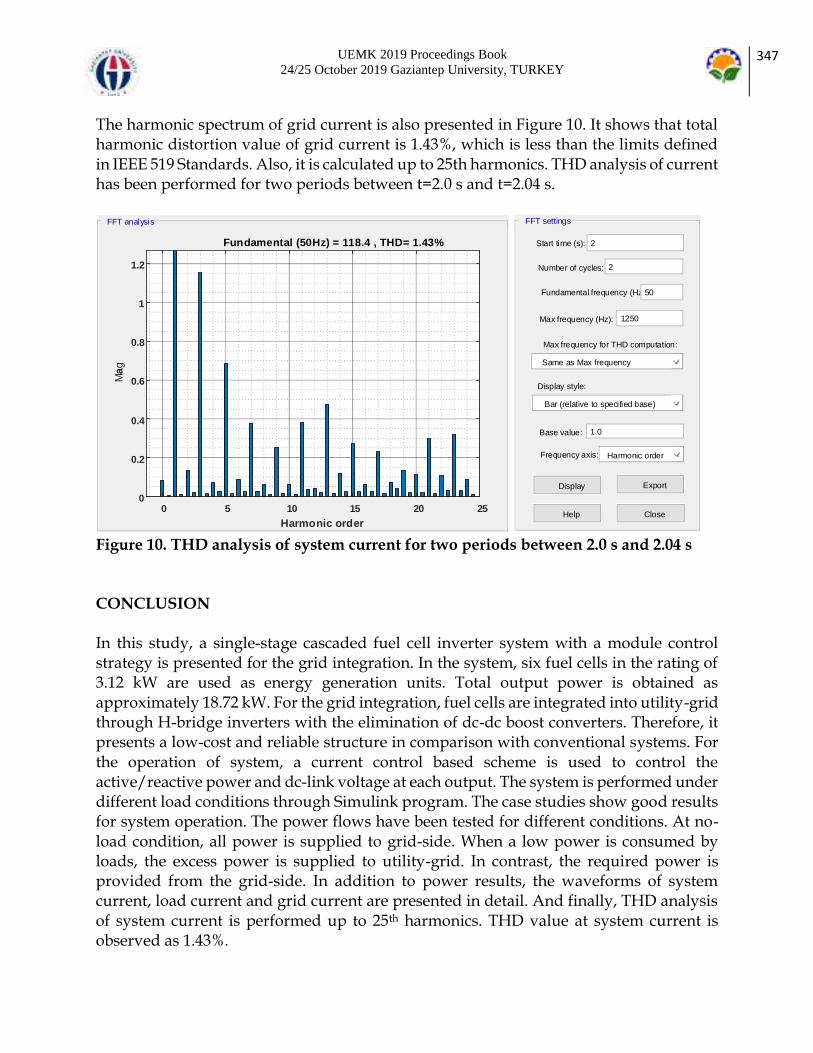
UEMK 2019 Proceedings Book 24/25 October 2019 Gaziantep University, TURKEY
347
The harmonic spectrum of grid current is also presented in Figure 10. It shows that total harmonic distortion value of grid current is 1.43%, which is less than the limits defined in IEEE 519 Standards. Also, it is calculated up to 25th harmonics. THD analysis of current has been performed for two periods between t=2.0 s and t=2.04 s.
Figure 10. THD analysis of system current for two periods between 2.0 s and 2.04 s CONCLUSION In this study, a single-stage cascaded fuel cell inverter system with a module control strategy is presented for the grid integration. In the system, six fuel cells in the rating of 3.12 kW are used as energy generation units. Total output power is obtained as approximately 18.72 kW. For the grid integration, fuel cells are integrated into utility-grid through H-bridge inverters with the elimination of dc-dc boost converters. Therefore, it presents a low-cost and reliable structure in comparison with conventional systems. For the operation of system, a current control based scheme is used to control the active/reactive power and dc-link voltage at each output. The system is performed under different load conditions through Simulink program. The case studies show good results for system operation. The power flows have been tested for different conditions. At no-load condition, all power is supplied to grid-side. When a low power is consumed by loads, the excess power is supplied to utility-grid. In contrast, the required power is provided from the grid-side. In addition to power results, the waveforms of system current, load current and grid current are presented in detail. And finally, THD analysis of system current is performed up to 25th harmonics. THD value at system current is observed as 1.43%.
FFT analysis
Fundamental (50Hz) = 118.4 , THD= 1.43%
0 5 10 15 20 25
Harmonic order
0
0.2
0.4
0.6
0.8
1
1.2
Mag
FFT settings
Fundamental frequency (Hz):50
Number of cycles: 2
Start time (s): 2
Max frequency (Hz): 1250
Display style:
Bar (relative to specified base)
Max frequency for THD computation:
Base value: 1.0
Same as Max frequency
Display
Close
Frequency axis: Harmonic order
Help
Export

UEMK 2019 Proceedings Book 24/25 October 2019 Gaziantep University, TURKEY
348
REFERENCES Ahmad, Z., & Singh, S. N. (2018). Improved modulation strategy for single phase grid connected transformerless PV inverter topologies with reactive power generation capability. Solar Energy, 163, 356-375. doi:https://doi.org/10.1016/j.solener.2018.01.039 Al-Shetwi, A. Q., Sujod, M. Z., & Blaabjerg, F. (2018). Low voltage ride-through capability control for single-stage inverter-based grid-connected photovoltaic power plant. Solar Energy, 159, 665-681. doi:https://doi.org/10.1016/j.solener.2017.11.027 Chandrasekaran, S., & Gokdere, L. U. (2004, 20-25 June 2004). Integrated magnetics for interleaved DC-DC boost converter for fuel cell powered vehicles. Paper presented at the 2004 IEEE 35th Annual Power Electronics Specialists Conference (IEEE Cat. No.04CH37551). Chatterjee, A., & Mohanty, K. B. (2018). Current control strategies for single phase grid integrated inverters for photovoltaic applications-a review. Renewable and Sustainable Energy Reviews, 92, 554-569. doi:https://doi.org/10.1016/j.rser.2018.04.115 Chen, W., Han, Y., Li, Q., Liu, Z., & Peng, F. (2014). Design of proton exchange membrane fuel cell grid-connected system based on resonant current controller. International Journal of Hydrogen Energy, 39(26), 14402-14410. doi:https://doi.org/10.1016/j.ijhydene.2014.02.103 Dhakouani, A., Znouda, E., & Bouden, C. (2019). Impacts of energy efficiency policies on the integration of renewable energy. Energy Policy, 133, 110922. doi:https://doi.org/10.1016/j.enpol.2019.110922 Gayathri Devi, B., & Keshavan, B. K. (2019). A novel hybrid Phase Shifted-Modified Synchronous Optimal Pulse Width Modulation based 27-level inverter for grid-connected PV system. Energy, 178, 309-317. doi:https://doi.org/10.1016/j.energy.2019.03.173 Hatziadoniu, C. J., Lobo, A. A., Pourboghrat, F., & Daneshdoost, M. (2002). A simplified dynamic model of grid-connected fuel-cell generators. IEEE Transactions on Power Delivery, 17(2), 467-473. doi:10.1109/61.997919 İnci, M., & Türksoy, Ö. (2019). Review of fuel cells to grid interface: Configurations, technical challenges and trends. Journal of Cleaner Production, 213, 1353-1370. doi:https://doi.org/10.1016/j.jclepro.2018.12.281 Jafarian, H., Kim, N., & Parkhideh, B. (2018). Decentralized Control Strategy for AC-Stacked PV Inverter Architecture Under Grid Background Harmonics. IEEE Journal of Emerging and Selected Topics in Power Electronics, 6(1), 84-93. doi:10.1109/JESTPE.2017.2773079 Kang, F.-s., Park, S.-J., Cho, S. E., & Kim, J.-M. (2005). Photovoltaic power interface circuit incorporated with a buck-boost converter and a full-bridge inverter. Applied Energy, 82(3), 266-283. doi:https://doi.org/10.1016/j.apenergy.2004.10.009 Kim, S.-H. (2017). Chapter 7 - Pulse width modulation inverters. In S.-H. Kim (Ed.), Electric Motor Control (pp. 265-340): Elsevier.

UEMK 2019 Proceedings Book 24/25 October 2019 Gaziantep University, TURKEY
349
Kyoungsoo, R., & Rahman, S. (1998). Two-loop controller for maximizing performance of a grid-connected photovoltaic-fuel cell hybrid power plant. IEEE Transactions on Energy Conversion, 13(3), 276-281. doi:10.1109/60.707608 Li, Q., Chen, W. R., Liu, Z. X., Zhou, G. H., & Ma, L. (2015). Active control strategy based on vector-proportion integration controller for proton exchange membrane fuel cell grid-connected system. IET Renewable Power Generation, 9(8), 991-999. doi:10.1049/iet-rpg.2014.0245 Luo, C., Su, M., Hou, X., Han, H., Sun, Y., & Yang, Y. (2018, 22-25 May 2018). A Decentralized Power Control of Cascaded Single-Stage PV Inverters for Grid-connected Applications. Paper presented at the 2018 IEEE Innovative Smart Grid Technologies - Asia (ISGT Asia). Malakondareddy, B., Senthil Kumar, S., Ammasai Gounden, N., & Anand, I. (2019). An adaptive PI control scheme to balance the neutral-point voltage in a solar PV fed grid connected neutral point clamped inverter. International Journal of Electrical Power & Energy Systems, 110, 318-331. doi:https://doi.org/10.1016/j.ijepes.2019.03.012 Mazumder, S. K., Burra, R. K., Huang, R., Tahir, M., & Acharya, K. (2010). A Universal Grid-Connected Fuel-Cell Inverter for Residential Application. IEEE Transactions on Industrial Electronics, 57(10), 3431-3447. doi:10.1109/TIE.2009.2038943 Nymand, M., & Andersen, M. A. E. (2010). High-Efficiency Isolated Boost DC–DC Converter for High-Power Low-Voltage Fuel-Cell Applications. IEEE Transactions on Industrial Electronics, 57(2), 505-514. doi:10.1109/TIE.2009.2036024 Samy, M. M., Barakat, S., & Ramadan, H. S. (2019). Techno-economic analysis for rustic electrification in Egypt using multi-source renewable energy based on PV/ wind/ FC. International Journal of Hydrogen Energy. doi:https://doi.org/10.1016/j.ijhydene.2019.04.038 Sun, L., Jin, Y., Pan, L., Shen, J., & Lee, K. Y. (2019). Efficiency analysis and control of a grid-connected PEM fuel cell in distributed generation. Energy Conversion and Management, 195, 587-596. doi:https://doi.org/10.1016/j.enconman.2019.04.041 Turksoy, A., Hames, Y., Teke, A., & Latran, M. B. (2018). A novel adaptive switching method to reduce DC-Link capacitor ripple in PV based grid-connected inverter. Solar Energy, 173, 702-714. doi:https://doi.org/10.1016/j.solener.2018.08.002 Wang, X., Li, Q., Chen, W., Wang, W., Pu, Y., & Yu, J. (2019). Parallel interaction influence of single-stage photovoltaic grid-connected/hydrogen production multi-inverter system based on modal analysis. International Journal of Hydrogen Energy, 44(11), 5143-5152. doi:https://doi.org/10.1016/j.ijhydene.2018.10.046 Yao, Z., & Xiao, L. (2013). Control of Single-Phase Grid-Connected Inverters With Nonlinear Loads. IEEE Transactions on Industrial Electronics, 60(4), 1384-1389. doi:10.1109/TIE.2011.2174535.
UEMK 2019 Proceedings Book 24/25 October 2019 Gaziantep University, TURKEY
350
INVESTIGATION OF WOB AND RPM FOR DIFFERENT BIT
TYPES USED IN WESTERN RAMAN DRILLINGS
Ömer İMİR Institute of Science [email protected] ABSTRACT: In this study, weight on bit that are used with the different types of bits were examined in Western Raman oil field which is the Turkey’s largest oil production fields. With the purpose of this (with the scope of this), weight on bit (WOB), revolutions per minute (RPM) and ROP (rate of penetration) values () given to insert, standard, and PDC bit that are used in similar wells were analyzed. For this purpose, in the second stage of the drillings carried out in the Western Raman field, the data of fourteen wells including five wells drilled with PDC drill bit 8 ½’’ in diameter, five wells drilled with standard bit and four wells drilled with insert bit were utilized, and the performance of these bits were evaluated in terms of quality. Upon comparing and analyzing the graphs created based on these data, the PDC (Poly-Crystalline Diamond Compact) drill bit was found to be much more efficient than insert and standard drill bits in terms of time and correspondingly cost. Key words: WOB, RPM, West Raman, ROP, bit, drilling BATI RAMAN SONDAJLARINDA KULLANILAN FARKLI MATKAP TİPLERİ İÇİN WOB VE RPM DEĞERLERİNİN İNCELENMESİ ÖZET: Bu çalışmada, Türkiye’nin en büyük petrol üretim sahası olan Batı Raman’da farklı tip matkaplar ile yapılan sondajlarda matkaba verilen ağırlık değerleri incelendi. Bu kapsamda aynı sahada benzer kuyularda kullanılan insert, standart ve PDC (Çok Kristalli Elmas Kompakti) matkaplara verilen ağırlık (WOB), dönme hızı (RPM) ve sondaj ilerleme hızı (ROP) değerleri analiz edilmiştir. Bu amaçla Batı Raman sahasında yapılan sondajların ikinci aşamasında 8 ½’’ çapında PDC matkap ile kazılan beş kuyu, standart matkap ile kazılan beş kuyu ve insert matkap ile kazılan dört kuyu olmak üzere toplam on dört kuyunun verileri kullanılmıştır ve bu matkapların WOB açısından performansları niteliksel olarak değerlendirilmiştir. Kullanılan bu veriler ile oluşturulan grafikler karşılaştırılıp analiz edilerek, PDC matkabın zaman ve buna bağlı olarak

UEMK 2019 Proceedings Book 24/25 October 2019 Gaziantep University, TURKEY
351
maliyet açısından insert ve standart matkaba göre çok daha avantajlı olduğu tespit edilmiştir. Anahtar sözcükler: WOB, RPM, Batı Raman, ROP, matkap, sondaj GİRİŞ Petrol, doğalgaz ve jeotermal sektöründe en önemli faktörlerden biri kuyu sondajındaki zaman ve buna bağlı olarak maliyettir. Sondaj endüstrisinin hedefi, güvenlik ve çevre standartlarından ödün vermeden (Sivagnanam, 2014) çok masraflı bir faaliyet olan sondajın maliyetini minimize etmektir. Matkap, sondaj dizisi sonunda bulunan, kayaçları ezme ve kesme işlemini yapan önemli bir alettir (Özbayoğlu, 2011). Sondaj mühendisliğinde en önemli konulardan biri optimum matkap seçimidir. Ayrıca optimum matkabın iyi bir performans göstermesi için de optimum çalışma parametreleri ile kullanılması lazım. Belirli bir sondaj için matkabın seçimi, sondaj işlemi sırasında beklenen çalışma koşullarının yanı sıra kazılacak formasyonun yapısına göre değişmektedir. Bir matkabın performansı; WOB, RPM, çamur özellikleri ve hidrolik verimliliği de dahil olmak üzere çeşitli çalışma parametrelerinin bir fonksiyonudur (Özbayoğlu, 2011). Bu çalışmada döner konlu (insert, standart) ve sabit başlı (PDC) matkap tiplerinin WOB-sondaj ilerleme hızı ilişkisi incelenecektir. Uygun matkap seçimi, WOB ve RPM değerleri için referans kuyu verileri ve formasyon özellikleri kullanılmalıdır. Referans kuyu verileri; kullanılan matkabın özellikleri, kazılan formasyon özellikleri (sertlik, aşındırma, baskı mukavemeti, litoloji), ROP (ilerleme hızları), WOB, RPM, debi ve kullanılan matkapların metre maliyetlerinden oluşur. Matkap seçimi, WOB ve RPM değerleri belirlenirken bahsedilen bütün bu parametreler gözden geçirilerek değerlendirilmektedir. Bu çalışmada Türkiye’nin en büyük petrol üretim sahası olan Batı Raman’da yapılan sondajlarda kullanılan insert, standart ve PDC matkap tipleri WOB-sondaj ilerleme hızı açısından tartışılmıştır. Bu çalışma kapsamında; WOB, RPM(dönme hızı), ROP (sondaj ilerleme hızı) parametreleri dikkate alınarak, bu sahada kullanılan PDC, insert ve standart matkapların performansları, kullanılan parametrelerin etkileri açısından değerlendirilmiştir. Bu tez çalışmasının amacı, bu değerlendirmelerin sonucunda düşük WOB yüksek ilerleme hızına sahip matkap tipini tespit etmektir. Bu amaçla sondajın ikinci aşamasında 8 ½ " ’lik insert matkapla kazılan dört kuyu, standart matkapla kazılan beş kuyu ve PDC matkapla kazılan beş kuyunun gerçek WOB, RPM ve ROP verileri kullanılarak analizler yapılmış ve değerlendirilerek yorumlanmıştır. İnceleme alanında ki kuyularda kullanılan matkapların performansları,

UEMK 2019 Proceedings Book 24/25 October 2019 Gaziantep University, TURKEY
352
karşılaşılan sorunlar ve çözümüne yönelik önlemlerinin alınması ile ilgili öneriler tartışılmıştır. Batı Raman Sahası 1961 yılında keşfedilen Batı Raman sahası, Türkiye'nin Güneydoğu Bölgesinde yer almaktadır. Petrol, kretase çağından heterojen bir karbonat formasyonundan üretilmektedir ve Garzan Formasyonu olarak tanımlanmaktadır. Garzan formasyonunun brüt kalınlığı 64 m'dir (Babadağlı ve ark., 2009). Şekil 1’deki yer buldurunda görüldüğü gibi Batı Raman petrol sahası yaklaşık 18 km uzunluk ve 2 ila 4 km genişliğinde bir alana sahiptir. Sahanın ortalama gözenekliliği % 18 civarındadır ve esas olarak matriks, vug ve çatlaklardan oluşmaktadır (Babadağlı ve ark., 2009). Matriks, 10 md ila 100 md arasında değişen geçirgenliğe sahiptir. Rezervuardan üretilen petrol 9,7 ile 15,1 arasında değişen bir API gravitesi ile çok ağır bir ham petroldür. Petrolün viskozitesi rezervuar koşullarında 450 ila 1000 cp arasında değişmektedir ve bu durum petrolün gözeneklerde ilerlemesini zorlaştırmaktadır (Babadağlı ve ark., 2009).
Şekil 1. İnceleme Alanı Yer Bulduru (TPAO, 2018) Matkap Parametreleri Sondaj ilerleme hızını etkileyen en önemli araçlardan biri matkap tipidir. Matkaplar: kendi ekseni etrafında dönerken, sondaj dizisi ile üzerinde döndüğü formasyonu kırıp öğüten gereçlerdir. Bir başka değişle matkap; dizinin en alt ucuna takılan ve üstüne ağırlık ve dönme hareketi verilmek suretiyle delme işlemini gerçekleştiren elaman olarak tanımlanır. Kuyu sondajlarının sağlıklı ve hızlı yapılabilmesi için ideal matkap
UEMK 2019 Proceedings Book 24/25 October 2019 Gaziantep University, TURKEY
353
seçilmelidir. Matkabın da en iyi performansı gösterebilmesi için en iyi çalışma parametrelerinde kullanılmalıdır. Matkap çalışma parametreleri olan WOB (matkaba verilen ağırlık), RPM (dönme hızı) ve jet hızı sondaj mühendisi tarafından değiştirilebilir parametrelerdir. Bu yüzden mühendisin sahip olduğu bilgi birikimi ve tecrübesi önem kazanmaktadır. Bu çalışmada WOB ve RPM değerleri incelenecektir. Matkaba Verilen Ağırlık (WOB) Sondaj dizisinin ağırlığının bir kısmı matkaba verilir. Bu ağırlığa WOB (matkaba verilen ağırlık) denir. Genel olarak matkaba DC’lerin (drill collar) çamur içindeki ağırlığının % 75’i verilir. WOB (matkaba verilen ağırlık) kayacın basınç mukavemetine, formasyon sertliğine ve matkap tipine bağlıdır. WOB kayacın basınç mukavemetinden fazla olmamalıdır. Yoksa döner konlu matkabın dişleri kayaç üzerinde sürtünerek yüzeysel bir aşınmaya neden olur. Bu da matkap dişlerinin kırılmasına veya sondaj dizisinde bükülmeler sonucu sapmalara ve sıkışmalara neden olur. WOB’un düşük olması da kayaca yeterince batmayarak üzerinde kaymasına sebep olacak ve sondaj ilerleme hızını düşürecektir (Yünsel, 2001). WOB sondaj sırasında ROP’yi (ilerleme hızını) kontrol etmede önemli bir parametre olarak kabul edilir. Düzgün olarak kontrol edilen WOB, sadece sondaj süresini azaltmakla kalmaz, aynı zamanda matkap ömrünü de uzatmada önemli bir faktördür (Wang ve ark., 2018). Döner konlu matkaplar yumuşak formasyonlarda az, sert formasyonlarda yüksek WOB ile çalışırlar (Özkara ve Derman, 2013). Genellikle ilerleme hızı aşağıdaki bağıntıya yakın bir bağıntıyla bulunur (Göktekin, 1983);
𝑣 = 𝐾𝑅0.5∗𝑊
𝑑 (1)
Formül (1)’de; ν, ilerleme hızını (m/saat); K, kayacın delinebilirliğini gösteren bir katsayı; R, matkabın dönme hızını (devir/dakika); w, matkaba verilen ağırlığı (ton); d, ise kuyu çapını (inç) ifade etmektedir. WOB ve RPM’in ROP üzerindeki etkisi hem laboratuvarda hem de sahada çok sayıda araştırmacı tarafından incelenmiştir. Sabit tutulan diğer tüm sondaj değişkenleri ile deneysel olarak elde edilen WOB’a karşı ROP’nin değişimi grafiği, Şekil 1.’de gösterilmiştir. Şekil 2.’de WOB eşik noktasına (b noktası) gelmeyene kadar belirgin bir şekilde ROP artışı gözlenmemiştir. b-c noktaları arasında daha hızlı bir ROP artışı vardır. Çünkü b noktası kazmaktan öğütme ve kesme işlemine geçiş noktasıdır (Özbayoğlu, 2011). d noktasında optimum WOB seviyesine gelmiştir.
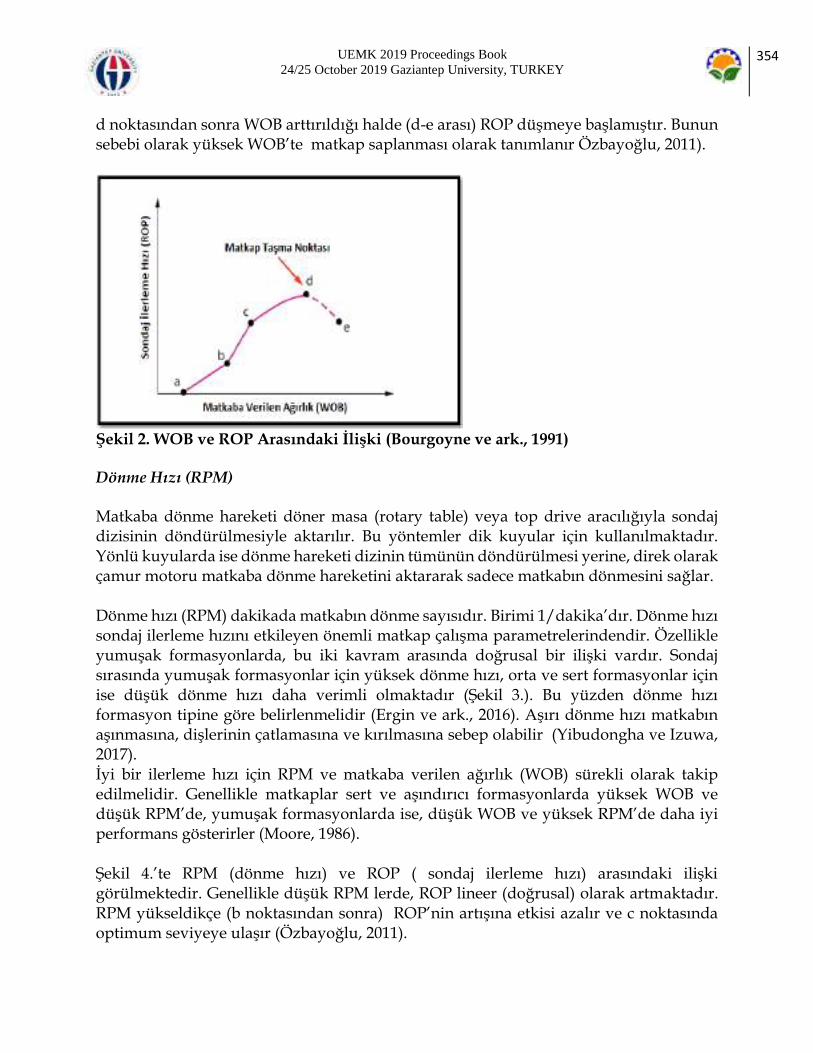
UEMK 2019 Proceedings Book 24/25 October 2019 Gaziantep University, TURKEY
354
d noktasından sonra WOB arttırıldığı halde (d-e arası) ROP düşmeye başlamıştır. Bunun sebebi olarak yüksek WOB’te matkap saplanması olarak tanımlanır Özbayoğlu, 2011).
Şekil 2. WOB ve ROP Arasındaki İlişki (Bourgoyne ve ark., 1991) Dönme Hızı (RPM) Matkaba dönme hareketi döner masa (rotary table) veya top drive aracılığıyla sondaj dizisinin döndürülmesiyle aktarılır. Bu yöntemler dik kuyular için kullanılmaktadır. Yönlü kuyularda ise dönme hareketi dizinin tümünün döndürülmesi yerine, direk olarak çamur motoru matkaba dönme hareketini aktararak sadece matkabın dönmesini sağlar. Dönme hızı (RPM) dakikada matkabın dönme sayısıdır. Birimi 1/dakika’dır. Dönme hızı sondaj ilerleme hızını etkileyen önemli matkap çalışma parametrelerindendir. Özellikle yumuşak formasyonlarda, bu iki kavram arasında doğrusal bir ilişki vardır. Sondaj sırasında yumuşak formasyonlar için yüksek dönme hızı, orta ve sert formasyonlar için ise düşük dönme hızı daha verimli olmaktadır (Şekil 3.). Bu yüzden dönme hızı formasyon tipine göre belirlenmelidir (Ergin ve ark., 2016). Aşırı dönme hızı matkabın aşınmasına, dişlerinin çatlamasına ve kırılmasına sebep olabilir (Yibudongha ve Izuwa, 2017). İyi bir ilerleme hızı için RPM ve matkaba verilen ağırlık (WOB) sürekli olarak takip edilmelidir. Genellikle matkaplar sert ve aşındırıcı formasyonlarda yüksek WOB ve düşük RPM’de, yumuşak formasyonlarda ise, düşük WOB ve yüksek RPM’de daha iyi performans gösterirler (Moore, 1986). Şekil 4.’te RPM (dönme hızı) ve ROP ( sondaj ilerleme hızı) arasındaki ilişki görülmektedir. Genellikle düşük RPM lerde, ROP lineer (doğrusal) olarak artmaktadır. RPM yükseldikçe (b noktasından sonra) ROP’nin artışına etkisi azalır ve c noktasında optimum seviyeye ulaşır (Özbayoğlu, 2011).
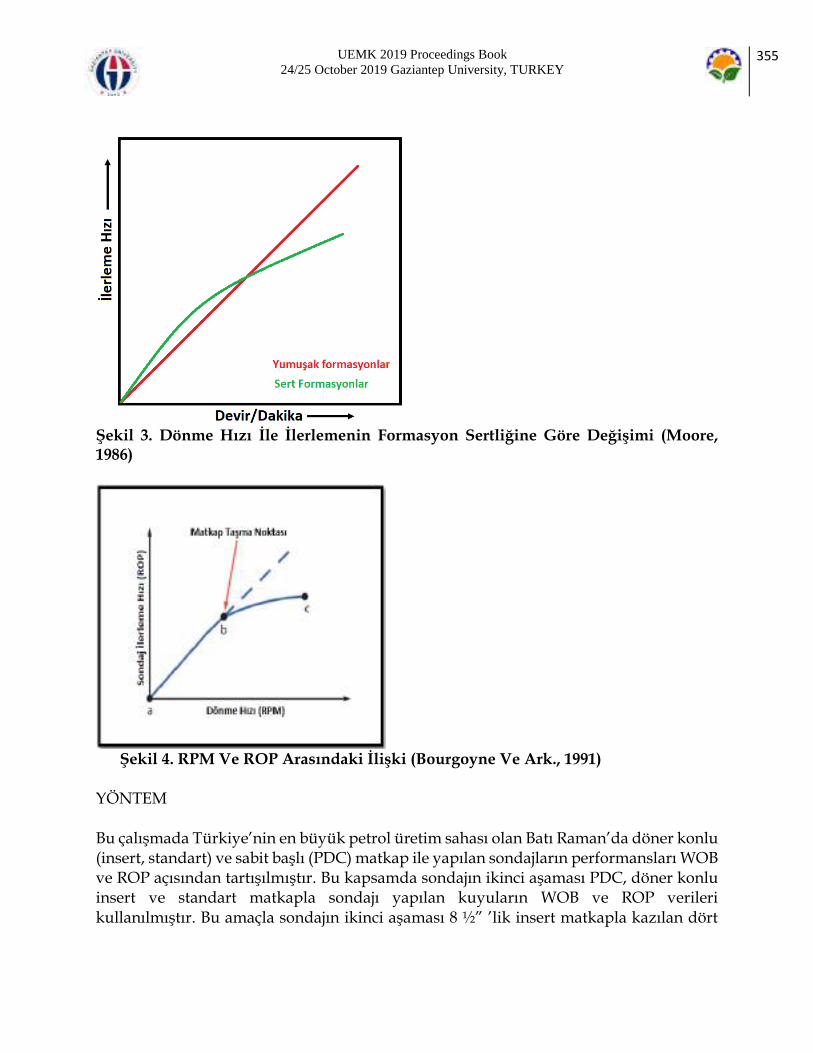
UEMK 2019 Proceedings Book 24/25 October 2019 Gaziantep University, TURKEY
355
Şekil 3. Dönme Hızı İle İlerlemenin Formasyon Sertliğine Göre Değişimi (Moore, 1986)
Şekil 4. RPM Ve ROP Arasındaki İlişki (Bourgoyne Ve Ark., 1991) YÖNTEM Bu çalışmada Türkiye’nin en büyük petrol üretim sahası olan Batı Raman’da döner konlu (insert, standart) ve sabit başlı (PDC) matkap ile yapılan sondajların performansları WOB ve ROP açısından tartışılmıştır. Bu kapsamda sondajın ikinci aşaması PDC, döner konlu insert ve standart matkapla sondajı yapılan kuyuların WOB ve ROP verileri kullanılmıştır. Bu amaçla sondajın ikinci aşaması 8 ½” ’lik insert matkapla kazılan dört
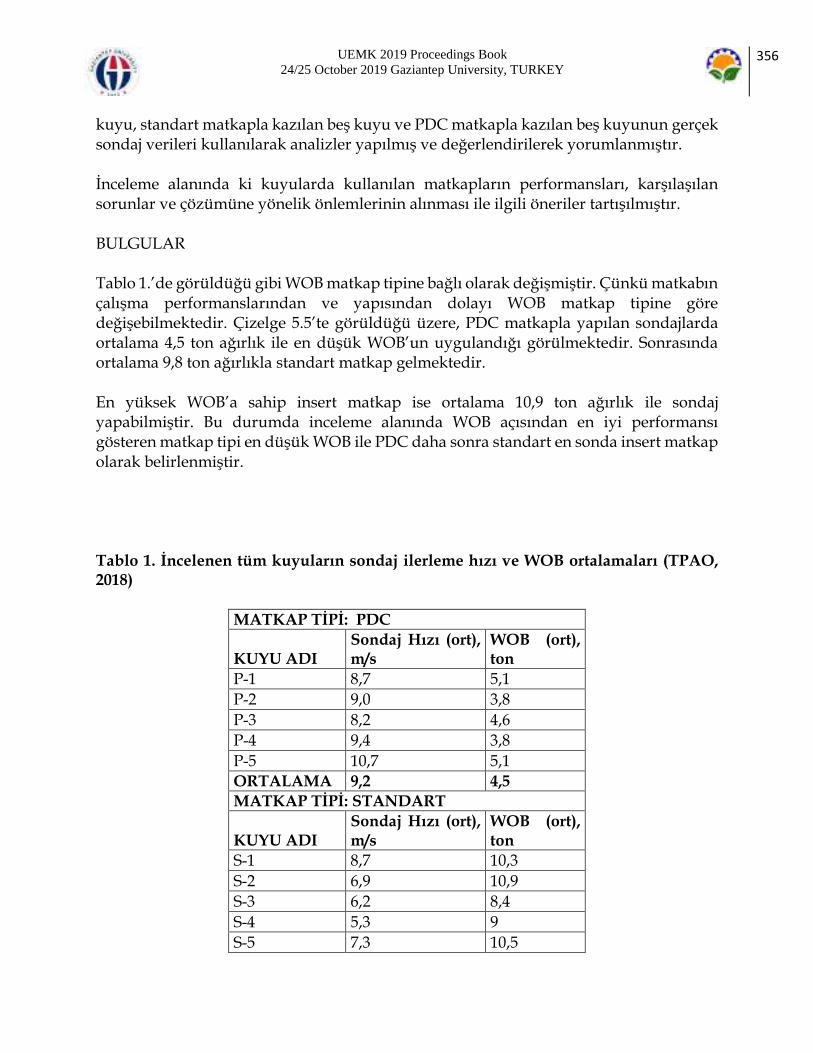
UEMK 2019 Proceedings Book 24/25 October 2019 Gaziantep University, TURKEY
356
kuyu, standart matkapla kazılan beş kuyu ve PDC matkapla kazılan beş kuyunun gerçek sondaj verileri kullanılarak analizler yapılmış ve değerlendirilerek yorumlanmıştır. İnceleme alanında ki kuyularda kullanılan matkapların performansları, karşılaşılan sorunlar ve çözümüne yönelik önlemlerinin alınması ile ilgili öneriler tartışılmıştır. BULGULAR Tablo 1.’de görüldüğü gibi WOB matkap tipine bağlı olarak değişmiştir. Çünkü matkabın çalışma performanslarından ve yapısından dolayı WOB matkap tipine göre değişebilmektedir. Çizelge 5.5’te görüldüğü üzere, PDC matkapla yapılan sondajlarda ortalama 4,5 ton ağırlık ile en düşük WOB’un uygulandığı görülmektedir. Sonrasında ortalama 9,8 ton ağırlıkla standart matkap gelmektedir. En yüksek WOB’a sahip insert matkap ise ortalama 10,9 ton ağırlık ile sondaj yapabilmiştir. Bu durumda inceleme alanında WOB açısından en iyi performansı gösteren matkap tipi en düşük WOB ile PDC daha sonra standart en sonda insert matkap olarak belirlenmiştir. Tablo 1. İncelenen tüm kuyuların sondaj ilerleme hızı ve WOB ortalamaları (TPAO, 2018)
MATKAP TİPİ: PDC
KUYU ADI Sondaj Hızı (ort), m/s
WOB (ort), ton
P-1 8,7 5,1
P-2 9,0 3,8
P-3 8,2 4,6
P-4 9,4 3,8
P-5 10,7 5,1
ORTALAMA 9,2 4,5
MATKAP TİPİ: STANDART
KUYU ADI Sondaj Hızı (ort), m/s
WOB (ort), ton
S-1 8,7 10,3
S-2 6,9 10,9
S-3 6,2 8,4
S-4 5,3 9
S-5 7,3 10,5

UEMK 2019 Proceedings Book 24/25 October 2019 Gaziantep University, TURKEY
357
ORTALAMA 6,9 9,8
MATKAP TİPİ: INSERT
KUYU ADI Sondaj Hızı (ort), m/s
WOB (ort), ton
İ-1 4,9 9,3
İ-2 5,5 12
İ-3 5,6 11,4
İ-4 5,4 10,8 ORTALAMA 5,4 10,9
SONUÇ 1. Bu çalışmada Batman ili Batı Raman Petrol sahasında yapılan sondaj çalışmalarında kullanılan standart, insert ve PDC matkapların sondaj performasnları değerlendirilmiştir. Çalışmada ulaşılan sonuçlar aşağıdaki gibi özetlenebilir. 2. Bu çalışma kapsamında Batı Raman Petrol sahasında sondajı yapılan 14 kuyunun 8 ½” çapında matkap ile yapılan sondajın ikinci aşaması, performans ve WOB ve ROP parametreleri açısından değerlendirilmiştir. 3. Sahada kullanılması planlanan matkapların seçiminde daha önceden kazılmış referans kuyulardan alınan veriler ve formasyon tipi değerlendirilerek uygun matkap seçimi gerçekleştirilmiştir. Daha önceleri bu sahada standart ve insert matkap ile sondaj yapılırken PDC matkapların sektöre girmesiyle birlikte PDC matkaplar Batı Raman petrol sahasında kullanılmaya başlanmış ve yüksek performans alınmıştır. Bunun neticesinde Batı Raman kuyularının sondaj süresi kısalmış ve maliyetlerde azalma görülmüştür. 4. Batı Raman Petrol sahasında kazılan kuyuların WOB ve ROP verileri her üç matkap tipi için değerlendirilmiş ve sonuç olarak PDC matkap kullanımı her anlamda daha verimli olduğu ve düşük maliyetli kuyular kazılmasına sebep olmuştur. 5. Genellikle PDC matkaplar insert ve standart matkaba göre düşük WOB’te daha iyi performans gösterdiği bilinmektedir. Batı Raman petrol sahasında da bu durum görülmüştür. İncelediğimiz on dört kuyuda sondajın ikinci aşamasında her üç tip matkabın WOB ortalaması hesaplanmış ve insert matkapla yapılan sondajın WOB ortalaması 10,85 ton, standart matkapla yapılan sondajın WOB ortalaması 9,80 ton ve PDC matkapla yapılan sondajın WOB ortalaması 4,47 ton olduğu görülmüştür. KAYNAKLAR

UEMK 2019 Proceedings Book 24/25 October 2019 Gaziantep University, TURKEY
358
Yünsel, T.Y. (2001). Rotary (Döner) Sondajlarda Matkap Çalışma ve Kaya Parametrelerinin İlerleme Hızı Üzerine Etkileri. Yüksek Lisans Tezi, Çukurova Üniversitesi, Maden Mühendisliği Ana Bilim Dalı, Adana. Wang, C., Liu, G., Li, J., Zhang, T., Jiang, H., Ling, X., & Ren, K. (2018). New methods of eliminating downhole WOB measurement error owing to temperature variation and well pressure differential. Journal of Petroleum Science and Engineering, 171, 1420-1432. Özkara, H., Derman, Ş.O., (2013). Sondaj Matkapları. TPAO Sondaj Daire Başkanlığı, Sondaj Uygulamaları Eğitimi, Belek, Antalya Göktekin, A., (1983). Sondaj tekniği. TC İTÜ Kütüphanesi. Ozbayoglu, E. (2011). Rotary Drilling Bits. In: Fundamentals of Drilling Engineering, Ed.: Mitchell, R.F., Miska, S.Z., 1. Edition, Society of Petroleum Engineers, USA, p.: 311 Bourgoyne, A.T. Chenevert, M.E., Millheim, K.K., and Young, F.S. Jr. (1991). Applied Drilling Engineering. Textbook Series, SPE, Richardson, Texas 2: 113–189. Sivagnanam, M., (2014), PDC Drill Bit Redesign and Simulation for Optimized Performance. M.Sc., Unıversıty Of Calgary, İnstitute Of Science, 163, Alberta. Babadagli, T., Sahin, S., Kalfa, U., Celebioglu, D., Karabakal, U., & Topguder, N. N. (2009). Evaluation of steam injection potential and improving ongoing CO2 injection of the Bati Raman field, Turkey. Journal of Petroleum Science and Engineering, 68(1-2), 107-117. Wang, C., Liu, G., Li, J., Zhang, T., Jiang, H., Ling, X., & Ren, K. (2018). New methods of eliminating downhole WOB measurement error owing to temperature variation and well pressure differential. Journal of Petroleum Science and Engineering, 171, 1420-1432. TPAO, (2018), TP Batman Sondaj Müdürlüğü, 11554511-622.03-E.64438 sayı 25.09.2017 tarihli Bilgi ve Belge Talepleri konulu resmi yazı ile alınan veriler, Batman Yibudongha Y., and Izuwa N., C., 2017, Bıt Performance Evaluatıon: A Case Study Of Fıeld A, Nıger Delta, Nıgerıa, 1,2 Department of Petroleum Engineering, Federal University of Technology, Owerri, Nigeria 1 Drilling Engineer, NPDC, Benin, Nigeria Moore, P.L. 1986, Drilling Practices Manuel, Second Edition, Oklahama.

UEMK 2019 Proceedings Book 24/25 October 2019 Gaziantep University, TURKEY
359
UTILIZATION OF MALUS FLORIBUNDA JUICE AS A
POTENTIAL FOOD INGREDIENT: FOAM STABILITY,
DRYING KINETICS AND POWDER PROPERTIES
Hulya CAKMAK Hitit University, Department of Food Engineering [email protected] ABSTRACT: The aim of this study was to determine the optimum foam formulation for producing Malus floribunda fruit juice foams by employing faba bean protein concentrate (FB) and maltodextrin (MD) as potential foaming agent and wall material. Also the juice with optimum foam formulation was dried with foam-mat drying method in microwave oven in order to decrease the drying time thus energy efficiency, besides the quality of foam powders was evaluated. FB had a positive surface charge (>25.5 mV) at the natural pH (2.91±0.02) of Malus floribunda juice, therefore the juice was directly used in foam production. Depending on the experimental design, the FB level was significantly improved the foam stability with respect to density response (p<0.05), however MD level had no effect on both density and foaming capacity (p>0.05). The optimum amount of FB (10% w/w) was further used in foam-mat drying, and the drying period was shortened nearly 31% compared to the control sample. Among the tested thin layer models, Midilli et al. model had the best fit (Adj-R2> 0.99) to the experimental drying data of Malus floribunda juice and foams. The redness (18.85±0.16) and brightness (62.93±0.27) of Malus floribunda foam powders with FB was significantly higher than the control and MD added sample (p<0.05). Moreover, the Malus floribunda fruit juice powders produced with foam mat drying had higher color intensity with good flowability which had the potential to use as coloring agent or functional ingredient in different food matrices. Key words: Malus floribunda, foam stability, drying, powder.

UEMK 2019 Proceedings Book 24/25 October 2019 Gaziantep University, TURKEY
360
EFFECT OF HYDROGEN ON IMPACT RESPONSE OF
DUCTILE CAST IRON
Hina NAJAM Abdullah Gul University, 38080 Kayseri, Turkey [email protected] Burak BAL Abdullah Gul University, 38080 Kayseri, Turkey [email protected] Baris Cetin FNSS Defense Systems Co, 06830 Ankara, Turkey [email protected] ABSTRACT: The effect of hydrogen on the impact response of EN-GJS-600-3 ductile cast iron was investigated by conducting charpy V-notch impact tests on uncharged and hydrogen pre-charged samples. Before the impact tests, micro vickers hardness tests were carried out on uncharged and hydrogen charged samples for determining the correlation between material hardness and impact toughness. Results indicated an increase in the hardness value by the hydrogen uptake which resulted from solution hardening caused by hydrogen. However, only a slight difference was observed in the material impact toughness with the impact toughness of hydrogen charged specimen being slightly greater than the uncharged one. Key words: Hydrogen, impact test, micro hardness, impact toughness, solution hardening INTRODUCTION Ductile cast iron is widely used as a material for pipes in the city gas pipelines and is also a prospective material for hydrogen gas pipes (Matsunaga, Usuda, Yanase, & Endo, 2013). There are many studies that focus on the properties of cast iron under uniaxial tensile loading (Matsunaga, Matsuno, & Hayashida, 2011; Matsunaga, Usuda, Yanase, & Endo, 2014; Usuda, Matsuno, Matsunaga, Yanase, & Endo, 2013). However, uptil now very few studies focus on the effect of hydrogen on the toughness of these steels under impact loading. In many materials especially high strength steels, hydrogen has known to cause embrittlement of the steels. Hydrogen embrittlement (HE) is characterized as a severe
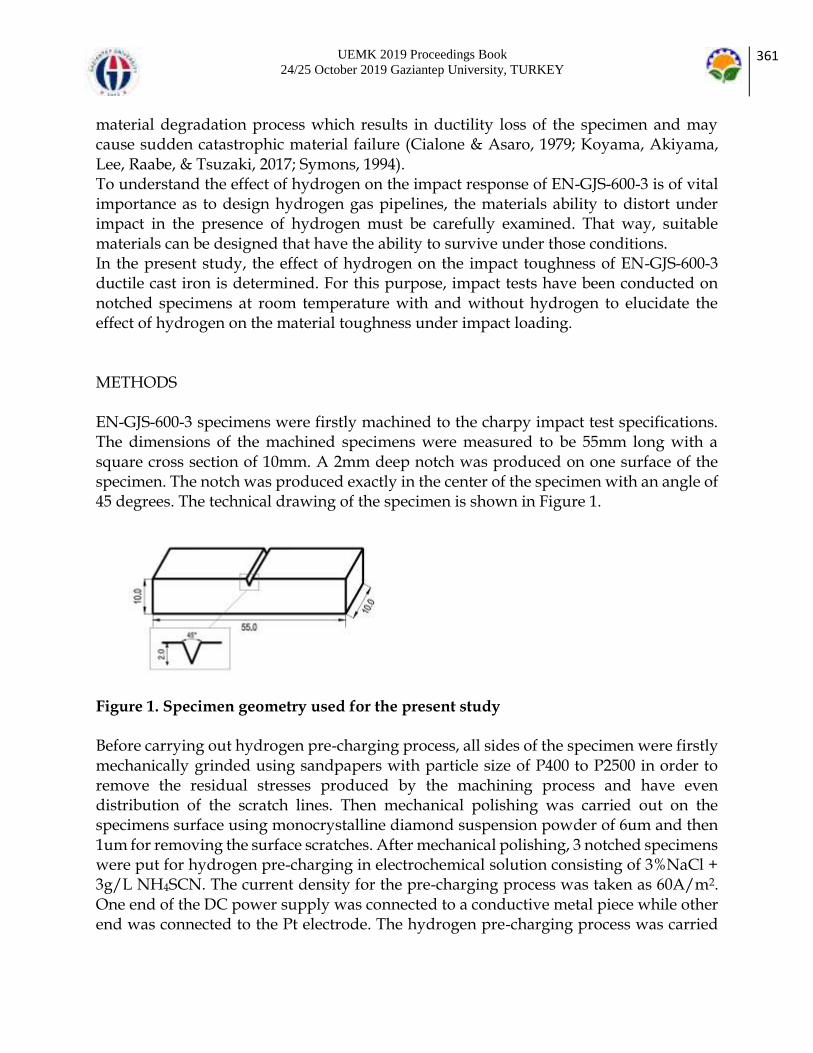
UEMK 2019 Proceedings Book 24/25 October 2019 Gaziantep University, TURKEY
361
material degradation process which results in ductility loss of the specimen and may cause sudden catastrophic material failure (Cialone & Asaro, 1979; Koyama, Akiyama, Lee, Raabe, & Tsuzaki, 2017; Symons, 1994). To understand the effect of hydrogen on the impact response of EN-GJS-600-3 is of vital importance as to design hydrogen gas pipelines, the materials ability to distort under impact in the presence of hydrogen must be carefully examined. That way, suitable materials can be designed that have the ability to survive under those conditions. In the present study, the effect of hydrogen on the impact toughness of EN-GJS-600-3 ductile cast iron is determined. For this purpose, impact tests have been conducted on notched specimens at room temperature with and without hydrogen to elucidate the effect of hydrogen on the material toughness under impact loading. METHODS EN-GJS-600-3 specimens were firstly machined to the charpy impact test specifications. The dimensions of the machined specimens were measured to be 55mm long with a square cross section of 10mm. A 2mm deep notch was produced on one surface of the specimen. The notch was produced exactly in the center of the specimen with an angle of 45 degrees. The technical drawing of the specimen is shown in Figure 1.
Figure 1. Specimen geometry used for the present study Before carrying out hydrogen pre-charging process, all sides of the specimen were firstly mechanically grinded using sandpapers with particle size of P400 to P2500 in order to remove the residual stresses produced by the machining process and have even distribution of the scratch lines. Then mechanical polishing was carried out on the specimens surface using monocrystalline diamond suspension powder of 6um and then 1um for removing the surface scratches. After mechanical polishing, 3 notched specimens were put for hydrogen pre-charging in electrochemical solution consisting of 3%NaCl + 3g/L NH4SCN. The current density for the pre-charging process was taken as 60A/m2. One end of the DC power supply was connected to a conductive metal piece while other end was connected to the Pt electrode. The hydrogen pre-charging process was carried

UEMK 2019 Proceedings Book 24/25 October 2019 Gaziantep University, TURKEY
362
out for 5 hours and 40 mins at room temperature. The schematic outline of the equipment used for hydrogen pre-charging is shown in Figure 2.
Figure 2. Schematic outline of the equipment used for hydrogen pre-charging Vickers Hardness tests were performed on uncharged and hydrogen charged samples at a distance of 3mm from the notch. For the hardness tests, 6 points were taken around the notch and average taken for determining the material hardness. For the vickers hardness tests, 1 kgf was applied on the material by the indentor for 10s. After the hardness tests, impact tests were carried out on 3 uncharged and 3 hydrogen pre charged samples for repeatability of the data. Average was taken for the 3 obtained values in order to determine the impact energy. The impact tests were carried out at room temperature using AIT-300-EN impact testing machine. RESULTS AND FINDINGS The hardness test results for the uncharged and hydrogen charged samples are shown in Table 1. Table 1. Hardness test results for uncharged and hydrogen charged sample
Point 1 Point 2 Point 3 Point 4 Point 5 Point 6 Average Standard Deviation (%)
HV (Uncharged)
227.4 224.4 246.1 192.3 256.1 255.5 233.6 10.4
HV (H+ Charged)
250.7 189.6 246.1 277.8 236.8 271.2 245.4 12.8
From Table 1, it can be seen that the hardness of hydrogen charged sample is greater than uncharged one. The difference in the hardness values for the 6 points accross the notch for the uncharged and hydrogen charged case as seen from the percentage standard deviation values can be due to surface inhomogenities as well as the presence of inculsions in the material. The increase in the hardness of the specimen by hydrogen charging has been reported in many studies before (El-Amoush, 2008; Murakami, Kanezaki, & Mine, 2010; Stępień & Kupka, 2008). The increase is probably due to solution hardening caused by the presence

UEMK 2019 Proceedings Book 24/25 October 2019 Gaziantep University, TURKEY
363
of hydrogen atoms occupying the interstitial sites in the lattice (Stępień & Kupka, 2008). The presence of interstitial hydrogen in the material induces lattice strains in it due to lattice distortion caused by the intersitial hydrogen atoms. The lattice strains creates a barrier to dislocation motion which in turn, increases the material yield strength and hence results in material hardening. The impact test results for uncharged and hydrogen charged EN-GJS-600-3 samples are shown in Table 2. Table 2. Impact test results for uncharged and hydrogen charged samples
Test 1 Test 2 Test 3 Average Standard Deviation (%)
Energy absorbed (J) (Uncharged)
3.8 3.8 4.0 3.87 3.10
Energy absorbed (J) (H+ Charged)
3.9 4.9 3.9 4.23 13.71
From Table 2, a difference of 0.36J can be seen in the energy absorbed by the specimen before fracture for the uncharged and hydrogen charged case. Moreover, in both the cases, very poor impact toughness values are observed due to high strength but insignificant ductility of EN-GJS-600-3. It is interesting to note that hydrogen uptake increased the microhardness values whereas, a negligible difference was observed in the material impact toughness as indicated by Table 2. The only possible reason behind it can be attributed to high deformation rate associated with the impact testing. As the specimen fractured within milliseconds, hydrogen didn’t get enough time to diffuse to the crack tip from the graphite/ matrix interface and deterioate the specimen ductility during the deformation process. The slight increase in the material impact toughness results from the increased yield strength of the hydrogen charged specimen due to solution hardening as discussed previously. However, high deformation rate as well as the solution hardening alone cannot explain the increase in impact toughness of the material by hydrogen uptake since detailed microstructural analysis needs to be done to support the theory. Moreover, the fracture surface of the specimen must be carefully examined by using high magnification microscope such as scanning electron microscope (SEM) to confirm that hydrogen uptake didn’t result in the specimen ductility loss during the fracture process. CONCLUSIONS The effect of hydrogen on the impact response of EN-GJS-600-3 ductile cast iron was investigated by conducting impact tests with and without hydrogen pre-charging. Microhardness tests were performed on the uncharged and hydrogen charged sample prior to impact testing for determining correlation between material hardness and impact toughness. According to the present study, the following conclusions were obtained:
UEMK 2019 Proceedings Book 24/25 October 2019 Gaziantep University, TURKEY
364
Hydrogen charging led to a marked increase in the material hardness while negligible difference was observed in the material impact toughness with the impact toughness of hydrogen charged specimen being slightly greater than the uncharged one. The increase in hardness can be attributed to solid solution hardening casued by interstitial hydrogen present in the material. Slight increase in the material impact toughess by the hydrogen uptake can be attributed to high deformation rate and solid solution hardening. However, this alone cannot explain the difference as detailed microstructural analysis needs to be done to confirm the theory. REFERENCES Cialone, H., & Asaro, R. J. (1979). The role of hydrogen in the ductile fracture of plain carbon steels. Metallurgical Transactions A, 10(3), 367–375. https://doi.org/10.1007/BF02658347 El-Amoush, A. S. (2008). An investigation of hydrogen-induced hardening in 7075-T6 aluminum alloy. Journal of Alloys and Compounds, 465(1–2), 497–501. https://doi.org/10.1016/J.JALLCOM.2007.10.126 Koyama, M., Akiyama, E., Lee, Y.-K., Raabe, D., & Tsuzaki, K. (2017). Overview of hydrogen embrittlement in high-Mn steels. International Journal of Hydrogen Energy, 42(17), 12706–12723. https://doi.org/10.1016/J.IJHYDENE.2017.02.214 Matsunaga, H., Matsuno, K., & Hayashida, K. (2011). Effect of Hydrogen on Tensile Properties of a Ductile Cast Iron. In Supplemental Proceedings (pp. 447–454). Hoboken, NJ, USA: John Wiley & Sons, Inc. https://doi.org/10.1002/9781118062173.ch56 Matsunaga, H., Usuda, T., Yanase, K., & Endo, M. (2013). Ductility loss in Hydrogen-charged Ductile Cast Iron. Chinese Society of Theoretical and Applied Mechanics. Retrieved from https://kyushu-u.pure.elsevier.com/en/publications/ductility-loss-in-hydrogen-charged-ductile-cast-iron Matsunaga, H., Usuda, T., Yanase, K., & Endo, M. (2014). Ductility Loss in Ductile Cast Iron with Internal Hydrogen. Metallurgical and Materials Transactions A, 45(3), 1315–1326. https://doi.org/10.1007/s11661-013-2109-9 Murakami, Y., Kanezaki, T., & Mine, Y. (2010). Hydrogen Effect against Hydrogen Embrittlement. Metallurgical and Materials Transactions A, 41(10), 2548–2562. https://doi.org/10.1007/s11661-010-0275-6

UEMK 2019 Proceedings Book 24/25 October 2019 Gaziantep University, TURKEY
365
Stępień, K., & Kupka, M. (2008). Effect of hydrogen on room-temperature hardness of B2 FeAl alloys. Scripta Materialia, 59(9), 999–1001. https://doi.org/10.1016/J.SCRIPTAMAT.2008.07.002 Symons, D. M. (1994). An investigation into the effects of hydrogen on the fracture and deformation of Alloy X-750. West Mifflin, PA (United States). https://doi.org/10.2172/10195743 Usuda, T., Matsuno, K., Matsunaga, H., Yanase, K., & Endo, M. (2013). Hydrogen-Induced Ductility Loss in Cast Irons. Materials Science Forum, 750, 260–263. https://doi.org/10.4028/www.scientific.net/MSF.750.260.

UEMK 2019 Proceedings Book 24/25 October 2019 Gaziantep University, TURKEY
366
THE EFFECTS OF METHYLPARABEN AND
PROPYLPARABEN ON EARLY DEVELOPMENTAL STAGES
AND TRANSCRIPTIONAL PROFILES OF ZEBRAFISH
Ceyhun Bereketoglu Biology, The Life Science Center, School of Science and Technology, Örebro University, SE-701 82 Örebro, Sweden. Iskenderun Technical University, Faculty of Engineering and Natural Sciences, Department of Biomedical Engineering, Hatay, Turkey [email protected], Ajay Pradhan Biology, The Life Science Center, School of Science and Technology, Örebro University, SE-701 82 Örebro, Sweden. [email protected] ABSTRACT: Parabens are preservatives used in various commercial products such as food, cosmetics and pharmaceuticals. Parabens have been shown to accumulate in the environment and have negative impacts on animals as well as human health. In this study, we performed a comprehensive research to determine the effects associated with propylparaben (PP) and methylparaben (MP) on early developmental stages of zebrafish. We analyzed developmental abnormalities, hatching, and mortality as well as gene expression profiles in the embryos exposed to both compounds. We showed that both MP (≥ 100 µM) and PP (≥10 µM) are toxic to the embryos in a dose-dependent manner and resulted in developmental abnormality. We observed several malformations including spinal defects, pericardial edema, and pigmentation defects in response to both MP and PP treatments. These data indicate that PP is more toxic than MP. We used 1 and 10 µM doses of MP and PP to determine gene expression profiles. We showed that several genes involved in different physiological pathways such as stress response, cell cycle and DNA damage, inflammation, fatty acid metabolism and endocrine functions were affected by MP and PP. The gene expression analysis demonstrate that parabens may cause toxicity by inducing oxidative stress, DNA double-strand breaks, apoptosis as well as by altering fatty acid metabolism. Altogether, this study provides considerable information on the adverse effects of MP and PP using different physiological endpoints. Keywords: toxicity, gene expression, stress response, development abnormality.

UEMK 2019 Proceedings Book 24/25 October 2019 Gaziantep University, TURKEY
367
Acknowledgements: This study was supported by Knowledge Foundation, Sweden and Örebro University.

UEMK 2019 Proceedings Book 24/25 October 2019 Gaziantep University, TURKEY
368
TURKEY’S ELECTRICITY CONSUMPTION FORECASTING
with ARTIFICIAL NEURAL NETWORKS
Şeyma EMEÇ Ataturk University [email protected] Gökay AKKAYA Ataturk University [email protected] ABSTRACT: Sensitive information on future demand for electrical energy helps countries and companies greatly. In this way, planning of development works is made easier and wrong planning and misuse of resources can be prevented. Artificial neural networks (ANN) model was developed by using MATLAB software to forecast Turkey's future electrical energy in this study. In the forecasting of electrical energy, the values of independent variables such as gross domestic product (GDP), population, export, import and installed capacity between 1990 and 2016 were used in the model. Then, model 3000 was run for iteration. The results showed that the developed ANN model made demand forecast with high accuracy and the R value expressing the forecast performance was 99,259%. Key words: Artificial Neural Networks, Demand forecasting, Electrical Energy INTRODUCTION Energy sources become more important due to the increase in population and industrialization in the world. Therefore, energy is seen as one of the basic building blocks of economic development. Electrical energy has the most flexible structure among energy items due to its advantages such as ease of use, being able to convert to other energy types at any time and its prevalence in daily life. Plans on demand, supply, transmission, distribution and pricing are of great importance for the healthy development of the electricity sector. One of the most important problems of planning to be made is future demand information. Failure to store electrical energy increases the importance of accuracy level in demand forecasting. It is clear that the more accurate the estimations to be made are, the more valid the planning studies will be.

UEMK 2019 Proceedings Book 24/25 October 2019 Gaziantep University, TURKEY
369
There is a large increase in energy and particularly electricity use in parallel with Turkey’s rapid population growth and economic growth. Accurate and reliable forecasting of electricity demand will play an important role in determining the energy strategy of our country. (Turker and Koksal, 2008). In this context, Turkey’s net electrical power demand forecasting has been made using the method of ANN in this study. LITERATURE REVIEW Many methods such as time series (Amarawickrama and Hunt, 2008), regression model (Bessec and Fouquau, 2008), genetic algorithm (Lee and Tong, 2011), fuzzy logic (Kucukali and Baris, 2010), artificial neural networks (Hamzaçebi et al., 2017) are used in literature for energy demand forecasting. Many studies have shown that artificial neural networks (ANNs) give as much or even better results as traditional methods (Hill et al., 1996; Sharda and Patil, 1992; Tang et al., 1991) in future forecasting. There are many studies forecasting Turkey’s electrical energy demand using artificial neural. In the study of Hamzaçebi and Kutay (2004), they forecasted electrical energy for 2003-2010, Hamzaçebi (2007) forecasted electrical energy on a sectoral basis for 2005-2020, Kavaklıoğlu (2011) calculated electrical energy forecasting for 2007-2026 using 4 input variables (population, imports, exports and gross national product) in his study, Kavaklıoğlu et al. (2009) used GSHM, population, exports, imports for 2007-2027 electrical energy forecasting. Bilgili et al. (2012) forecasted electrical energy in residential and industrial sector in 2008-2015 and took into account input variables, installed capacity, gross electricity generation and population. Özden and Öztürk (2018) forecasted seasonal electrical energy for 2014-2016 and Hamzaçebi et al. (2017) forecasted seasonal electrical energy for 2015-2018, Başoğlu and Bulut (2017) seasonal electrical energy short-term electricity demand in their studies. METHODS Artificial Neural Networks ANN is a generalization of the mathematical model of human perception and biological nerves. ANN is a combination of artificial nerve cells that are developed by inspiration from biological nerve cells. The most important features of ANN are modeling of nonlinear structures, parallel distributed structure, learning and generalization ability, applicability for different problems and having fault tolerance. ANN does not require any prior knowledge between input and output variables. The input information and the output information corresponding to the information are provided to the network and the network is allowed to learn the relationship between

UEMK 2019 Proceedings Book 24/25 October 2019 Gaziantep University, TURKEY
370
the input-output variable. This learning process is called consultative learning. In the solution of the present problem, back propagation algorithm from the consultative learning method was used. Learning of an artificial neural network by back propagation algorithm consists of two stages including forward and backward calculation. In the forward calculation, the input variables that come to the network are processed by weight matrices and the output values are calculated. Then, backward propagation of the network and the network weights are rearranged based on minimizing the error value between the output value produced by the network and the actual value. This process continues until the network produces the desired output. ANN can be used for both cause and effect forecasting and time series forecasting methods. For a forecasting problem based on the cause-effect relationship, the inputs of ANN express the independent variable. The output is dependent variable. The nonlinear functional relationship determined by ANN can be written as in Equation 1.
1 2(x , x ,..., x )nY f
In the above equation, 1 2x , x ,..., xn is ‘n unit’ independent variable and Y is the dependent
variable. For a time series-based forecasting problem, ANN's inputs consist of historical observation values of the data series, while the output represents the future forecasting value. The nonlinear relationship determined by ANN can be written as in Equation 2.
1 1( , ,..., )t t t t nY f Y Y Y
Application In the literature, it is seen that the independent variables used in the studies conducted with forecasting methods based on cause-effect relationship differ. In this study, independent variables that can be added to the model in order to forecast the model to be established with ANN and the net energy demand reliably and steadily, and independent variables such as “gross domestic product (GDP), population, export, import and installed power capacity” that reached to enough historical observation values were added to the model. After data were used for independent variables (GDP: WorldBankData, 2019; Population: Turkey Population, 2019; Installed power, TEIASa, 2019; Exports and Imports, TEIASb, 2019) obtained from official sources from 1990 to 2016 and the model was established by Matlab Neural Network Toolbox software. 70% of the available data were used for training, 15% for verification and 15% for test set. Both input and output data were converted to the range of [0,1] by simple normalization process. Since the number of single hidden layers in the literature is sufficient for achieving successful results, the single hidden layer was preferred (Zhang et al., 1998). The number
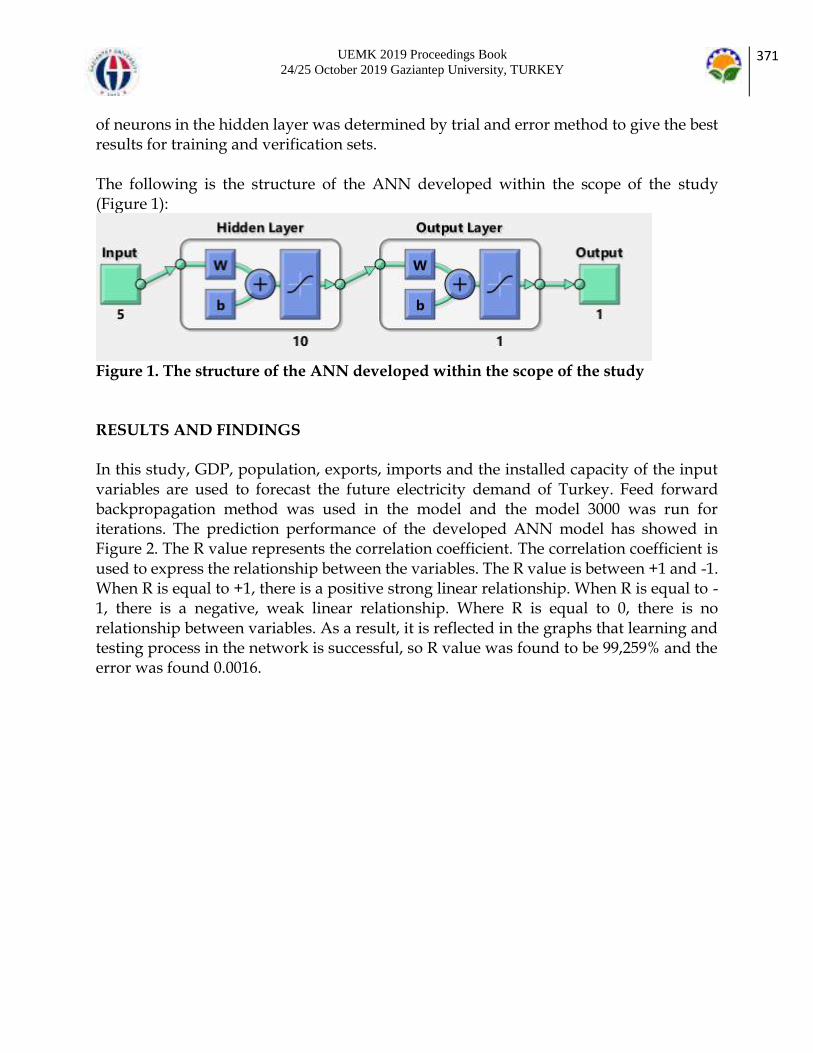
UEMK 2019 Proceedings Book 24/25 October 2019 Gaziantep University, TURKEY
371
of neurons in the hidden layer was determined by trial and error method to give the best results for training and verification sets. The following is the structure of the ANN developed within the scope of the study (Figure 1):
Figure 1. The structure of the ANN developed within the scope of the study RESULTS AND FINDINGS In this study, GDP, population, exports, imports and the installed capacity of the input variables are used to forecast the future electricity demand of Turkey. Feed forward backpropagation method was used in the model and the model 3000 was run for iterations. The prediction performance of the developed ANN model has showed in Figure 2. The R value represents the correlation coefficient. The correlation coefficient is used to express the relationship between the variables. The R value is between +1 and -1. When R is equal to +1, there is a positive strong linear relationship. When R is equal to -1, there is a negative, weak linear relationship. Where R is equal to 0, there is no relationship between variables. As a result, it is reflected in the graphs that learning and testing process in the network is successful, so R value was found to be 99,259% and the error was found 0.0016.
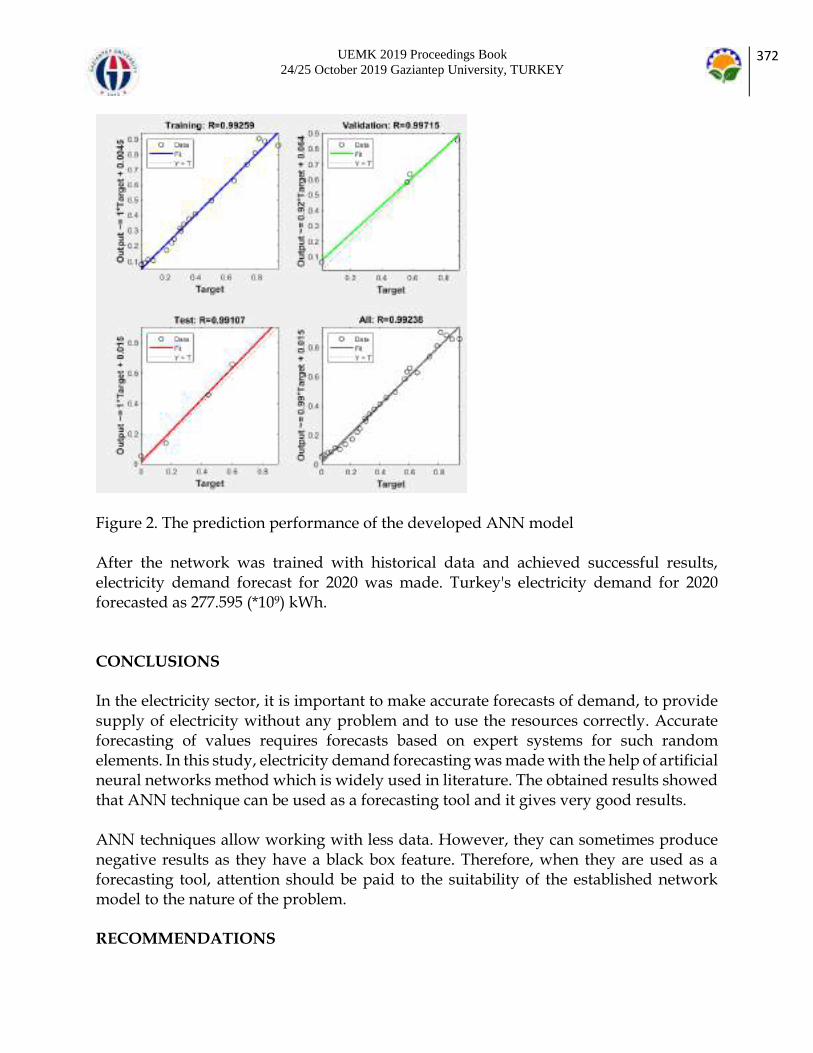
UEMK 2019 Proceedings Book 24/25 October 2019 Gaziantep University, TURKEY
372
Figure 2. The prediction performance of the developed ANN model After the network was trained with historical data and achieved successful results, electricity demand forecast for 2020 was made. Turkey's electricity demand for 2020 forecasted as 277.595 (*109) kWh. CONCLUSIONS In the electricity sector, it is important to make accurate forecasts of demand, to provide supply of electricity without any problem and to use the resources correctly. Accurate forecasting of values requires forecasts based on expert systems for such random elements. In this study, electricity demand forecasting was made with the help of artificial neural networks method which is widely used in literature. The obtained results showed that ANN technique can be used as a forecasting tool and it gives very good results. ANN techniques allow working with less data. However, they can sometimes produce negative results as they have a black box feature. Therefore, when they are used as a forecasting tool, attention should be paid to the suitability of the established network model to the nature of the problem. RECOMMENDATIONS

UEMK 2019 Proceedings Book 24/25 October 2019 Gaziantep University, TURKEY
373
Future studies can develop and forecast a new model using different independent variables. The results obtained can be compared with other forecasting methods and the results can be discussed. The distribution of the electrical energy forecasting according to the sectors can be forecasted. REFERENCES Amarawickrama, H. A., & Hunt, L. C. (2008). Electricity demand for Sri Lanka: a time series analysis. Energy, 33(5), 724-739. Başoğlu, B., & Bulut, M. (2017). Kısa dönem elektrik talep tahminleri için yapay sinir ağları ve uzman sistemler tabanlı hibrit sistem geliştirilmesi. Journal of the Faculty of Engineering and Architecture of Gazi University, 32(2), 575-583. Bilgili, M., Sahin, B., Yasar, A., & Simsek, E. (2012). Electric energy demands of Turkey in residential and industrial sectors. Renewable and Sustainable Energy Reviews, 16(1), 404-414. Bessec, M., & Fouquau, J. (2008). The non-linear link between electricity consumption and temperature in Europe: a threshold panel approach. Energy Economics, 30(5), 2705-2721. Hamzaçebi, C., Es, H. A., & Çakmak, R. (2017). Forecasting of Turkey’s monthly electricity demand by seasonal artificial neural network. Neural Computing and Applications, 1-15. Hamzaçebi, C., & Kutay, F. (2004). Yapay sinir ağlari ile türkiye elektrik enerjisi tüketiminin 2010 yilina kadar Tahmini. Gazi Üniversitesi Mühendislik-Mimarlık Fakültesi Dergisi, 19(3). Hamzaçebi, C. (2007). Forecasting of Turkey's net electricity energy consumption on sectoral bases. Energy policy, 35(3), 2009-2016. Hill, T., O'Connor, M., & Remus, W. (1996). Neural network models for time series forecasts. Management science, 42(7), 1082-1092. Kavaklioglu, K., Ceylan, H., Ozturk, H. K., & Canyurt, O. E. (2009). Modeling and prediction of Turkey’s electricity consumption using artificial neural networks. Energy Conversion and Management, 50(11), 2719-2727. Kavaklioglu, K. (2011). Modeling and prediction of Turkey’s electricity consumption using Support Vector Regression. Applied Energy, 88(1), 368-375. Kucukali, S., & Baris, K. (2010). Turkey’s short-term gross annual electricity demand forecast by fuzzy logic approach. Energy policy, 38(5), 2438-2445. Lee, Y. S., & Tong, L. I. (2011). Forecasting energy consumption using a grey model improved by incorporating genetic programming. Energy conversion and Management, 52(1), 147-152. ÖZDEN, S., & ÖZTÜRK, A. (2018). Yapay sinir ağları ve zaman serileri yöntemi ile bir endüstri alanının (ivedik OSB) elektrik enerjisi ihtiyaç tahmini. Bilişim Teknolojileri Dergisi, 11(3), 255-261.

UEMK 2019 Proceedings Book 24/25 October 2019 Gaziantep University, TURKEY
374
Sharda, R., & Patil, R. B. (1992). Connectionist approach to time series prediction: an empirical test. Journal of Intelligent Manufacturing, 3(5), 317-323. Tang, Z., De Almeida, C., & Fishwick, P. A. (1991). Time series forecasting using neural networks vs. Box-Jenkins methodology. Simulation, 57(5), 303-310. WorldBankData (2019). World Development Indicators. Retrieved September 10, 2019 from https://databank.worldbank.org/source/world-development-indicators/Type/TABLE/preview/on#. Türker, L., Köksal, M.A.(2008). TÜRKİYE’NİN UZUN DÖNEM ELEKTRİK TALEBİ VE BUNA BAĞLI CO2 EMİSYONUNUN TAHMİNİ. Hava Kirliliği ve Kontrolü Ulusal Sempozyumu, 22‐25 Ekim 2008, HATAY. Turkey Population (2019). Population Information Turkey by Provinces and Districts. Retrieved September 05, 2019 from. https://www.nufusu.com/ulke/turkiye-nufusu. Turkish Electricity Transmission (TEIAS)a. Turkey installed power for 1990-2016. Retrieved September 03, 2019 from. https://www.teias.gov.tr/tr/i-kurulu-guc-0 . Turkish Electricity Transmission(TEIAS)b. Turkey exports and imports for 1990-2016. Retrieved September 03, 2019 from. https://www.teias.gov.tr/tr/v-ithalat-ihracat-0. Zhang, G., Patuwo, B. E., & Hu, M. Y. (1998). Forecasting with artificial neural networks: The state of the art. International journal of forecasting, 14(1), 35-62.

UEMK 2019 Proceedings Book 24/25 October 2019 Gaziantep University, TURKEY
375
FUZZY CHINESE POSTMAN PROBLEM AND AN
APPLICATION
Özlem ÇOMAKLI SÖKMEN Erzurum Technical University [email protected] Mustafa YILMAZ Ataturk University [email protected] ABSTRACT: Arc routing problems are the problems used to determine the shortest path or paths that returns to the starting vertex by traversing all arcs or edges on a graph at least once. Chinese Postman Problem (CPP), one of the arc routing problems; can be defined as the problem of returning to the starting point after a postman traverses all connections on the defined network. In this study, Fuzzy CPP (FCPP) was applied on an example problem since factors such as traffic density and weather conditions changed the arrival time between two vertices. In the problem, the objective function coefficients are considered as fuzzy and triangular fuzzy numbers were used. The mathematical model established in the study; was solved using GAMS, a high-level programming language used for the solution of modeling and optimization problems. Key words: fuzzy chinese postman problem, triangular fuzzy number, arc routing problem INTRODUCTION Chinese Postman Problem (CPP) first studied in 1962 by a Chinese mathematician called Mei-Ko Kwan, may be defined as the delivery of mails that a postman receives from the post office in the shortest possible path by traversing all streets/roads in the city and returning to the post office which is the starting vertex after the delivery is completed (Ahujava et al. 1993, Eiselt et al. 1995). CPP may be used in several areas such as mail delivery, garbage collection, snow and ice controls on streets and highways, road gritting, snow removal and street cleaning operations, school bus and police patrol vehicles routing, water and newspaper distribution, effective web site determination (Thimbleby 2003). Expenditures of public and private enterprises in these areas are increasing day by day and reach to high amounts. Due to insufficient planning and faulty investments, a significant amount of resources is extravagantly spent in these areas. Therefore, the importance of such problems is increasing and is being the subject of many researches.
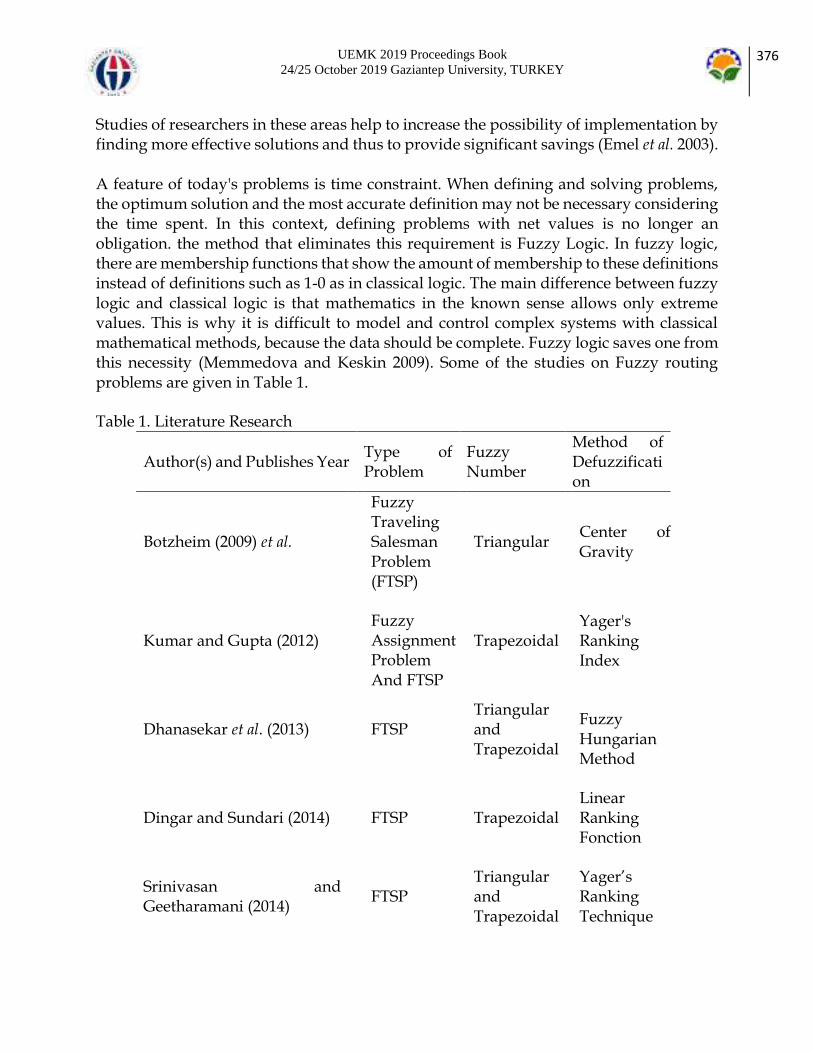
UEMK 2019 Proceedings Book 24/25 October 2019 Gaziantep University, TURKEY
376
Studies of researchers in these areas help to increase the possibility of implementation by finding more effective solutions and thus to provide significant savings (Emel et al. 2003). A feature of today's problems is time constraint. When defining and solving problems, the optimum solution and the most accurate definition may not be necessary considering the time spent. In this context, defining problems with net values is no longer an obligation. the method that eliminates this requirement is Fuzzy Logic. In fuzzy logic, there are membership functions that show the amount of membership to these definitions instead of definitions such as 1-0 as in classical logic. The main difference between fuzzy logic and classical logic is that mathematics in the known sense allows only extreme values. This is why it is difficult to model and control complex systems with classical mathematical methods, because the data should be complete. Fuzzy logic saves one from this necessity (Memmedova and Keskin 2009). Some of the studies on Fuzzy routing problems are given in Table 1. Table 1. Literature Research
Author(s) and Publishes Year Type of Problem
Fuzzy Number
Method of Defuzzification
Botzheim (2009) et al.
Fuzzy Traveling Salesman Problem (FTSP)
Triangular Center of Gravity
Kumar and Gupta (2012)
Fuzzy Assignment Problem And FTSP
Trapezoidal Yager's Ranking
Index
Dhanasekar et al. (2013) FTSP
Triangular and Trapezoidal
Fuzzy Hungarian Method
Dingar and Sundari (2014) FTSP Trapezoidal
Linear Ranking Fonction
Srinivasan and Geetharamani (2014)
FTSP
Triangular and Trapezoidal
Yager’s Ranking Technique

UEMK 2019 Proceedings Book 24/25 October 2019 Gaziantep University, TURKEY
377
Crisan and Nechita (2008) FTSP Triangular
Center of Mass Method
Yahya Mohamed and Divya (2016)
FTSP Octagonal
Robust Ranking Technique
When the related literature is examined, it is seen that there has not been a study conducted on Fuzzy Chinese Postman Problem (FCPP) before. In real life problems, transportation time between the two centers varies greatly due to various reasons such as weather conditions, traffic density and traffic accidents. Therefore, the objective function coefficients representing the arrival time between two vertices are considered as triangular fuzzy numbers (TFNs) in this study. Robust’s Ranking Method frequently used in the literature in order to defuzzificate (Defuzzification) the used triangular fuzzy numbers was used. The proposed model was applied on a small size sample problem. It is aimed to make the new problem type developed to be the first study in the literature and to increase its applicability. METHODS Fuzzy Chinese Postman Problem CPP may be defined as the problem of returning to the starting point after a postman traverses all connections on the defined network for the distribution and collection of letters. In this type of problem, the problem turns into FCPP when the objective function coefficient values showing the arrival time between two vertices are considered as fuzzy. On a graph G = (V, E); where edge (i, j) establishes a connection between vertices i and j. Mathematical model, parameters and variables for CPP are given in following (Yılmaz et al. 2017). In this model, the model is valid for FCPP when the objective function coefficients are considered as fuzzy. Variables; xij : The main decision variable which represents the number of times arc (i,j) is traversed in each cycle using vehicle starting from node i ending at node j. The variable is integer. xji : Decision variable which represents the number of times arc (j,i) is traversed in each cycle using vehicle starting from node j ending at node i. The variable is integer. Parameters;
ij: The length for traversing arc (i,j). (Fuzzy times are used instead of distance.) V: Set including all nodes in the network,

UEMK 2019 Proceedings Book 24/25 October 2019 Gaziantep University, TURKEY
378
E: Set including all edges in the network, n: Total number of nodes in network. The entire formulation can be seen in the following,
Min:∑∑C 𝑖𝑗 𝑥𝑖𝑗
𝑛
𝑗=1
𝑛
𝑖=1
(1)
Subject to ∑ 𝑥𝑖𝑗 − ∑ 𝑥𝑗𝑖
𝑛𝑗=1
𝑛𝑗=1 = 0 ; 𝑖 = 1,2, … , n ∀𝑖∈ 𝑉 (2)
𝑥𝑖𝑗 + 𝑥𝑗𝑖 ≥ 1 ∀(𝑖, 𝑗) ∈ 𝐸 (3)
𝑥𝑖𝑗 , 𝑥𝑗𝑖 ≥ 0 and integer (4)
The fuzzy objective function (1) minimizes the total length of route R that is covered by track inspection vehicle. Eq. (2) is flow conservation at each node constraint which guarantees the creation of a tour of the network for the vehicle. Eq. (3) ensures that each arc that exists is covered at least once during each cycle regardless of its direction using the vehicle. Eq. (4) is restriction on the variables. Fuzzy Set The characteristic function µA of a crisp set A ⊆ X assigns a value either 0 or 1 to each member in X . A function µ such that the value assigned to the element of the universal set X fall within a specified range i.e µ : X → [0,1] . The assigned value indicates the membership grade of the element in the set A . The function µ(x) is called the membership function and the set à = (x, µ(x) ; x ∈ X) defined by µ(x) for each x ∈ X is called a fuzzy set (Prabha and Shanmugavel 2016). Linguistic Variables Linguistic variables are variables that can take words in a language as a variable value. For example, it is expressed in words such as “hot” or “cold”. The most important feature that distinguishes fuzzy logic from other systems is that it allows the use of linguistic variables (Özkan 2003). Linguistic variables are used to express very complex or poorly defined situations quantitively (Chen et al. 2005). Triangular fuzzy number (TFNs) A TFN à is specified by three parameters (a1, a2, a3) and is defined by its continuous membership function µÃ (x) : X → [0, 1] as follows (Giri et al. 2015):
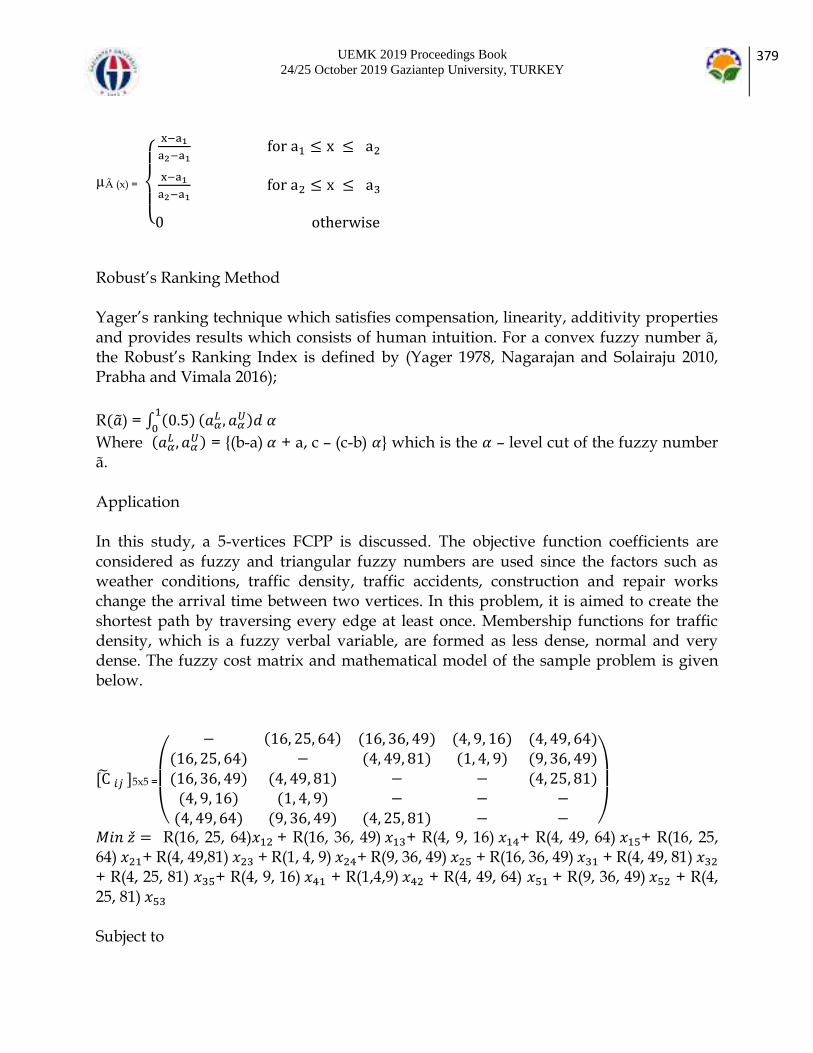
UEMK 2019 Proceedings Book 24/25 October 2019 Gaziantep University, TURKEY
379
µÃ (x) =
x−a1
a2−a1 for a1 ≤ x ≤ a2
x−a1
a2−a1 for a2 ≤ x ≤ a3
0 otherwise
Robust’s Ranking Method Yager’s ranking technique which satisfies compensation, linearity, additivity properties and provides results which consists of human intuition. For a convex fuzzy number ã, the Robust’s Ranking Index is defined by (Yager 1978, Nagarajan and Solairaju 2010, Prabha and Vimala 2016);
R() = ∫ (0.5)1
0(𝑎𝛼
𝐿 , 𝑎𝛼𝑈)𝑑 𝛼
Where (𝑎𝛼𝐿 , 𝑎𝛼
𝑈) = (b-a) 𝛼 + a, c – (c-b) 𝛼 which is the 𝛼 – level cut of the fuzzy number ã. Application In this study, a 5-vertices FCPP is discussed. The objective function coefficients are considered as fuzzy and triangular fuzzy numbers are used since the factors such as weather conditions, traffic density, traffic accidents, construction and repair works change the arrival time between two vertices. In this problem, it is aimed to create the shortest path by traversing every edge at least once. Membership functions for traffic density, which is a fuzzy verbal variable, are formed as less dense, normal and very dense. The fuzzy cost matrix and mathematical model of the sample problem is given below.
[C 𝑖𝑗 ]5x5 =
(
− (16, 25, 64) (16, 36, 49) (4, 9, 16) (4, 49, 64)(16, 25, 64) − (4, 49, 81) (1, 4, 9) (9, 36, 49)
(16, 36, 49) (4, 49, 81) − − (4, 25, 81)(4, 9, 16) (1, 4, 9) − − −(4, 49, 64) (9, 36, 49) (4, 25, 81) − − )
𝑀𝑖𝑛 = R(16, 25, 64)𝑥12 + R(16, 36, 49) 𝑥13+ R(4, 9, 16) 𝑥14+ R(4, 49, 64) 𝑥15+ R(16, 25, 64) 𝑥21+ R(4, 49,81) 𝑥23 + R(1, 4, 9) 𝑥24+ R(9, 36, 49) 𝑥25 + R(16, 36, 49) 𝑥31 + R(4, 49, 81) 𝑥32 + R(4, 25, 81) 𝑥35+ R(4, 9, 16) 𝑥41 + R(1,4,9) 𝑥42 + R(4, 49, 64) 𝑥51 + R(9, 36, 49) 𝑥52 + R(4, 25, 81) 𝑥53 Subject to
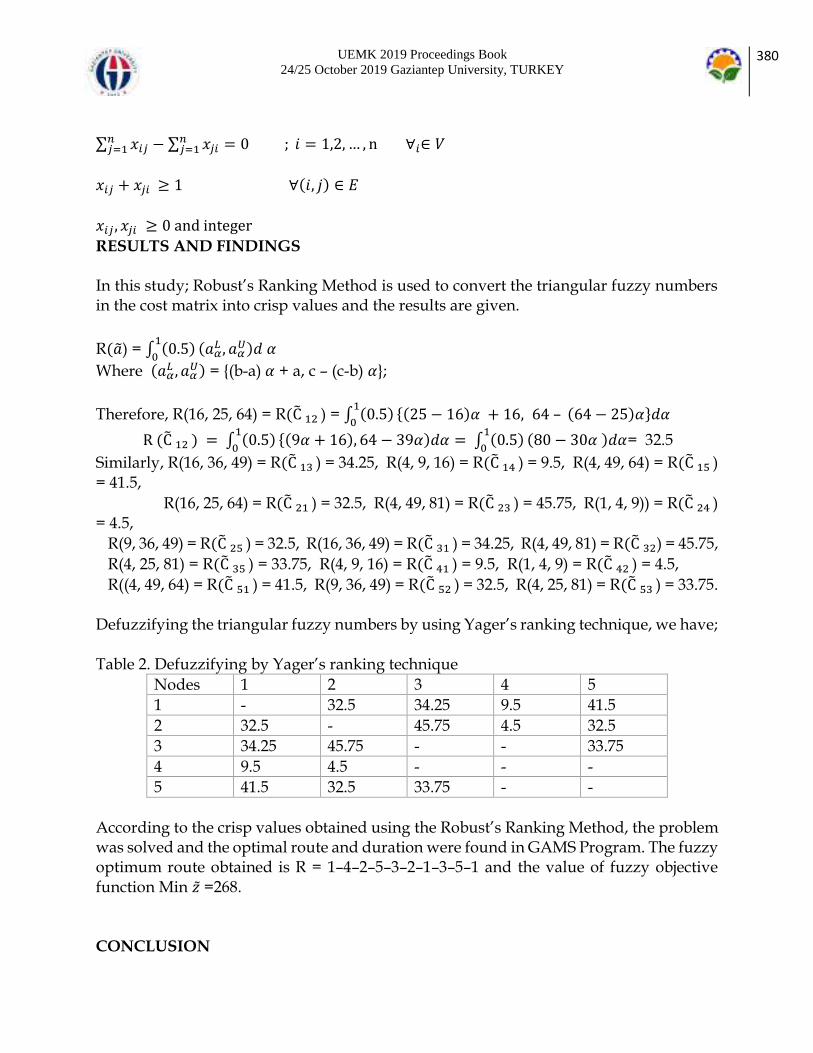
UEMK 2019 Proceedings Book 24/25 October 2019 Gaziantep University, TURKEY
380
∑ 𝑥𝑖𝑗 − ∑ 𝑥𝑗𝑖
𝑛𝑗=1
𝑛𝑗=1 = 0 ; 𝑖 = 1,2, … , n ∀𝑖∈ 𝑉
𝑥𝑖𝑗 + 𝑥𝑗𝑖 ≥ 1 ∀(𝑖, 𝑗) ∈ 𝐸
𝑥𝑖𝑗 , 𝑥𝑗𝑖 ≥ 0 and integer
RESULTS AND FINDINGS In this study; Robust’s Ranking Method is used to convert the triangular fuzzy numbers in the cost matrix into crisp values and the results are given.
R() = ∫ (0.5)1
0(𝑎𝛼
𝐿 , 𝑎𝛼𝑈)𝑑 𝛼
Where (𝑎𝛼𝐿 , 𝑎𝛼
𝑈) = (b-a) 𝛼 + a, c – (c-b) 𝛼;
Therefore, R(16, 25, 64) = R(C 12 ) = ∫ (0.5)1
0(25 − 16)𝛼 + 16, 64 – (64 − 25)𝛼𝑑𝛼
R (C 12 ) = ∫ (0.5)1
0(9𝛼 + 16), 64 − 39𝛼)𝑑𝛼 = ∫ (0.5)
1
0(80 − 30𝛼 )𝑑𝛼= 32.5
Similarly, R(16, 36, 49) = R(C 13 ) = 34.25, R(4, 9, 16) = R(C 14 ) = 9.5, R(4, 49, 64) = R(C 15 ) = 41.5,
R(16, 25, 64) = R(C 21 ) = 32.5, R(4, 49, 81) = R(C 23 ) = 45.75, R(1, 4, 9)) = R(C 24 ) = 4.5,
R(9, 36, 49) = R(C 25 ) = 32.5, R(16, 36, 49) = R(C 31 ) = 34.25, R(4, 49, 81) = R(C 32) = 45.75,
R(4, 25, 81) = R(C 35 ) = 33.75, R(4, 9, 16) = R(C 41 ) = 9.5, R(1, 4, 9) = R(C 42 ) = 4.5,
R((4, 49, 64) = R(C 51 ) = 41.5, R(9, 36, 49) = R(C 52 ) = 32.5, R(4, 25, 81) = R(C 53 ) = 33.75. Defuzzifying the triangular fuzzy numbers by using Yager’s ranking technique, we have; Table 2. Defuzzifying by Yager’s ranking technique
Nodes 1 2 3 4 5
1 - 32.5 34.25 9.5 41.5
2 32.5 - 45.75 4.5 32.5
3 34.25 45.75 - - 33.75
4 9.5 4.5 - - -
5 41.5 32.5 33.75 - -
According to the crisp values obtained using the Robust’s Ranking Method, the problem was solved and the optimal route and duration were found in GAMS Program. The fuzzy optimum route obtained is R = 1–4–2–5–3–2–1–3–5–1 and the value of fuzzy objective function Min =268. CONCLUSION

UEMK 2019 Proceedings Book 24/25 October 2019 Gaziantep University, TURKEY
381
In this study, an FCPP whose objective function coefficients are triangular fuzzy numbers is discussed. Since the arrival time between the two vertices is not constant in real life problems due to various reasons (such as weather conditions, traffic density, traffic accidents, construction and repair works), fuzzy times are used instead of distance in the objective function. The triangular fuzzy numbers were clarified by Robust’s Ranking Method to obtain crisp values. According to the obtained values, CPP was solved in GAMS Program and optimum route and time were found. When the related literature is examined, it is seen that no study has been conducted on FCPP before. Considering the large amounts of money spent annually for routing problems and wastes due to wrong planning, the importance of studies in this field is seen. RECOMMENDATIONS In future studies, triangular fuzzy numbers can be defuzzificated with different defuzzification methods and the results obtained can be compared. Moreover, the problem may be solved using trapezoidal fuzzy numbers in objective function coefficients and different techniques to defuzzificate them. Moreover, different types of CPP may be fuzzificated and applied to real-life problems. REFERENCES Ahuja, R. K., Magnanti, T. L., & Flows, J. O. N. (1993). Theory, algorithms, and applications. In Network flows. Botzheim, J., Földesi, P., & Kóczy, L. T. (2009, July). Solution for Fuzzy Road Transport Traveling Salesman Problem Using Eugenic Bacterial Memetic Algorithm. In IFSA/EUSFLAT Conf. (pp. 1667-1672). Chen, C. T., Lin, C. T., & Huang, S. F. (2006). A fuzzy approach for supplier evaluation and selection in supply chain management. International journal of production economics, 102(2), 289-301. Crisan, G. C., & Nechita, E. (2008). Solving fuzzy TSP with ant algorithms. International Journal of Computers, Communications and Control, 3, 228-231. Dhanasekar, S., Hariharan, S., & Sekar, P. (2013). Classical Travelling Salesman Problem (TSP) based Approach to Solve Fuzzy TSP using Yager’s Ranking. International Journal of Computer Applications, 975, 8887. Dingar, D. S., & Sundari, K. T. (2014). Neighboring Optimal Solution for Fuzzy Travelling Salesman Problem. International Journal of Engineering Research and General Science, 2(4). Eiselt, H. A., Gendreau, M., & Laporte, G. (1995). Arc routing problems, part I: The Chinese postman problem. Operations Research, 43(2), 231-242.
UEMK 2019 Proceedings Book 24/25 October 2019 Gaziantep University, TURKEY
382
Emel, G. G., Taşkın, Ç., & Dinç, E. (2003). Yönsüz Çinli Postacı Problemi: Polis Devriye Araçları İçin Bir Uygulama. Giri, P. K., Maiti, M. K., & Maiti, M. (2015). Fully fuzzy fixed charge multi-item solid transportation problem. Applied Soft Computing, 27, 77-91. Kumar, A., & Gupta, A. (2012). Assignment and travelling salesman problems with coefficients as LR fuzzy parameters. International Journal of applied science and engineering, 10(3), 155-170. Memmedova, N., & Keskin, İ. (2009). Hayvancılıkta Bulanık Mantık Uygulamaları (Derleme). Selcuk Journal of Agriculture and Food Sciences, 23(47), 89-95. Nagarajan, R., & Solairaju, A. (2010). Computing improved fuzzy optimal Hungarian assignment problems with fuzzy costs under robust ranking techniques. International Journal of Computer Applications, 6(4), 6-13. Özkan, M. M. (2003). Bulanık hedef programlama. Ekin Kitabevi. Prabha, S. K., & Vimala, S. (2016). Implementation of BCM for Solving the Fuzzy Assignment Problem with Various Ranking Techniques. Asian Research Journal of Mathematics, 1(2), 1-11. Srinivasan, A., & Geetharamani, G. (2013). Method for solving fuzzy assignment problem. Applied Mathematical Sciences, 7(113), 5607-5619. Thimbleby, H. (2003). Explaining code for publication. Software: Practice and Experience, 33(10), 975-1001. Yager, R. R. (1979, January). Ranking fuzzy subsets over the unit interval. In 1978 IEEE conference on decision and control including the 17th symposium on adaptive processes (pp. 1435-1437). IEEE. Yahya Mohammed, S., & Divya, M. (2016). Solving fuzzy travelling salesman problem using octagon fuzzy numbers with α-cut and ranking technique. IOSR journal of mahthematics, 12(6), 52-56. Yılmaz, M., Çodur, M. K., & Yılmaz, H. (2017). Chinese postman problem approach for a large-scale conventional rail network in Turkey. Tehnički vjesnik, 24(5), 1471-1477.

UEMK 2019 Proceedings Book 24/25 October 2019 Gaziantep University, TURKEY
383
DEVELOPMENT OF SCADA SYSTEM FOR AN INDUSTRIAL
NATURAL GAS COMPRESSOR STATION
Orhan OKAY Kahramanmaraş Sütçü İmam Üniversitesi Elektrik-Elektronik Mühendisliği Bölümü [email protected] Ö.Fatih KEÇECİOĞLU Kahramanmaraş Sütçü İmam Üniversitesi Elektrik-Elektronik Mühendisliği Bölümü [email protected] Ahmet GANİ Kahramanmaraş Sütçü İmam Üniversitesi Elektrik-Elektronik Mühendisliği Bölümü [email protected] ABSTRACT: In this study, an industrial natural gas compressor station was connected to SCADA (Supervisory Control and Data Acquisition) system and its automation was realized. With the SCADA system, the parameters of an industrial natural gas compressor station can be remotely controlled to prevent possible failures. In the event of a malfunction in the system, the system automatically stops or warns the operator with warning lamps. In this study, critical parameters for an industrial natural gas compressor station can be monitored continuously and interventions can be intervened remotely. With the SCADA system developed for an industrial natural gas compressor station, the facility was controlled and managed with a small number of technical personnel by intervening the failures in the facility without wasting time. With the developed SCADA system, human errors are minimized so that possible work accidents are minimized and the facility is operated safely. Keywords: Industrial Natural Gas Compressor, SCADA ENDÜSTRİYEL BİR DOĞAL GAZ KOMPRESÖR İSTASYONU İÇİN SCADA SİSTEMİNİN GELİŞTİRİLMESİ ÖZET: Bu çalışmada, endüstriyel bir doğal gaz kompresör istasyonu SCADA (Supervisory Control and Data Acquisition: Denetleme Kontrol ve Veri Toplama) sistemi ile irtibanlandırılarak otomasyonu gerçekleştirilmiştir. SCADA sistemi ile endüstriyel bir
UEMK 2019 Proceedings Book 24/25 October 2019 Gaziantep University, TURKEY
384
doğal gaz kompresör istasyonu’nun parametrelerinin, uzaktan kumanda edilmesi sağlanarak olası arızalar gerçekleşmeden önlenebilmektedir. Sistemde arıza oluşması durumunda ise sistem ya otomatik olarak duruşa geçmekte ya da operatörü ikaz lambaları ile uyarmaktadır. Bu çalışmada endüstriyel bir doğal gaz kompresör istasyonu için kritik öneme sahip parametreler sürekli izlenerek, meydana gelebilecek arızalara uzaktan müdahale edilebilmektedir. Endüstriyel bir doğal gaz kompresör istasyonu için geliştirilen SCADA sistemi ile birlikte, tesiste oluşabilecek arızalara zaman kaybedilmeden müdahale edilerek, az sayıda teknik personel ile işletme kontrol edilmiş ve yönetilmiştir. Geliştirilen SCADA sistemi ile insan hataları en aza indirgenmekte böylelikle oluşabilecek iş kazaları da minimuma indirilerek, tesisin güvenli işletilmesi sağlanmaktadır. Anahtar sözcükler: Endüstriyel Doğal Gaz Kompresörü, SCADA 1. GİRİŞ Günümüzde hızla gelişen teknolojinin ilerlemesi, fiziksel iş gücünün küçülmesi yeni yöntem ve modellerini ortaya çıkarmaktadır. Bu yöntem ve modeller bilginin öne çıktığı iletişim çağı 21. yüzyılın ürünü olan ve artık birçok sektörün vazgeçemediği SCADA (Supervisory Control and Data Acquisition) sistemleri, işlevselliğini kanıtlamış, güven duyulan ve bu sebeple günümüzde oldukça yaygın hale gelmiş ve teknolojik açıdan büyük mesafeler kat etmiştir (Kul,2009 ; Özkara,2009). SCADA yazılım ürünleri endüstriyel işletmelerde sistemsel bir alt yapı görevini üstlenerek, işletme içerisi ile dışarısına ait ağlara bağlanarak işletmenin tüm segmentlerinde uyum içerisinde çalışmasına olanak sağlamaktadır. Endüstriyel otomasyon sistemleri tasarım açısından üç bölüm altında incelenebilir. Endüstriyel kumanda sistemleri, geribeslemeli kontrol sistemleri ve veri iletişim sistemleri. Endüstriyel kumanda sistemleri, en küçük üretim birimlerinin çalışma koşullarını (devreye girme ve devreden çıkma) düzenleyen lojik temelli sistemlerdir. Geribeslemeli kontrol sistemleri, çeşitli üretim süreçlerinin her türlü bozucu etkiye karşı, sürecin istenen değerlerde çalışmasını sağlayan sistemlerdir. Veri iletişim sistemleri ise birimler arasında bilginin güvenilir ve hızlı akışını sağlayan donanım ve yazılım sistemleri olup bu amaçla günümüzde yaygın olarak SCADA yazılımları kullanılır (Kurtulan,1999). SCADA, işletme içerisindeki bütün personele reel zamanlı ve ayrıntılı bilgiye diledikleri zaman erişebilme imkânı sağlamaktadır. Bu çalışmada, SCADA sistemi geliştirilerek endüstriyel bir doğal gaz kompresör istasyonu’ndan en verimli şekilde yararlanılması hedeflenmektedir. 2. ENDÜSTRİYEL BİR DOĞAL GAZ KOMPRESÖR İSTASYONU Endüstriyel bir doğal gaz kompresör istasyonu, boru hattı içinde taşınan doğal gazın taşınması sırasında uzak mesafeler sebebiyle ve özellikle kış aylarında doğal gaza artan

UEMK 2019 Proceedings Book 24/25 October 2019 Gaziantep University, TURKEY
385
talebe göre düşen boru hattı basıncını tekrar belirli bir basınç değerine çıkararak, boru hattının doğal gaz taşıma kapasitesini artırmak dolayısıyla doğal gaz arzını karşılamak amacıyla kurulan endüstriyel tesislerdir. Endüstriyel bir doğal gaz kompresör istasyonu 7 ana bölümden oluşmaktadır. Endüstriyel bir doğal gaz kompresör istasyonu bölümleri; İstasyon Giriş ve Çıkış, Pig Alma ve Atma İstasyonu, Bypass Sistemi Filtreleme Sistemi Gaz Sıkıştırma (Türbin ve Kompresör Grubu) Sistemi Gaz Soğutma Sistemi Tahliye (Relief, Blowdown) ve Recycle (Geri Çevrim) Sistemi Ölçüm Sistemi Yardımcı Tesisler (Yakıt gazı ve Yardımcı ekipmanlar Gaz Skidleri, Hava Kompresörleri, Isı Merkezi ve Jeneratörler) Sistemi Endüstriyel bir doğal gaz kompresör istasyonu’nun daha iyi anlaşılabilmesi için 7 ana bölümü detaylı olarak incelenecektir.
Şekil 1. Endüstriyel Bir Doğal Gaz Kompresör İstasyonu’nu Genel Görünümü 2.1.İstasyon Giriş ve Çıkış, Pig Alma ve Atma Istasyonu, Bypass Sistemi
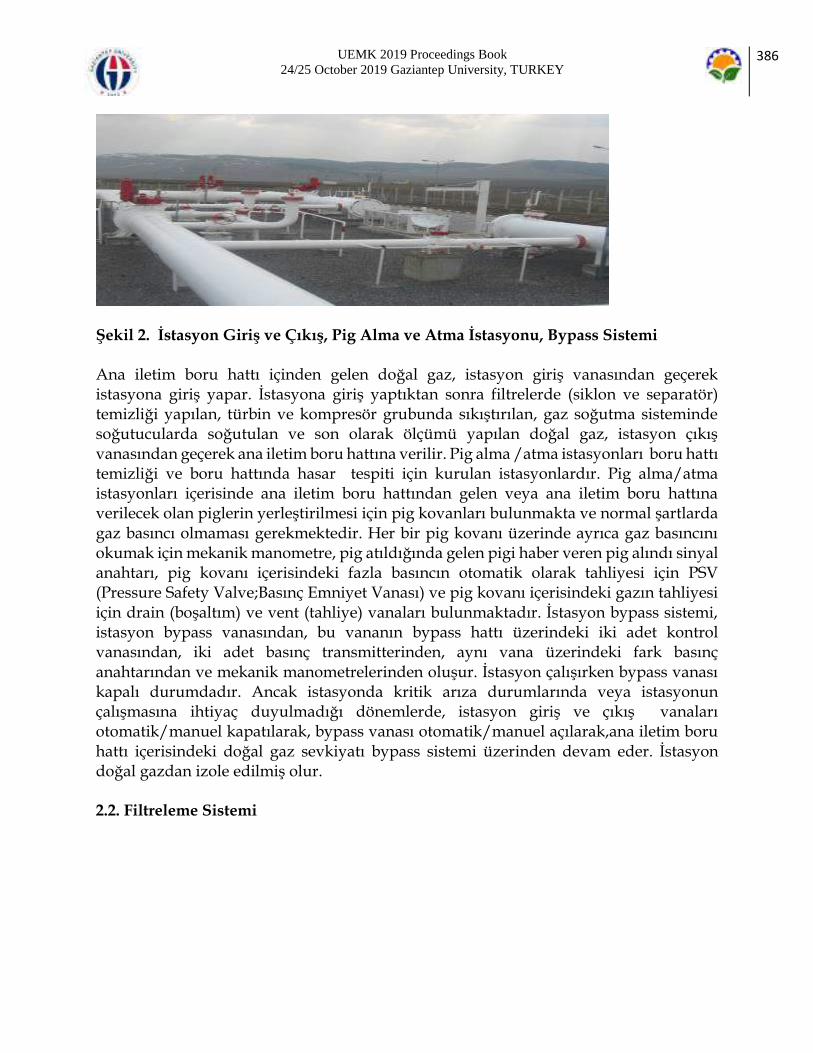
UEMK 2019 Proceedings Book 24/25 October 2019 Gaziantep University, TURKEY
386
Şekil 2. İstasyon Giriş ve Çıkış, Pig Alma ve Atma İstasyonu, Bypass Sistemi Ana iletim boru hattı içinden gelen doğal gaz, istasyon giriş vanasından geçerek istasyona giriş yapar. İstasyona giriş yaptıktan sonra filtrelerde (siklon ve separatör) temizliği yapılan, türbin ve kompresör grubunda sıkıştırılan, gaz soğutma sisteminde soğutucularda soğutulan ve son olarak ölçümü yapılan doğal gaz, istasyon çıkış vanasından geçerek ana iletim boru hattına verilir. Pig alma /atma istasyonları boru hattı temizliği ve boru hattında hasar tespiti için kurulan istasyonlardır. Pig alma/atma istasyonları içerisinde ana iletim boru hattından gelen veya ana iletim boru hattına verilecek olan piglerin yerleştirilmesi için pig kovanları bulunmakta ve normal şartlarda gaz basıncı olmaması gerekmektedir. Her bir pig kovanı üzerinde ayrıca gaz basıncını okumak için mekanik manometre, pig atıldığında gelen pigi haber veren pig alındı sinyal anahtarı, pig kovanı içerisindeki fazla basıncın otomatik olarak tahliyesi için PSV (Pressure Safety Valve;Basınç Emniyet Vanası) ve pig kovanı içerisindeki gazın tahliyesi için drain (boşaltım) ve vent (tahliye) vanaları bulunmaktadır. İstasyon bypass sistemi, istasyon bypass vanasından, bu vananın bypass hattı üzerindeki iki adet kontrol vanasından, iki adet basınç transmitterinden, aynı vana üzerindeki fark basınç anahtarından ve mekanik manometrelerinden oluşur. İstasyon çalışırken bypass vanası kapalı durumdadır. Ancak istasyonda kritik arıza durumlarında veya istasyonun çalışmasına ihtiyaç duyulmadığı dönemlerde, istasyon giriş ve çıkış vanaları otomatik/manuel kapatılarak, bypass vanası otomatik/manuel açılarak,ana iletim boru hattı içerisindeki doğal gaz sevkiyatı bypass sistemi üzerinden devam eder. İstasyon doğal gazdan izole edilmiş olur. 2.2. Filtreleme Sistemi
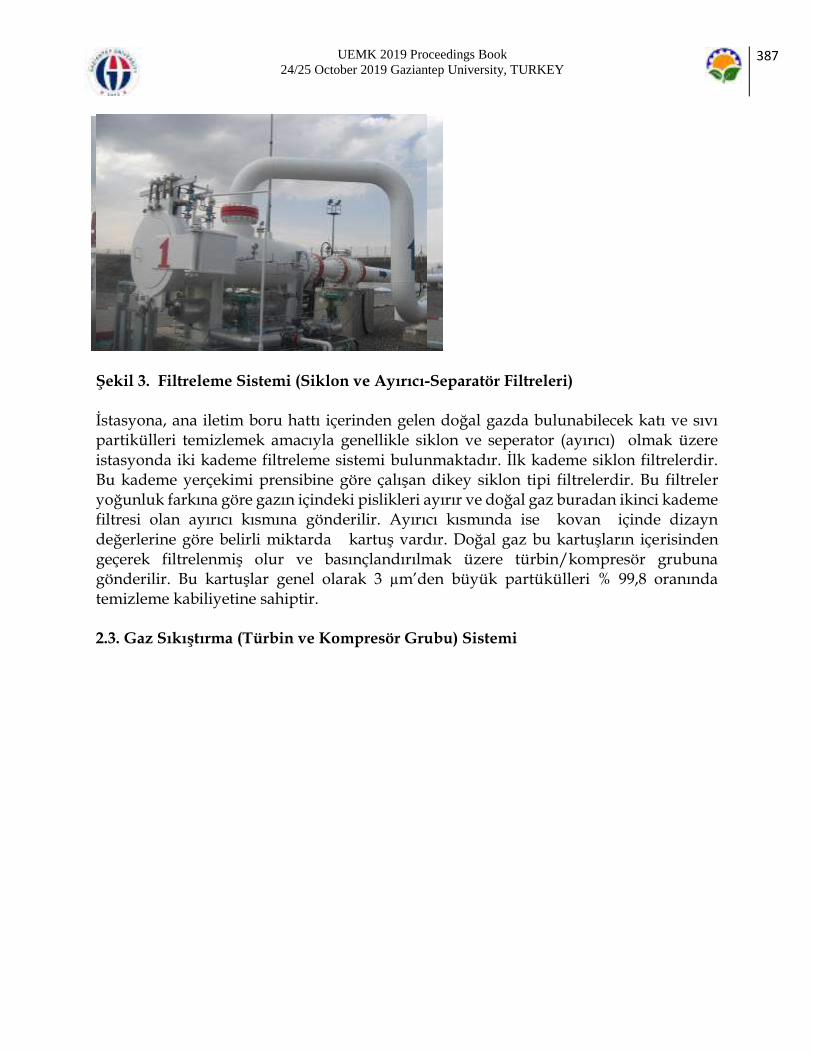
UEMK 2019 Proceedings Book 24/25 October 2019 Gaziantep University, TURKEY
387
Şekil 3. Filtreleme Sistemi (Siklon ve Ayırıcı-Separatör Filtreleri) İstasyona, ana iletim boru hattı içerinden gelen doğal gazda bulunabilecek katı ve sıvı partikülleri temizlemek amacıyla genellikle siklon ve seperator (ayırıcı) olmak üzere istasyonda iki kademe filtreleme sistemi bulunmaktadır. İlk kademe siklon filtrelerdir. Bu kademe yerçekimi prensibine göre çalışan dikey siklon tipi filtrelerdir. Bu filtreler yoğunluk farkına göre gazın içindeki pislikleri ayırır ve doğal gaz buradan ikinci kademe filtresi olan ayırıcı kısmına gönderilir. Ayırıcı kısmında ise kovan içinde dizayn değerlerine göre belirli miktarda kartuş vardır. Doğal gaz bu kartuşların içerisinden geçerek filtrelenmiş olur ve basınçlandırılmak üzere türbin/kompresör grubuna gönderilir. Bu kartuşlar genel olarak 3 µm’den büyük partükülleri % 99,8 oranında temizleme kabiliyetine sahiptir. 2.3. Gaz Sıkıştırma (Türbin ve Kompresör Grubu) Sistemi

UEMK 2019 Proceedings Book 24/25 October 2019 Gaziantep University, TURKEY
388
Şekil 4. Gaz Türbini /Gaz Kompresörü Türbin ve kompresör grubu istasyonun ana ekipmanıdır. Doğal gazın sıkıştırılarak transfer edildiği gaz kompresörü ve gaz kompresörünün tahrik elemanı olarak kullanılan gaz türbinleri ve bunların yardımcı donanımlarından oluşur. 2.3.1 Gaz Kompresörü İstasyonda bulunan gaz kompresörlerinin görevi; gazın hacminin indirgenmesi yolu ile gazın basıncını yükseltmektir. Kompresörde gazın hacminin düşürülmesi yani sıkıştırılmasının sonucu olarak gazın basıncı yükselir ve bu basınç artışı gazın başka bir yere aktarılmasını mümkün kılar. Gaz kompresöründeki gazın sıkıştırılması termodinamik bir olaydır. Gazın sıkıştırılması sonucu basınç ve hacimdeki değişim ile gaz enerjilendirilmiş olur. Tipik olarak kompresör istasyonlarında kullanılan kompresörler santrifüj tip olmakla birlikte uygulama alanlarına göre farklı tipte kompresörler bulunmaktadır. 2.3.2 Gaz Türbini Gaz türbini; yanma ile açığa çıkan ısı enerjisini mekanik enerjiye çevirmeye yarayan bir makinedir. Gaz türbini temelde ısı enerjisinin termodinamik çevrimlerle mekanik enerjiye dönüştürüldüğü bir motordur. Isı enerjisinin mekanik enerjiye dönüştürülmesi Brayton çevrimi olarak bilinen, termodinamik süreçten oluşan çevrim yolu ile olur. Bunlar; - Sıkıştırma: Atmosferik hava burada sıkıştırılır. Sıkıştırılan hava yakıtla karıştırıldığı yanma odasına akar.

UEMK 2019 Proceedings Book 24/25 October 2019 Gaziantep University, TURKEY
389
- Yanma: Sıkıştırılan havaya yakıt (doğal gaz) püskürtülerek ateşlenir ve yanma gerçekleşir. Türbin çalıştığı süre boyunca yanma sürekli devam eder. - Genişleme: Yanma odasında üretilen sıcak gaz hızla genleşir ve gazın basıncı sabit kalırken, gaz hacmi ve akış hızı büyük ölçüde artar. İçinde gazın genleştiği, ısısının, hızının ve basınç enerjisinin büyük kısmını gaz jeneratörü ve güç türbini rotorlarını döndürmek için kullanır. Böylece, genişleyen gaz türbin rotor kanatlarının içinden geçerken mekanik enerji üretilir. - Egzoz: Genişleyen yanma gazı (hava ve yanan gazlar) atmosfere verilir. Bu çalışmada endüstriyel bir doğal gaz kompresör istasyonu için çift şaftlı endüstriyel tip gaz türbini anlatılmaktadır. İstasyonda gaz türbini gazın sıkıştırıldığı gaz kompresörü için sürücü olarak kullanılır. Gaz türbinine start, gaz basıncıyla çalışan motor veya elektrikli motor ile verilir. Atmosferden filtrelenerek temin edilen hava, belirli kademeli aksiyel akışlı türbin kompresöründen geçerek sıkışır ve hava türbin grubu üzerinde dairesel olarak bulunan dizayna göre belirli adette yanma odasına püskürtülür. Yakıt gazı istasyon ana iletim hattından temin edilen türbin dizayn değerlerine ayarlanan belirli bir basınçtaki doğal gaz ile atmosferik hava, yanma odasında dizayna göre belirli adette elektrikli manyeto ile yakılarak ısı enejisi elde edilir. Yanma ile ortaya çıkan enerji yine sıkıştırılarak gaz türbininin sabit kanatçıklarından püskürtülerek hareketli kanatçığı çevirir. Böylece yanma ile ortaya çıkan enerji, kanatçıkların döndürülmesiyle mekanik enerjiye dönüşmüş olur. Bu enerji, starter motoru ile dönen şafta hareket verir. Sıcak gaz, önce dizayna ve kullanılan marka-model türbine göre değişkenlik gösteren (devir/dakika) hızla dönen gaz jeneratörünü, daha sonra arada bir bağlantı olmaksızın iki kademeli, güç türbinini çevirir. Güç türbini, bir şaftla, gaz kompresör kısmına bağlıdır. Kompresöre iletilen güç, ana hattan gelen gazı sıkıştırmada kullanılır. Böylelikle ana hattan alınan gaz talep edilen basınca ve akışa göre ayarlanarak gaz iletimi sağlanmış olur.

UEMK 2019 Proceedings Book 24/25 October 2019 Gaziantep University, TURKEY
390
Şekil 5. Türbin-Kompresör Paketi 2.4. Gaz Soğutma Sistemi
Şekil 6. Gaz Soğutma Sistemi Bilindiği üzere sıkışan gazlar ısınır, gaz kompresöründen sıkışmış olarak çıkan gazın sıcaklığı, giriş gazı sıcaklığına göre oldukça yüksektir. Sıcak gazın ana hatta verilmesi durumunda, sıcak gazın soğuk gaza göre fazla yer kaplamasından dolayı boru hattı taşıma performansı düşecektir. Bu sebeple, boru hattındaki gazın sıcaklığının yüksek

UEMK 2019 Proceedings Book 24/25 October 2019 Gaziantep University, TURKEY
391
olması talep edilmez. Bunun için istasyonda, kompresör üniteleri çıkışında gaz soğutma sistemi mevcuttur. 2.5. Tahliye ve Geri Çevrim Sistemi Tahliye ve geri çevrim sistemleri tamamıyla istasyon güvenliği için kurulmuş ekipmanlardır. İstasyonda,bulunan tahliye vanaları, altlarındaki manuel izolasyon vanalarından ve ana tahliye vanalarından oluşur. Tamamıyla mekanik şekilde çalışan tahliye vanaları, gaz soğutucu sonrasında sıkıştırılmış olan doğal gaz basıncı, tahliye vanalarda ayarlanan basınç (bar) değerini aştığı durumlarda tahliye vanaları otomatik olarak açar ve istasyonun mekanik güvenliği açısından yüksek basınçlı doğal gazı atmosfere vererek istasyonu boşaltır. Normal durumlarda tahliye vanası altındaki manuel vanalar açık tutulur. İstasyonda bulunan tahliye vanaları da yine istasyon güvenliği açısından, istasyon içini boşaltmak amacıyla, istasyon kontrol sistemi tarafından otomatik olarak açılan vanalardır. Bu vana sistemleri de aynı şekilde altta manuel izolasyon vanaları ve üstte tahliye vanasından ve aktüatör grubundan oluşmaktadır. İstasyondaki geri çevrim vanası, özellikle kompresör üniteleri devreye alma-çıkarma ve kararsızlık durumlarında, türbin ve kompresör grubunu korumak amacıyla çıkış tarafındaki bir miktar gazın dolayısıyla basıncın istasyon giriş kısmına aktarılması maksadıyla kurulmuştur. Bu şekilde türbin ve kompresör grubu girişlerine yeteri kadar gaz temini sağlanarak büyük hasarlar verebilecek istenilmeyen durumlardan korunulmuş olunur. İstasyon geriçevrim vanası, istasyon kontrol sistemi tarafından otomatik kontrol edilebildiği gibi manuel olarak da kullanılabilir.
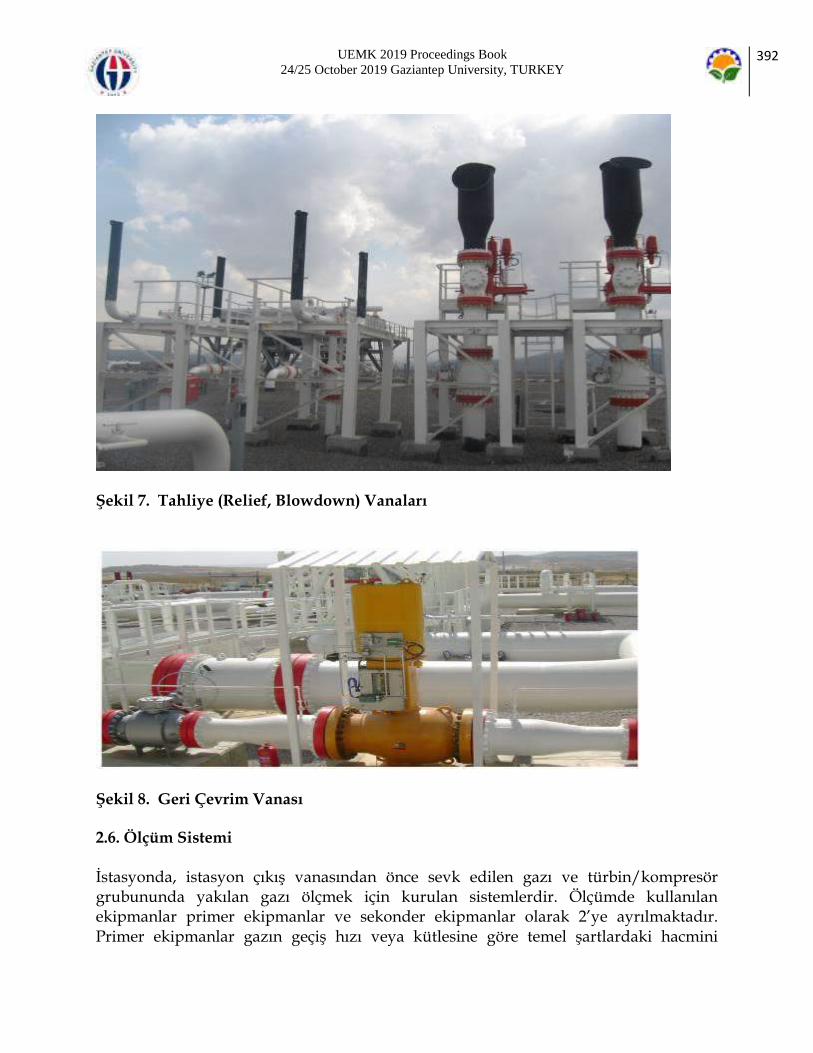
UEMK 2019 Proceedings Book 24/25 October 2019 Gaziantep University, TURKEY
392
Şekil 7. Tahliye (Relief, Blowdown) Vanaları
Şekil 8. Geri Çevrim Vanası 2.6. Ölçüm Sistemi İstasyonda, istasyon çıkış vanasından önce sevk edilen gazı ve türbin/kompresör grubununda yakılan gazı ölçmek için kurulan sistemlerdir. Ölçümde kullanılan ekipmanlar primer ekipmanlar ve sekonder ekipmanlar olarak 2’ye ayrılmaktadır. Primer ekipmanlar gazın geçiş hızı veya kütlesine göre temel şartlardaki hacmini

UEMK 2019 Proceedings Book 24/25 October 2019 Gaziantep University, TURKEY
393
hesaplarken, sekonder ekipmanlar ise hesaplanan bu hacmin akışkan gazın basınç, sıcaklık ve gaz bileşen değerlerinin kullanılarak bilinen bir standarda dönüştürülmesini sağlamaktadır. Primer ve sekonder ekipmanlardan aldığı veriye göre, gazın anlık, saatlik ve günlük periyotlarda hacim, kütle, enerji vb. toplam miktar geçişini hesaplayan hacim dönüştürücü ekipman olan akış bilgisayarları(flow computer) sistemde önemli bir yer tutmaktadır. Doğal Gaz Ölçüm Ekipmanları Primer Ölçüm Ekipmanları ; -Orifis Plakaları(orifice plates), -Akış Nozulları (Flow Nozzles), -Pilot Tüpleri (Pilot Tubes), -Rotarimetreler , -Türbinmetreler (Turbine Meters), -Ultrasonikmetreler (Ultrasonic Meters) vs. Sekonder Ölçüm Ekipmanları ; -Basınç Transmitteri , -Sıcaklık Transmitteri , -Gaz Kromatografı vb.
Şekil 9. Ultrasonikmetre 2.7. Yardımcı Tesisler (Yakıt Gazı ve Yardımcı Ekipmanlar Gaz Skidleri, Hava Kompresörleri, Isı Merkezi ve Jeneratörler) Sistemi
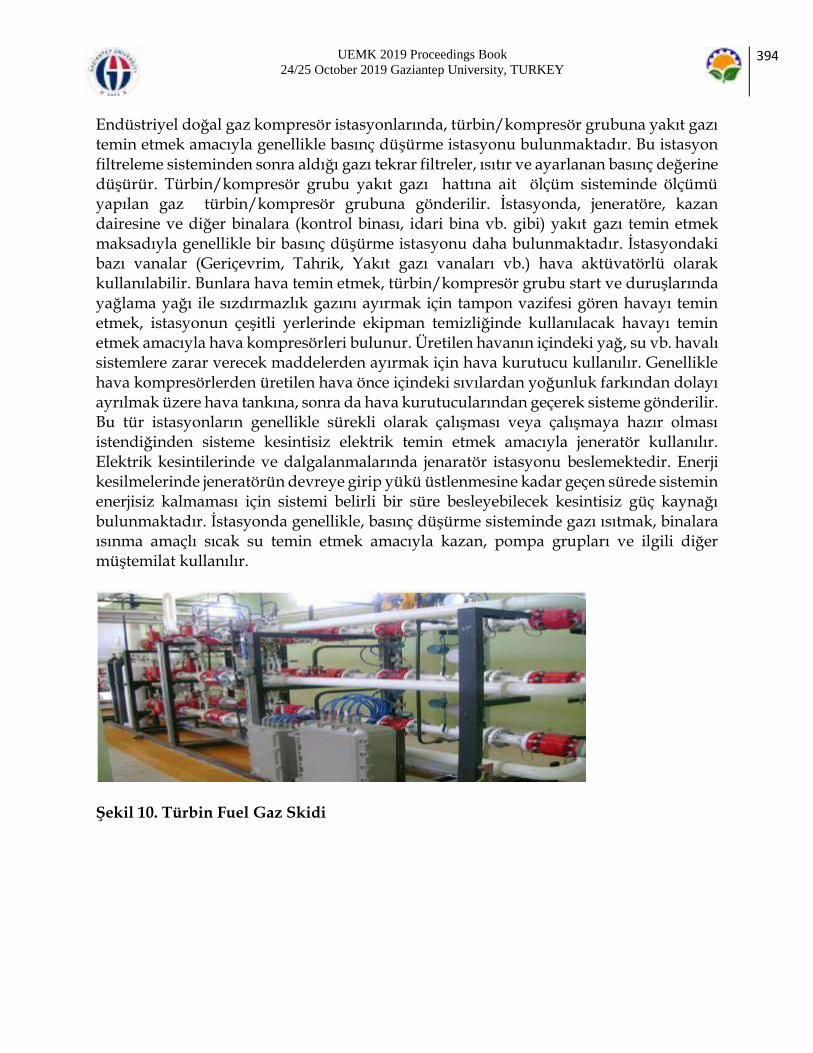
UEMK 2019 Proceedings Book 24/25 October 2019 Gaziantep University, TURKEY
394
Endüstriyel doğal gaz kompresör istasyonlarında, türbin/kompresör grubuna yakıt gazı temin etmek amacıyla genellikle basınç düşürme istasyonu bulunmaktadır. Bu istasyon filtreleme sisteminden sonra aldığı gazı tekrar filtreler, ısıtır ve ayarlanan basınç değerine düşürür. Türbin/kompresör grubu yakıt gazı hattına ait ölçüm sisteminde ölçümü yapılan gaz türbin/kompresör grubuna gönderilir. İstasyonda, jeneratöre, kazan dairesine ve diğer binalara (kontrol binası, idari bina vb. gibi) yakıt gazı temin etmek maksadıyla genellikle bir basınç düşürme istasyonu daha bulunmaktadır. İstasyondaki bazı vanalar (Geriçevrim, Tahrik, Yakıt gazı vanaları vb.) hava aktüvatörlü olarak kullanılabilir. Bunlara hava temin etmek, türbin/kompresör grubu start ve duruşlarında yağlama yağı ile sızdırmazlık gazını ayırmak için tampon vazifesi gören havayı temin etmek, istasyonun çeşitli yerlerinde ekipman temizliğinde kullanılacak havayı temin etmek amacıyla hava kompresörleri bulunur. Üretilen havanın içindeki yağ, su vb. havalı sistemlere zarar verecek maddelerden ayırmak için hava kurutucu kullanılır. Genellikle hava kompresörlerden üretilen hava önce içindeki sıvılardan yoğunluk farkından dolayı ayrılmak üzere hava tankına, sonra da hava kurutucularından geçerek sisteme gönderilir. Bu tür istasyonların genellikle sürekli olarak çalışması veya çalışmaya hazır olması istendiğinden sisteme kesintisiz elektrik temin etmek amacıyla jeneratör kullanılır. Elektrik kesintilerinde ve dalgalanmalarında jenaratör istasyonu beslemektedir. Enerji kesilmelerinde jeneratörün devreye girip yükü üstlenmesine kadar geçen sürede sistemin enerjisiz kalmaması için sistemi belirli bir süre besleyebilecek kesintisiz güç kaynağı bulunmaktadır. İstasyonda genellikle, basınç düşürme sisteminde gazı ısıtmak, binalara ısınma amaçlı sıcak su temin etmek amacıyla kazan, pompa grupları ve ilgili diğer müştemilat kullanılır.
Şekil 10. Türbin Fuel Gaz Skidi

UEMK 2019 Proceedings Book 24/25 October 2019 Gaziantep University, TURKEY
395
Şekil 11. Yardımcı Binalar Gaz Skid
Şekil 12.Hava Kompresörleri ve Hava Kurutucuları 3. SCADA 3.1. SCADA Tanımı ve Uygulama Alanları SCADA ingilizceden dilimize katılan teknik bir terim olup açıklaması “Supervisory Control And Data Acquisition” kelimelerinin baş harflerinin birleşmesi ile oluşan bir kısaltmadır, Türkçe anlamı “Denetleme Kontrol ve Veri Toplama” anlamına gelmektedir. Bileşen sayısı çok fazla olan bir sistemin takibi, çalışmasının denetlenmesi, uzaktan veya manuel kontrol edilebilmesi ve sistemin optimizasyonu için gerekli verilerin toplanması için kurulan basit ve kolay sistemlerden karmaşık sistemlere kadar bu işi yapan sistemlere verilen ortak addır (Gaushell ve Darlington 1987). SCADA sistemi çok geniş bir kullanım alanına sahip olmasının yanı sıra artık gündelik hayatımızda çoğu yerde biz görmesek de karşımıza çıkmaktadır. Başlıca kullanım alanları arasında tehlikesi yüksek

UEMK 2019 Proceedings Book 24/25 October 2019 Gaziantep University, TURKEY
396
iş sektörlerinden olan kimya endüstrisi, petrokimya endüstrisi, doğalgaz ve petrol boru hatlarında kullanılmakta, diğer yandan elektrik, su dağıtım sistemleri ve hatlarında da izleme ve takip yapılmaktadır. 3.2. SCADA Yapısı SCADA sisteminin ana yapısını üç başlıkta toplayabiliriz. İlki uzaktan kontrol birimi dediğimiz veri toplama ve uç kontrol birimleridir. İkincisi bölgelerin birbiri ile etkileşim ve haberleşme yapabilmesi için bir iletişim sistemi olmalıdır. Üçüncüsü ise tüm uç noktaların toplandığı bir bilgisayar ile kontrolün sağlandığı, izlendiği ve yönetildiği kontrol merkez sistemidir(MTU). SCADA sistemini tasarlarken kurulacak yapıyı istediğiniz gibi hayal edebilirsiniz (Strauss,2003). 3.3. SCADA İşlevleri SCADA sistemleri izleme, kontrol, veri analizi ile beraber raporlama ve kayıt yapabilmektedir. Bunun için sistemin bir veri tabanına bağlı olması gerekmektedir. Bu işlevlerin gerçekleşebilmesi için sistemdeki girdi ve çıktı bilgilerinin bir veri tabanında tanımlanması gerekir. Bu bilgiler sistemde bulunan yazılım sayesinde bir takım alarm ve sınırlamalar ile değişkenlerin kontrolünü ve izlenmesini sağlamaktadır. Bu kontrol sayesinde örneğin bir proseste katkı madde miktarını görülmesi ile prosesteki ürünün kalitesi hakkında bilgi alabilir veya üretilen malzeme miktarı ile üretim verimliliği hakkında da bilgi sahibi olunabilmektedir. Bütün bunlarla beraber olarak üretim hattındaki bir makine veya motor durumu hakkında bilgide sağlanarak bakım-onarım amaçlı bilgilerde edinilebilmektedir. SCADA sisteminin kuruluşu amacı ile sistemde nelerin takibi ve kontrolü sağlanmak istenmişse an ve an istenilen talebin kontrolü durumu izlenebilmektedir. Tüm prosese ait bütün istatistikleri görülebilmesi ile mevcut sistemde iyileştirme yapmaya da olanak sağlamaktadır (Karataş,2018).

UEMK 2019 Proceedings Book 24/25 October 2019 Gaziantep University, TURKEY
397
Şekil 13. SCADA Organizasyon Şeması 3.4. SCADA Yapısı ve Temel Elemanları 3.4.1. Ana Terminal Birimi (MTU) Ana Terminal Üniteleri SCADA sisteminde geniş bir alana yayılmış Uzak Terminal Birimlerinin koordineli çalışması, Uzak Terminal Birimlerinden gelen bilgilerin yorumlanması, kullanıcılara sunulması, ayrıca kullanıcıların isteklerini Uzak Terminal Birimlerine ileterek merkezi kumandanın sağlanması işlevlerine SCADA sisteminde merkezi sistem birimi yerine getirir. (Megep,2007). Ana terminal ünitelerinin görevleri: -Uzak terminal ünitelerinden gelen verilerin toplanması -Toplanmış verilerin yazılım programları ile işlenerek ekrana veya yazıcıya gönderilmesi -Sistemde kontrol edilecek cihazlara kontrol komutu gönderilmesi -Belli olaylar karşısında alarm üretme ve gelen alarmları operatöre en hızlı şekilde iletme -Meydana gelen olayları ve verileri zaman sırasına göre kaydetme -Başka bilgisayar sistemleri ile iletişimde olma -Dağıtım yönetim sistemi ve enerji yönetim sistemi gibi üst seviye uygulama programlarını çalıştırma -Yazıcı, çizici, haberleşme birimleri gibi ek birimlerin kontrolü. 3.4.2. Uzak Terminal Birimi (RTU) RTU (bazen uzak telemetri ünitesi olarak adlandırılır) başlıktan da anlaşıldığı gibi; monitör ve kontrol aletleri merkez istasyondan uzakta bulunan, genellikle, mikroişlemci

UEMK 2019 Proceedings Book 24/25 October 2019 Gaziantep University, TURKEY
398
bazlı, kendi başına veri kazanımı ve kontrol ünitesidir. En önemli görevi; uzak noktalardaki işlem aletleriyle veri kazanımı ve kontrol sağlamak ve de bu verileri merkez istasyonuna transfer etmektir. Konfigurasyonunu ve kontrol programlarını, bazı merkez istasyonlardan etkin bir figürde yükleyebilme özelliğine sahiptir. Bunun dışında bazı RTU programlama ünitelerini, yerinde düzenleyebilme imkanı mümkündür. Genel olarak RTU bazı merkez istasyonlarla, geri iletişim kurmasına rağmen, diğer RTU’larla karşılıklı iletişim kurması da mümkündür. RTU, merkez istasyonlardan ulaşılamayan diğer RTU’lara, röle istasyon (bazen depolayıcı ve ileri istasyon olarak belirtilir) olarak da görev yapabilmektedir. (EMO,2012) Uzak terminal biriminin görevleri; -Bilgi toplama ve depolama -Kontrol ve kumanda -İzleme (monitoring) -Arıza yeri tespiti ve izolasyonudur.
Şekil 14. RTU donanım yapısı 3.4.3. İletişim Ağlari ve Protokolleri İletişim, bir noktadan başka bir noktaya, karşılıklı olarak, veri veya haberin gönderilmesi işlemidir. SCADA sisteminde sistemin işlemesi için iletişim hayati öneme sahiptir. SCADA sisteminde hız performansı tamamen iletişim ağı ile ilintilidir. SCADA sisteminde araçlar ve cihazların birbiri ile haberleşmesi kablolar vasıtası ile gerçekleşmektedir. Veri yolu bu kablolar üzerindeki iletken ile veya toprak dönüş hattı üzerinden gerçekleşmektedir. Dünya üzerinde çoğu sistem ve projede artık bir standart olan bir arabirim vardır. İletişimde kullanılan bu ara birimler RS-232 ve RS-485’tir.

UEMK 2019 Proceedings Book 24/25 October 2019 Gaziantep University, TURKEY
399
3.4.4. Veri Toplama Üniteleri Kontrol üniteleri SCADA sistemlerinin diğer önemli birimidir. Kontrol üniteleri kontrol odası seviyesinden çeşitli yardımcı işletmelerin kontrol ünitelerinden işletme ve yönetim seviyesine kadar tüm veri ve bilgileri yüksek hızlarda işleyecek bir yapıya sahiptir. Kontrol alt birimlerine, işletme ünitelerine, çalışma sahasına ait enstrumantasyon ve dedektörlere bağlanarak gerekli bilgi ve veri alış verişini sağlamaktadır. 3.4.5. Yazılım Elektronik cihazlarda tanımlanmış bir işi veya değişik ve çeşitli görevler yapma amaçlı tasarlanmış elektronik aygıtların birbirleriyle haberleşebilmesini ve uyumunu sağlayarak görevlerini ya da kullanılabilirliklerini geliştirmeye yarayan makine komutlarıdır. Yazılım, elektronik aygıtların belirli bir işi yapmasını sağlayan programların tümüne verilen isimdir. 3.4.5. Merkez Kontrol Odası SCADA sisteminin kurulu olduğu ve izleme yapıldığı alandır.Tesiste oluşabilecek arızaları veya tesisin kararlı olup olmadığı hakkında tüm bilgilerin görülebileceği ve aynı zamanda zaman kaybedilmeden müdahale edildiği yerdir.Bu oda genelde bilgisayarlar ve monitörlerden oluşmakta olup gerekmesi halinde terminaller, yazıcılar ve alarmlar ile desteklenebilirler. 4. ENDÜSTRİYEL BİR DOĞAL KOMPRESÖR İSTASYONU İÇİN SCADA GELİŞTİRİLMESİ Bu çalışmada endüstriyel bir doğal gaz kompresör istasyonunun sistem otomasyonu için kullanılan SCADA yazılımı Emerson firmasına ait DeltaV yazılımıdır. DeltaV yazılım uygulamaları DeltaV Explorer ve Kontrol Studiodur. Exploring DeltaV sistem yapılanmasını görmek ve düzenlemek için kullanılır. Control Studio’da ise kontrol algoritmaları ve blokları yer almaktadır. SCADA donanımı olarakta Delta V MD(RTU) serisi kontrolür kullanılmaktadır.

UEMK 2019 Proceedings Book 24/25 October 2019 Gaziantep University, TURKEY
400
Şekil 15 . Delta V Sistem yapısı
Şekil 16 . Delta V M serisi kontrolör

UEMK 2019 Proceedings Book 24/25 October 2019 Gaziantep University, TURKEY
401
Şekil 17 . RTU paneli I/O kartlar (Delta V M serisi kontrolör) Endüstriyel Bir Doğal Gaz Kompresör İstasyonu’da SCADA Sistemi ile haberleşen 3.Parti Ekipmanlar ; Ünite Kontrol Panelleri:Sadece Türbin/Kompresör sistemini kontrol eden panellerdir. İçerisinde SIEMENS marka S-7 400 PLC’ler kullanılmaktadır.Ünite Kontrol Panelleri Türbin/Kompresör sistem sahasından gelen verileri MODBUS RS-485 haberleşme ile SCADA’ya aktarmaktadırlar. Flow computer (Akış Bilgisayarı):Akış Bilgisayarı, gaz ölçümünde kullanılacak cihazlar olup, gaz hatlarına bağlı sayaç, transmitter ve gaz kromatograf gibi ekipmanlardan alınan verilerin işlenmesi ve gazın enerji değerlerine çevrilmesinde ve bu değerlerin saklanmasında kullanılır. SCADA sistemi ile Modbus RS-485 ile haberleşmektedir. Gaz kromatografı: Gaz kromatograf cihazı doğal gaz içindeki bileşenleri ayırarak analiz etmek üzere konfigüre edilmiş cihazdır. Gaz analizi C1’ den C6+’ ya kadar karbon bileşenleri ile N2 ve CO2’ yi kapsar. SCADA sistemi ile Modbus RS-485 ile haberleşmektedir. Gaz Algılama Paneli: Endüstriyel bir doğal gaz kompresör istasyonu’nda kapalı alanlarda doğal gaz boru hattında gaz kaçağı kontrolü gaz dedektörleri ile yapılmaktadır.Gaz dedektörleri tipik olarak besleme voltajı 24 VDC olup çıkış akımı 4-20 mA’dir.Gaz algılama paneli gaz dedektörlerinden (sahadan) almış olduğu bilgiyi MODBUS RS-485 ile SCADA’ya aktarmaktadır. Endüstriyel Bir Doğal Gaz Kompresör İstasyonun’da Tipik olarak bulunan Enstrümanlar; -Basınç, Sıcaklık, Seviye, Fark basınç vb. Transmitterları (Analog girişler) tipik olarak 24 VDC besleme voltajı ile çalışmakta olup çıkış olarak 4-20 mA üretmektedirler. -Seviye, Basınç, Sıcaklık, Pozisyon vb. Anahtarlar (Dijital girişler) tipik olarak kuru kontak veya 24 VDC enerjili kontak olarak çalışmaktadırlar. -Vanalar ;Küresel ,Plug ,Akış oransal vb. vanalar. - Hız problar , vibrasyon probları da kompresör istasyonunda kullanılan enstrumanlar arasında yer almaktadır.

UEMK 2019 Proceedings Book 24/25 October 2019 Gaziantep University, TURKEY
402
Şekil 18 . SCADA İstasyon Giriş ve Çıkış, Pig Alma ve Atma İstasyonu, Bypass Sistemi Görünümü
Şekil 19. SCADA İstasyon Filtreleme Sistemi Görünümü

UEMK 2019 Proceedings Book 24/25 October 2019 Gaziantep University, TURKEY
403
Şekil 20. SCADA Gaz Soğutma Sistemi Görünümü
Şekil 21. SCADA Türbin Kompresör Grubu Görünümü
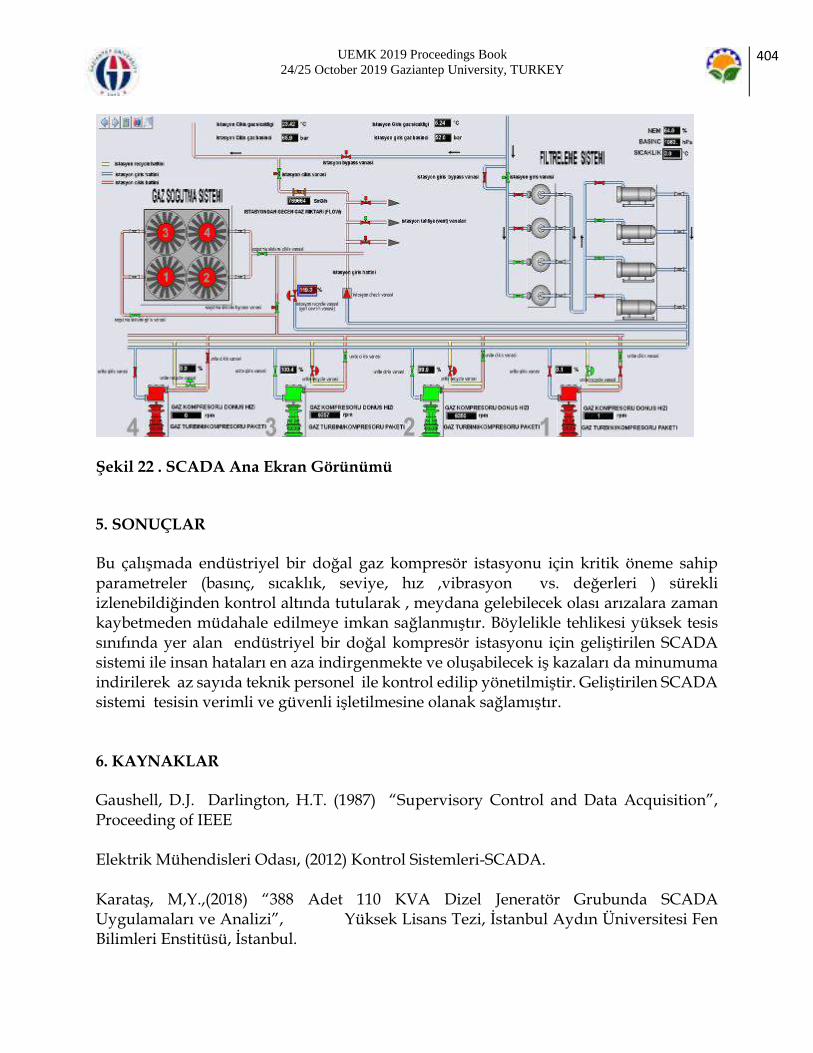
UEMK 2019 Proceedings Book 24/25 October 2019 Gaziantep University, TURKEY
404
Şekil 22 . SCADA Ana Ekran Görünümü 5. SONUÇLAR Bu çalışmada endüstriyel bir doğal gaz kompresör istasyonu için kritik öneme sahip parametreler (basınç, sıcaklık, seviye, hız ,vibrasyon vs. değerleri ) sürekli izlenebildiğinden kontrol altında tutularak , meydana gelebilecek olası arızalara zaman kaybetmeden müdahale edilmeye imkan sağlanmıştır. Böylelikle tehlikesi yüksek tesis sınıfında yer alan endüstriyel bir doğal kompresör istasyonu için geliştirilen SCADA sistemi ile insan hataları en aza indirgenmekte ve oluşabilecek iş kazaları da minumuma indirilerek az sayıda teknik personel ile kontrol edilip yönetilmiştir. Geliştirilen SCADA sistemi tesisin verimli ve güvenli işletilmesine olanak sağlamıştır. 6. KAYNAKLAR Gaushell, D.J. Darlington, H.T. (1987) “Supervisory Control and Data Acquisition”, Proceeding of IEEE Elektrik Mühendisleri Odası, (2012) Kontrol Sistemleri-SCADA. Karataş, M,Y.,(2018) “388 Adet 110 KVA Dizel Jeneratör Grubunda SCADA Uygulamaları ve Analizi”, Yüksek Lisans Tezi, İstanbul Aydın Üniversitesi Fen Bilimleri Enstitüsü, İstanbul.

UEMK 2019 Proceedings Book 24/25 October 2019 Gaziantep University, TURKEY
405
Kul, N., (2009) “1500 KVA Gücünde 6.3 KV Çıkış Gerilimli Jeneratör Grubu ve Yüksek Gerilim Kesicilerinin PLC-SCADA ile Uzaktan İzlenmesi”, Yüksek Lisans Tezi, Karadeniz Teknik Üniversitesi, Fen Bilimleri Enstitüsü, Trabzon. Kurtulan, S. (1999). PLC ile Endüstriyel Otomasyon (Birinci Baskı).” Türkiye: Birsen Yayınevi, 1-2. MEGEP (2007). Elektrik-Elektronik Teknolojisi SCADA Sistemleri. Özkara, A., (2009). “ Bir Orta Gerilim Dağıtım Sisteminin SCADA ile İzlenmesi ”, Yüksek Lisans Tezi, İstanbul Teknik Üniversitesi, Fen Bilimleri Enstitüsü, İstanbul Strauss, C., (2003). “Practica Electrical Network Automation and Communication Systems ”, Elsevier, İngiltere, 108-118.

UEMK 2019 Proceedings Book 24/25 October 2019 Gaziantep University, TURKEY
406
OVERVIEW OF AKSARAY’S SOLAR ENERGY STATUS
Hakan ÇELEBİ Aksaray University, Faculty of Engineering, Department of Environmental Engineering [email protected] Şevket TULUN Aksaray University, Faculty of Engineering, Department of Environmental Engineering [email protected] İsmail ŞİMŞEK Aksaray University, Faculty of Engineering, Department of Environmental Engineering [email protected] Tolga BAHADIR Aksaray University, Faculty of Engineering, Department of Environmental Engineering [email protected] Melayib BİLGİN Aksaray University, Faculty of Engineering, Department of Environmental Engineering [email protected] ABSTRACT: Energy is both a source of life for living things and an essential production input for the economic and social development of countries. It is important for our country to reduce its dependence on non-renewable energy sources by using renewable and inexhaustible energy sources such as solar, wind, geothermal, wave and tidal energy as in the world. Since solar energy is not dependent on foreign sources in terms of raw materials, it is not affected by the economic problems that may arise. Solar energy is the sun's radiation reaching the world and is the most easily available energy source. Aksaray is a very rich city in terms of the diversity and potential of renewable energy sources. Aksaray has high sunbathing potential due to its geographical location. As in the whole world, the use of solar energy is increasing day by day in Aksaray. In this study, the current state of Aksaray solar energy has been evaluated by evaluating from different statistical data sources. Key words: Aksaray, Renewable Energy, Solar Energy, Energy Distribution.
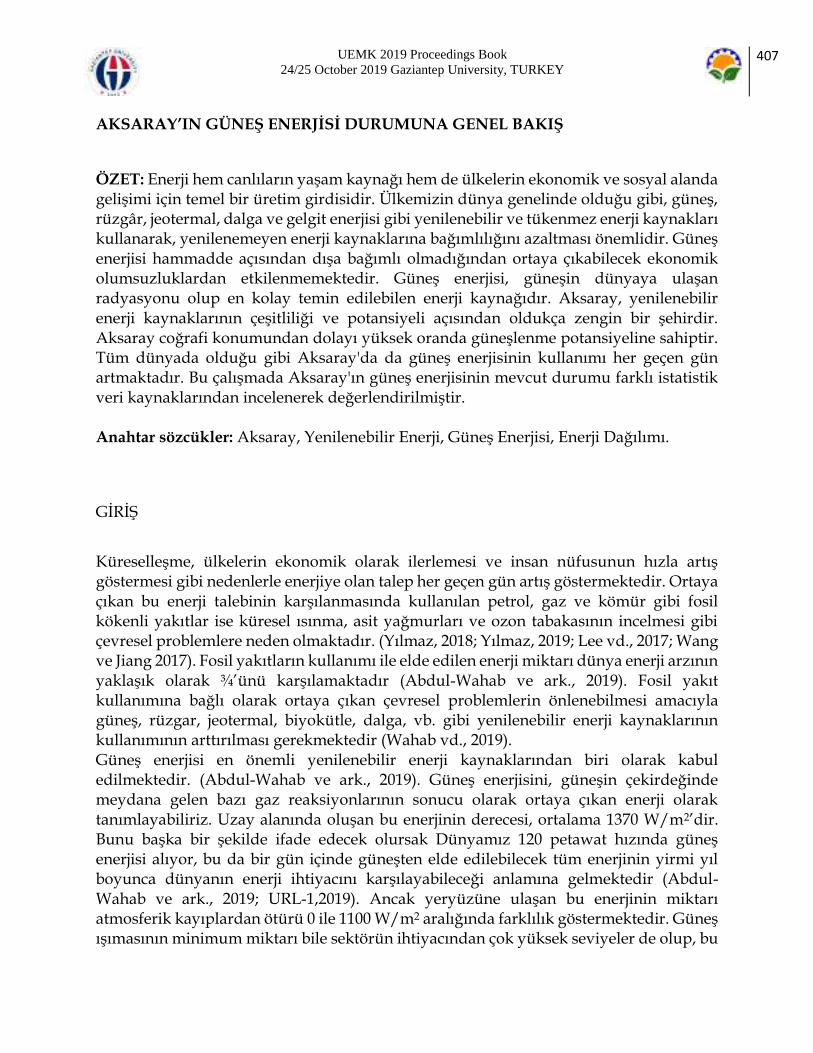
UEMK 2019 Proceedings Book 24/25 October 2019 Gaziantep University, TURKEY
407
AKSARAY’IN GÜNEŞ ENERJİSİ DURUMUNA GENEL BAKIŞ
ÖZET: Enerji hem canlıların yaşam kaynağı hem de ülkelerin ekonomik ve sosyal alanda gelişimi için temel bir üretim girdisidir. Ülkemizin dünya genelinde olduğu gibi, güneş, rüzgâr, jeotermal, dalga ve gelgit enerjisi gibi yenilenebilir ve tükenmez enerji kaynakları kullanarak, yenilenemeyen enerji kaynaklarına bağımlılığını azaltması önemlidir. Güneş enerjisi hammadde açısından dışa bağımlı olmadığından ortaya çıkabilecek ekonomik olumsuzluklardan etkilenmemektedir. Güneş enerjisi, güneşin dünyaya ulaşan radyasyonu olup en kolay temin edilebilen enerji kaynağıdır. Aksaray, yenilenebilir enerji kaynaklarının çeşitliliği ve potansiyeli açısından oldukça zengin bir şehirdir. Aksaray coğrafi konumundan dolayı yüksek oranda güneşlenme potansiyeline sahiptir. Tüm dünyada olduğu gibi Aksaray'da da güneş enerjisinin kullanımı her geçen gün artmaktadır. Bu çalışmada Aksaray'ın güneş enerjisinin mevcut durumu farklı istatistik veri kaynaklarından incelenerek değerlendirilmiştir. Anahtar sözcükler: Aksaray, Yenilenebilir Enerji, Güneş Enerjisi, Enerji Dağılımı.
GİRİŞ
Küreselleşme, ülkelerin ekonomik olarak ilerlemesi ve insan nüfusunun hızla artış göstermesi gibi nedenlerle enerjiye olan talep her geçen gün artış göstermektedir. Ortaya çıkan bu enerji talebinin karşılanmasında kullanılan petrol, gaz ve kömür gibi fosil kökenli yakıtlar ise küresel ısınma, asit yağmurları ve ozon tabakasının incelmesi gibi çevresel problemlere neden olmaktadır. (Yılmaz, 2018; Yılmaz, 2019; Lee vd., 2017; Wang ve Jiang 2017). Fosil yakıtların kullanımı ile elde edilen enerji miktarı dünya enerji arzının yaklaşık olarak ¾’ünü karşılamaktadır (Abdul-Wahab ve ark., 2019). Fosil yakıt kullanımına bağlı olarak ortaya çıkan çevresel problemlerin önlenebilmesi amacıyla güneş, rüzgar, jeotermal, biyokütle, dalga, vb. gibi yenilenebilir enerji kaynaklarının kullanımının arttırılması gerekmektedir (Wahab vd., 2019). Güneş enerjisi en önemli yenilenebilir enerji kaynaklarından biri olarak kabul edilmektedir. (Abdul-Wahab ve ark., 2019). Güneş enerjisini, güneşin çekirdeğinde meydana gelen bazı gaz reaksiyonlarının sonucu olarak ortaya çıkan enerji olarak tanımlayabiliriz. Uzay alanında oluşan bu enerjinin derecesi, ortalama 1370 W/m2’dir. Bunu başka bir şekilde ifade edecek olursak Dünyamız 120 petawat hızında güneş enerjisi alıyor, bu da bir gün içinde güneşten elde edilebilecek tüm enerjinin yirmi yıl boyunca dünyanın enerji ihtiyacını karşılayabileceği anlamına gelmektedir (Abdul-Wahab ve ark., 2019; URL-1,2019). Ancak yeryüzüne ulaşan bu enerjinin miktarı atmosferik kayıplardan ötürü 0 ile 1100 W/m2 aralığında farklılık göstermektedir. Güneş ışımasının minimum miktarı bile sektörün ihtiyacından çok yüksek seviyeler de olup, bu
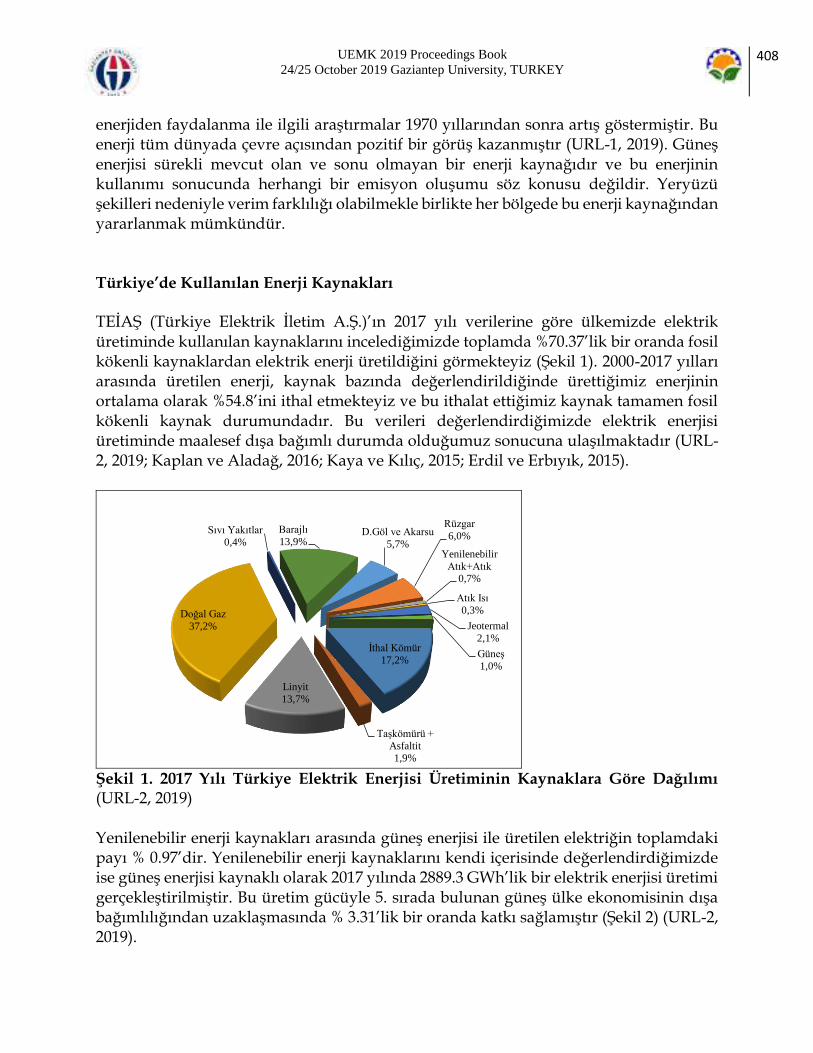
UEMK 2019 Proceedings Book 24/25 October 2019 Gaziantep University, TURKEY
408
enerjiden faydalanma ile ilgili araştırmalar 1970 yıllarından sonra artış göstermiştir. Bu enerji tüm dünyada çevre açısından pozitif bir görüş kazanmıştır (URL-1, 2019). Güneş enerjisi sürekli mevcut olan ve sonu olmayan bir enerji kaynağıdır ve bu enerjinin kullanımı sonucunda herhangi bir emisyon oluşumu söz konusu değildir. Yeryüzü şekilleri nedeniyle verim farklılığı olabilmekle birlikte her bölgede bu enerji kaynağından yararlanmak mümkündür. Türkiye’de Kullanılan Enerji Kaynakları TEİAŞ (Türkiye Elektrik İletim A.Ş.)’ın 2017 yılı verilerine göre ülkemizde elektrik üretiminde kullanılan kaynaklarını incelediğimizde toplamda %70.37’lik bir oranda fosil kökenli kaynaklardan elektrik enerji üretildiğini görmekteyiz (Şekil 1). 2000-2017 yılları arasında üretilen enerji, kaynak bazında değerlendirildiğinde ürettiğimiz enerjinin ortalama olarak %54.8’ini ithal etmekteyiz ve bu ithalat ettiğimiz kaynak tamamen fosil kökenli kaynak durumundadır. Bu verileri değerlendirdiğimizde elektrik enerjisi üretiminde maalesef dışa bağımlı durumda olduğumuz sonucuna ulaşılmaktadır (URL-2, 2019; Kaplan ve Aladağ, 2016; Kaya ve Kılıç, 2015; Erdil ve Erbıyık, 2015).
Şekil 1. 2017 Yılı Türkiye Elektrik Enerjisi Üretiminin Kaynaklara Göre Dağılımı (URL-2, 2019) Yenilenebilir enerji kaynakları arasında güneş enerjisi ile üretilen elektriğin toplamdaki payı % 0.97’dir. Yenilenebilir enerji kaynaklarını kendi içerisinde değerlendirdiğimizde ise güneş enerjisi kaynaklı olarak 2017 yılında 2889.3 GWh’lik bir elektrik enerjisi üretimi gerçekleştirilmiştir. Bu üretim gücüyle 5. sırada bulunan güneş ülke ekonomisinin dışa bağımlılığından uzaklaşmasında % 3.31’lik bir oranda katkı sağlamıştır (Şekil 2) (URL-2, 2019).
İthal Kömür
17,2%
Taşkömürü +
Asfaltit1,9%
Linyit13,7%
Doğal Gaz
37,2%
Sıvı Yakıtlar
0,4%Barajlı
13,9%D.Göl ve Akarsu
5,7%
Rüzgar
6,0%
Yenilenebilir Atık+Atık
0,7%
Atık Isı
0,3%
Jeotermal2,1%
Güneş
1,0%

UEMK 2019 Proceedings Book 24/25 October 2019 Gaziantep University, TURKEY
409
TEİAŞ’ın 2000-2017 yılları arası derlemiş olduğu verilerine göre ülkemizde güneşten elektrik üretilmesine 2014 yılında başlanmış ve bu dönemde güneşin toplam enerji üretimine olan katkısı % 0.007 oranında olmuştur. 2017 yılında bu oran % 0.97’ye çıkmış ve diğer kaynaklarla karşılaştırıldığında oldukça fazla miktarda bir artış meydana gelmiştir (URL-2, 2019). Ayrıca diğer yenilenebilir enerji kaynakları ile karşılaştırma yapıldığında güneş, Türkiye’de en fazla kullanım potansiyeline sahip olan enerji kaynağı olarak karşımıza çıkmaktadır (Taktak ve Ilı, 2018).
Şekil 2. 2017 Yılı Türkiye Yenilenebilir Enerji Kaynakları Dağılımı (URL-2, 2019) Türkiye’deki Güneş Enerjisi Potansiyeli Güneş enerjisini, dünya ve ülkemiz için değerlendirdiğimizde sınırsız bir enerji kaynağı olarak karşımıza çıkmaktadır. Ülkemizde güneşten ısı ve elektrik enerjisinin elde edilmesi, giderek artan bir konudur. Türkiye, güneş enerjisini kullanma açısından küresel arenada önemli bir konumdadır. Şekil 3’te, Türkiye’nin güneşten ısı enerjisi olarak yararlanma konusunda dünyada 4. olduğu ifade edilmektedir. Ülkemizin topografik, jeolojik, meteorolojik vd. konumlarının uygunluğu, sosyo-ekonomik yaklaşımlar, bölgesel uygulamalar ve ülkenin enerji politikalarından ötürü bu enerjinin kullanımı açısından önemli bir yere sahip durumdayız (Erdin ve Özkaya, 2019; Uğurlu ve Gökçöl, 2017; URL-3, 2016; Şimşek ve Şimşek, 2013). Ülke olarak güneşten termal enerji kaynağı olarak faydalanmakta dünya dördüncüsü olmamıza rağmen, güneşten elektrik enerjisi üretmek konusunda aynı başarıyı gösterebilmiş değiliz.
YENİLENEB
İLİR
ATIK+ATIK 2,43%
RÜZGAR
20,52%
GÜNEŞ
3,31%
BARAJLI47,34%
D.GÖL VE
AKARSU19,37%
JEOTERMAL
7,02%
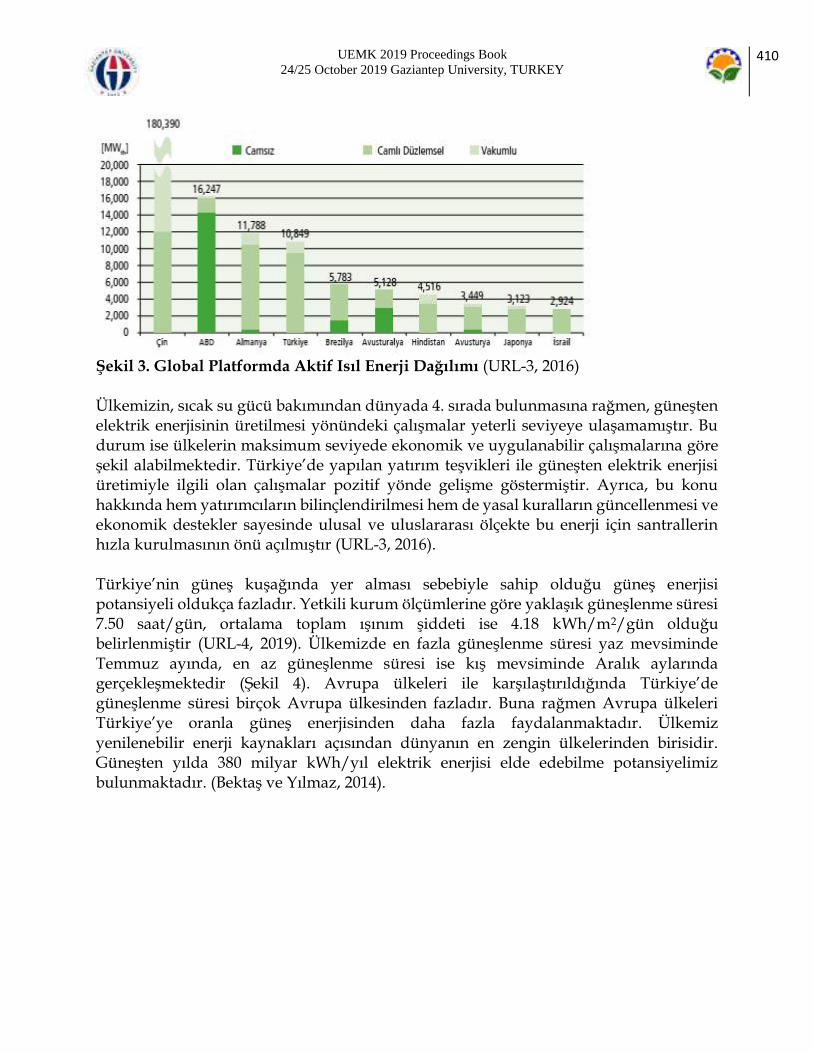
UEMK 2019 Proceedings Book 24/25 October 2019 Gaziantep University, TURKEY
410
Şekil 3. Global Platformda Aktif Isıl Enerji Dağılımı (URL-3, 2016) Ülkemizin, sıcak su gücü bakımından dünyada 4. sırada bulunmasına rağmen, güneşten elektrik enerjisinin üretilmesi yönündeki çalışmalar yeterli seviyeye ulaşamamıştır. Bu durum ise ülkelerin maksimum seviyede ekonomik ve uygulanabilir çalışmalarına göre şekil alabilmektedir. Türkiye’de yapılan yatırım teşvikleri ile güneşten elektrik enerjisi üretimiyle ilgili olan çalışmalar pozitif yönde gelişme göstermiştir. Ayrıca, bu konu hakkında hem yatırımcıların bilinçlendirilmesi hem de yasal kuralların güncellenmesi ve ekonomik destekler sayesinde ulusal ve uluslararası ölçekte bu enerji için santrallerin hızla kurulmasının önü açılmıştır (URL-3, 2016). Türkiye’nin güneş kuşağında yer alması sebebiyle sahip olduğu güneş enerjisi potansiyeli oldukça fazladır. Yetkili kurum ölçümlerine göre yaklaşık güneşlenme süresi 7.50 saat/gün, ortalama toplam ışınım şiddeti ise 4.18 kWh/m2/gün olduğu belirlenmiştir (URL-4, 2019). Ülkemizde en fazla güneşlenme süresi yaz mevsiminde Temmuz ayında, en az güneşlenme süresi ise kış mevsiminde Aralık aylarında gerçekleşmektedir (Şekil 4). Avrupa ülkeleri ile karşılaştırıldığında Türkiye’de güneşlenme süresi birçok Avrupa ülkesinden fazladır. Buna rağmen Avrupa ülkeleri Türkiye’ye oranla güneş enerjisinden daha fazla faydalanmaktadır. Ülkemiz yenilenebilir enerji kaynakları açısından dünyanın en zengin ülkelerinden birisidir. Güneşten yılda 380 milyar kWh/yıl elektrik enerjisi elde edebilme potansiyelimiz bulunmaktadır. (Bektaş ve Yılmaz, 2014).
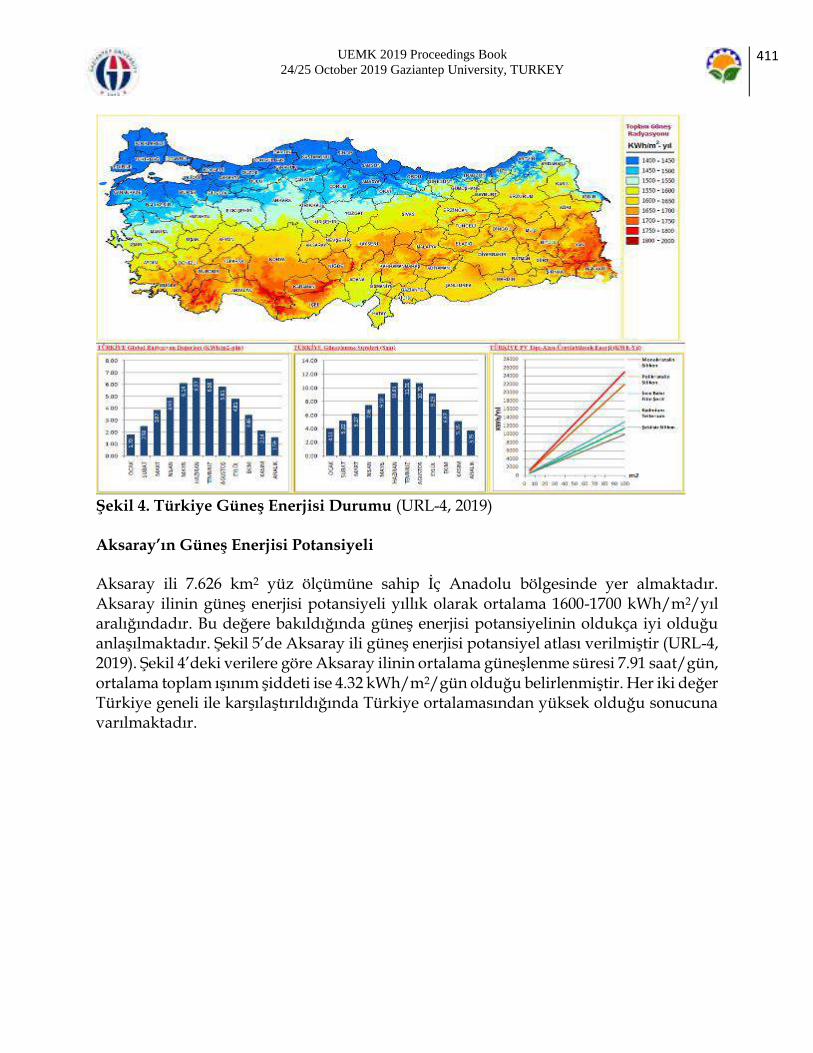
UEMK 2019 Proceedings Book 24/25 October 2019 Gaziantep University, TURKEY
411
Şekil 4. Türkiye Güneş Enerjisi Durumu (URL-4, 2019) Aksaray’ın Güneş Enerjisi Potansiyeli Aksaray ili 7.626 km2 yüz ölçümüne sahip İç Anadolu bölgesinde yer almaktadır. Aksaray ilinin güneş enerjisi potansiyeli yıllık olarak ortalama 1600-1700 kWh/m2/yıl aralığındadır. Bu değere bakıldığında güneş enerjisi potansiyelinin oldukça iyi olduğu anlaşılmaktadır. Şekil 5’de Aksaray ili güneş enerjisi potansiyel atlası verilmiştir (URL-4, 2019). Şekil 4’deki verilere göre Aksaray ilinin ortalama güneşlenme süresi 7.91 saat/gün, ortalama toplam ışınım şiddeti ise 4.32 kWh/m2/gün olduğu belirlenmiştir. Her iki değer Türkiye geneli ile karşılaştırıldığında Türkiye ortalamasından yüksek olduğu sonucuna varılmaktadır.

UEMK 2019 Proceedings Book 24/25 October 2019 Gaziantep University, TURKEY
412
Şekil 5. Aksaray Güneş Enerjisi Durumu (URL-4, 2019) Aksaray’da Bulunan Güneş Enerjisi Santralleri TEİAŞ’ın Temmuz-2019 verilerine göre Türkiye’de toplam 6410 adet güneş enerjisi santrali bulunmaktadır. Aksaray ili sınırları içerisinde aktif halde ve yapım aşamasında bulunan güneş enerjisi santrallerinin listesi Tablo 1’de verilmiştir. Aksaray ili sınırları içerisinde 5 adet toplamda 13.2 MW kurulu güce sahip ve bir adet de 10 MW kurulu güce sahip olacak yapım aşamasında olan güneş üretim santrali bulunmaktadır. Türkiye’deki toplam güneş enerjisi santrali kurulu gücünün 5095 MW olduğu düşünülürse Aksaray ilinin güneşten enerji üretimine olan payı % 0.46 oranında olmaktadır Tablo 1. Çalışma Alanı Kurulu Güç Dağılım (URL-5, 2019)
Faaliyetteki Enerji Sistemleri
Aksaray İncesu Köyü Güneş Enerji Santrali
7.00 MW
Yapılcanlar Tarım Aksaray GES 3.00 MW
Sancak Enerji Aksaray İncesu GES 2.00 MW
Taşlıgöl Elektrik Güneş Enerji Santrali 1.00 MW
Aksaray Belediyesi Güneş Enerji Santrali
0.20 MW
Kurulu Olmayan Enerji Sistemleri

UEMK 2019 Proceedings Book 24/25 October 2019 Gaziantep University, TURKEY
413
Seg Elektrik Aksaray Eskil Güneş Enerji Santrali
10.00 MW
SONUÇ VE DEĞERLENDİRME Artan nüfusla birlikte büyüyen ekonomi, artan endüstrileşme ve gelişen teknoloji ülkelerin ihtiyaç duyduğu enerji miktarı da artmaktadır. Ülkemizin yeterli oranda enerji kaynağına sahip olamaması nedeniyle, enerjiyi ithal etmek zorunda kalmakta ve ithal ettiği kaynağa ödemiş olduğu bedel yaklaşık olarak toplam ülke ithalatımızın 1/5’ini oluşturmaktadır. Bu nedenle başta güneş olmak üzere, yenilenebilir enerji kaynakları bakımından zengin olan ülkemizde bu kaynakların aktif olarak kullanılması önem arz etmektedir. Aksaray İli, güneş enerjisi açısından mevcut konumu ve sahip olduğu güneş enerjisi potansiyeli açısından Türkiye’nin önde gelen illerinden birisidir. Aksaray İli’nin güneşlenme süresi (7.91 saat/gün) ve güneş radyasyonu (4.32 kWh/m2/gün) değerlerine göre ülkemiz ortalamasının üzerinde bir güneş enerjisi elde etme değerine sahip olup, gelecek dönemlerde güneş tarlası yatırımlarının yapılabileceği bir konumda bulunmaktadır. Gelecek yıllarda fosil kökenli kaynakların rezervlerinin azalmaya başlayacak olması nedeniyle yenilenebilir enerji kaynaklarına verilecek önem artacaktır. Günümüzde güneş enerjisi santrallerinin ilk yatırım maliyetlerinin yüksek olduğu bilinmektedir. Teknolojik gelişmelerle birlikte bu maliyetlerin zamanla azalacağı düşünülmektedir. KAYNAKLAR Abdul-Wahab, S., Charabi, Y., Al-Mahruqi, A. M., Osman, I., Osman, S. (2019). Selection of the best solar photovoltaic (PV) for Oman. Solar Energy, 188, 1156-1168. Bektaş, Y., Yılmaz, F. (2014). Aksaray ilinin güneş enerjisi potansiyelinin incelenmesi. XI. International HVAC+R Technology Symposıum. 8-10 May 2014, İstanbul, TÜRKİYE. Erdil, A., Erbıyık, H. (2015). Renewable energy sources of Turkey and assessment of sustainability. Procedia-Social and Behavioral Sciences, 207, 669-679. Erdin, C., Özkaya, G. (2019). Turkey’s 2023 Energy strategies and investment opportunities for renewable energy sources: Site selection based on ELECTRE. Sustainability, 11, 2136. Journal of Cleaner Production, 143, 452-461. Kaplan, Y. A., Aladağ, C. (2016). The importance of the different kinds of energy sources for energy future of Turkey. EPJ Web of Conferences 128, 05002. Kaya, D., Kılıç, F. C. (2015). New markets for renewable industries: Developing countries – Turkey, its potential and policies. Journal of Energy in Southern Africa, 6, 25-35. Lee, C.Y., Lee, M.K., Yoo, S.H. (2017). Willingness to pay for replacing traditional energies with renewable energy in South Korea. Energy, 128, 284-290.

UEMK 2019 Proceedings Book 24/25 October 2019 Gaziantep University, TURKEY
414
Özdemir, R. (2019). Güneş enerjisi sektörü. Ahiler Kalkınma Ajansı Aksaray Yatırım Destek Ofisi, Erişim tarihi: 04.09.2019. http://investinaksaray.com/assets/ilgilidosyalar/Gunes-Enerjisi-Sektor-Raporu_1.pdf Şimşek, H A., Şimşek, N. (2013). Recent incentives for renewable energy in Turkey. Energy Policy, 63, 521-530. Taktak, F., Ilı, M. (2018). Güneş enerji santrali (GES) geliştirme: Uşak örneği. Geomatik Dergisi, 3 (1), 1-21. Uğurlu, A., Gökçöl, C. (2017). An overview of Turkey’s renewable energy trend. Journal of Energy Systems, 1, 148-158. URL-1, (2019). Güneş enerjisi ve teknolojileri. Erişim tarihi: 20.08.2019. http://www.yegm.gov.tr/yenilenebilir/g_enj_tekno.aspx URL-2, (2019). 2017 yılı Türkiye elektrik enerjisi üretiminin kaynaklara göre dağılımı. Erişim tarihi: 04.09.2019. https://www.teias.gov.tr/tr/iii-elektrik-enerjisi-uretimi-tuketimi-kayiplar-0 URL-3, (2016). Aksaray yenilenebilir enerji (Güneş Enerjisi) ihtisas endüstri bölgesi ilanına yönelik fizibilite raporu. Erişim tarihi: 05.09.2019 https://www.ahika.gov.tr/assets/upload/dosyalar/ahika_2016_aksaray-yenilenebilir-enerji-ihtisas-endustri-bolgesi-fizibilite-raporu.pdf URL-4, (2019). Yenilenebilir Enerji Genel Müdürlüğü, Güneş Enerjisi Potansiyeli. Erişim tarihi: 04.09.2019. http://www.yegm.gov.tr/MyCalculator/Default.aspx URL-5, (2019). Erişim tarihi: 04.09.2019. https://www.enerjiatlasi.com/gunes-enerjisi-haritasi/aksaray Wahab, A., Hassan, A., Qasim, M. A., Ali, H. M., Babar, H., Sajid, M. U. (2019). Solar energy systems-potential of nanofluids. Journal of Molecular Liquids, 289, 111049. Wang, R., Jiang, Z. (2017). Energy consumption in China's rural areas: a study based on the village energy survey. Yılmaz, F. (2018). Thermodynamic performance evaluation of a novel solar energy basedmultigeneration system. Applied Thermal Engineering, 143, 429-437. Yılmaz, F. (2019). Energy, exergy and economic analyses of a novel hybrid ocean thermal energy conversion system for clean power production. Energy Conversion and Management, 196, 557-566.

UEMK 2019 Proceedings Book 24/25 October 2019 Gaziantep University, TURKEY
415
THE EFFECT OF THRUST BEARING FAILURES ON
HYDROELECTRIC POWER PLANTS AND INVESTIGATION
OF SOLUTION METHODS
Gökhan KAHRAMAN Munzur Üniversitesi Mühendislik Fakültesi Makine Mühendisliği Bölümü [email protected] ABSTRACT: Renewable energy has a very important place in the economy of countries. Because renewable energy sources meet the energy needs of countries, they do not need fossil fuels. Thus, they reduce the dependence of the economy on foreign sources. In addition, renewable energy sources do not emit carbon to nature and thus contribute positively to the environment. Renewable energy is derived from water, wind, solar, thermal and biogas. Although the generation of electricity from wind and solar energy among these types of energy has increased considerably in our country lately, no renewable energy is as common as electricity production from water power. The production of electricity using the potential power of water is called hydraulic energy. Hydraulic energy can be obtained in dams with or without dams. Hydroelectric power plants consist of forced pipes, turbines and generators that transmit pressurized water to the turbine wheel. Between the turbine and generator parts there is a shaft that transmits the movement. The shaft is supported by axial and radial bearings. The radial bearings limit the movement of the shaft in the horizontal direction, while the axial bearings carry the entire load on the shaft, thereby rotating the shaft. The bearings in hydroelectric power plants operate according to the hydrodynamic or hydrostatic lubrication principle. Cooling and maintenance of such deposits are of great importance for the healthy operation of hydroelectric power plants. This is because any failure of such bearings can cause hydraulic turbines to fail to produce energy for a long time. Being unable to generate energy for long periods in hydroelectric power plants, which is a renewable energy source, causes great damage to the national economy. In this study, the maintenance and maintenance of the bearing bearings in the vertical turbines used in hydroelectric power plants are investigated. In addition, the bearing bed failures occurring in such plants are examined and solution methods are presented to eliminate these failures. This study will be useful for the operation of all hydroelectric power plants. Keywords; Renewable energy, Hydroelectric power plant, Thrust bearing HİDROELEKTRİK SANTRALLERDE TAŞIYICI YATAK ARIZALARININ ENERJİ ÜRETİMİNE ETKİSİ VE ÇÖZÜM YÖNTEMLERİNİN ARAŞTIRILMASI

UEMK 2019 Proceedings Book 24/25 October 2019 Gaziantep University, TURKEY
416
ÖZET: Yenilenebilir enerji ülkelerin ekonomisinde çok önemli bir yere sahiptir. Çünkü yenilenebilir enerji kaynakları ülkelerin enerji ihtiyaçlarını karşılarken fosil yakıtlara ihtiyaç duymazlar. Böylece ekonominin dışa bağımlılığını azaltmış olurlar. Ayrıca yenilenebilir enerji kaynakları doğaya karbon salınımında bulunmadıkları için çevreye pozitif katkı sağlarlar. Yenilenebilir enerji su, rüzgâr, güneş, termal ve biyogaz gibi enerjilerden elde edilir. Bu enerji türlerinden rüzgâr ve güneş enerjisinden elektrik üretimi ülkemizde son zamanlarda kayda değer bir şekilde artmasına rağmen henüz hiçbir yenilenebilir enerji su gücünden elektrik üretimi kadar yaygın değildir. Suyun potansiyel gücünden faydalanılarak elektrik üretimine hidrolik enerji denilmektedir. Hidrolik enerji barajlı veya barajsız HES’lerde elde edilebilmektedir. Hidroelektrik santraller basınçlı suyu türbin çarkına ileten cebri boru, türbin ve generatör kısmından oluşmaktadır. Türbin ve generatör kısımları arasında haraketi ileten bir şaft bulunmaktadır. Şaft eksenel ve radyal yataklarla yataklanmıştır. Radyal yataklar şaftın yatay yöndeki haraketini sınırlamakta, eksenel yataklar ise şaft üzerindeki bütün yükü taşıyarak şaftın dönmesini sağlamaktadır. Hidroelektrik santrallerindeki yataklar hidrodinamik veya hidrostatik yağlama prensibine göre çalışmaktadır. Bu tür yatakların soğutulması ve bakımı hidroelektrik santrallerin sağlıklı işletilmesi için büyük önem arz etmektedir. Çünkü bu tür yataklarda oluşacak herhangi bir arıza hidrolik türbinlerin uzun süre enerji üretememesine neden olabilir. Yenilenebilir bir enerji kaynağı olan hidroelektrik santrallerinde uzun süreler enerji üretememek ülke ekonomisine büyük zararlar verir. Bu çalışmada, hidroelektrik santrallerde kullanılan dikey türbinlerde bulunan taşıyıcı yatakların teknik açıdan sağlıklı işletilebilmesi için dikkat edilmesi gerekenler ve yapılması gereken bakımlar araştırılmıştır. Ayrıca bu tür santrallerde oluşan taşıyıcı yatak arızaları incelenerek oluşan bu arızaları gidermek için çözüm yöntemleri sunulmuştur. Bu çalışma tüm hidroelektrik santrallerin işletilmesinde faydalı olacaktır. Anahtar kelimeler; Yenilenebilir enerji, Hidroelektrik santral, Taşıyıcı yatak. GİRİŞ Enerji, sosyo-ekonomik gelişme ve yaşam standardını yükseltmede hayati bir rol oynamaktadır[1]. Enerji üretimini artırırken yenilenebilir enerji kaynaklarını kullanmak ülkelerin dışa bağımlılığını azaltır ve yenilenebilir enerji kaynakları sayesinde enerji üretirken çevreyi kirletmeyiz[2]. Yenilenebilir enerjinin dünyada en yaygın kullanılanı hidrolik enerjidir. Hidroelektrik santrallerin ekonomik ve çevresel faydaları ve aynı zamanda dünya çapındaki potansiyelleri, dünyanın enerji ihtiyacına önemli bir katkı sağlar[3]. Bu sebeplerden dolayı hidroelektrik enerji üretimini artırmak ayrıca mevcut hidroelektrik santrallerin verim ve kapasitelerini yükseltmek büyük öneme sahiptir. Bilim adamları hidroelktrik santrallerin verim ve üretim miktarlarını artırmak için

UEMK 2019 Proceedings Book 24/25 October 2019 Gaziantep University, TURKEY
417
çalışmaktadır[4, 6]. Hidroelektrik santraller belirli bölümlerden oluşurlar[7]. Bu bölümlerin en önemlilerden bir tanesi taşıyıcı yataklardır[8, 10]. MATERYAL VE YÖNTEM Hidroelektrik santrallerde kullanılan taşıyıcı yataklar lokmalı tip taşıyıcı yataklardır. Bu tip taşıyıcı yataklar taşıyıcı yatak çemberi üzerinde lokmaların dizilişleriyle imal edilirler. Hidrodinamik yağlamalı lokmalı taşıyıcı yataklar daha iyi yağlandıkları ve daha iyi soğuyabildikleri için çok büyük yüklerde kullanılabilirler. Şekil 1’de dikey şaftlı hidro türbinlerde hidrodinamik yağlamalı yatakların konumu şematik olarak gösterilmektedir.
Şekil 1. Dikey şaftlı hidro türbinlerde hidrodinamik yağlamalı yatakların şematik gösterimi Şekil 1’de görüldüğü gibi hidroelektrik santrallerde dikey bir şaft 3 adet hidrodinamik yağlamalı yatakla desteklenmektedir. Bunlardan generatör ve türbin kılavuz yataklar şafta gelen radyal yükleri yataklamaktadır. Taşıyıcı yatak ise şaft üzerindeki eksenel yükleri yataklamaktadır. Şaft üzerine gelen eksenel yükler generatör ve türbin çarkının oluşturduğu yükler olup radyal yüklerden çok daha fazladır. Türbin-generatör ünitesinin ürettiği enerji ne kadar fazla ise eksenel yükler o kadar fazla olur. Bu durum taşıyıcı yatakların önemini artırmaktadır. Şekil 2’de 150 MW gücünde dikey Francis türbinine ait taşıyıcı yatak ve taşıyıcı yatak ringi görülmektedir.

UEMK 2019 Proceedings Book 24/25 October 2019 Gaziantep University, TURKEY
418
Şekil 2. a)Taşıyıcı yatak lokması, b)Taşıyıcı yatak ringi Şekil 2’de hidroelektrik santrallere ait taşıyıcı yatak lokması ve ringi görülmektedir. Hidrolik santrallerde bulunan taşıyıcı yataklar hidrostatik ve hidrodinamik yağlama prensibine göre çalışırlar. Türbin-generatör ünitesi enerji üretimi için devreye alınırken taşıyıcı yatak yağ pompası lokma ile ring arasına lokmaların içerisine açılan kanallar vasıtası ile basınçlı yağ gönderir. Basınçlı yağ lokma ile ring arasında belli bir mesafe oluşturarak şaftın ilk hareketinde kuru sürtünmeyi engeller. Şaft nominal devrinin %30’una ulaştığında taşıyıcı yatak yağ pompası devreden çıkar ve bu devirden sonra hidrodinamik yağlama başlar. Türbin-generatör ünitesi tam üretim kapasitesine ulaştığında taşıyıcı yatak yağ filmi üzerinde oluşan yük maksimum seviyeye ulaşır. Bu durum lokmaların ve yağ filminin sıcaklığının artmasına neden olur. Eğer yeterli kapasitede soğutma gerçekleşmezse yağ filminde delinmeler ve taşıyıcı yatak lokmaları üzerindeki beyaz metalde deformasyonlar oluşur. Bu deformasyonlar hidroelektrik santralin uzun süreler enerji üretememesine neden olarak ülke ekonomilerine büyük zararlar verir. Deformasyona uğramış taşıyıcı yatak lokması şekil 3’te görülmektedir.
a b

UEMK 2019 Proceedings Book 24/25 October 2019 Gaziantep University, TURKEY
419
Şekil 3. Taşıyıcı yatak lokması beyaz metal deformasyon başlangıcı Çok büyük miktarlarda deformasyona uğrayan taşıyıcı yatak lokmaları değiştirilmelidir veya beyaz metali yeniden dökülerek kullanılmalıdır. Çünkü özellikle beyaz metal ortalarındaki üzerindeki derin çizikler yağ filmini bozarak yatağın sağlıklı çalışmasını engelleyecektir. Taşıyıcı yatak lokmalarının darbeleri absorbe edebilmeleri için her lokmanın altında şekil 4’te gösterilen yaylar bulunmaktadır.
Şekil 4.Taşıyıcı yatak lokmalarında darbe emici yaylar Şekil 4’te gösterilen yaylar türbin generatör ünitesine gelebilecek herhangi bir mekaniksel veya elektriksel darbeyi absorbe ederek taşıyıcı yatak lokmalarına gelebilecek zararı engellemektedir. SONUÇLAR Hidroelektrik santrallerde taşıyıcı yatağın kontrollü bir şekilde çalıştırılması ünitelerin verimli ve arızalanmadan çalışabilmesi açısından büyük önem teşkil etmektedir. Bir

UEMK 2019 Proceedings Book 24/25 October 2019 Gaziantep University, TURKEY
420
hidroelektrik santralinde taşıyıcı yatak arızalarından kaçınma çareleri aşağıda maddeler halinde verilmektedir. İlk çalışma esnasında taşıyıcı yatak yağ filmi basıncı yeterli seviyede olmalıdır. Bu basıncı taşıyıcı yatak yağ pompası oluşturduğu için pompanın bakımı periyodik şekilde yapılmalıdır. Türbin-generatör ünitesinin elektrik üretimi esnasında yatak sıcaklıkları periyodik olarak kontrol edilmeli sıcaklık göstergesinin üzerindeki sinyal ve trip fonksiyonları doğru sıcaklık değerlerine ayarlanmalıdır. Taşıyıcı yataklar belli periyotlarda indirilerek lokma yüzeyleri kontrol edilmeli ve yükseklik ayarları ölçülmelidir. Zarar gören yatak lokmaları yenisi ile değiştirilmeli veya beyaz metali yeniden dökülmelidir. KAYNAKLAR Gökçöl C, Dursun B, Alboyacı B, Sunan E.(2009). Importance of biomass energy as alternative to other sources in Turkey. Energy Policy 424-431. Lejeune A, Hui SL. (2012). Hydropower: a multi benefit solution for renewable energy. Comprehensive Renewable Energy, 6 15–47. Yuksek O.,Komurcu M.I., Yuksel I., Kaygusuz K. (2006). The role of hydropower in meeting Turkey's electric energy demand, Energy Policy, Volume 34, Issue 17 3093-3103. J.C.Galvis, J.M. Yusta Loyo, (2011). Cost assessment of efficiency losses in hydroelectric plants, Electric Power Systems Research, 81 1866-1873. Barros C.P., Peypoch N., (2007). The determinants of cost efficiency of hydroelectric generating plants: A random frontier approach, Energy Policy, 35 4463-4470. Barros C.P., (2008). Efficiency analysis of hydroelectric generating plants: A case study for Portugal, Energy Economics, 30 59-75. Momcilvic D, Odanovic Z, Mitrovic R, Atanasovska I, Vuherer T.(2012). Failure analysis of hydraulic turbine shaft. Engineering Failure Analysis 20:54–66. Peixoto T.F., Cavalca K.L., (2019). Investigation on the angular displacements influence and nonlinear effects on thrust bearing dynamics, Tribology International, 131 554-566. Wang W., Allaire P.E., (2018). Theoretical and experimental study on the static and dynamic characteristics of tilting-pad thrust bearing, Tribology International, 123 26-36.

UEMK 2019 Proceedings Book 24/25 October 2019 Gaziantep University, TURKEY
421
Gropper D., Wang L., (2018). Numerical analysis and optimization of surface textures for a tilting pad thrust bearing, Tribology International, 124 134-144.
UEMK 2019 Proceedings Book 24/25 October 2019 Gaziantep University, TURKEY
422
ANALYSIS OF RESEARCHES DEALING WITH ANAEROBIC
DIGESTION ON THE WORLD AND TURKEY
Elanur ADAR Artvin Coruh University [email protected] ABSTRACT: Anaerobic digestion is a technology that provides both stabilization of wastes/wastewater and allows the production of energy. Like every treatment/disposal method, the anaerobic digestion method has some disadvantages as well as its advantages. Some of these disadvantages include low treatment efficiency, long reaction time, and the need for treatment of the resulting liquid products, sensitivity to environmental conditions and so on. Despite these disadvantages, it is a widely used method. The aim of this study is to analyze realized how much of the studies on anaerobic digestion, which is widely used as full-scale, in the world and in Turkey. Web of Science and Scopus sites were used for this purpose. Different titles (anaerobic digestion, mesophilic, thermophilic, manure, sewage sludge, etc.) were taken into consideration and analyzed for the last 5 years. It has determined which countries do most of the researches and how much study carries out in Turkey. In addition, the data between 1975-2019 were taken into consideration. As a result of the research, it was observed from Scopus that the first study was conducted in 1928. The first study deals with distillery slop wastewater treatment in the USA. Commonly treated sludge and animal manure (poultry) studies were carried out in the USA in 1947 and 1963, respectively. Considering the researches in the last 5 years, China is the country in the first place in all work areas; Turkey has carried out studies on the most manure treatment. The majority of these studies conducted in Turkey are conducted in the ITU, Bosphorus and Adıyaman University. As a result, more studies on different wastes should be realized in Turkey. Key words: anaerobic digestion, analysis, research, world, Turkey DÜNYADA VE TÜRKİYE'DE ANAEROBİK ÇÜRÜTME İLE İLGİLİ ARAŞTIRMALARIN ANALİZİ ÖZET: Anaerobik çürütme, hem atıkların/atıksuların stabilizasyonunu sağlayan hem de enerji eldesine imkan sağlayan bir teknolojidir. Her arıtım/bertaraf metodu gibi anaerobik çürütme metodu da avantajlarının yanısıra bazı dezavantajlara sahiptir. Bu dezavantajlarının bazıları düşük arıtım verimi, uzun reaksiyon süresi, oluşan sıvı

UEMK 2019 Proceedings Book 24/25 October 2019 Gaziantep University, TURKEY
423
ürünlerin arıtım gereksinimi, çevresel şartlara karşı duyarlı olması vb. dir. Bu dezavantajlarına rağmen yaygın şekilde de kullanılan bir yöntemdir. Bu çalışmanın amacı yaygın şekilde tam ölçekli olarak kullanılan anaerobik çürütme ile ilgili dünya’da ve Türkiye’de ne kadar çalışmaların gerçekleştiğini analiz etmektir. Bu amaç içinde Web of Science ve Scopus sitelerinden faydalanılmıştır. Farklı başlıklar (anaerobik çürütme, mezofilik, termofilik, gübre, arıtma çamuru vb.) dikkate alınmıştır ve son 5 yıl için analiz edilmiştir. Hangi ülkelerin en çok araştırma yaptığı ve Türkiye’de ne kadar çalışma yürütüldüğü belirlenmiştir. Ayrıca 1975-2019 arası veriler de dikkate alınmıştır. Araştırma sonucunda da ilk çalışmanın 1928 yılında yapıldığı Scopus'tan belirlenmiştir. İlk çalışma ABD’de içki fabrikası atık suyu arıtımı ile ilgilidir. Yaygın şekilde arıtılan çamur ve hayvan gübresi (kümes) ile ilgili çalışmalar ise sırasıyla 1947’de ve 1963’de ABD’de gerçekleştirilmiştir. Son 5 yıldaki araştırmalar ele alındığında, Çin tüm çalışmalarda ilk sırada yer alan ülkedir; Türkiye ise en çok gübre arıtımı ile ilgili çalışmalar gerçekleştirmiştir. Türkiye’de gerçekleştirilen bu çalışmaların çoğunluğu ise İTÜ, Boğaziçi ve Adıyaman üniversitelerinde yürütülmüştür. Sonuç olarak, Türkiye’de farklı atıklar ile daha fazla çalışmalar gerçekleştirilmelidir. Anahtar sözcükler: anaerobik çürütme, analiz, araştırma, dünya, Türkiye GİRİŞ Anaerobik çürütme, atık/atıksuların arıtımı için yaygın şekilde kullanılan bir yöntemdir. Bu yöntem arıtımın yanısıra bertaraf edilmesi gereken atığın hacmini/kütlesini azaltmakta (%30-50) (Nges & Liu, 2010), atığın stabilizasyonu sağlanmakta ve yenilebilir enerji elde edilmektedir. Bu açıdan da anaerobik çürütme sürdürülebilir arıtım metodu olduğu söylenebilir. Ayrıca düzenli depolama yükünü de azaltmaktadır (Vindis, Mursec, Janzekovic & Cus, 2009)(Aich & Ghosh, 2016). Anaerobik çürütme, oksijenin olmadığı uygun şartlar altında (optimum pH, sıcaklık, mikroorganizma sayısı-türü, alkalinite, nütrient içeriği, vb.) organik içerikli atıkların/atıksuların ayrıştırılması işlemidir. Bu yöntem biyokütle enerjisi eldesi sağlamaktadır. Organik içeriğin mikroorganizmalar aracılığı ile ayrıştırılması ile biyogaza dönüştürülmekte ve %40-70 metan, %30-60 karbondioksit, %0-3 hidrojen sülfür ile çok az miktarda azot ve hidrojen içerir (Çetinkaya, 2018). Biyogazın içeriği substratın özelliği ve işletme şartları gibi birçok parametreye bağlıdır. Oluşan biyogaz enerjiye çevrilerek sistem içi veya dışı kullanılabilmektedir. Çakir & Stenstrom, (2005) uygun şartlar sağlandığı taktirde oluşan gazın metan içeriğinin enerjiye çevrilmesi ile önemli ekonomik kazanç sağlanabildiği ve elde edilen enerjinin tesisin enerji tüketiminin %28 oranını karşıladığını ifade etmektedir. Oluşan sıvı ve katı ürün toksik bileşenler içeriğine göre (patojen mikroorganizma, ağır metaller vb.) gübre olarak değerlendirilmektedir.
UEMK 2019 Proceedings Book 24/25 October 2019 Gaziantep University, TURKEY
424
Anaerobik çürütme sistemi mezofilik (35-37 ) ve termofilik (55-60 ) sıcaklıklarda çalıştırılabilmektedir (Vindis, Mursec, Janzekovic & Cus, 2009). Avrupa’daki beraber çürütme tesislerinde indirgenmiş termofilik sıcaklık (47) yaygın şekilde kullanılmaktadır. Beraber çürütme farklı atıkların uygun oranlarda karıştırılması ile ayrıştırılmasıdır. Farklı atık/atıksuların beraber çürütülmesi daha fazla mikroorganizma türü ve sayısı, artan stabilizasyon ve böylece de artan metan oluşumu demektir (Vindis, Mursec, Janzekovic & Cus, 2009). Bu çalışmanın amacı yaygın şekilde tam ölçekli olarak kullanılan anaerobik çürütme ile ilgili dünya’da ve Türkiye’de ne kadar çalışmaların gerçekleştiğini analiz etmektir. Bu amaç içinde başlıca Web of Science ve Scopus sitelerinden faydalanılmıştır. Farklı başlıklar (anaerobik çürütme, beraber çürütme, mezofilik, termofilik, gübre, arıtma çamuru vb.) dikkate alınmıştır ve son 5 yıl için analiz edilmiştir. Hangi ülkelerin en çok araştırma yaptığı ve Türkiye’de ne kadar çalışma yürütüldüğü belirlenmiştir. Ayrıca 1975-2019 arası veriler de dikkate alınmıştır. YÖNTEM Anaerobik çürütme ile ilgili Dünya’da ve Türkiye’de ne kadar çalışmaların gerçekleştiğini belirlemek için Web of Science, Scopus ve YÖK tez merkezi sitelerinden faydalanılmıştır. YÖK tez merkezinden ilk gerçekleştirilen tez çalışması hakkında bilgi edinmek için faydalanılmıştır. Son 5 yıllık veriler Web of Science sitesinden temin edilmiştir; ve bu verilerde SCI, ESCI ve Book Citation Index çalışmaları dikkate alınmıştır. Web of Science sitesinde 1975’den beri gerçekleştirilen çalışmalar yer aldığı ve Scopus sitesinde ise 1928 yılından itibaren verilerin olduğu gözlenmiştir. Bu sebeple de Scopus sitesinden de faydalanılmıştır. 1975-2019 arası toplamda ne kadar çalışma gerçekleştirildiği de yine Web of Science sitesinden alınmıştır. Bu veriler, sunulurken de en çok çalışma yapan 5 ülke ele alınmıştır. Türkiye’de ise hangi üniversitelerde çalışmaların gerçekleştiği ele alınmıştır. Bu sitelerden araştırma yapılırken de konu+başlık ve başlık+başlık olarak bazı anahtar kelimeler yazılmıştır. Anahtar kelime olarak anaerobik çürütme (AÇ), beraber çürütme (BÇ), mezofilik (M), termofilik (T), nanopartikül (NP), nano atık (NA), gübre (G), sığır gübresi (SG), tavuk gübresi (TG), arıtma çamuru (Aça), katı atık (KA), gıda atığı (GA), enerji (E), biyogaz (B), metan (Me), atık (A) ve atık su (AS) seçilmiştir. Atık türlerinden bunların seçilmesinin sebebi ise nanopartikül ve nano atık hariç diğerlerinin en yaygın çürütülen atıkların olmasıdır. BULGULAR İlk Çalışmalar Araştırma sonucunda da anaerobik çürütme ile ilgili ilk çalışmanın 1928 yılında yapıldığı Scopus'tan belirlenmiştir. İlk çalışma ABD’de içki fabrikası atık suyu arıtımı ile ilgilidir. Bu çalışma sonrası 1941 yılında Japonya’da endüstriyel atıklar ile ilgili bir çalışma

UEMK 2019 Proceedings Book 24/25 October 2019 Gaziantep University, TURKEY
425
gerçekleştirilmiştir. Yaygın şekilde arıtılan çamur ve hayvan gübresi (kümes) ile ilgili çalışmalar ise sırasıyla 1947’de ve 1963’de ABD’de gerçekleştirilmiştir. YÖK Tez Merkezi’nde ise 1994 yılına ait ilk tez çalışması mevcuttur. Bu tez yüksek lisans tezi olup anaerobik çürütmeye metallerin etkisi çalışılmıştır. Dünya Genelindeki 1975-2019 Yılları Arası ve Son 5 Yılda Yapılmış Çalışmalar Şekil 1’de dünya genelindeki 1975-2019 yılları arasında ve son 5 yılda yapılmış çalışmaların sayısı verilmiştir. Bu veriler verilirken de konu+başlık ve başlık+başlık anahtar kelimeler kullanılmıştır. 1975-2019 yılları arası anaerobik çürütme ile ilgili çalışmaların toplam sayısı 6147, son 5 yılda 2908 çalışma yapılmıştır. Yaklaşık %47’si son 5 yılda gerçekleştirilmiştir. Enerji, metan ve biyogaz kelimeleri taratıldığında ise en çok biyogaz ifadesi tercih edilmiştir. İşletme sıcaklık şartlarından mezofilik ve termofilikte ise termofilik daha fazla kullanılmıştır. Bunun sebebi mezofilik şartlar yaygın şekilde kullanıldığı için özellikle belirtilmemesi olabilir. Ele alınan atık türlerinden ise çoktan aza sırasıyla atık, çamur, atık su, gübre ve nanopartikül/atık ile ilgili çalışmalar gerçekleştirilmiştir. Atık türlerinden katı atıktan çok gıda atığı ile çalışmalar gerçekleştirilmişken gübre başlığı altında ise sığır gübresi ile ilgili çalışmalar daha çok gerçekleştirilmiştir. En az çalışma ise nano-partikül/atık ile gerçekleştirilmiştir.
Şekil 1. Dünya Genelindeki 1975-2019 Yılları Arası ve Son 5 Yılda Yapılmış Çalışma Sayısı Dünya ve Türkiye Genelindeki Son 5 Yılda Yapılmış Çalışmalar Dünya ve Türkiye genelindeki son 5 yıldaki yapılmış çalışma sayıları tespit edilirken konu+başlık olarak anahtar kelimeler Web of Science sitesinden taratılmıştır. AÇ terimi konu olarak taratıldığında 10423 çalışma olduğu gözlenmiştir. Termofilik çalışmaların

UEMK 2019 Proceedings Book 24/25 October 2019 Gaziantep University, TURKEY
426
daha çok yapıldığı; nanopartikül ve nano atık ile ilgili ise sırasıyla 8 ve 4 tane çalışmanın olduğu görülmüştür. Bu çalışmaların hepsi ise yurtdışında gerçekleştirilmiştir. Türkiye’de gübre ile çalışmaların fazla olduğu özellikle de tavuk gübresi ile çalışmaların gerçekleştirildiği tespit edilmiştir.
Şekil 2. Dünya ve Türkiye Genelindeki Son 5 Yılda Yapılmış Çalışma Sayısı Şekil 3’te ise son 5 yılda anaerobik çürütme ile ilgili gerçekleştirilmiş çalışmaların ülkelere göre dağılımı ele alınmıştır. En çok çalışma yapan 5 ülkenin toplam % ne kadar çalışma yaptığı hakkında fikir vermektedir. Konu+başlık olarak ifadelerin taratılması sonucunda tüm aramalarda en çok çalışma yapan ülke Çin; Türkiye gübre, sığır gübresi ve tavuk gübresi ile ilgili çalışmalarda ilk 5’te yer alan ülke olduğu sonucuna ulaşılmıştır. Nanopartikül ile ilgili çalışmalar Çin, ABD, Avustrulya ve Hindistan’da gerçekleştirilmişken nano atık ile ilgili çalışmalar Çin ve Danimarka’da gerçekleştirilmiştir. Genellikle de çalışmaların çoğu Çin, ABD, İtalya, İspanya, Almanya ve Japonya’da gerçekleştirilmiştir.
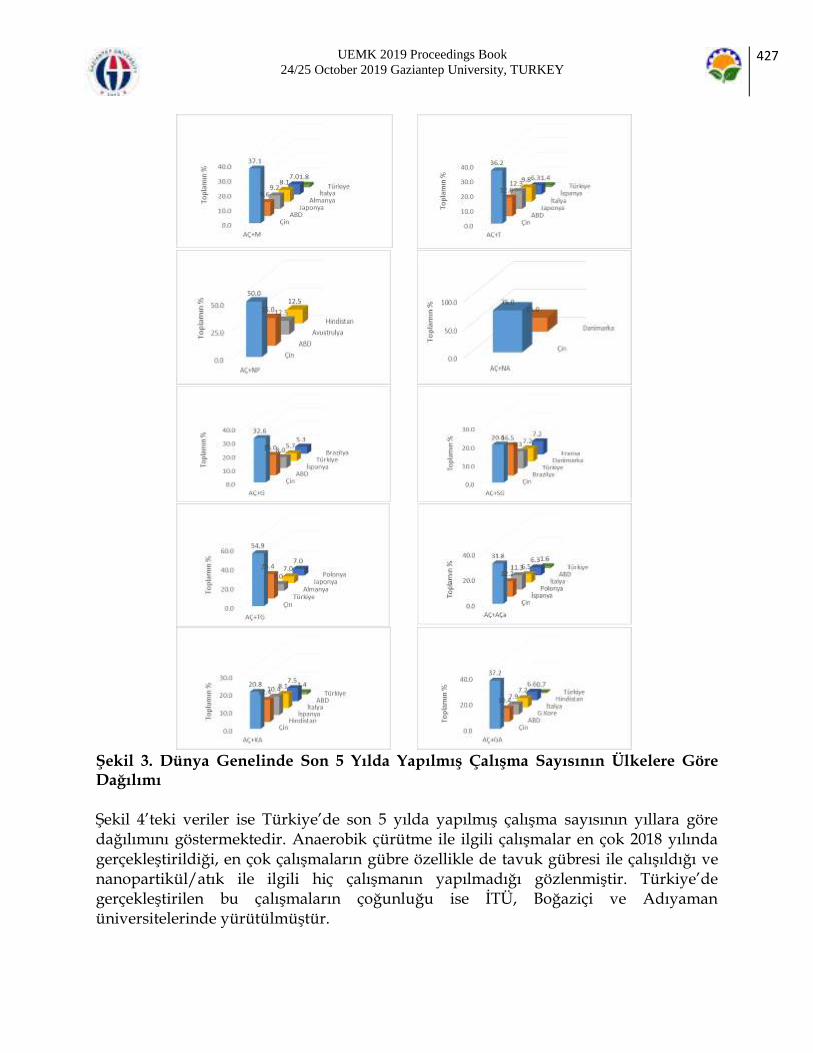
UEMK 2019 Proceedings Book 24/25 October 2019 Gaziantep University, TURKEY
427
Şekil 3. Dünya Genelinde Son 5 Yılda Yapılmış Çalışma Sayısının Ülkelere Göre Dağılımı Şekil 4’teki veriler ise Türkiye’de son 5 yılda yapılmış çalışma sayısının yıllara göre dağılımını göstermektedir. Anaerobik çürütme ile ilgili çalışmalar en çok 2018 yılında gerçekleştirildiği, en çok çalışmaların gübre özellikle de tavuk gübresi ile çalışıldığı ve nanopartikül/atık ile ilgili hiç çalışmanın yapılmadığı gözlenmiştir. Türkiye’de gerçekleştirilen bu çalışmaların çoğunluğu ise İTÜ, Boğaziçi ve Adıyaman üniversitelerinde yürütülmüştür.

UEMK 2019 Proceedings Book 24/25 October 2019 Gaziantep University, TURKEY
428
Şekil 4. Türkiye’de Son 5 Yılda Yapılmış Çalışma Sayısı SONUÇ Her arıtım/bertaraf metodu gibi anaerobik çürütme metodu da avantajlarının yanısıra bazı dezavantajlara sahiptir. Bu dezavantajlarının bazıları düşük arıtım verimi, uzun reaksiyon süresi, oluşan sıvı ürünlerin arıtım gereksinimi, çevresel şartlara karşı duyarlı olması vb. dir. Bu dezavantajlarına rağmen yaygın şekilde de kullanılan bir sürdürülebilir arıtım yöntemidir. Tam ölçekli kullanılan gelişmiş bir teknolojidir. Farklı anahtar kelimeler dikkate alınarak gerçekleştirilen bibliyometrik analiz sonucunda çalışmaların çoğusu Çin’de gerçekleştirildiği, nanopartikül/nano atık ile ilgili çalışmaların toplamda 12 civarında olduğu ve bu çalışmaların da başlıca Çin olmak üzere ABD, Avustrulya, Danimarka ve Hindistan’da gerçekleştirildiği tespit edilmiştir. Mezofilik sıcaklıklarda anaerobik çürütme daha az işletme maliyeti ve yüksek stabilite avantajları sağlamasından dolayı yaygın şekilde kullanılmasına rağmen çalışmaların çoğu termofilik ile yapıldığı tespit edilmiştir. Bunun sebebi mezofilik sıcaklıklar yaygın şekilde kullanıldığı için özellikle başlıkta ifade edilmediğinden dolayı olduğu düşünülmektedir. Türkiye’de anaerobik çürütme ile ilgili çalışmaların az olduğu, gübre ile ilgili çalışmalar (özellikle de tavuk gübresi) hariç ilk 5 ülke içerisinde yer almamaktadır. Günümüzün de güncel konularından olan nanopartikül veya nanoatıkların etkisi ile ilgili çalışmaların olmadığı görülmüştür. Bu sebeple de Türkiye’de özellikle de farklı atıkların beraber çürütülmesi ve nanopartikül/nano atıkların anaerobik çürütülmesi ile çalışmalara yoğunluk verilmesi gerektiği söylenebilir.

UEMK 2019 Proceedings Book 24/25 October 2019 Gaziantep University, TURKEY
429
KAYNAKLAR Aich, A., & Ghosh, S. K. (2016). Application of SWOT Analysis for the Selection of Technology for Processing and Disposal of MSW. Procedia Environmental Sciences, 35, 209–228. https://doi.org/10.1016/j.proenv.2016.07.083 Çakir, F. Y., & Stenstrom, M. K. (2005). Greenhouse gas production: A comparison between aerobic and anaerobic wastewater treatment technology. Water Research, 39(17), 4197–4203. https://doi.org/10.1016/j.watres.2005.07.042 Çetinkaya, A. Y. (2018). Süt Endüstrisi Atıksuyunun Biyometanizayon Potansiyelinin İncelenmesi. Journal of Polytechnic, 0900(2), 457–460. https://doi.org/10.2339/politeknik.403974 Nges, I. A., & Liu, J. (2010). Effects of solid retention time on anaerobic digestion of dewatered-sewage sludge in mesophilic and thermophilic conditions. Renewable Energy, 35(10), 2200–2206. https://doi.org/10.1016/j.renene.2010.02.022 Vindis, P; Mursec, B, Janzekovic M, Cus, F. (2009). The impact of mesophilic and thermophilic anaerobic digestion on biogas production. Journal of Achievements in Materials and Manufacturing Engineering, 36(2).

UEMK 2019 Proceedings Book 24/25 October 2019 Gaziantep University, TURKEY
430
THE EFFECT OF LOW IRRADIANCE ON THE HARMONICS
IN STAND-ALONE PHOTOVOLTAIC SYSTEM
Hasan CANGİ HasCan Engineering Company [email protected] Süleyman ADAK Mardin Artuklu University [email protected] ABSTRACT: Photovoltaic (PV) systems have been increasingly used in the generation of electrical energy, either as a means of providing electricity in areas where there is stand-alone systems, or by providing electricity to the grid connected systems. In this study the effect of low irradiance has been investigated on the harmonic components for stand-alone PV systems. Pyranometer was installed for controlled data acquisition system and used to collect the spectral irradiance data. It is clear that total harmonics distortion (THD) is very sensitive to be changed in solar irradiance condition. The THD values are high up to 130 % in the morning and evening hours when the solar irradiance is low and also when the solar irradiance is affected by sudden changes like passing clouds. But when the solar irradiance is high during the day, the current THD value gets reduced below the value of 10%. Also, fluctuating solar irradiance resulted in reduction of active power generated by off-grid PV system reducing the overall efficiency of the solar system. Key words: Off-grid system, power quality, solar irradiance, harmonics, renewable energy sources INTRODUCTION Due to the increasing fuel prices and related environmental concerns, renewable energies become an important source to supply electricity to buildings and industrial sectors. The energy demand in the world is consistently increasing, and new types of energy sources must be found in order to supply the future energy demands. Renewable sources of energy such as solar, wind, geothermal have gained popularity owing to consuming of conventional energy sources such as coal, gas and oil. Solar energy is one of the cleanest
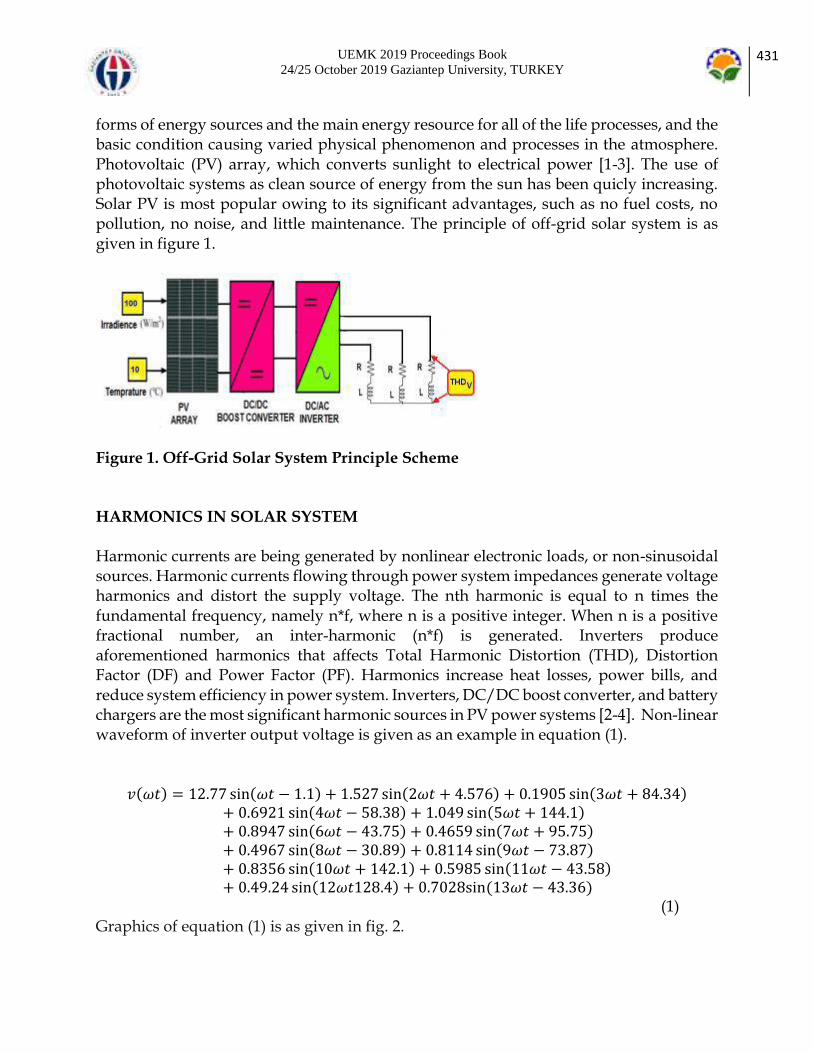
UEMK 2019 Proceedings Book 24/25 October 2019 Gaziantep University, TURKEY
431
forms of energy sources and the main energy resource for all of the life processes, and the basic condition causing varied physical phenomenon and processes in the atmosphere. Photovoltaic (PV) array, which converts sunlight to electrical power [1-3]. The use of photovoltaic systems as clean source of energy from the sun has been quicly increasing. Solar PV is most popular owing to its significant advantages, such as no fuel costs, no pollution, no noise, and little maintenance. The principle of off-grid solar system is as given in figure 1.
Figure 1. Off-Grid Solar System Principle Scheme HARMONICS IN SOLAR SYSTEM Harmonic currents are being generated by nonlinear electronic loads, or non-sinusoidal sources. Harmonic currents flowing through power system impedances generate voltage harmonics and distort the supply voltage. The nth harmonic is equal to n times the fundamental frequency, namely n*f, where n is a positive integer. When n is a positive fractional number, an inter-harmonic (n*f) is generated. Inverters produce aforementioned harmonics that affects Total Harmonic Distortion (THD), Distortion Factor (DF) and Power Factor (PF). Harmonics increase heat losses, power bills, and reduce system efficiency in power system. Inverters, DC/DC boost converter, and battery chargers are the most significant harmonic sources in PV power systems [2-4]. Non-linear waveform of inverter output voltage is given as an example in equation (1).
𝑣(𝜔𝑡) = 12.77 sin(𝜔𝑡 − 1.1) + 1.527 sin(2𝜔𝑡 + 4.576) + 0.1905 sin(3𝜔𝑡 + 84.34)+ 0.6921 sin(4𝜔𝑡 − 58.38) + 1.049 sin(5𝜔𝑡 + 144.1)+ 0.8947 sin(6𝜔𝑡 − 43.75) + 0.4659 sin(7𝜔𝑡 + 95.75)+ 0.4967 sin(8𝜔𝑡 − 30.89) + 0.8114 sin(9𝜔𝑡 − 73.87)+ 0.8356 sin(10𝜔𝑡 + 142.1) + 0.5985 sin(11𝜔𝑡 − 43.58)+ 0.49.24 sin(12𝜔𝑡128.4) + 0.7028sin (13𝜔𝑡 − 43.36)
(1) Graphics of equation (1) is as given in fig. 2.

UEMK 2019 Proceedings Book 24/25 October 2019 Gaziantep University, TURKEY
432
Figure 2. Nonlinear Waveform and Their Harmonic Components The decrease in harmonics is also proportional to an increase in solar irradiation levels. Harmonics have become increasingly necessary to calculate their influence when making any additions or changes to an power systems. As these higher frequency harmonic currents flow through the power system, they can cause, overheating and system hardware damage, such as: Overheating of electrical distribution equipment such as cables, transformers, battery PV panels. High voltages and circulating currents is caused by as a result ofharmonic resonance, Increased internal energy losses in connected such as, PV array, DC/DC convereter and solarinverter. Causing elements failure owing to hingh total harmonic distortion. Shortened life span of solar device, False triggers at power electronics device, Errors measurements in the measuring, Fires in wiring and distribution systems, Crest factors and related to problems, Lower solar system power factor. PV systems incorporate power electronic interfaces, which generate a level of harmonics potentially leading to current and voltage distortion. High frequency harmonics that appear due to power semi-conductors switching are reduced by selecte the optimal carrier frequency. Total harmonic distortion for voltage is the summation of all harmonic components of the current waveform compared against the fundamental component of the voltage wave,
UEMK 2019 Proceedings Book 24/25 October 2019 Gaziantep University, TURKEY
433
𝑇𝐻𝐷𝑣 =√𝑉2
2+𝑉32+𝑉4
2+⋯+𝑉𝑛2
𝑉1 (2)
In the off-grid mode, the voltage and current harmonics are the biggest power quality issues in off-grid PV system. THDv was used to characterize the power quality of solar power systems. In power systems, lower THDv means reduction in peak currents, heating, emissions, and core loss in motors. Harmonic distortion can have detrimental effects on electrical equipment. Unwanted distortion can increase the current in power systems which results in higher temperatures in neutral conductors and distribution transformers. These higher order harmonics can also interfere with communication transmission lines since they oscillate at the same frequencies as the transmit frequency. Due to the fast growth of photovoltaic installations, concerns are rising about the harmonic distortion generated from PV inverters. Solar photovoltaic generation depends extensively on power converters to produce alternating current output for interconnection purposes [5, 6]. Thus, the harmonic issue is an important aspect affecting the integration of PV generation. It is not necessary to reach power quality levels defined by several international standards in off-grid power systems, but only good power quality allows electrical devices to function in their given manner without loss of performance or possible damage [7-9]. APPLICATION OF MATLAB/SIMULINK IN SOLAR SYSTEM The photovoltaic array converts the sunlight into electricity. The photovoltaic array consists of parallel and series of photovoltaic modules. The cell is grouped together to form the panels or modules. The model of photovoltaic array is obtained from the photovoltaic cells and depends on how the cells are connected [8-10]. Because no power is provided during the hours of darkness, the stand alone systems must generate and store sufficient energy during the day to satisfy the peak daily load. The storage should also be sufficient to cover several days when no sunlight is available. Batteries are normally used as a buffer to provide the necessary storage to guarantee short term continuity of supply by storing surplus energy during the day for use during the night and during periods of overcast skies [11-12]. Unfortunately it is not practical to store the summer's surplus energy for use during the winter. Fig. 3 shows the change of solar irradians throughout the day.
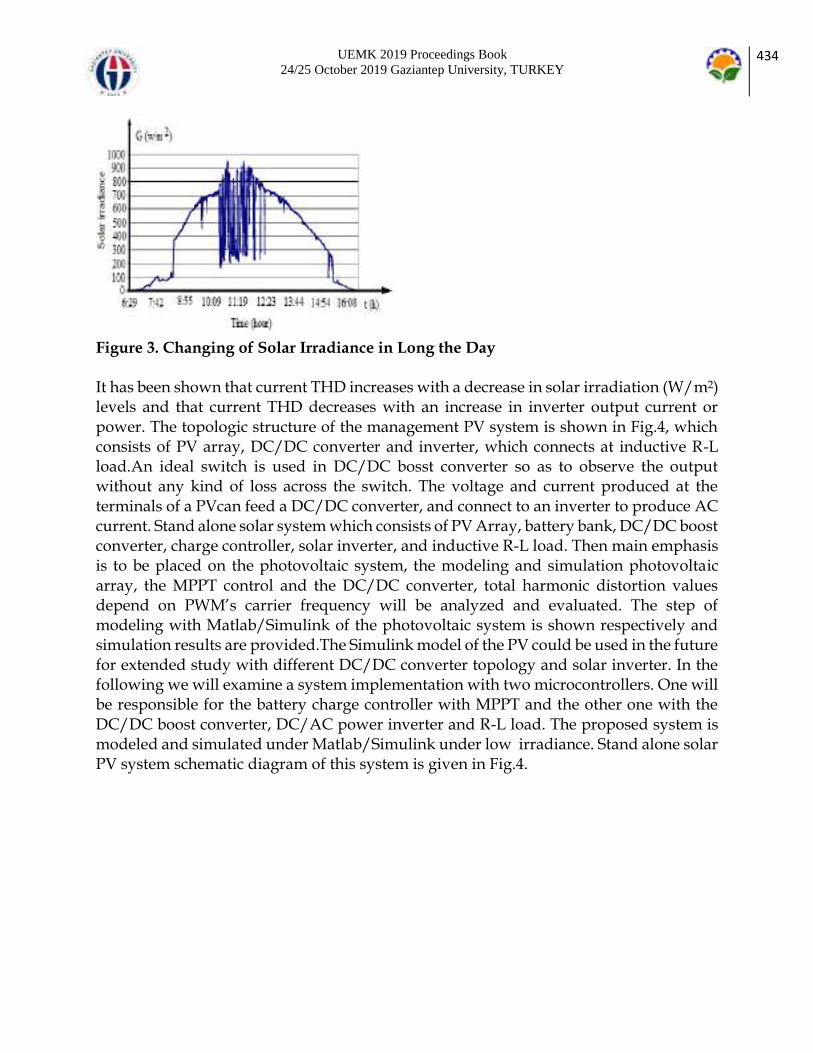
UEMK 2019 Proceedings Book 24/25 October 2019 Gaziantep University, TURKEY
434
Figure 3. Changing of Solar Irradiance in Long the Day It has been shown that current THD increases with a decrease in solar irradiation (W/m2) levels and that current THD decreases with an increase in inverter output current or power. The topologic structure of the management PV system is shown in Fig.4, which consists of PV array, DC/DC converter and inverter, which connects at inductive R-L load.An ideal switch is used in DC/DC bosst converter so as to observe the output without any kind of loss across the switch. The voltage and current produced at the terminals of a PVcan feed a DC/DC converter, and connect to an inverter to produce AC current. Stand alone solar system which consists of PV Array, battery bank, DC/DC boost converter, charge controller, solar inverter, and inductive R-L load. Then main emphasis is to be placed on the photovoltaic system, the modeling and simulation photovoltaic array, the MPPT control and the DC/DC converter, total harmonic distortion values depend on PWM’s carrier frequency will be analyzed and evaluated. The step of modeling with Matlab/Simulink of the photovoltaic system is shown respectively and simulation results are provided.The Simulink model of the PV could be used in the future for extended study with different DC/DC converter topology and solar inverter. In the following we will examine a system implementation with two microcontrollers. One will be responsible for the battery charge controller with MPPT and the other one with the DC/DC boost converter, DC/AC power inverter and R-L load. The proposed system is modeled and simulated under Matlab/Simulink under low irradiance. Stand alone solar PV system schematic diagram of this system is given in Fig.4.
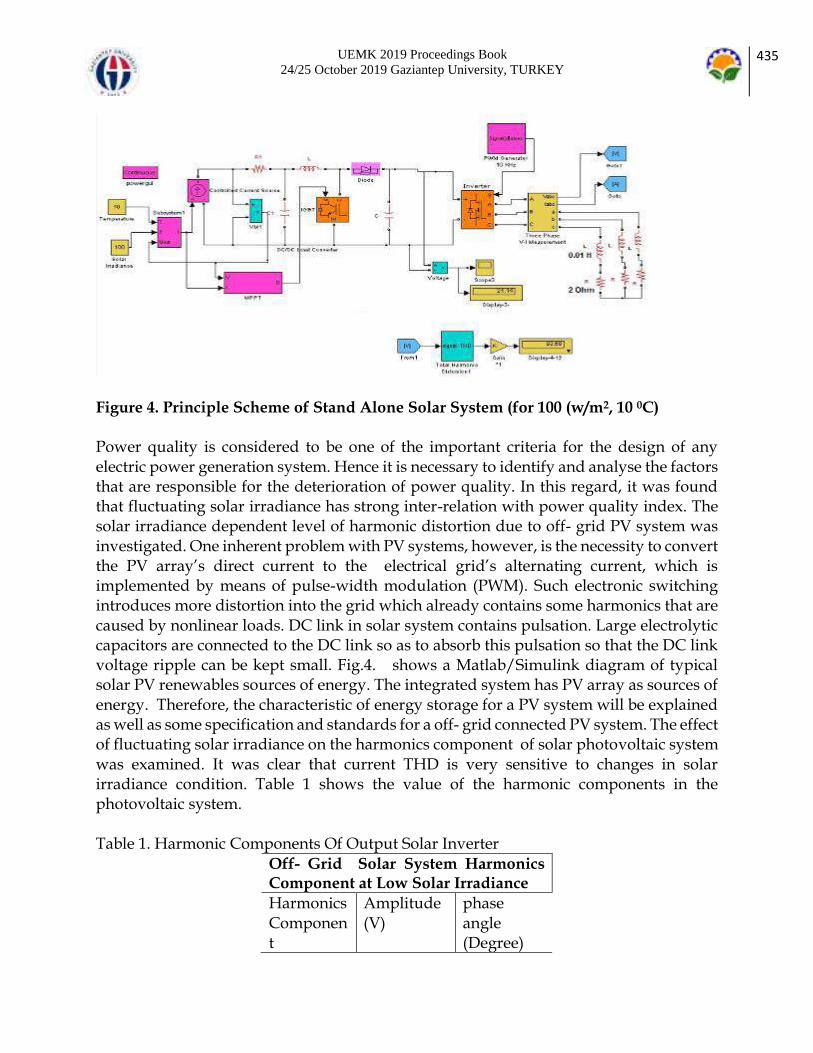
UEMK 2019 Proceedings Book 24/25 October 2019 Gaziantep University, TURKEY
435
Figure 4. Principle Scheme of Stand Alone Solar System (for 100 (w/m2, 10 0C) Power quality is considered to be one of the important criteria for the design of any electric power generation system. Hence it is necessary to identify and analyse the factors that are responsible for the deterioration of power quality. In this regard, it was found that fluctuating solar irradiance has strong inter-relation with power quality index. The solar irradiance dependent level of harmonic distortion due to off- grid PV system was investigated. One inherent problem with PV systems, however, is the necessity to convert the PV array’s direct current to the electrical grid’s alternating current, which is implemented by means of pulse-width modulation (PWM). Such electronic switching introduces more distortion into the grid which already contains some harmonics that are caused by nonlinear loads. DC link in solar system contains pulsation. Large electrolytic capacitors are connected to the DC link so as to absorb this pulsation so that the DC link voltage ripple can be kept small. Fig.4. shows a Matlab/Simulink diagram of typical solar PV renewables sources of energy. The integrated system has PV array as sources of energy. Therefore, the characteristic of energy storage for a PV system will be explained as well as some specification and standards for a off- grid connected PV system. The effect of fluctuating solar irradiance on the harmonics component of solar photovoltaic system was examined. It was clear that current THD is very sensitive to changes in solar irradiance condition. Table 1 shows the value of the harmonic components in the photovoltaic system. Table 1. Harmonic Components Of Output Solar Inverter
Off- Grid Solar System Harmonics Component at Low Solar Irradiance
Harmonics Component
Amplitude (V)
phase angle (Degree)
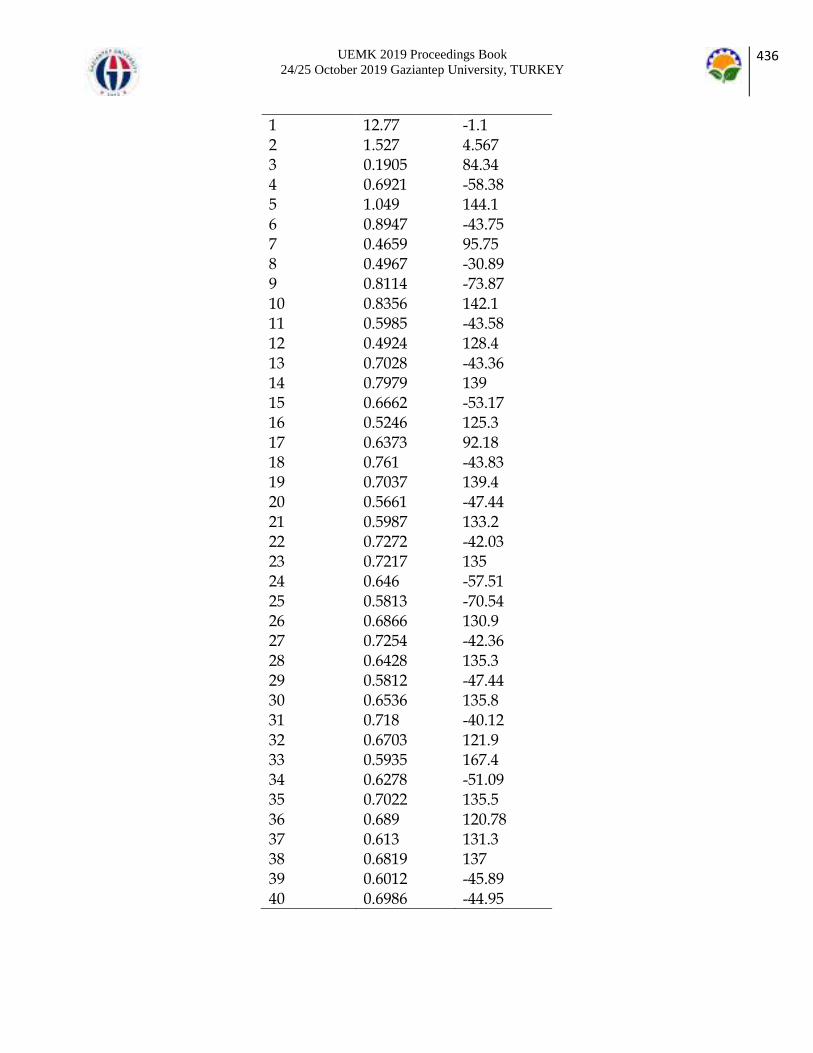
UEMK 2019 Proceedings Book 24/25 October 2019 Gaziantep University, TURKEY
436
1 12.77 -1.1 2 1.527 4.567 3 0.1905 84.34 4 0.6921 -58.38 5 1.049 144.1 6 0.8947 -43.75 7 0.4659 95.75 8 0.4967 -30.89 9 0.8114 -73.87 10 0.8356 142.1 11 0.5985 -43.58 12 0.4924 128.4 13 0.7028 -43.36 14 0.7979 139 15 0.6662 -53.17 16 0.5246 125.3 17 0.6373 92.18 18 0.761 -43.83 19 0.7037 139.4 20 0.5661 -47.44 21 0.5987 133.2 22 0.7272 -42.03 23 0.7217 135 24 0.646 -57.51 25 0.5813 -70.54 26 0.6866 130.9 27 0.7254 -42.36 28 0.6428 135.3 29 0.5812 -47.44 30 0.6536 135.8 31 0.718 -40.12 32 0.6703 121.9 33 0.5935 167.4 34 0.6278 -51.09 35 0.7022 135.5 36 0.689 120.78 37 0.613 131.3 38 0.6819 137 39 0.6012 -45.89 40 0.6986 -44.95
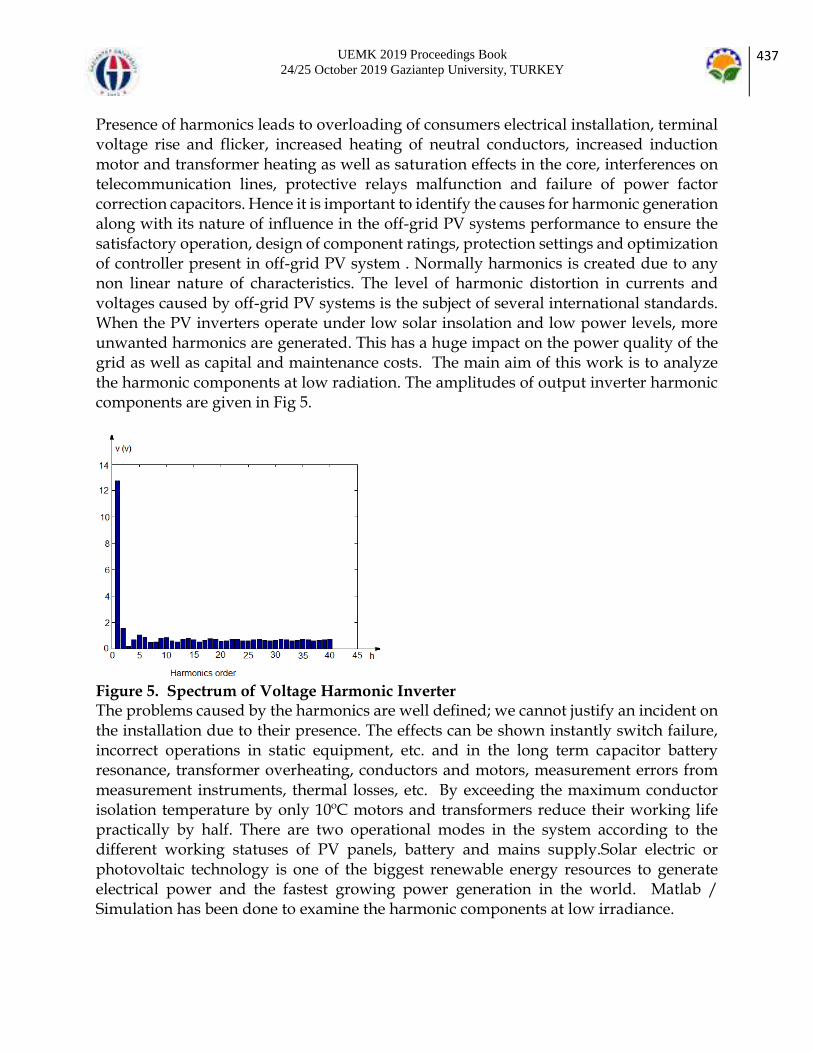
UEMK 2019 Proceedings Book 24/25 October 2019 Gaziantep University, TURKEY
437
Presence of harmonics leads to overloading of consumers electrical installation, terminal voltage rise and flicker, increased heating of neutral conductors, increased induction motor and transformer heating as well as saturation effects in the core, interferences on telecommunication lines, protective relays malfunction and failure of power factor correction capacitors. Hence it is important to identify the causes for harmonic generation along with its nature of influence in the off-grid PV systems performance to ensure the satisfactory operation, design of component ratings, protection settings and optimization of controller present in off-grid PV system . Normally harmonics is created due to any non linear nature of characteristics. The level of harmonic distortion in currents and voltages caused by off-grid PV systems is the subject of several international standards. When the PV inverters operate under low solar insolation and low power levels, more unwanted harmonics are generated. This has a huge impact on the power quality of the grid as well as capital and maintenance costs. The main aim of this work is to analyze the harmonic components at low radiation. The amplitudes of output inverter harmonic components are given in Fig 5.
Figure 5. Spectrum of Voltage Harmonic Inverter The problems caused by the harmonics are well defined; we cannot justify an incident on the installation due to their presence. The effects can be shown instantly switch failure, incorrect operations in static equipment, etc. and in the long term capacitor battery resonance, transformer overheating, conductors and motors, measurement errors from measurement instruments, thermal losses, etc. By exceeding the maximum conductor isolation temperature by only 10ºC motors and transformers reduce their working life practically by half. There are two operational modes in the system according to the different working statuses of PV panels, battery and mains supply.Solar electric or photovoltaic technology is one of the biggest renewable energy resources to generate electrical power and the fastest growing power generation in the world. Matlab / Simulation has been done to examine the harmonic components at low irradiance.
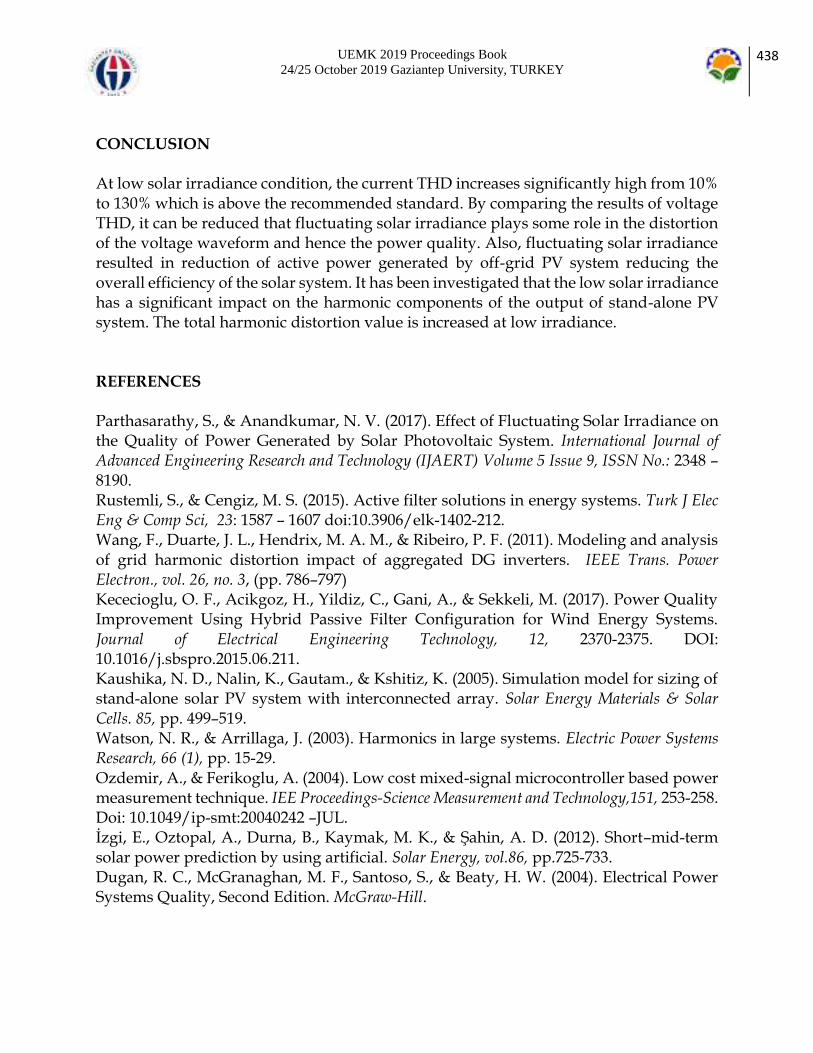
UEMK 2019 Proceedings Book 24/25 October 2019 Gaziantep University, TURKEY
438
CONCLUSION At low solar irradiance condition, the current THD increases significantly high from 10% to 130% which is above the recommended standard. By comparing the results of voltage THD, it can be reduced that fluctuating solar irradiance plays some role in the distortion of the voltage waveform and hence the power quality. Also, fluctuating solar irradiance resulted in reduction of active power generated by off-grid PV system reducing the overall efficiency of the solar system. It has been investigated that the low solar irradiance has a significant impact on the harmonic components of the output of stand-alone PV system. The total harmonic distortion value is increased at low irradiance. REFERENCES Parthasarathy, S., & Anandkumar, N. V. (2017). Effect of Fluctuating Solar Irradiance on the Quality of Power Generated by Solar Photovoltaic System. International Journal of Advanced Engineering Research and Technology (IJAERT) Volume 5 Issue 9, ISSN No.: 2348 – 8190. Rustemli, S., & Cengiz, M. S. (2015). Active filter solutions in energy systems. Turk J Elec Eng & Comp Sci, 23: 1587 – 1607 doi:10.3906/elk-1402-212. Wang, F., Duarte, J. L., Hendrix, M. A. M., & Ribeiro, P. F. (2011). Modeling and analysis of grid harmonic distortion impact of aggregated DG inverters. IEEE Trans. Power Electron., vol. 26, no. 3, (pp. 786–797) Kececioglu, O. F., Acikgoz, H., Yildiz, C., Gani, A., & Sekkeli, M. (2017). Power Quality Improvement Using Hybrid Passive Filter Configuration for Wind Energy Systems. Journal of Electrical Engineering Technology, 12, 2370-2375. DOI: 10.1016/j.sbspro.2015.06.211. Kaushika, N. D., Nalin, K., Gautam., & Kshitiz, K. (2005). Simulation model for sizing of stand-alone solar PV system with interconnected array. Solar Energy Materials & Solar Cells. 85, pp. 499–519. Watson, N. R., & Arrillaga, J. (2003). Harmonics in large systems. Electric Power Systems Research, 66 (1), pp. 15-29. Ozdemir, A., & Ferikoglu, A. (2004). Low cost mixed-signal microcontroller based power measurement technique. IEE Proceedings-Science Measurement and Technology,151, 253-258. Doi: 10.1049/ip-smt:20040242 –JUL. İzgi, E., Oztopal, A., Durna, B., Kaymak, M. K., & Şahin, A. D. (2012). Short–mid-term solar power prediction by using artificial. Solar Energy, vol.86, pp.725-733. Dugan, R. C., McGranaghan, M. F., Santoso, S., & Beaty, H. W. (2004). Electrical Power Systems Quality, Second Edition. McGraw-Hill.

UEMK 2019 Proceedings Book 24/25 October 2019 Gaziantep University, TURKEY
439
Nema, S., Nema, R. K., & Agnihotri, G. (2010). Matlab/Simulink based study of photovoltaic cells/modules/array and their experimental verification. International journal of Energy and Environment, vol.1, No.3, pp.487-500. Cangi, H., & Adak, S. (2015). Analysis of solar inverter THD according to PWM’s carrier frequency. International Conference on Renewable Energy Research and Applications (ICRERA); DOI: 10.1109/ICRERA.2015, 7418694. Oliva A. R., & Balda, J. C. (2003). A PV dispersed generator: a power quality analysis within the IEEE 519. IEEE Trans. on Power Delivery , 18, 2 525-530.

UEMK 2019 Proceedings Book 24/25 October 2019 Gaziantep University, TURKEY
440
CHARPY IMPACT BEHAVIOR OF GLASS FIBER
REINFORCED COMPOSITE PIPES FABRICATED BY
CONTINUOUS FILAMENT WINDING TECHNIQUE
Özkan ÖZBEK Gaziantep University, Mechanical Engineering Department, 27310, Gaziantep, Turkey, [email protected] Ömer Yavuz BOZKURT Gaziantep University, Mechanical Engineering Department, 27310, Gaziantep, Turkey, [email protected] Mehmet Sami KANAT Akbor Boru Sanayi ve Ticaret Limited Şirketi, Aksaray, Turkey, [email protected] ABSTRACT: In the current work, damage resistance of filament wound glass fiber/epoxy resin reinforced composite pipes is studied. Composite pipes with different diameters 600, 700, 800, 900 and 1000 mm were manufactured using continuous filament winding technique. Damage resistance was evaluated by subjecting samples to low velocity impact loading at an energy level of 15 J using Kögel 3/70 Charpy impact test system. Five specimens were tested for each diameter of composite pipes. The damage analysis, using optical inspection, was conducted to understand the cause, extent and type of damage. Results of the tests are reported in terms of absorbed energy and impact toughness. The comparison of absorbed energy and impact toughness show that damage resistance of the samples are increased with an increase in diameter. Key words: charpy, continuous filament winding, glass fiber INTRODUCTION In the last few decades, polymer-based composite materials, which have emerged as a result of the search for new material development, have started to be widely used in applications due to their superior properties such as high specific strength and stiffness compared to classical metallic-based engineering materials. Today, they have been used in a variety of engineering field ranging from daily life tools to space industry. Depending on the area of application, they can be subjected to low velocity impact loading in cases

UEMK 2019 Proceedings Book 24/25 October 2019 Gaziantep University, TURKEY
441
of many unpredictable event such as work accident, natural disaster etc. Therefore, the determination of energy absorption capabilities of composite materials in an impact event has a crucial importance before the usage in applications. A considerable amount of studies devoted to low impact behaviors of composite materials are present in the literature [1-3]. Caminero et al. [4] studied the effects of stacking sequences on the Charpy impact and flexural responses of carbon fiber reinforced composite laminates. Two main lay-up as cross ply and angle-ply were analyzed. The samples having [±45]3s sequences showed the best energy absorption capability due to its pseudo-ductile behavior. Splitting, matrix cracking and delamination were observed as failure modes. Bulut [5] investigated the influence of graphene nanopellets inclusion on the Charpy impact characteristics of basalt fiber reinforced composite laminates. He stated that the 0.1 wt % nanoparticle addition were improved the material response because of high bonding strength at the interphase between nanoparticle-epoxy-fiber interactions. Demirci et al. [6] investigated the Charpy impact behaviors of arc shaped samples. The samples produced by filament winding method had the six layer with ± (55°) winding angles. Basalt and glass fibers were used as reinforcement. They conducted the experiments at different notch-depth ratios. The delamination damage in glass reinforced composites was observed to be more dominant than basalt reinforced samples. Reis et al. [7] explored the influence of nanoclay content on impact response of Kevlar fiber reinforced epoxy composites to determine the ideal amount (wt.%) of nanoclay for the best impact response. In the current work, damage resistance of filament wound glass fiber/epoxy resin reinforced composite pipes is studied. To this aim, the pipes with different diameters 600, 700, 800, 900 and 1000 mm were manufactured using continuous filament winding technique and exposed to impact loading on Charpy test machine. MATERIALS AND METHODS Sample Preparation The glass roving fiber with 2400 tex and 17 μm monofilament diameter, provided from Cam Elyaf A. Ş., Turkey, was used as reinforcement material. For matrix component of composite pipes, the polyester resin (BOYTEK PW05) and its hardener were mixed with the stoichiometric weight ratio of 98:2, respectively. Composite pipes were manufactured by a continuous filament winding machine shown in Figure 1. The machine has 2 motion capability as mandrel translation and mandrel rotational movements. All production stages were performed on the winding machine in Akbor San. ve Tic. Ltd. Şti., Aksaray, Turkey. Firstly, release wax application was performed to mandrel and glass wool was wrapped to obtain smooth surface inside of the sample. Then prepared resin mixture was deposited and the wrapping process of the reinforcements with 100 number of glass fibers together was conducted. The silica sand was used for strengthening in the middle

UEMK 2019 Proceedings Book 24/25 October 2019 Gaziantep University, TURKEY
442
part of the pipe. Finally, glass fibers was again wrapped and finally glass wool was applied on the outer surface as seen in Figure 1.
Figure 1. Continuous filament winding technique The all samples were cut on the longitudinal axis of the pipe as shown in Figure 2. The thickness and naming information of the glass fiber reinforced composite pipes were given in Table 1.
Figure 2. The pipe structure Table 1. The naming and thickness information of glass fiber reinforced composite pipes
Diameter, mm Naming Thickness, mm
600 G06 9.43 ± 0.05
700 G07 11.66 ± 0.08
800 G08 13.46 ± 0.08
900 G09 13.43 ± 0.06
1000 G10 17.68 ± 0.05
Charpy Impact Test Charpy impact experiments were conducted to determine low velocity impact characteristics of glass fiber reinforced pipes. All experiments were performed in accordance with ISO 179/92 standard [8]. A Köger 3/70 Charpy test machine having 15.0 J capacity, shown in Fig. 3, were employed to measure impact energy of each sample. Also, schematic illustration of Charpy impact experiment was given in Fig.4.

UEMK 2019 Proceedings Book 24/25 October 2019 Gaziantep University, TURKEY
443
Figure 3. Kögel 3/70 Charpy impact tester
Figure 4. Schematic illustration of Charpy impact test The samples having 55 mm x 10 mm dimensions in length and width, shown in Fig. 5, were prepared as unnotched and subjected to flatwise impact loading. For each pipe diameter, five number of samples were tested to ensure experimental reliability. All tests were performed at standard weather conditions. The absorbed impact energy and impact toughness of samples were determined according to following equations: E = Ea - Eb (1) acu=E⁄(bh) (2) where, E, Ea, Eb, acu, h and b represent the absorbed impact energy, potential energy of the weighted pendulum before and after impact (shown in Fig. 3), impact toughness, thickness and width of the test sample, respectively. Average values and standard deviations for the absorbed impact energy and impact toughness were used to assess the effect of pipe diameter.
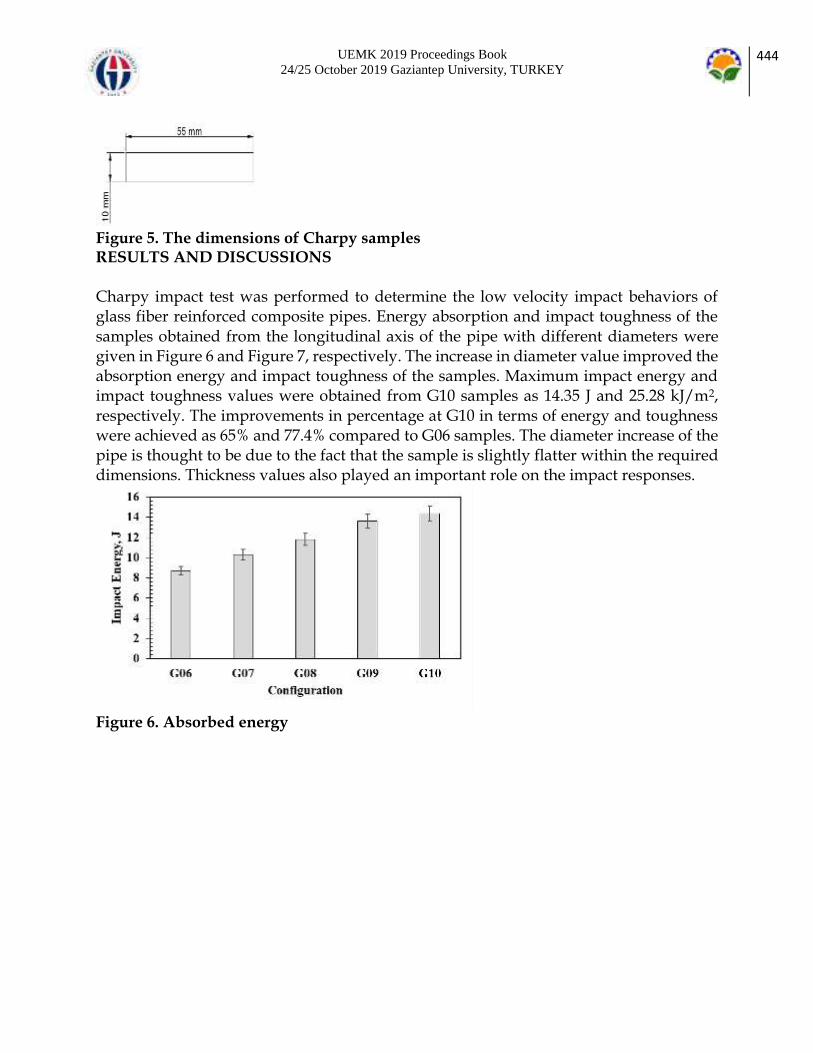
UEMK 2019 Proceedings Book 24/25 October 2019 Gaziantep University, TURKEY
444
Figure 5. The dimensions of Charpy samples RESULTS AND DISCUSSIONS Charpy impact test was performed to determine the low velocity impact behaviors of glass fiber reinforced composite pipes. Energy absorption and impact toughness of the samples obtained from the longitudinal axis of the pipe with different diameters were given in Figure 6 and Figure 7, respectively. The increase in diameter value improved the absorption energy and impact toughness of the samples. Maximum impact energy and impact toughness values were obtained from G10 samples as 14.35 J and 25.28 kJ/m2, respectively. The improvements in percentage at G10 in terms of energy and toughness were achieved as 65% and 77.4% compared to G06 samples. The diameter increase of the pipe is thought to be due to the fact that the sample is slightly flatter within the required dimensions. Thickness values also played an important role on the impact responses.
Figure 6. Absorbed energy

UEMK 2019 Proceedings Book 24/25 October 2019 Gaziantep University, TURKEY
445
Figure 7. Impact toughness Figure 8 shows the fracture shapes and failure modes of the samples after the Charpy impact experiments. Increase in impact strength and energy as the diameter increases lead to more destructive fractures. In addition, silica sand in mid region was directly separated after fiber breakage in outer side of sample resulted with the crack propagated to inner side. The most destructive fractures were generally observed in G10 samples with a diameter of 1000 mm. The combination of matrix fragmentation, layer delamination and fiber breakage were seen as failure modes of the samples.
Figure 8. Fracture shapes and failure modes CONCLUSION In this study, the effect of pipe diameter on the low velocity characteristics of glass fiber composite pipes fabricated by continuous filament winding technique samples were investigated. Charpy impact experiments were evaluated to obtain impact behaviors in terms of absorbed energy and impact toughness. The results showed that the pipe diameter had very significant influences on examined parameters. Higher pipe diameter

UEMK 2019 Proceedings Book 24/25 October 2019 Gaziantep University, TURKEY
446
with thicker material resulted with the higher energy absorption and impact toughness. Maximum impact energy and impact toughness values were obtained from G10 samples as 14.35 J and 25.28 kJ/m2, respectively. The improvements in percentage at G10 in terms of energy and toughness were achieved as 65% and 77.4% compared to G06 samples. Matrix fragmentation, delamination of layers and fiber breakage were observed as failure modes. With higher load carrying capacity led to more catastrophic failures especially in samples with 1000 mm diameter. In conclusion, pipe diameter proved the magnificent effect on low velocity behaviors of the filament wound composite pipes. REFERENCES [1] Zhong, Y., & Joshi, S. C. (2015). Impact behavior and damage characteristics of hygrothermally conditioned carbon epoxy composite laminates. Materials & Design (1980-2015), 65, 254-264. [2] Farsani, R. E., Khalili, S. M. R., & Daghigh, V. (2014). Charpy impact response of basalt fiber reinforced epoxy and basalt fiber metal laminate composites: Experimental study. International Journal of Damage Mechanics, 23(6), 729-744. [3] Hufenbach, W., Ibraim, F. M., Langkamp, A., Böhm, R., & Hornig, A. (2008). Charpy impact tests on composite structures–an experimental and numerical investigation. Composites Science and Technology, 68(12), 2391-2400. [4] Caminero, M. A., Rodríguez, G. P., & Muñoz, V. (2016). Effect of stacking sequence on Charpy impact and flexural damage behavior of composite laminates. Composite Structures, 136, 345-357. [5] Bulut, M. (2017). Mechanical characterization of Basalt/epoxy composite laminates containing graphene nanopellets. Composites Part B: Engineering, 122, 71-78. [6] Demirci, M. T., Tarakçıoğlu, N., Avcı, A., & Erkendirci, Ö. F. (2014). Fracture toughness of filament wound BFR and GFR arc shaped specimens with Charpy impact test method. Composites Part B: Engineering, 66, 7-14. [7] Reis, P. N. B., Ferreira, J. A. M., Zhang, Z. Y., Benameur, T., & Richardson, M. O. W. (2013). Impact response of Kevlar composites with nanoclay enhanced epoxy matrix. Composites Part B: Engineering, 46, 7-14. [8] ISO, I, 179–1, Plastics—Determination of Charpy Impact Properties, Part 1: Non-Instrumented Impact Test, International Organization for Standardization: Geneva, Switzerland, 2010. NOMENCLATURE D thermal duct diameter (m) L thermal duct lenght (m) mass flow rate (kg s-1) p perimeter (m) Pr Prandtl number

UEMK 2019 Proceedings Book 24/25 October 2019 Gaziantep University, TURKEY
447
q heat flux (W m-2) qʹ heat transfer per unit of length (W m-1) Q heat transfer rate Re Reynolds number S entropy generation rate per unit length (W m-1 K-1 ) T temperature (K) W water x axial coordinate (m) Greek symbols ϕ nanoparticles volume concentration (%) ν kinematic viscosity ( m2s-1) ΔT temperature difference (K) Subscripts bf base fluid gen generation nf nanofluids p particles t thermal T total

UEMK 2019 Proceedings Book 24/25 October 2019 Gaziantep University, TURKEY
448
SECOND LAW OPTIMIZATION OF WATER-PROPYLENE
GLYCOL/ Al2O3 NANOFLUID FLOW IN VARIOUS SHAPES
AND AREAS OF THERMAL DUCTS
Nurullah Arslanoglu
Bursa Uludag University, Faculty of Engineering, Dept. of Mechanical Eng., Bursa, Turkey [email protected] Abdulvahap Yigit Bursa Uludag University, Faculty of Engineering, Dept. of Mechanical Eng., Bursa, Turkey [email protected] ABSTRACT: Water/propylene glycol (W/PG)-based Al2O3 nanofluids flow entropy generation in a circular cross-section thermal duct and under constant uniform heat flux thermal boundary condition was analytically investigated for turbulent regime. In addition, this study investigated the entropy generation characteristics of various particle volume fraction, and cross section shape and area of thermal ducts for W/PG (60:40)-Al2O3 nanofluid flow. Furthermore, thermodynamic performance of Water/propylene glycol and Water/ ethylene glycol fluid flow was compared. Consequently, Ns,a values of W/PG- Al2O3 nanofluids are smaller than 1 from Re=3000 to Re=10392(ϕ=1%), 9007(ϕ=3%), 8241(ϕ=5%). The optimum Re numbers, where the entropy generation is minimum, are 7217(ϕ=0), 7162(ϕ=1%), 6998(3%), 6838 (5%). The thermal ducts are ranked in order from lowest to highest entropy generation: circular, square, triangle. It is found that total entropy generation increases with the increasing cross-sectional area and the entropy generation of water/propylene glycol fluid flow is higher than water/ethylene glycol fluid flow. Key words: Entropy generation, water-propylene glycol/Al2O3, nanofluids
INTRODUCTION Nanofluids are obtained by suspending nanoparticles (less than 100 nm) in the basic fluid. The scope is to improve the heat transfer properties of the base fluid. Especially, nanofluids will be used thermal systems in the future. But, nanoparticles increase the viscosity of the base fluid. This causes increasing friction factor. The studies related to heat transfer, friction characteristics, and entropy generation analysis of nanofluids in literature are summarized below.

UEMK 2019 Proceedings Book 24/25 October 2019 Gaziantep University, TURKEY
449
Heat transfer and friction factor characteristics of water/propylene glycol-based CuO nanofluids were investigated in a circular tube fitted with and without helical inserts. Experiments were carried out different Re numbers and volume concentrations. Correlations were developed for predicting Nu number and friction factor [Naik and Sundar, 2014]. The effect of nanoparticle concentration (0–1%) and temperature on thermal conductivity and viscosity of ceria–propylene glycol nanofluids was investigated. The ceria–propylene glycol nanofluids are suitable for cooling applications [Prabhakaran et al. 2016]. 20% PG (propylene glycol)-water was used as the working fluid. As a result, the thermal conductivity increased with increasing volumetric concentration of nanofluid. The increasing of the solar collectors efficiency is from the greatest to the least: MWCNT, CuO, Al2O3, TiO2 and SiO2 nanofluids [Kim et al., 2016]. In the case of 2% nanoparticle addition, the thermal conductivity increased by 16% and the viscosity decreased by 47%. The sand-propylene glycol-water nanofluid could be used as a heat transfer fluid in solar collectors [Manikandan and Rajan, 2016]. Studies investigating the effect of different cross-sectional types of channels on entropy generation are available in the literature. Optimum duct geometry was determined by using second-law analysis. Circular duct exhibits lowest total entropy generation compared to triangular and rectangular duct geometries [Sahin, 1998]. Entropy generation was obtained for semi-cylindrical ducts for laminar flow and subjected to constant wall heat flux. The effect of heat flux rate, Reynolds number and cross sectional area on entropy generation was investigated. The cross-sectional area and the wall heat flux were found to have a significant effect on entropy generation [Oztop, 2005]. The effect of cross section shape on entropy generation minimization was studied for fully developed laminar and turbulent flow [Jankowski, 2009]. The entropy generation was investigated in the hexagonal channel for fully developed laminar convection. Water and engine oil were used as the working fluid [Jarungthammachote, 2010]. The effect of cross section shape on entropy generation minimization was examined. Circular, square and triangle cross section shapes were considered. The Al2O3-water and MWCNT-water nanofluids were used as the working fluid. Circular duct produces lowest total entropy generation compared to other considered shapes [Leong ve Ong, 2014] . According to minimal entropy generation principle, the optimum design conditions of thermal systems are obtained when entropy generation is minimized. Because entropy generation indicates the irreversibility of thermal system, minimizing entropy generation makes the thermal systems more efficient [Bejan, 1996]. Numerous studies are available in the literature about entropy generation minimization of thermal systems to find their optimum design conditions. Entropy generation of the Al2O3-water and ethylene glycol- Al2O3 nanofluids was investigated in a circular pipe subjected constant wall heat flux boundary conditions. It is found that increase the thermal performance of the Al2O3-water nanofluids with Re numbers less than 40000 and ethylene glycol- Al2O3 nanofluids flow with Re<11. Optimum conditions were represented for both laminar and turbulent regimes [Moghaddami et al., 2011].

UEMK 2019 Proceedings Book 24/25 October 2019 Gaziantep University, TURKEY
450
Three different diameters (0.1 mm, 1mm, and 10 mm) were studied. It is found that fluid flow irreversibility is dominant at lower tube diameter, heat transfer irreversibility is dominant at higher tube diameter [Singh et al., 2010]. Entropy generation of Al2O3-water nanofluid was obtained in circular tube under constant wall heat flux boundary condition for turbulent flow. The study was carried out under different parameters (i.e. constant Re, fixed mass flow rate and constant velocity). Low nanoparticle concentration is required to decrease the total entropy generation when the velocity is kept constant [Bianco et al., 2014]. Entropy generation analysis of Al2O3-water nanofluids was found in square section tubes for turbulent flow. The optimum Re numbers were obtained for Al2O3-water nanofluids flow [Bianco et al., 2011]. Entropy generation analysis of nanofluid flow was carried out in a circular tube for laminar regime. Tube was immersed in an isothermal external fluid. Water-Al2O3 and ethylene glycol- Al2O3 were selected as working nanofluids. The effect of the non-dimensional temperature differences, external Biot number, and volume fraction on the entropy generation was investigated. The addition of nanoparticles is only useful for small Reynolds numbers and for less viscous fluids [Anand, 2015]. The water has a higher freezing point and lower boiling point a compared to ethylene glycol-water mixture. In addition, the viscosity of the ethylene glycol is higher than the viscosity of the ethylene glycol-water mixture, thus reducing the required pumping power. Thus, ethylene glycol is preferred as antifreeze in automobile radiators and solar energy systems. But, the use of propylene glycol is recommended to avoid adverse effects caused by ethylene glycol. Because, propylene glycol, which is much less toxic than ethylene glycol [Ethylene Glycol and Propylene Glycol Toxicity, 2017]. However, there are no studies comparing the performance of thermal systems using ethylene glycol and propylene glycol as antifreeze in the literature. In present study, entropy generation minimization of a mixture of ethylene glycol-water and propylene glycol-water fluid flow was carried out. Thermodynamic performance of two different fluids was compared. In addition, a variety of cross section shape is important in thermal system design and can be used to enhance the thermal performance. Also, this study investigated the entropy generation characteristics of various particle volume fraction, and cross section shape of thermal ducts for W/PG (60:40)-Al2O3 nanofluid flow. Furthermore, effect of cross sectional-area of ducts on entropy generation was investigated. There are no studies investigating the entropy generation characteristics of various particle volume fraction, cross section shape and area for turbulent flow in literature. In present study, W/PG (60:40)-Al2O3 nanofluid flow entropy generation in a circular cross-section thermal duct under turbulent regime and constant uniform heat flux was analytically investigated. As a result, the Re numbers ranges in which the addition of nanoparticles to W/PG is advantageous in terms of thermodynamics were obtained under turbulent regimes. In addition, the optimum Re numbers, where the entropy generation is minimum, were obtained.
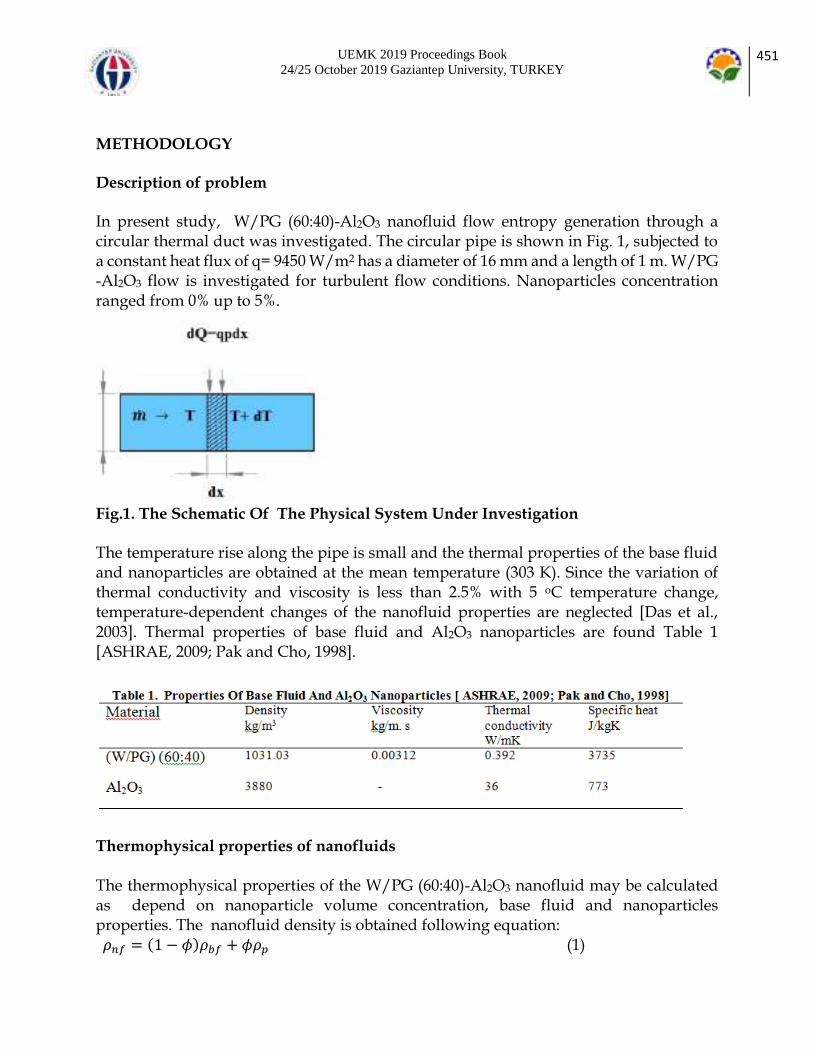
UEMK 2019 Proceedings Book 24/25 October 2019 Gaziantep University, TURKEY
451
METHODOLOGY Description of problem In present study, W/PG (60:40)-Al2O3 nanofluid flow entropy generation through a circular thermal duct was investigated. The circular pipe is shown in Fig. 1, subjected to a constant heat flux of q= 9450 W/m2 has a diameter of 16 mm and a length of 1 m. W/PG -Al2O3 flow is investigated for turbulent flow conditions. Nanoparticles concentration ranged from 0% up to 5%.
Fig.1. The Schematic Of The Physical System Under Investigation The temperature rise along the pipe is small and the thermal properties of the base fluid and nanoparticles are obtained at the mean temperature (303 K). Since the variation of thermal conductivity and viscosity is less than 2.5% with 5 oC temperature change, temperature-dependent changes of the nanofluid properties are neglected [Das et al., 2003]. Thermal properties of base fluid and Al2O3 nanoparticles are found Table 1 [ASHRAE, 2009; Pak and Cho, 1998].
Thermophysical properties of nanofluids The thermophysical properties of the W/PG (60:40)-Al2O3 nanofluid may be calculated as depend on nanoparticle volume concentration, base fluid and nanoparticles properties. The nanofluid density is obtained following equation: 𝜌𝑛𝑓 = (1 − 𝜙)𝜌𝑏𝑓 + 𝜙𝜌𝑝 (1)
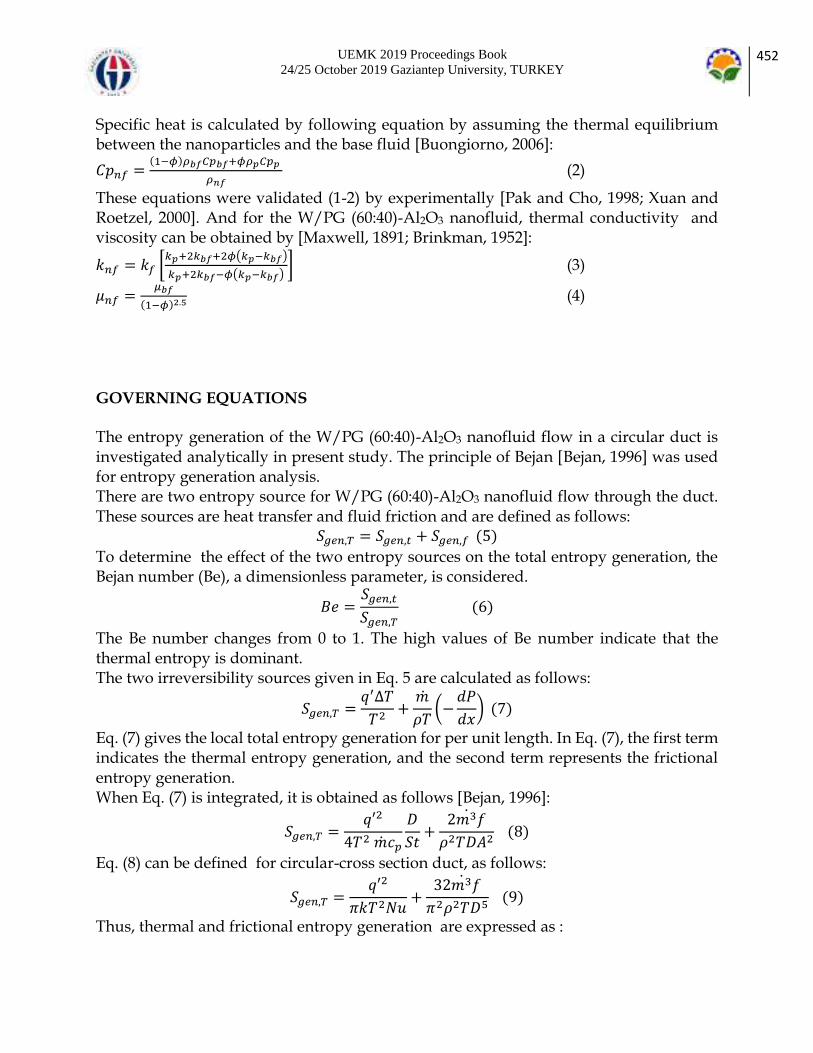
UEMK 2019 Proceedings Book 24/25 October 2019 Gaziantep University, TURKEY
452
Specific heat is calculated by following equation by assuming the thermal equilibrium between the nanoparticles and the base fluid [Buongiorno, 2006]:
𝐶𝑝𝑛𝑓 =(1−𝜙)𝜌𝑏𝑓𝐶𝑝𝑏𝑓+𝜙𝜌𝑝𝐶𝑝𝑝
𝜌𝑛𝑓 (2)
These equations were validated (1-2) by experimentally [Pak and Cho, 1998; Xuan and Roetzel, 2000]. And for the W/PG (60:40)-Al2O3 nanofluid, thermal conductivity and viscosity can be obtained by [Maxwell, 1891; Brinkman, 1952]:
𝑘𝑛𝑓 = 𝑘𝑓 [𝑘𝑝+2𝑘𝑏𝑓+2𝜙(𝑘𝑝−𝑘𝑏𝑓)
𝑘𝑝+2𝑘𝑏𝑓−𝜙(𝑘𝑝−𝑘𝑏𝑓)] (3)
𝜇𝑛𝑓 =𝜇𝑏𝑓
(1−𝜙)2.5 (4)
GOVERNING EQUATIONS The entropy generation of the W/PG (60:40)-Al2O3 nanofluid flow in a circular duct is investigated analytically in present study. The principle of Bejan [Bejan, 1996] was used for entropy generation analysis. There are two entropy source for W/PG (60:40)-Al2O3 nanofluid flow through the duct. These sources are heat transfer and fluid friction and are defined as follows:
𝑆𝑔𝑒𝑛,𝑇 = 𝑆𝑔𝑒𝑛,𝑡 + 𝑆𝑔𝑒𝑛,𝑓 (5)
To determine the effect of the two entropy sources on the total entropy generation, the Bejan number (Be), a dimensionless parameter, is considered.
𝐵𝑒 =𝑆𝑔𝑒𝑛,𝑡
𝑆𝑔𝑒𝑛,𝑇 (6)
The Be number changes from 0 to 1. The high values of Be number indicate that the thermal entropy is dominant. The two irreversibility sources given in Eq. 5 are calculated as follows:
𝑆𝑔𝑒𝑛,𝑇 =𝑞′∆𝑇
𝑇2+
𝜌𝑇(−
𝑑𝑃
𝑑𝑥) (7)
Eq. (7) gives the local total entropy generation for per unit length. In Eq. (7), the first term indicates the thermal entropy generation, and the second term represents the frictional entropy generation. When Eq. (7) is integrated, it is obtained as follows [Bejan, 1996]:
𝑆𝑔𝑒𝑛,𝑇 =𝑞′2
4𝑇2 𝑐𝑝
𝐷
𝑆𝑡+
2𝑚3 𝑓
𝜌2𝑇𝐷𝐴2 (8)
Eq. (8) can be defined for circular-cross section duct, as follows:
𝑆𝑔𝑒𝑛,𝑇 =𝑞′2
𝜋𝑘𝑇2𝑁𝑢+
32𝑚3 𝑓
𝜋2𝜌2𝑇𝐷5 (9)
Thus, thermal and frictional entropy generation are expressed as :

UEMK 2019 Proceedings Book 24/25 October 2019 Gaziantep University, TURKEY
453
𝑆𝑔𝑒𝑛,𝑡 =𝑞′2
𝜋𝑘𝑇2𝑁𝑢 (10)
𝑆𝑔𝑒𝑛,𝑓 =32𝑚3 𝑓
𝜋2𝜌2𝑇𝐷5 (11)
In Eq. (9), the mean temperature which is the average of the inlet and outlet temperatures is calculated [Moghaddami et al., 2011]. Nu number and friction factor are calculated for turbulent flow conditions. Governing equations for turbulent flow are given below. Nusselt number can be determined as follows [Gnielinski, 1976]:
𝑁𝑢 =(𝑓8)(𝑅𝑒 − 1000)𝑃𝑟
1 + 12.7 (𝑓8)
0.5
(𝑃𝑟23 − 1)
(12)
Where
𝑅𝑒 =𝑢𝐷
𝜈
(13)
𝑃𝑟 =𝜇𝐶𝑝
𝑘
(14)
𝑆𝑡 =𝑁𝑢
𝑅𝑒𝑃𝑟 (15)
The friction factor ( f ) of the fluid flow can be obtained as follows [Petukhov, 1970]: 𝑓 = (0.79𝑙𝑛𝑅𝑒 − 1.64)−2 (16) To measure the efficiency of the heat transfer augmentation technique, its performance should be compared to the original thermal system. Since present study is related to the entropy generation, the corresponding augmentation number is augmentation entropy generation number, defined as [Bejan, 1996]:
𝑁𝑠,𝑎 =𝑆𝑔𝑒𝑛,𝑎
𝑆𝑔𝑒𝑛,𝑜=
𝐸𝑛𝑡𝑟𝑜𝑝𝑦 𝑔𝑒𝑛𝑒𝑟𝑎𝑡𝑒𝑑 𝑖𝑛 𝑠𝑦𝑠𝑡𝑒𝑚 𝑤𝑖𝑡ℎ 𝑛𝑎𝑛𝑜𝑓𝑙𝑢𝑖𝑑𝑠
𝐸𝑛𝑡𝑟𝑜𝑝𝑦 𝑔𝑒𝑛𝑒𝑟𝑎𝑡𝑒𝑑 𝑖𝑛 𝑠𝑦𝑠𝑡𝑒𝑚 𝑤𝑖𝑡ℎ 𝑏𝑎𝑠𝑒𝑓𝑙𝑢𝑖𝑑𝑠 𝑜𝑛𝑙𝑦 (17)
The 𝑁𝑠,𝑎 value lower than 1 is desirable in view of thermodynamics [Bejan, 1996]. As mentioned before, present study investigates the entropy generation characteristics of various shapes of cross section ducts and effect of cross sectional-area on entropy generation was investigated for W/PG (60:40)-Al2O3 nanofluid flow. For this, the hydraulic diameters of different geometries are determined by using Table 2 [Cengel, 2003].

UEMK 2019 Proceedings Book 24/25 October 2019 Gaziantep University, TURKEY
454
RESULTS and DISCUSSIONS Entropy generation of W/PG (60:40)-Al2O3 nanofluid Fig. 2 shows that the thermal, frictional, and total entropy generation versus Re number for turbulent regimes, respectively. Fig. 2a shows that thermal entropy decreases with increasing Re number. As the Re number increases, the thermal entropy decreases because of the improvement of the heat transfer properties of pure W/PG and W/PG -Al2O3 nanofluid. Furthermore, adding Al2O3 nanoparticles to the W/PG increases the thermal conductivity, so the thermal entropy decreases. W/PG-Al2O3 nanofluid (ϕ=5%) has the lowest thermal entropy while pure W/PG has the highest thermal entropy. Fig. 2b illustrates that frictional entropy increases with increasing Re number. Because, the mass flow rate increases with increasing Re number. This causes an increase in frictional entropy. In addition, adding Al2O3 nanoparticles to the pure W/PG increases the viscosity, thus frictional entropy increases. W/PG - Al2O3 nanofluid (ϕ=5%) has the highest frictional entropy while W/PG (ϕ=0) has the lowest frictional entropy. Fig. 2c demonstrates that total entropy generation for W/PG - Al2O3 nanofluid flow for turbulent conditions. At the beginning, the total entropy decreases with the addition of Al2O3 nanoparticles, since thermal entropy is dominant. As the Re number increases, the addition of Al2O3 nanoparticles increases total entropy in order to frictional entropy is dominant. For the same reason, the total entropy decreases with the increase of the Re number at the beginning, then the total entropy increases at the higher Re numbers. The optimum Re numbers, where the entropy

UEMK 2019 Proceedings Book 24/25 October 2019 Gaziantep University, TURKEY
455
generation is minimum, are 7217(ϕ=0), 7162(ϕ=1%), 6998(3%), 6838 (5%) under turbulent regime. It is found that adding Al2O3 nanoparticles to propylene glycol -water decreases the optimum Reynolds numbers. Similar results were found by Moghaddami et al. [Moghaddami et al., 2012]. They found that adding Al2O3 nanoparticles to pure water decreases the optimum Reynolds numbers.
Fig. 2. Entropy Generation Versus Re Number (a) Thermal Entropy Generation, (b) Frictional Entropy Generation, (c) Total Entropy Generation
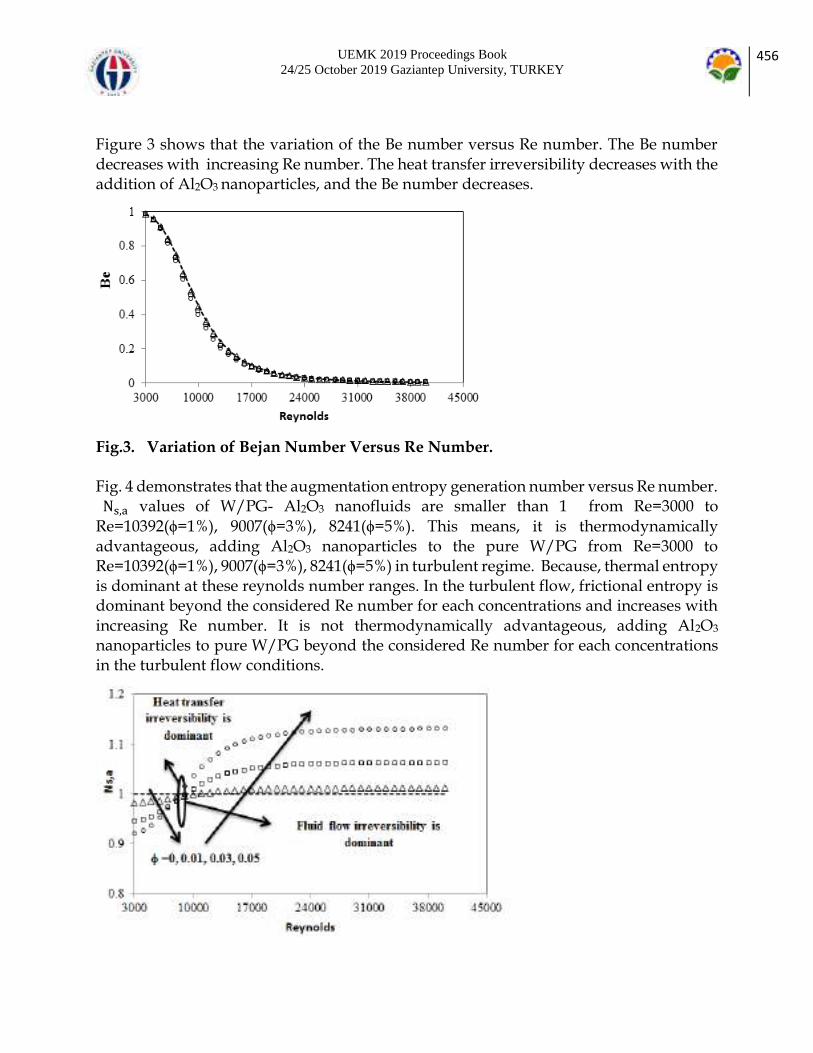
UEMK 2019 Proceedings Book 24/25 October 2019 Gaziantep University, TURKEY
456
Figure 3 shows that the variation of the Be number versus Re number. The Be number decreases with increasing Re number. The heat transfer irreversibility decreases with the addition of Al2O3 nanoparticles, and the Be number decreases.
Fig.3. Variation of Bejan Number Versus Re Number. Fig. 4 demonstrates that the augmentation entropy generation number versus Re number. Ns,a values of W/PG- Al2O3 nanofluids are smaller than 1 from Re=3000 to Re=10392(ϕ=1%), 9007(ϕ=3%), 8241(ϕ=5%). This means, it is thermodynamically advantageous, adding Al2O3 nanoparticles to the pure W/PG from Re=3000 to Re=10392(ϕ=1%), 9007(ϕ=3%), 8241(ϕ=5%) in turbulent regime. Because, thermal entropy is dominant at these reynolds number ranges. In the turbulent flow, frictional entropy is dominant beyond the considered Re number for each concentrations and increases with increasing Re number. It is not thermodynamically advantageous, adding Al2O3
nanoparticles to pure W/PG beyond the considered Re number for each concentrations in the turbulent flow conditions.
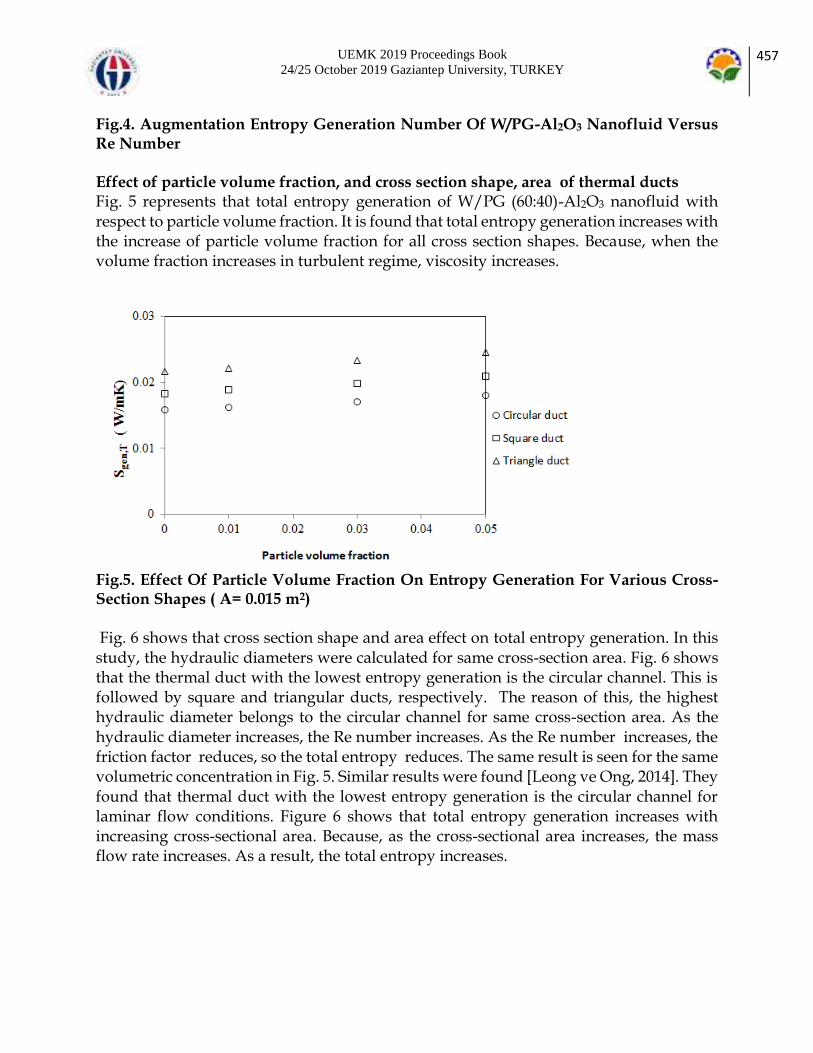
UEMK 2019 Proceedings Book 24/25 October 2019 Gaziantep University, TURKEY
457
Fig.4. Augmentation Entropy Generation Number Of W/PG-Al2O3 Nanofluid Versus Re Number Effect of particle volume fraction, and cross section shape, area of thermal ducts Fig. 5 represents that total entropy generation of W/PG (60:40)-Al2O3 nanofluid with respect to particle volume fraction. It is found that total entropy generation increases with the increase of particle volume fraction for all cross section shapes. Because, when the volume fraction increases in turbulent regime, viscosity increases.
Fig.5. Effect Of Particle Volume Fraction On Entropy Generation For Various Cross-Section Shapes ( A= 0.015 m2) Fig. 6 shows that cross section shape and area effect on total entropy generation. In this study, the hydraulic diameters were calculated for same cross-section area. Fig. 6 shows that the thermal duct with the lowest entropy generation is the circular channel. This is followed by square and triangular ducts, respectively. The reason of this, the highest hydraulic diameter belongs to the circular channel for same cross-section area. As the hydraulic diameter increases, the Re number increases. As the Re number increases, the friction factor reduces, so the total entropy reduces. The same result is seen for the same volumetric concentration in Fig. 5. Similar results were found [Leong ve Ong, 2014]. They found that thermal duct with the lowest entropy generation is the circular channel for laminar flow conditions. Figure 6 shows that total entropy generation increases with increasing cross-sectional area. Because, as the cross-sectional area increases, the mass flow rate increases. As a result, the total entropy increases.

UEMK 2019 Proceedings Book 24/25 October 2019 Gaziantep University, TURKEY
458
Fig.6. Effect Of Cross Sectional Area On Entropy Generation For Various Cross Sectional Shapes (ϕ=5%) Comparison of entropy generation for W/EG and W/PG fluid flow Fig.7. shows that total entropy generation of W/EG and W/PG fluid flow for turbulent flow. In both fluid flow, initially the total entropy decreases and then increases. The entropy generation of W/PG fluid flow is higher than W/EG fluid flow. Because, thermal conductivity of PG is lower than EG, and viscosity of PG is higher than EG, thermal properties of PG are worse than EG. The frictional entropy is dominant for high Re numbers. In order to W / PG' s higher viscosity, the entropy generation of W / PG flow more increases. If it is desired to use PG as antifreeze, the thermal properties of the W / PG mixture can be improved by reducing the volumetric concentration of PG. Fig. 7 shows that in the case of using 30% PG or 40% EG is used as antifreeze, the entropy generation are almost the same for water mixture.
Fig. 7. Comparison Of Entropy Generation For W/PG And W/EG Fluid Flow
UEMK 2019 Proceedings Book 24/25 October 2019 Gaziantep University, TURKEY
459
CONCLUSION In present study, W/PG (60:40)-Al2O3 nanofluid flow entropy generation in a circular cross-section thermal duct under turbulent regime and constant uniform heat flux was analytically investigated. In addition, this study investigates the entropy generation characteristics of various particle volume fraction and cross section shape and area for W/PG (60:40)-Al2O3 nanofluid flow. Furthermore, thermodynamic performance of W/PG and W/EG fluid flow was compared. Whether the addition of Al2O3nanoparticles in turbulent flow is thermodynamically advantageous depends on the Re number and the volumetric concentration of Al2O3
nanoparticles. Ns,a values of W/PG- Al2O3 nanofluids are smaller than 1 from Re=3000 to Re=10392(ϕ=1%), 9007(ϕ=3%), 8241(ϕ=5%). It is not thermodynamically advantageous to add Al2O3 nanoparticles to pure W/PG beyond the considered Re number for each concentrations in the turbulent regime. The optimum Re numbers, where the entropy generation is minimum, are 7217(ϕ=0), 7162(ϕ=1%), 6998(3%), 6838 (5%) for turbulent flow regime. It is shown that adding Al2O nanoparticles to propylene glycol-water mixture decreases the optimum Reynolds numbers. The thermal ducts are ranked in order from lowest to highest entropy generation: circular, square, triangle. Total entropy generation increases with the increasing cross-sectional area. The entropy generation of W/PG fluid flow is higher than W/EG fluid flow. In the case of using 30% PG or 40% EG as antifreeze, the entropy generation are almost the same for water-glycol mixture. REFERENCES Anand, V. (2015). Entropy generation analysis of laminar flow of a nanofluid in a circular tube immersed in an isothermal external fluid. Energy 93, 154-164. ASHRAE Handbook – Fundamentals (SI edition), (2009). Atlanta: American Society of Heating, Refrigerating and Air-Conditioning Engineers Inc. Bejan, A. (1996). Entropy Generation Minimization. Boca Taron: CRC Press. Bianco, V., Manca, O., Nardini, S. (2014). Entropy generation analysis of turbulent convection flow of Al2O3–water nanofluid in a circular tube subjected to constant wall heat flux. Energy Convers. Manage. 77, 306–314. Bianco, V., Nardini, S., Manca, O. (2011). Enhancement of heat transfer and entropy generation analysis of nanofluids turbulent convection flow in square section tubes. Nanoscale Res. Lett. 6, 252.

UEMK 2019 Proceedings Book 24/25 October 2019 Gaziantep University, TURKEY
460
Brinkman, H.C. (1952). The viscosity of concentrated suspensions and solutions. The Journal of Chemical Physics, 20, 571–581. Buongiorno, J. (2006). Convective transport in nanofluids. ASME J. Heat Transfer 128, 240–250. Cengel, Y.A. (2003). Heat Transfer: A Practical Approach. New York: McGraw- Hill. Das, S.K., Putra, N., Thiesen, P., Roetzel, W. (2003). Temperature dependence of thermal conductivity enhancement of nanofluids. Trans. ASME, J. Heat Transfer 125, 567–574. Ethylene Glycol and Propylene Glycol Toxicity, Public Health Service, U.S. Department of Health and Human Services, Public Health Service in Atlanta, GA. Retrieved from https://www.atsdr.cdc.gov/csem/csem.asp?csem=12&po=2. Gnielinski, V. (1976). New equations for heat and mass transfer in turbulent pipe flow and channel flow. Int. Chem. Eng. 16, 359–368. Jankowski, T.A. (2009). Minimizing entropy generation in internal flows by adjusting the shape of the cross-section. International Journal of Heat and Mass Transfer 52, 3439–3445. Jarungthammachote, S. (2010). Entropy generation analysis for fully developed laminar convection in hexagonal duct subjected to constant heat flux. Energy 35, 5374–5379. Kim, H., Ham, J., Park, C. Cho, H. (2016). Theoretical investigation of the efficiency of a U-tube solar collector using various nanofluids. Energy 94, 497–507. Leong, K.Y., Ong, H.C. (2014). Entropy generation analysis of nanofluids flow in various shapes of cross section ducts. Int. Commun. Heat Mass 57, 72–78. Manikandan, S., Rajan, K.S. (2016). Sand-propylene glycol-water nanofluids for improved solar energy collection. Energy 113, 917-929. Maxwell, J.C. (1891). A Treatise on Electricity and Magnetism. UK: Clarendon Press. Moghaddami, M., Shahidi, S.E., Siavashi, M. (2012). Entropy generation analysis of nanofluid flow in turbulent and laminar regimes. J. Comput. Theor. Nanosci. 9, 1–10. Moghaddami, M., Mohammadzade, A., Varzane Esfehani, S.A. (2011). Second law analysis of nanofluid flow. Energy Convers. Manage. 52, 1397–1405. Naik, M.T., Sundar, L.S. (2014). Heat transfer and friction factor with water/propylene glycol-based CuO nanofluid in circular tube with helical inserts under transition flow regime. Heat Transfer Eng. 35,53–62. Oztop, H.F. (2005). Effective parameters on second law analysis for semicircular ducts in laminar flow and constant wall heat flux. Int. Comm. Heat Mass Transfer 32, 266–274. Pak, B.C., Cho, Y.I. (1998). Hydrodynamic and heat transfer study of dispersed fluids with submicron metallic oxide particles. Exp. Heat Transfer 11,151– 170. Petukhov, B.S. (1970). Heat transfer in turbulent pipe flow with variable physical properties. in: J.P. Harnett (Ed.), Advances in Heat Transfer, vol. 6, Academic Press, New York, 504–564. Prabhakaran, M., Manikandan, S., Suganthi, K.S., Vinodhan, V.L., Rajan, K.S. (2016). Development and assessment of ceria–propylene glycol nanofluid as an alternative to propylene glycol for cooling applications. Applied Thermal Engineering 102, 329-335. Sahin, A.Z. (1998). Irreversibilities in various duct geometries with constant wall heat flux and laminar flow. Energy 23, 465-473.

UEMK 2019 Proceedings Book 24/25 October 2019 Gaziantep University, TURKEY
461
Singh, P.K., Anoop, K.B., Sundararajan, T., Das, S.K. (2010). Entropy generation due to flow and heat transfer in nanofluids. Int. J. Heat Mass Transfer, 53, 4757– 4767. Xuan, Y., Roetzel, W. (2000). Conceptions for heat transfer correlation of nanofluids. International Journal of Heat and Mass Transfer 43, 3701–3708.


