20
Assessment of health facility data quality Data quality report card Uganda, 2010–2011
Assessment
of health facility data quality
Data quality report card
Uganda, 2010–2011

This report was prepared by the Department of Health Statistics and Information Systems (HSI), WHO, Geneva, in close
collaboration with the Resource Centre and Quality Assurance Department of the Uganda Ministry of Health, and the
Uganda WHO country office.
Published in Geneva, December 2011.

Assessment of health facility data quality: Data quality report card – Uganda, 2010–2011 3
Table of contents
Executive summary .............................................................................................................................. 6
Introduction ........................................................................................................................................... 8
Completeness of reporting (indicators 1-3) ..................................................................................... 9
Indicator 1: Completeness of district reporting ......................................................................................... 9
Indicator 2: Completeness of facility reporting.......................................................................................... 9
Indicator 3: Missing data in district reporting .......................................................................................... 10
Accuracy and consistency of reporting (indicator 4-9) ................................................................ 11
Indicator 4: Accuracy of event reporting (moderate/extreme outliers) .................................................. 11
Indicator 5: Accuracy of reporting ........................................................................................................... 11
Indicator 6: External verification of consistency ...................................................................................... 12
Indicator 7: Consistency over time........................................................................................................... 12
Indicator 8: Consistency between indicator values ................................................................................. 12
Indicator 9: Population denominator consistency ................................................................................... 14
External comparison (indicators 10-12) .......................................................................................... 15
Indicator 10: External comparison with values derived from household surveys–antenatal care
coverage (first visit) ................................................................................................................................... 15
Indicators 11 and 12: External comparison with survey–DTP3, institutional deliveries and 4 or more
antenatal visits .......................................................................................................................................... 16
District league table inclusion criteria ............................................................................................ 18

4 Assessment of health facility data quality: Data quality report card – Uganda, 2010–2011
List of tables
Table 1: District monthly reporting completeness rate and districts with poor completeness rate ............. 9
Table 2: Facility reporting completeness rate and districts with poor completeness rate ............................ 9
Table 3: Missing and zero values in monthly reports for 2008–2009 and 2010–2011
for 4 indicators .............................................................................................................................................. 10
Table 4: Extreme and moderate outliers among data points for 2008–2009 and 2010–2011
for 4 indicators .............................................................................................................................................. 11
Table 5: Percentage difference between monthly data and end-of-year data at the national level, and
districts with a large discrepancy .................................................................................................................. 11
Table 6: Consistency ratio between DTP3 and ANC1 at national level, and districts with poor consistency
(more than 33% above or below national ratio). .......................................................................................... 13
Table 7: Consistency ratio for ANC1 at national level, and districts with very low and very high
consistency ratios .......................................................................................................................................... 15
Table 8: Comparison of coverage rates from surveys and from facility reports .......................................... 16
Table 9: Districts with poor data quality, Uganda 2010–2011 ..................................................................... 18
Table 10: Top 15 districts in league table ..................................................................................................... 18
Table 11: Bottom 15 districts in league table ............................................................................................... 18
List of figures
Figure 1: Consistency between DTP3 and ANC1 coverage for 2010–2011 .................................................. 13
Figure 2: ANC1 consistency ratios for all districts. ....................................................................................... 16
Figure 3. Trend in DTP3 coverage under 1 year of age (%), Uganda 2000-2010. ......................................... 17
Figure 4: Comparison of HMIS and DHS coverage rates for institutional deliveries and ANC4+. ................. 17
Assessment of health facility data quality: Data quality report card – Uganda, 2010–2011 5
Abbreviations
ANC Antenatal care
ANC1 Antenatal care first visit
ANC4+ Four or more antenatal care visits
CBR Crude birth rate
DHS Demographic and Health Survey
DTP Diphtheria-tetanus-pertussis vaccine
DTP1 Diphtheria-tetanus-pertussis vaccine – first dose
DTP3 Diphtheria-tetanus-pertussis vaccine – third dose
HMIS Health Management Information system
IPT2 Intermittent Presumptive Treatment – second dose
OPD Outpatient Department
SD Standard deviation
UBOS Uganda Bureau of Statistics
UNPD United Nations Population Division

6 Assessment of health facility data quality: Data quality report card – Uganda, 2010–2011
Executive summary
Health facility data are a critical input into assessing national progress and performance on an annual
basis and they provide the basis for subnational / district performance assessment. This report assesses
the quality of Uganda’s health facility data collected through the Health Management Information System
(HMIS) for the period July 2010 to June 2011. The assessment focuses on three dimensions of quality–
completeness, including timeliness; accuracy and consistency; and verification against independent,
external sources of data. Within each dimension, several indicators are used to track progress, with a total
of twelve indicators used to assess the quality of the facility data generated by the HMIS, for both national
level and for districts. Each indicator is calculated for two periods, 2010-11 and 2008-9.
At the national level, it can cautiously be concluded that the health facility reporting produces data of
good1 quality for most indicators of intervention coverage:
• Completeness of reporting is good (indicators 1 and 2);
• Accuracy of reporting is only partly adequate (indicators 3-6, too many missing values and outliers
and too often a substantial discrepancy between the annual totals and the sum of the monthly
reports);
• No independent external verification was done in 2011 (indicator 7);
• National population projections for the denominators appear good (indicators 8 and 9);
• External data verification for DTP3 (Diphtheria-tetanus-pertussis vaccine) and deliveries gives good
results for previous years but no comparison could be done for recent years (indicator 10 and 11).
For the assessment of performance in the 112 districts (up from 80 in the preceding year) the data
quality assessment shows that the intervention coverage estimates are often poor, and are likely to lead
to incorrect rankings for at least one third of districts:
• Completeness of district reporting is poor in 9% of districts and completeness of health facility
reporting is problematic for one-third of the districts (indicators 1 and 2);
• Accuracy of reporting is only partly adequate, with 18% of the district reports zero or missing, 7% of
the districts having extreme outliers, and 9% of the districts having major differences between the
annual total and the sum of the monthly reports (indicators 3-6);
• District population projections for the denominators in 2010/2011 are estimated to be off by more
than one-third for 22% of districts (indicator 8).
Overall, the assessment shows that the data quality in 2010/2011 was somewhat lower than in 2008/09.
Overall, only 71 of the 112 districts (63%) meet the quality criteria for inclusion in the ranking tables.
1 The qualitative summary of the information uses the following scale: excellent, good, partly adequate, poor, very poor, to
summarize the quality indicators.

Assessment of health facility data quality: Data quality report card – Uganda, 2010–2011 7
Indicator Definition
National
DQ Score
% of districts
with poor DQ
score
2009 2011 2009 2011
COMPLETENESS
1 Completeness of district
reporting
% of monthly district reports received 98% 94% 3%[1]
9%[1]
2 Completeness of facility
reporting
% of expected monthly facility reports
received
92% 85% 9%[2]
33%[2]
3 Missing data in district
reports
% of monthly district reports that are not
zero/missing values (average for 4 indicators:
ANC1, DTP3, deliveries, OPD)
97% 88% 4%[3]
18%[3]
ACCURACY AND CONSISTENCY
4 Accuracy of event reporting:
outliers in the current year
% of district values that are moderate /
extreme outliers (2 SD/3 SD or more from
mean) (average for 4 indicators)
4.2%/
0.3%
3.0%/
0.2%
27%[4]
/ 8%[5]
12%
[4]
/7%[5]
5 Accuracy of event reporting:
monthly - annual differences
% difference between monthly reports and
end-of-year report (average for 4 indicators)
NA 11% NA 9%[6]
6 Verification of consistency % of agreement between data in sampled
facility records and national records for the
same facilities for 3 core indicators
Assessment not
done (last one
2008)
NA
7 Consistency over time % deviation from the average of previous 3
years (average for 4 indicators)
NA NA NA[7]
NA[7]
8 Internal consistency
between indicators
DTP 1(3) coverage based on facility reports
divided by ANC1 coverage based on facility
reports
0.94 0.97 19%[8]
21%[8]
9 Consistency of population
projection (UN)
UBOS projection number of live births divided
by UN projection based live births
1.04 1.04 NA
EXTERNAL COMPARISON
10 External comparison: of
ANC1
ANC1 coverage based on facility reports
divided by survey coverage rate
1.01 1.01 21%[9]
22%[9]
11 External comparison: DTP3 Coverage from facility reports divided §by
survey for the most recent comparable year
(2007)[9]
1.07 1.14 NA
12 External comparison:
Institutional deliveries
Coverage from facility reports divided by
survey for the most recent comparable year
(2005)[9]
0.83 0.95 NA
[1] % of districts with less than 80% completeness of monthly reporting;
[2] % of districts with monthly facility reporting rates below 80%;
[3] % of districts with more than 20% zero values;
[4] % of districts with at least 5% of the values that are moderate or worse outliers (+/-2 standard deviations);
[5] % of districts in which at least one of the monthly district values are extreme outliers in any of the 4 indicators (+/-3
standard deviations from the district mean); [6]
% of districts with at least 33% difference between district monthly reported values and end-of-year totals; [7]
% of districts with at least 33% difference between the current year and the previous 3 years [8]
% of districts with at least 33% difference with the national ratio of DTP3 to antenatal care first visit (ANC1) coverage; [9]
% of districts with at least 33% off the expected ANC1 coverage. [9]
Most recent survey year was used for the comparison. If there is a significant gap between the year of survey and year of
HMIS data, the two data points may not be directly comparable.

8 Assessment of health facility data quality: Data quality report card – Uganda, 2010–2011
Introduction
Quality data on health sector performance should be available on a regular, preferably annual basis.
Population-based surveys are conducted only periodically, usually once every 3-5 years, and collect
retrospective information. Thus surveys are generally not a reliable reflection of the current health
situation. By contrast, health facility data are collected and aggregated on a continuing basis and have the
potential to present a more up-to-date picture.
All health data are imperfect in some way. Data quality assessment should always be undertaken to
understand how much confidence can be placed in the health data reported. Population-based surveys
use standard methods to assess data quality and make adjustments as needed to address problems of
bias or missing values. All such adjustments are carefully documented. Such rigorous quality control
mechanisms are rarely applied to routinely-collected administrative and health facility data. Yet these
data are often the basis for annual monitoring; decision makers using them need assurance of their
reliability and soundness.
In practice, HMIS data have a number of limitations and quality problems, such as missing values, bias,
and computation errors. Furthermore, when HMIS data are used to estimate population coverage rates,
assumptions have to be made about the relevant denominators or target populations. These assumptions
are often prone to errors. This report card describes the quality of the HMIS health facility data in Uganda
for 2010–2011 compared with 2008/09. This is a particular challenge due to the increase in the number of
districts that occurred between the two time periods, the number rising from 80 in 2008–2009 to 112 in
2010–2011. Based on its assessment of data completeness and quality, the report discusses the quality of
national coverage estimates and district rankings derived from the HMIS.
The assessment of HMIS data quality focuses on three dimensions–completeness; accuracy and
consistency; and validation against independent external sources of data. Within each dimension, several
indicators are used to track progress.
Assessment of health facility data quality: Data quality report card – Uganda, 2010–2011 9
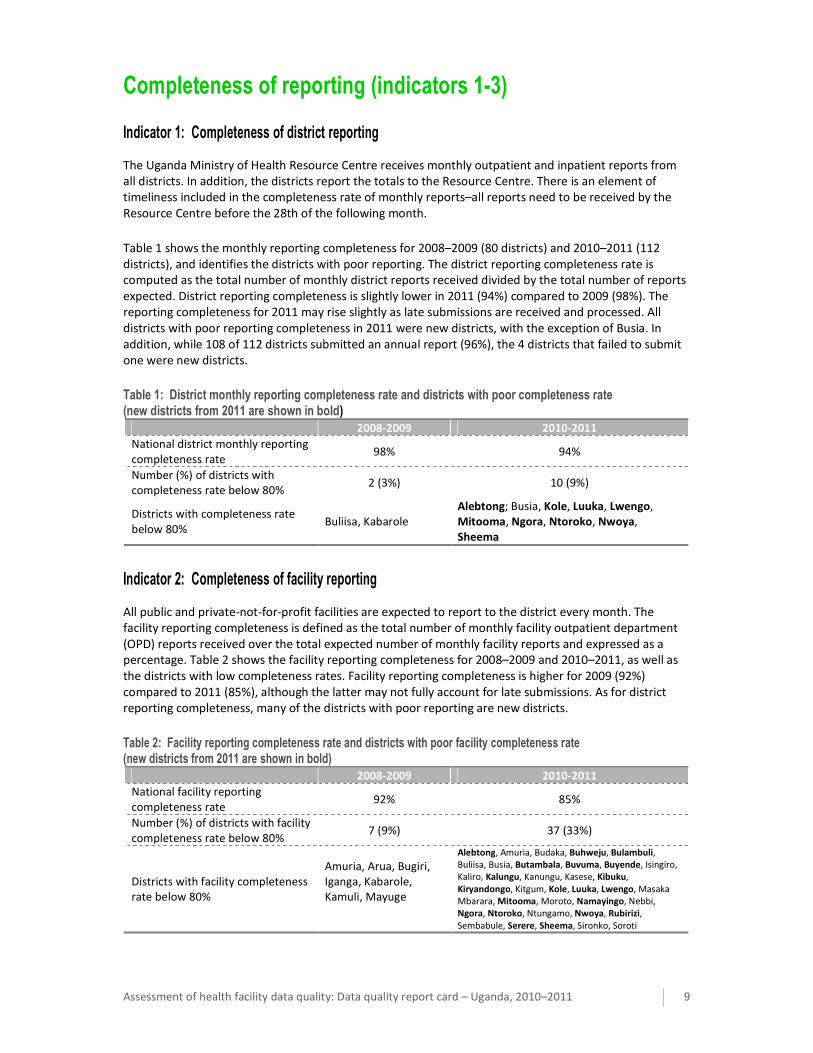
Completeness of reporting (indicators 1-3)
Indicator 1: Completeness of district reporting
The Uganda Ministry of Health Resource Centre receives monthly outpatient and inpatient reports from
all districts. In addition, the districts report the totals to the Resource Centre. There is an element of
timeliness included in the completeness rate of monthly reports–all reports need to be received by the
Resource Centre before the 28th of the following month.
Table 1 shows the monthly reporting completeness for 2008–2009 (80 districts) and 2010–2011 (112
districts), and identifies the districts with poor reporting. The district reporting completeness rate is
computed as the total number of monthly district reports received divided by the total number of reports
expected. District reporting completeness is slightly lower in 2011 (94%) compared to 2009 (98%). The
reporting completeness for 2011 may rise slightly as late submissions are received and processed. All
districts with poor reporting completeness in 2011 were new districts, with the exception of Busia. In
addition, while 108 of 112 districts submitted an annual report (96%), the 4 districts that failed to submit
one were new districts.
Table 1: District monthly reporting completeness rate and districts with poor completeness rate (new districts from 2011 are shown in bold)
2008-2009 2010-2011
National district monthly reporting
completeness rate 98% 94%
Number (%) of districts with
completeness rate below 80% 2 (3%) 10 (9%)
Districts with completeness rate
below 80% Buliisa, Kabarole
Alebtong; Busia, Kole, Luuka, Lwengo,
Mitooma, Ngora, Ntoroko, Nwoya,
Sheema
Indicator 2: Completeness of facility reporting
All public and private-not-for-profit facilities are expected to report to the district every month. The
facility reporting completeness is defined as the total number of monthly facility outpatient department
(OPD) reports received over the total expected number of monthly facility reports and expressed as a
percentage. Table 2 shows the facility reporting completeness for 2008–2009 and 2010–2011, as well as
the districts with low completeness rates. Facility reporting completeness is higher for 2009 (92%)
compared to 2011 (85%), although the latter may not fully account for late submissions. As for district
reporting completeness, many of the districts with poor reporting are new districts.
Table 2: Facility reporting completeness rate and districts with poor facility completeness rate (new districts from 2011 are shown in bold)
2008-2009 2010-2011
National facility reporting
completeness rate 92% 85%
Number (%) of districts with facility
completeness rate below 80% 7 (9%) 37 (33%)
Districts with facility completeness
rate below 80%
Amuria, Arua, Bugiri,
Iganga, Kabarole,
Kamuli, Mayuge
Alebtong, Amuria, Budaka, Buhweju, Bulambuli,
Buliisa, Busia, Butambala, Buvuma, Buyende, Isingiro,
Kaliro, Kalungu, Kanungu, Kasese, Kibuku,
Kiryandongo, Kitgum, Kole, Luuka, Lwengo, Masaka
Mbarara, Mitooma, Moroto, Namayingo, Nebbi,
Ngora, Ntoroko, Ntungamo, Nwoya, Rubirizi,
Sembabule, Serere, Sheema, Sironko, Soroti

10 Assessment of health facility data quality: Data quality report card – Uganda, 2010–2011
Indicator 3: Missing data in district reporting
Missing data are an indicator of the extent to which facility and district reports include all reportable
events. Missing data should be clearly differentiated from true zero values in district and facility reports. A
true zero value indicates that no reportable events occurred that month; a missing value indicates that
reportable events occurred but were not actually reported. In many HMIS reports, missing entries are
assigned a value of 0, making it impossible to distinguish between a true zero value (no events occurred)
from a missing value (events occurred but were not reported). In the 2008-9 monthly district report,
missing monthly reports were given blanks, whereas in the 2010-11 report they were given a zero value.
In 2010-11, approximately 12% of the monthly reports were zero or missing values, compared with only
3% in 2008-9. In 2009, 22 districts (28%) had at least one missing or zero value in their monthly reports,
compared with 68 districts (61%) in 2011. In 2009, 4% of districts had 20% or more missing values
compared with 18% in 2011.
Table 3: Missing and zero values in monthly reports for 2008–2009 and 2010–2011 for 4 indicators
Number (%) of data points with missing or zero value
2008-2009
(80 districts)
2010-2011
(112 districts)
ANC1 32/960 (3%) 155/1344 (12%)
DTP3 16/960 (2%) 158/1344 (12%)
Institutional deliveries 33/960 (3%) 160/1344 (12%)
OPD 26/960 (3%) 149/1344 (11%)
Total 107/3880 (3%) 622/5376 (12%)
(Total data points = 12 x Number of districts)
Assessment of health facility data quality: Data quality report card – Uganda, 2010–2011 11
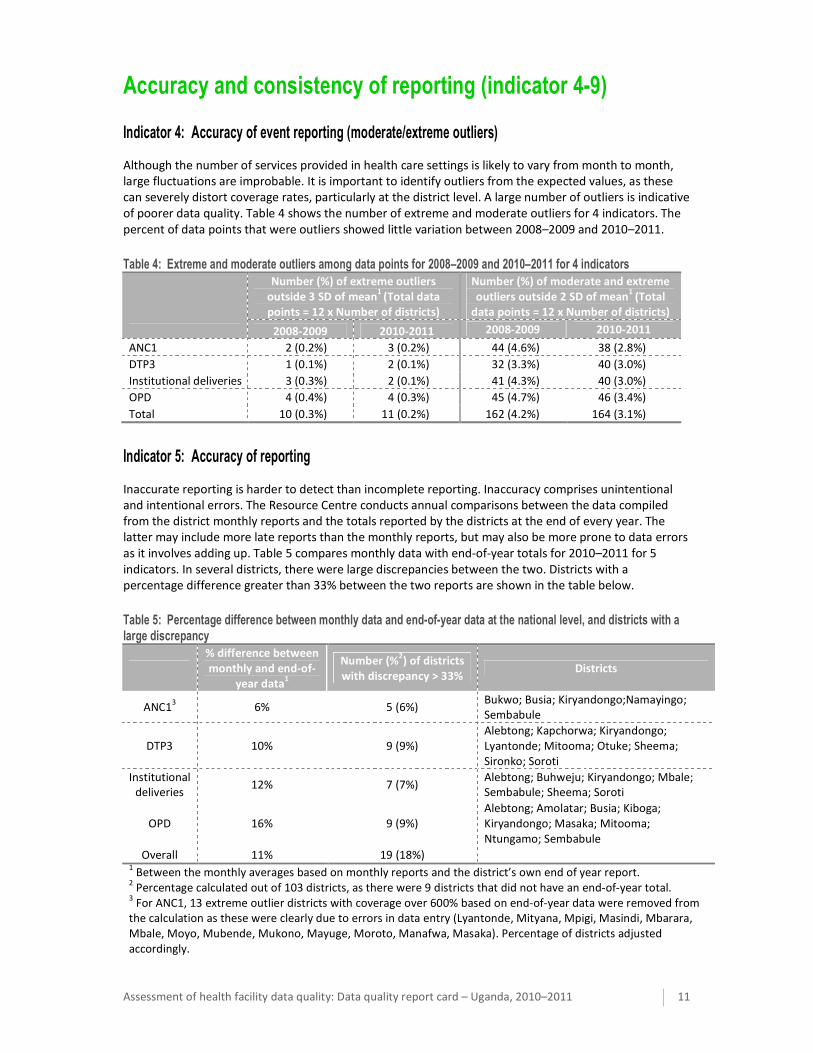
Accuracy and consistency of reporting (indicator 4-9)
Indicator 4: Accuracy of event reporting (moderate/extreme outliers)
Although the number of services provided in health care settings is likely to vary from month to month,
large fluctuations are improbable. It is important to identify outliers from the expected values, as these
can severely distort coverage rates, particularly at the district level. A large number of outliers is indicative
of poorer data quality. Table 4 shows the number of extreme and moderate outliers for 4 indicators. The
percent of data points that were outliers showed little variation between 2008–2009 and 2010–2011.
Table 4: Extreme and moderate outliers among data points for 2008–2009 and 2010–2011 for 4 indicators
Number (%) of extreme outliers
outside 3 SD of mean1
(Total data
points = 12 x Number of districts)
Number (%) of moderate and extreme
outliers outside 2 SD of mean1
(Total
data points = 12 x Number of districts)
2008-2009 2010-2011 2008-2009 2010-2011
ANC1 2 (0.2%) 3 (0.2%) 44 (4.6%) 38 (2.8%)
DTP3 1 (0.1%) 2 (0.1%) 32 (3.3%) 40 (3.0%)
Institutional deliveries 3 (0.3%) 2 (0.1%) 41 (4.3%) 40 (3.0%)
OPD 4 (0.4%) 4 (0.3%) 45 (4.7%) 46 (3.4%)
Total 10 (0.3%) 11 (0.2%) 162 (4.2%) 164 (3.1%)
Indicator 5: Accuracy of reporting
Inaccurate reporting is harder to detect than incomplete reporting. Inaccuracy comprises unintentional
and intentional errors. The Resource Centre conducts annual comparisons between the data compiled
from the district monthly reports and the totals reported by the districts at the end of every year. The
latter may include more late reports than the monthly reports, but may also be more prone to data errors
as it involves adding up. Table 5 compares monthly data with end-of-year totals for 2010–2011 for 5
indicators. In several districts, there were large discrepancies between the two. Districts with a
percentage difference greater than 33% between the two reports are shown in the table below.
Table 5: Percentage difference between monthly data and end-of-year data at the national level, and districts with a large discrepancy
% difference between
monthly and end-of-
year data1
Number (%2) of districts
with discrepancy > 33% Districts
ANC13
6% 5 (6%) Bukwo; Busia; Kiryandongo;Namayingo;
Sembabule
DTP3 10% 9 (9%)
Alebtong; Kapchorwa; Kiryandongo;
Lyantonde; Mitooma; Otuke; Sheema;
Sironko; Soroti
Institutional
deliveries 12% 7 (7%)
Alebtong; Buhweju; Kiryandongo; Mbale;
Sembabule; Sheema; Soroti
OPD 16% 9 (9%)
Alebtong; Amolatar; Busia; Kiboga;
Kiryandongo; Masaka; Mitooma;
Ntungamo; Sembabule
Overall 11% 19 (18%) 1 Between the monthly averages based on monthly reports and the district’s own end of year report.
2 Percentage calculated out of 103 districts, as there were 9 districts that did not have an end-of-year total.
3 For ANC1, 13 extreme outlier districts with coverage over 600% based on end-of-year data were removed from
the calculation as these were clearly due to errors in data entry (Lyantonde, Mityana, Mpigi, Masindi, Mbarara,
Mbale, Moyo, Mubende, Mukono, Mayuge, Moroto, Manafwa, Masaka). Percentage of districts adjusted
accordingly.

12 Assessment of health facility data quality: Data quality report card – Uganda, 2010–2011
According to the Uganda Resource Centre, the end-of-year totals from the district annual reports are
more accurate than totals from the district monthly reports, because the end-of-year totals take into
account under-reporting and late reports that were not included in the monthly totals. A clean data set
for antenatal care first visit (ANC1) was constructed, consisting of end-of-year figures for most districts.
Districts that had large discrepancies between the end-of-year and monthly figures were examined
individually, and the monthly data were substituted where they were deemed to be more plausible (e.g.
ANC1 coverage based on end-of-year data was over 500%). In addition, nine districts were missing an end-
of-year total for ANC1, for which the monthly data were used. There were a total of 24 districts for which
monthly data were substituted for end-of-year figures. For these 24 districts, missing monthly reports
were filled in with the mean of the non-zero months. The cleaned ANC1 data set yielded a national ANC1
coverage rate of 95%.
Indicator 6: External verification of consistency
No data verification exercise was conducted for 2010-11 to check the consistency of event reporting
between the facility and national levels. The most recent data verification exercise was conducted in 2008
by the Resource Centre2. A comparison was conducted between the national level and facility data in all
80 districts for 3 monthly reports during the preceding year. The data verification exercise established
that the national level coverage rates were too high for both Intermittent Presumptive Treatment (IPT2)
(ratio facility / national data was .95) and DTP3 (.92) and too low for deliveries in health units (1.04).
Overall, however, these errors are relatively small and indicate good reporting.
Indicator 7: Consistency over time
This indicator shows the consistency of the values for key indicators in the most recent year compared
with the previous three years. While some differences are to be expected, very large changes are likely to
be due to reporting errors. This assessment was not done for Uganda 2010-11 as the required data were
not available at the time of this analysis
Indicator 8: Consistency between indicator values
As high priority health interventions with a high level of continuity of care, ANC1 and DTP33 coverage
rates are expected to show a high degree of correlation: Both should be high and stable across all districts.
A large discrepancy between the ANC1 and DTP3 coverage rates is indicative of errors in reporting and
problems with data quality.
The indicator used is the consistency of the ratio between DTP3 and ANC1, that is, the DTP3 coverage rate
divided by the ANC1 coverage rate, both based on facility reports. At the national level, ANC1 and DTP3
coverage based on facility reports for 2010-11 are 94.5% and 91.3% respectively, yielding a DTP3/ANC1
consistency ratio of 0.97.
At the district level, there is considerably more variation. Figure 1 shows a scatterplot of DTP3 and ANC1
coverage for all districts. The solid line shows the national DTP3/ANC1 consistency ratio, and the dotted
lines show a deviation (relative difference) of 33% from the national ratio.
2 Ministry of Health. Report of the data validation exercise. Kampala. October 2008.
3 DTP1 is the preferred indicator but no data were available at the time of this analysis.

Assessment of health facility data quality: Data quality report card – Uganda, 2010–2011 13
Figure 1: Consistency between DTP3 and ANC1 coverage for 2010–2011 (solid line indicates the ratio of national DTP3 and ANC1 coverage–dashed lines indicate 33% relative difference from the national ratio)
There were 5 districts that had a much lower DTP3 coverage rate than ANC1 coverage, and 19 districts
that had a much higher DTP3 coverage rate than ANC1 coverage (see Table 6).
Table 6: Consistency ratio between DTP3 and ANC1 at national level, and districts with poor consistency (more than 33% above or below national ratio)
2008-2009
(80 districts)
2010-2011
(112 districts)
National DTP3/ANC1 consistency ratio 0.94 0.97
Districts with consistency ratio 33%
above national ratio (DTP3 too high)
12 (15%)
Amuria; Bududa; Kaabong;
Kiruhura; Koboko; Manafwa;
Masaka; Moroto; Nakapiripirit;
Oyam; Sironko; Wakiso
19 (17%)
Amolatar; Amudat; Bududa;
Bukedea; Bukomansimbi;
Buvuma; Gomba; Kaabong;
Kalangala; Kalungu; Koboko;
Kotido; Kyankwanzi; Luuka;
Manafwa; Napak; Rubirizi;
Soroti; Wakiso
Districts with consistency ratio 33%
below national ratio (DTP3 too low)
3 (4%)
Gulu; Kaliro; Lyantonde
5 (4%)
Busia; Kyegegwa; Lyantonde;
Sheema; Sironko

14 Assessment of health facility data quality: Data quality report card – Uganda, 2010–2011
Indicator 9: Population denominator consistency
Several districts had coverage rates for indicators such as DTP3 of over 100%, which is indicative of an
inaccurate denominator (assuming that the numerator is correct). District populations in Uganda are
estimated based on projections from the 2002 census, and may not sufficiently account for migration
between districts. Also district health services may attract clients from other districts and serve a larger
catchment population than that living within the district boundaries. The denominators based on the
Uganda Bureau of Statistics (UBOS) national population projections can be compared with denominators
derived from UN projections and internal consistency checks. The higher the level of consistency between
denominators from different (reliable) sources, the more confidence can be placed in the accuracy of the
population projections.
Alternative source for the denominator–number of live births: An alternative estimate for the number of
live births can be computed using the most recent crude birth rate estimate from the UN Population
Division. UBOS estimates live births to be 4.85% of the total population; Crude birth rate (CBR) from the
United Nations Population Division (UNPD) for 2005-2010 is 46.3 per 1000.
Population Consistency ratio (UN): The estimated number of live births from UBOS divided by the
estimated number of live births using UNPD CBR The population consistency ratio (UN) is 1.04, indicating
good consistency, with a slightly higher population projection by UBOS and a small underestimation of
coverage rates if the UN estimates were true.

Assessment of health facility data quality: Data quality report card – Uganda, 2010–2011 15
External comparison (indicators 10-12)
Indicator 10: External comparison with values derived from household surveys–antenatal care coverage (first visit)
If the HMIS is accurately detecting all health care service delivery events and there are sound estimates of
relevant population denominators, the values for indicators derived from the HMIS should be similar to
those derived from household surveys. The only exception is when the private sector plays an important
role in service provision and is not reporting as part of the HMIS. The ANC1 Consistency ratio is calculated
as the population coverage of ANC1 based on the facility reports divided by the population coverage
based on household survey data. The ANC1 consistency ratio gives an idea of how close the intervention
coverage estimated from facility reports is to the coverage obtained from survey data: the closer this ratio
is to 1 (or 100%), the higher the consistency.
ANC1 coverage can also be used for external comparison of district rates based on the facility reports and
population projections. The ANC1 national coverage rate from the 2006 Demographic and Health Survey
(DHS) was 94%. Data from the earlier 2001 DHS indicate that ANC1 coverage has been over 90% over
many years, with little variation across all nine regions (90-99%). It is reasonable to assume that districts
that have a ANC1 coverage from facility reports which is very different from 94% have problems with their
population denominator, provided the numerator is correct.
National ANC1 coverage computed from facility reports is 95% for both 2008-9 and 2010-11, which yields
an ANC1 consistency ratio of 1.01 at the national level. However, there is considerably more variation at
the district level. Figure 2 shows the distribution of ANC1 consistency ratios for all districts.
At the district level, there is considerable variation. Some districts are implausibly low, other implausibly
high. Table 7 and Figure 2 show the districts with consistency ratios below 0.67 or above 1.33. In 2011,
the consistency ratio was below 0.67 in 14 districts, or 13%. This is approximately the same percentage as
in 2009 (10%). In 2011, 11 districts (10%) had a consistency ratio above 1.33 compared to 11% in 2009. As
expected, there is considerable overlap in the districts with under/over-estimated populations between
2009 and 2011.
If the number of events (in this case new antenatal visits) was fairly accurate, the ANC1 consistency ratio
can be used to identify districts for which population is under/over-estimated. For instance, if coverage
based on the facility data is 141%, then the ANC1 consistency ratio is 141/94 = 1.50, meaning the official
population estimate is 50% lower than it should be. If coverage based on facility data is 47%, then the
ANC1 consistency ratio is 47/94 = 0.50, meaning the official population estimate is double what it should
be.
Table 7: Consistency ratio for ANC1 at national level, and districts with very low and very high consistency ratios (districts in common between the two years are shown in bold)
2008-2009
(80 districts)
2010-2011
(112 districts)
National ANC1 Consistency ratio 1.01 1.01
Districts with consistency ratio under
0.67 (official population is too high)
8 (10%)
Adjumani; Amuria; Buliisa;
Kaabong; Luwero; Moyo;
Nakapiripirit; Yumbe
14 (13%)
Adjumani; Amudat; Amuria;
Kaabong; Kalungu; Kitgum; Kween;
Luuka; Lwengo; Moyo; Napak;
Ntoroko; Soroti; Yumbe
Districts with consistency ratio over
1.33 (official population is too low)
9 (11%)
Abim; Budaka; Butaleja; Gulu;
Iganga; Kaliro; Kampala;
Lyantonde; Pallisa
11 (10%)
Abim; Budaka; Buyende; Gulu;
Jinja; Kisoro; Kyegegwa; Lyantonde;
Nwoya; Serere; Sheema

16 Assessment of health facility data quality: Data quality report card – Uganda, 2010–2011
Figure 2: ANC1 consistency ratios for all districts. A consistency ratio close to 1.0 indicates a high consistency between ANC1 coverage from facility reports and the survey rate (districts with consistency ratio less than 0.67 or greater than 1.33 are shown with darker bars)
Indicators 11 and 12: External comparison with survey–DTP3, institutional deliveries and 4 or more antenatal visits
A comparison with population based data obtained from household surveys and community research
studies is also an important way to assess the quality of estimates generated by health facility data. Table
8 shows a comparison of coverage rates for DTP3 and institutional deliveries from population-based
surveys and from facility reports.
Table 8: Comparison of coverage rates from surveys and from facility reports
Most recent
survey
Facility reports (HMIS) Ratio (Coverage from facility
data/coverage from survey)
2008-2009 2010-2011 2008-2009 2010-2011
DTP3 79%1 84% 91% 1.07 1.14
Deliveries 41%2 34% 39% 0.83 0.95
1 National Service Delivery Survey 2008. The National
service delivery and DHS also include public, private for
profit and PNFPs
2 UDHS 2006.

Assessment of health facility data quality: Data quality report card – Uganda, 2010–2011 17
Figure 3 shows the DTP3 coverage trend generated from the HMIS reported data for children under 1 year,
as well as the results from the Uganda DHS in 2006-07 and of the National Service Delivery Survey 2008
for children 12-23 months (referring to immunization in children under the age of one year the year
before the survey). There is a large gap between the DHS results (based on card and recall) and the HMIS
in 2005 which suggested over-reporting in the HMIS. In 2007, however, there was no such gap, suggesting
good completeness of reporting.
Figure 3. Trend in DTP3 coverage under 1 year of age (%), Uganda 2000-2010.
The comparison of the results for the indicator on 4 or more antenatal care visits (ANC4+) and delivery
care between the annual estimates generated by the HMIS and the DHS results for three years preceding
the 2005-6 shows good consistency. The correspondence of the ANC4+ coverage rates for the period
2004-2006 is very good. The institutional delivery rates in the DHS report are higher than those reported
by the HMIS, and an important part of the difference is explained by the private sector role. In the Uganda
DHS 2006, 29.1% of deliveries were in public sector facilities and an additional 12% in private sector
facilities. The latter includes not-for-profit and for-profit facilities. The HMIS includes not-for-profit
facilities, but not for-profit facilities.
Figure 4: Comparison of HMIS and DHS coverage rates for institutional deliveries and ANC4+

18 Assessment of health facility data quality: Data quality report card – Uganda, 2010–2011
District league table inclusion criteria
Poor data quality at the district level has serious implications in estimating district coverage rates and is
likely to result in incorrect rankings in the district league tables. Including only those districts that pass a
certain threshold of good data quality in the league tables is likely to result in a more accurate ranking of
district performance. Six of the data quality summary indicators were used as inclusion criteria for the
league table: (1) completeness of district reporting, (2) completeness of facility reporting, (3) zero/missing
values, (4) discrepancy between monthly and end-of-year reports, (5) consistency between ANC1 and
DTP3 coverage, and (6) consistency between ANC1 coverage from facility reports and survey. Table 9
shows the districts with consistent data quality problems. Districts that were not flagged for poor
performance in five or more of these indicators were recommended to be included in the league table.
There were 71 districts to be included in the league table according to this system. Many of the districts to
be excluded due to poor data quality were new districts since 2011.
Table 9: Districts with poor data quality, Uganda 2010–2011 (new districts from 2011 are shown in bold)
Indicators
with good
performance
Number
(%) of
districts
Districts
6 40 (36%) (40 districts)
5 31 (28%) (31 districts)
4 21 (19%) Amolatar, Amudat, Budaka, Bukedea, Bulambuli, Buliisa, Butambala, Buvuma,
Buyende, Kaabong, Kanungu, Kitgum, Kyegegwa, Manafwa, Masaka, Mbarara,
Moroto, Moyo, Namayingo, Napak, Ntungamo
3 11 (10%) Amuria, Buhweju, Kalungu, Kiryandongo, Kole, Lyantonde, Ngora, Rubirizi,
Sembabule, Serere, Sironko
2 6 (5%) Alebtong, Luuka, Lwengo, Mitooma, Ntoroko, Nwoya
1 3 (3%) Busia, Sheema, Soroti
Tables 10 and 11 show the top and bottom 15 districts in the league table. Few districts ranked in the
bottom 15 satisfy the inclusion criteria. However, there were also a few districts ranked in the top 15 of
the league table that were flagged, such as Mbarara, Lyantonde, Alebtong, and Buliisa.
Table 10: Top 15 districts in league table (districts that do not satisfy the inclusion criteria are shown in grey)
District
District
league table
score Rank
Kampala 77.5 1
Bushenyi 74.2 2
Kabarole 73.1 3
Mbarara 70.3 4
Gulu 69.0 5
Butaleja 68.0 6
Lyantonde 67.7 7
Alebtong 67.5 8
Buliisa 67.0 9
Jinja 66.7 10
Katakwi 66.4 11
Abim 66.4 12
Rukungiri 65.8 13
Mukono 65.3 14
Kaberamaido 65.2 15
Table 11: Bottom 15 districts in league table (districts that do not satisfy the inclusion criteria are shown in grey)
District
District
league table
score Rank
Adjumani 42.7 98
Lwengo 41.8 99
Luuka 41.6 100
Napak 41.6 101
Gomba 41.2 102
Moyo 40.7 103
Kole 40.4 104
Buhweju 40.1 105
Namayingo 39.7 106
Kaabong 37.0 107
Serere 30.1 108
Amudat 23.2 109
Ntoroko 22.9 110
Kween 17.8 111
Bulambuli 17.8 112