UGANDA COMMUNICATIONS COMMISSION REVIEW OF SECTOR TAXATION POLICIES AND DETERMINING THE ELASTICITY OF PENETRATION AND PRICE OF THE VARIOUS TELECOMMUNICATION SERVICES IN UGANDA Prepared by Eria Hisali Faculty of Economics and Management Makerere University Plot 51 Pool Road Makerere University Main Campus P.O. Box 7062, Kampala [email protected]/[email protected]
Transcript
UGANDA COMMUNICATIONS COMMISSION
REVIEW OF SECTOR TAXATION POLICIES AND DETERMINING THE ELASTICITY OF PENETRATION AND PRICE OF THE VARIOUS
TELECOMMUNICATION SERVICES IN UGANDA
Prepared by
Eria Hisali
Faculty of Economics and Management Makerere University
The telecommunications sector in Uganda has become a major source of tax revenue for the government treasury. The current usage tax on pre-paid mobile services in Uganda is 30 percent (18 percent VAT and 12 percent excise duty). The 30 percent tax on services is certainly very high by any standard. In fact this ranks Uganda as the country with the second highest service taxes on mobile phone usage internationally, placing it only behind Turkey! The usage tax on fixed line services presently stands at 23 percent.
It is usually the case that such high and increasing taxes end up getting reflected in the actual tariffs that consumers pay for services. Other things remaining unchanged, high tariffs should in turn result in a slow down in demand and uptake of services, a decline in investment, and interestingly a decline in revenue for the government treasury. This study sought to shed some light on the possible effects of the current telecommunications sector taxation policy. The main results and findings can be summarized as follows:
• There has been a slow down in uptake of mobile phone services over the recent past, suggesting that tax increases result in a significant discouraging effect on uptake and consumption of services. This has been manifested in a consistent decline in minutes of use over the past five years. Indeed the minutes of use per marginal user have declined from 7 minutes per user per day in 2001 to around 3 minutes in 2006. The penetration growth rates have also started to slow down. In addition there has also been an increasing substitution tendency away from mobile phone services to pay phone services which are deemed to be relatively cheaper. This means that the current sector taxation policy is inefficient.
• High taxes have also resulted in a slow down in growth of the telecommunication industry by reducing sector investment. This has been occurring through a number of channels. The sudden changes in tax policy and rates have affected the companies’ ability to prepare reliable business plans and revenue forecasts, making it difficult to raise funding and increasing the risk factors to their lenders. In addition high taxes have reduced profit margins of the operators as they strive not to transfer all the tax to consumers.
• The current sector tax policy is to a large extent based on the type of technology. For instance, mobile transmission equipment attracts an import duty of zero whereas importation of landline transmission equipment is subject to a levy of 10 percent. In addition, mobile phone
iii
handsets are subject to a zero percent tax rate whereas fixed line sets are subjected to a 10 percent import duty.
• The current sector tax system is also unfair and discriminatory. The tax rate on services is uniform. This, coupled with a decreasing share of income devouted to telecommunications as income increases means that poorer households bear a higher burden than their higher income counterparts.
• The relatively high taxes have also resulted in relatively lower levels of penetration in Uganda when compared to other countries in the region such as Kenya that has a penetration rate of around 15 percent and Tanzania whose penetration rate stands at around 11 percent.
• The own price and penetration sensitivities are quite low meaning that consumers bear most of the burden of increased taxes (and tariffs). Another interesting finding is that increases in tariffs of either mobile or fixed line services result in reduction in usage of both services (instead of substitution, as theory would predict), possibly as households attempt to “work within a given telecommunications budget”. This finding is also in line with the overall declining trends in the sector.
• In view of the negative consequences of high taxes, we also undertook a
simulation exercise to determine how modest changes in tax policy can enhance outcomes in the telecommunications sector. Our findings suggest that:
• A one percent per year reduction in taxes on mobile telephone airtime over the period 2007 to 2010 would reverse the current declining trend in demand for telecommunications services and turn it into a positive and upward trend. In particular, such a tax policy would translate into a 30 percent increase in minutes of use as opposed to a 9 percent reduction over the same period under the current tax policy. On the other hand, a gradual reduction and eventual elimination of excise duty on mobile telephone airtime would result in a 56 percent increase in demand over the period 2007 to 2010, compared to a base case reduction of 9 percent over the same period.
• A one percent per year reduction in taxes on fixed line telephony airtime
over our forecast period (2007 to 2010) would result in 4.24 perent increase in demand for fixed line services as opposed to a 38.4 decline over the same period under the current tax policy.
iv
• A one percent per year reduction in the cost of telephone airtime over the period 2007 to 2010 would result in an increase of penetration levels by 17.3 percent over as opposed to a 6.7 percent increase predicted by the base case scenario whereas, a gradual and eventual elimination of excise duty by the year 2010 would result in a 34.3 percent increase in penetration as opposed to a 6.7 percent change predicted by the base case scenario over the same period.
The results suggest an urgent need to rethink the current telecommunications sector tax policy. This is because telecommunications is just not any other sector, it plays a vitally important role in enhancing productivity in other sectors and thus important for overall economic growth. Thus policies that impede its rapid growth are not only bad for the sector itself but for overall economic performance. In fact, research findings elsewhere suggest that in a typical developing country, a rise of ten mobile phones per 100 people boosts GDP growth by 0.6 percentage points.
1
1 Introduction and the Research Concern It has been shown in the growth literature that investment in information and
communication technologies (ICT’s) and their adoption (and diffusion) induces
high levels of productivity growth and economic performance (Nordhaus, 2002).
Access to information and communications technologies can impact on economic
outcomes through a number of channels including lowering the costs of doing
business, provision of timely and accurate information about markets and
market situations and speeding up the process of knowledge creation (Antonelli,
1991). The pace of adoption and diffusion of information and communications
technologies in general and telecommunication services in particular therefore
remains a matter of great policy concern. Indeed, many countries especially in
the developing world that had tended to lag behind the ICT revolution have in
the recent past moved fast to implement reforms and create an enabling
environment to hasten the spread and adoption of ICT’s to major productive
sectors and to attain wider geographical coverage.
The major reforms that have been commonly implemented have revolved
around the dismantling of state monopolies that previously dominated the
provision of telecommunication services so as to encourage competition and
expand the variety of available telecommunication services. In Uganda, an
independent regulator of the communications sector, the Uganda
Communications Commission was set up in 1998 to among others; enhance
national coverage of communication services and products, to develop and
improve rural communication services and to encourage the development of the
private sector in the development of the communications sector and to encourage
competition.
2
However, the ever increasing fiscal revenue requirements in order to fund
government spending in a sustainable manner coupled with the narrow tax base
in Uganda has increasingly resulted in a situation in which the tax burden falls
disproportionately on a few ‘easy to tax’ sectors. These have traditionally
included tobacco and cigarettes, alcoholic and soft drinks and petroleum
products. Of late this has been expanded to include the telecommunication
sector. The current usage tax on mobile services has reached a rate of 30 percent
(18 percent VAT and 12 percent excise duty), making it the highest in the region
and the second highest internationally. On the other hand, fixed line services
attract a tax rate of 23 percent, of which 18 percent is VAT and 5 percent is excise
duty. A well known effect of a tax increase in the absence of other ‘neutralising’
measures is a rise in price of the commodity or service against which the tax is
levied. This is in turn expected to affect the demand and consumption patterns of
the good or service.
Economic theory posits a number of possible relationships between tax and tariff
increases on the one hand, and demand (sales) on the other. The exact nature and
size of the response will largely depend on the elasticity of demand. In the
particular case where the elasticity of demand is equal to minus unity, the
tax/tariff increase will not affect demand and by implication tax revenue. In cases
of low elasticities, then increases in taxes and prices will have a small impact on
the demand and consumption patterns. In other words, the excess burden of taxes,
that is, the reduction in demand and consumption patterns induced by increases
in taxes is low in such cases. On the other hand, a high elasticity of demand will
imply a high excess burden.
3
Clearly then, the precise and exact nature of the response of demand and
consumption (and penetration) can not be known a priori but the declining
penetration rates in Uganda over the recent past have started to cause serious
concern in some circles. There are concerns that the increasing prices emanating
from high level of taxes on the telecommunication services might work to
discourage consumption of some of the services. There is thus need to assess the
impact of Uganda’s ICT sector taxation policies on the demand and penetration
patterns of telecommunication services.
2 Objectives of the study
The overall objective of the study was to assess the impact of Uganda’s ICT
sector taxation policies and prices on the demand and penetration patterns of
telecommunication services. The study specifically aimed to:
i) review Uganda’s tax policy with particular interest to the
telecommunication services;
ii) assess the impact of tax related price increases on penetration, traffic
volume, total turnover and investment;
iii) determine the price and penetration elasticities of the various
telecommunication services; and,
iv) simulate a scenario of how some modest adjustments in tax rates can
impact on outcomes in the telecommunications sector.
3 An overview of the telecommunications sector in Uganda This section presents an overview of the structure and performance of the
telecommunications sector over the past decade. The presentation in this section
4
is rather brief; a more detailed exposition of trends and directions in the sector
can be found in the UCC Comprehensive Sector Analysis Report (2005).
The main policy thrust with respect to the telecommunication sector over the
past decade has been to promote its rapid growth and expansion to cover most
parts of the country. This has perhaps been a reflection of government’s
recognition of the synergies and positive feedback effects that exist between a
well developed information and communications sector and productivity growth
and overall economic performance. In the early years that followed attainment of
political independence, Uganda pursued a system with a proactive state. Indeed,
until the early 1990s the telecommunications sector was comprised basically of
the incumbent state monopoly, the Uganda Posts and Telecommunications
Corporation (UPTC). The period after 1996 witnessed implementation of
measures that sought to reduce state dominance in the sector and to attract
investment to promote its rapid expansion.
The key hallmarks of the telecommunications sector reform programme have
included measures to increase reliance on market forces. The incumbent state
monopoly was dismantled and subdivided into three smaller and more
specialised units, namely Uganda Post Ltd, UTL and Post Bank Uganda Ltd.
Other private companies have also since been licensed in order to promote
competition. Competition usually forces firms to become highly innovative and
to set prices that are competitive. This in turn is expected to be reflected in
increased consumers’ welfare1 as they share in the ensuing productivity gains.
Productivity growth is usually expected to trend at a much higher rate in the
telecommunications sector relative to other sectors of the economy due to the 1 This can take the form of lower prices and better quality services.
5
higher than usual rate of technological innovations in the sector and lower input
price inflation due to decreasing unit costs of processing, switching and
transmission. The benefits of increased productivity should ideally, at least in
part be passed on to the consumers.
However, due to imperfections in the market firms will not have sufficient
incentives on their own to pass on the gains in productivity to final consumers,
especially at the early stages of transition. In fact in the case of Uganda,
government decided to initially put in place a limited competition regime in
order to encourage rapid investment growth and reinvestment of the retained
profits. These necessitated the need to regulate the sector. The Uganda
Communications Commission was as a result established in 1998 to oversee the
sector. The sector has evolved quite tremendously over the reform period with
considerable expansion in the subscriber base. The mobile phone subscribers
have, however, expanded at a much faster rate than their fixed line counterparts,
a development that can partly be attributed to convenience associated with
Communications sector comparative figures (Dec. 1996 to Dec. 2006)
0
500,000
1,000,000
1,500,000
2,000,000
2,500,000
3,000,000
Dec. 1
996
Dec. 1
999
Jul. 2
001
Sep.
2002
Mar. 2
003
Sep.
2003
Mar. 2
004
Sep.
2004
Mar. 2
005
Sep.
2005
Mar. 2
006
Sep.
2006
Period
Sub
srib
ers
Fixed Cellular
Source: Uganda Communications Commission
At present there are two national telecommunication operators working on a
license that allows provision of all telecommunication services. There are three
cellular operators, twelve operational internet access service providers and a
couple of public pay communication providers reselling the services of locally
licensed operators. There are three licensed third party network providers that
provide private data and voice services. Plans are underway to liberalise the
sector further. The Uganda Communications Commission also provides rural
communication licences to operators that provide services to those areas in
which MTN and UTL gave up their exclusivity rights.
The sector’s contribution to GDP currently stands at 8.2 percent and it
contributes 5 percent of total tax revenue to the government treasury. Sixty five
7
percent of the land area is covered by fixed and or mobile telephone coverage
using a whole range of technologies including GSM, CDMA, fibre-optic
networks etc. All districts and 80 percent of sub-counties in the country have a
point of presence of telecommunication services. The telephone penetration
levels have increased from a dismal 0.26 per 100 inhabitants in 2001 to 10.34 per
100 inhabitants to date. The number of internet subscribers, although still small,
has increased to 13,000 from 6,500 in 2002. Internet access points in the country
have increased and it is now estimated that the number of people accessing
internet at least once a month is around 2,000,000. In addition, internet capacity
has increased with the current total bandwidth being estimated at 126 mbps.
However, declining sector trends over the past few years have started to cause
serious concerns. Average revenue per user per month (ARPU)2 has continued to
decline, decreasing from UGX 39,563.45 in 2002 to UGX 25,140.52 in 2005 (Figure
2).
Figure 2: Monthly average revenue per user 2002-2005 Monthly Average Revenue Per User (UShs)
0
5000
10000
15000
20000
25000
30000
35000
40000
45000
2002 2003 2004 2005
Period
Rev
enue
ARPU
Source: Computed
2 Average Revenue Per Unit (ARPU) - Measures the average monthly revenue generated for each customer unit, such as a cellular phone or pager that a carrier has in operation.
8
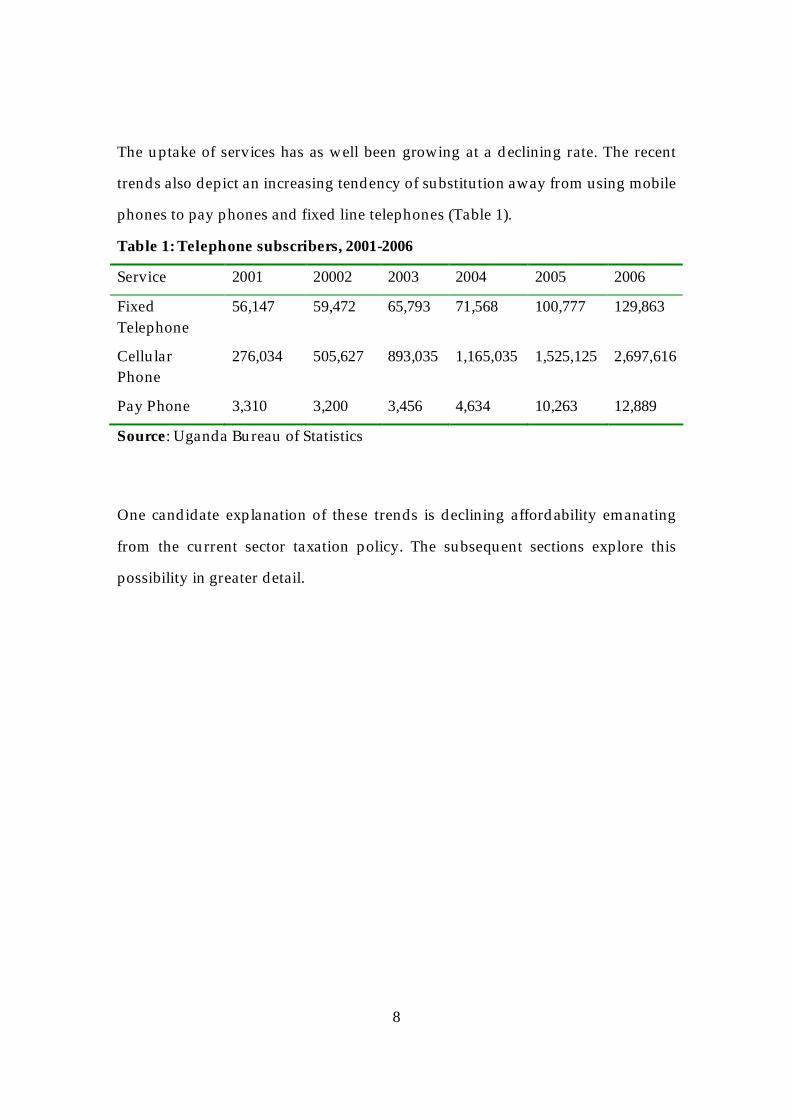
The uptake of services has as well been growing at a declining rate. The recent
trends also depict an increasing tendency of substitution away from using mobile
phones to pay phones and fixed line telephones (Table 1).
One candidate explanation of these trends is declining affordability emanating
from the current sector taxation policy. The subsequent sections explore this
possibility in greater detail.
9
4 Telecommunications sector taxation in Uganda: nature, structure and possible consequences
This section presents information pertaining to the telecommunications sector
taxation policy in Uganda. It outlines the specific taxes (and tax rates) that can
influence outcomes in the telecommunications sector and how they have evolved
over time. It then attempts to assess the possible effects of tax policy variables on
some key telecommunications sector performance indicators such as penetration,
usage and investment. In order to be able to draw out some preliminary3
implications for policy, we also undertake an assessment of the current tax
system in light of some vitally important tenets of a good tax and tax system,
specifically efficiency and equity.
This section starts by setting the scene upon which the relatively high level of
telecommunications sector taxes in Uganda can be possibly be explained and
understood. A tax is a mandatory transfer from private agents to government.
Taxes largely arise out of the need to obtain revenue to fund government
spending programmes. In an ideal setting, the tax revenue collected domestically
should be sufficient to fund government operations. A budget (fiscal) deficit is
then said to arise whenever the actual revenues realised fall short of government
expenditure requirements. Uganda has been operating a fairly large and
apparently unsustainable fiscal deficit over the past decade or so. In fact the fiscal
deficits minus grants as a percentage of GDP have increased from about 2% of
GDP in 1991 to about 13% of GDP in 2004.
3 A more quantitative and conclusive analysis is undertaken in the subsequent sections. To an extent therefore, this section also helps to develop a justification for the econometric analysis undertaken subsequently and also sets the scene within which the results from quantitative analysis can be interpreted and understood.
10
Given the need to fund its numerous obligations, government has had to find
mechanisms of funding this ever bourgeoning deficit. Public finance theory
suggests four major avenues through which revenue to fund the deficit can be
realised, viz;
i. borrowing from the public and domestic banking system;
ii. printing money;
iii. borrowing from abroad; and,
iv. increasing taxes.
Perhaps the most ideal financing mechanism would entail raising the required
revenues through taxes. Indeed, since the early 1990s, government undertook to
reform the tax system with the object purpose of raising more revenue locally.
However, owing to the apparently low revenue productivity of Uganda’s tax
system these first generation reforms of the tax system appear to have failed to
raise enough revenue to close the fiscal deficit4. In light of this and given that
borrowing from the Central Bank (printing money) is inflationary, government
has had to rely mainly on borrowing from abroad (donor aid).
Whereas increased donor aid inflows have been welcomed and even encouraged
in some circles to help increase the pace at which some social targets can be
attained, others have strongly argued that they complicate short run
macroeconomic management and may generally not be sustainable in the long
run5 (Brownbridge, 2004). Donor inflows can have many adverse consequences
4 Of course this is worsened by the very high cost of public administration. 5 The most fierce debate in this area in Uganda has been largely between the Ministry of Finance and the Bank of Uganda on the one hand who have continued to point out that the present trend is not sustainable,
11
including putting pressure on the domestic price level and domestic currency
appreciation. These in turn can hurt export competitiveness and stifle the role of
the private sector in economic activity. It is these undesirable consequences of
over reliance on donor inflows that help us appreciate the current second
generation attempts by government to realise more revenue domestically. The
current tax to GDP ratio of 12.78 percent in Uganda is still far below comparable
countries in sub Sahara African whose tax to GDP ratio stands at an average of
19 percent. Attempts to raise more revenue domestically has owing to the
narrow tax base, however, resulted in a quite unfortunate trend of events
whereby a few “easy to tax” sectors have had to bear a disproportionate tax
burden. These have traditionally included the cigarettes and tobacco sub-sector,
petroleum products and alcoholic and soft drinks.
More recently, the telecommunications sector has become one “good” candidate
source of tax revenue. Figure 3 presents trends in total tax revenue of the
telecommunications sector between 2001 and 2006
Figure 3: Telecom Tax Revenue, 2002-2006
and spending Ministries that do not seem to understand why spending should not even increase further so as to tap the seemingly readily available donor resources, on the other (Brownbridge, 2004).
6 It should be noted that this will depend on the tax incidence, which in turn depends to a large extent on the nature of price sensitivity of demand of the services.
24
The message of this relationship appears to suggest the obvious; high taxes
discourage investment. This trend is quite worrying, if not for anything else, then
for the reason that low investment may translate in a slow down in uptake of
services and ultimately result in low tax revenue for the government treasury. In
the overall, high taxes on a narrow base appear to be self defeating in the long
run.
Generally, if the economic incidence7 of increased taxes is borne by operators
then the amount of capital left over from profits to invest and fulfil roll over
obligations is therefore reduced affecting network service growth as well as
development. The reduced profit margin may also reduce flexibility in tariff
decrease which in turn implies that it will not be possible for consumers to share
in any productivity gains.
Taxes, government revenue and overall economic growth
High taxes on a narrow tax base in the telecommunications sector are not only
bad for uptake of services or investment and revenue for the government
treasury. Given the strong synergies between telecommunications and
productivity growth in other sectors of the economy, high taxes can also be bad
for overall economic growth. A recent study by London Business School found
that, in a typical developing country, a rise of ten mobile phones per 100 people
boosts GDP growth by 0.6 percentage points.
7 The incidence of a tax can be distinguished depending on whether it is statutory incidence or economic incidence. Statutory incidence refers to the party that has the legal obligation to remit the tax to the government whereas economic incidence refers to who actually pays the tax, that is, the party whose behavior is changed or whose welfare is reduced as a result of the tax.
25
Tax equity and efficiency
Apart from examining possible consequences that tax policy variables can have
on outcomes in the telecommunications sector, it is imperative to assess the
sector tax regime itself with respect to some standard yardsticks that should
characterize a good tax system. This should enable us find answers to some
potentially interesting policy issues such as: is there any discernible relationship
between tax revenue collected from the sector and the proportion of this revenue
that is spent on sector specific or any other activities for that matter, that
exclusively or at least disproportionately benefit sector operators and their
customers? Does the current sector tax regime in any way favour the poor and
disadvantaged segments of society? If not, isn’t it possible then that the poorer
segments are made to bear a disproportionately heavier “excess burden”?
In order to provide answers to some of the foregoing questions our subsequent
analysis will be founded on two yardsticks of a good tax system namely, equity
and efficiency.
Tax equity
Equity relates to fairness of a tax system. Fairness is subjective but there are
certain guiding principles that define an equitable tax/tax system. Fairness
encompasses vertical and horizontal equity. Vertical equity posits that those
individuals in a position to pay higher taxes should pay more. There are two
basic principles that are usually considered under vertical equity, the benefit
principle and ability to pay principle. In simple terms the benefit principle
suggests that taxes should be paid according to what one gets from the system.
26
Certainly a more complete understanding of whether this holds would require
undertaking an analysis of government expenditure incidence. This task is
outside the terms of reference and scope of the present exercise. However, there
is no reason to imagine that there is a significant linkage between what
customers and operators in Uganda’s telecommunications sector pay as taxes
and what they receive from government as would be required by the benefit
principle. Put another way, the sector operators and customers in Uganda are not
getting any special treatment from government to warrant such high taxes!
The ability to pay simply suggests that a fair tax should fall proportionately on
those with a higher measure of ability to pay. In other words, a good tax should
be proportional in the sense that it should increase with the ability to pay. This
would generally require richer households to pay more than their poorer
counterparts. On the contrary the current sector tax system in Uganda is
regressive. This is because the share of telecommunications in total expenditure
reduces as income increases. A uniform tax rate coupled with the decreasing
share of income devouted to telecommunications as income increases means that
poorer households bear a higher burden than their higher income counterparts.
Uganda’s current telecommunications tax system is therefore regressive; it is
unfair to the poorer and disadvantaged members of society, who incidentally
form the majority of the population.
Horizontal equity on the other hand would require that those individuals who
are the same in all relevant respects should by way of taxes be treated equally.
However, this is very unlikely to hold since customers of the same income spend
differing amounts on telecommunication. This then makes the current sector tax
system discriminatory, in violation of the horizontal equity principle.
27
Tax efficiency
Efficiency relates to the discouraging effects of a tax system. Taxes are by their
very nature distortionary. A good tax system should thus seek to minimize the
distortions that it can potentially cause8. Distortions can be static or dynamic.
These concepts are closely related in the sense that they both refer to a change in
behaviour induced by an increase in taxes. Their key difference lies in their
treatment of consumers’ and firms’ tastes and preferences and production
technologies respectively. Static efficiency losses assume that tastes and
preferences as well as firms’ technologies are fixed. This means that the change
in behavior can only be reflected in reduced consumption and production levels.
The remarkable reduction in minutes of use and a slowdown in uptake of
services that was alluded to earlier is a clear indicator that the static inefficiency
losses have been enormous. This loosely means that the present tax system is
inefficient in a static sense, since it has resulted in more than proportionate
reduction in uptake of services.
In a dynamic setting preferences and technologies are variable and as such tax
increases may induce agents to delve into other alternatives. This may in our case
be seen in the apparent shift by agents away from mobile phone use to public
pay phone services and fixed phone lines that attract lower tax rates and
therefore relatively cheaper. This again renders the present tax system inefficient,
even in the dynamic perspective.
8 The term distortion is used in this context to mean the discouraging effects or change in behaviour that a tax may induce. In economics these discouraging effects or distortions are technically referred to as excess burden or deadweight loss.
28
In the overall, however, great caution should be exercised when evaluating the
desirability or otherwise of telecommunication taxes. In particular, the mere fact
that taxes can result in distortions should not necessarily mean that they are
undesirable. Instead, distortion should be viewed as part of the cost side of the
cost-benefit analysis of any tax system. Indeed even if the benefits are
determined to justify the costs, the tax system could be restructured to reduce
inefficiency while raising the required revenue for the government treasury. We
undertake exogenous policy shift simulations in a subsequent section in order to
explore such alternatives.
5 Tax policy and tariff benchmarking
This section makes a comparison of telecommunications sector tax policy and
tariffs in Uganda with the system obtaining in other countries in the region. It
seeks to make inference on some questions such as: Are there any discernible
differences in telecommunications sector tax rates between Uganda and other
comparable countries? Are there any discernible differences in tariffs in Uganda
and other comparable countries? Are there any discernible differences in levels
of penetration between Uganda and the comparator countries? If so, to what
extent can one possibly attribute this difference to differences in sector tax policy
and tariffs?
Of course, owing the fact that countries tend to be heterogeneous in many
respects, the analysis here should only be viewed as an approximation. We
largely limit our comparison to two countries in the region, Kenya and Tanzania.
They are more likely to have some structural similarities. They are also in a
customs union and therefore likely to pursue closely similar sector tax policies.
Of late, there has also developed a trend of sharing facilities among the mobile
29
cellular operators such that a customer can use their line across the geographical
boundary of his or her country in the region. At present this is being done for the
“Celtel” customers across the east African region. There is also an arrangement
among “Mango” in Uganda, “Safaricom” in Kenya and “Vodacom” in Tanzania
to connect each others’ subscribers as they cross from their native countries to
any other in the region. More recently, MTN (Uganda) as well as Safaricom-
Kenya and Vodacom-Tanzania have also put in place a similar arrangement. It
would be interesting if these customers paid similar amounts in the different
countries, after controlling for exchange rates. Figure 8 shows that Uganda
compares quite poorly in terms of teledensity against countries in the region.
Figure 8: Level of telephone penetration for selected countries
Lines per 100 inhabitants
02468
1012141618
2001 2002 2003 2004 2005
UgandaTanzaniaKenyaNigeria
Source: Uganda Communications Commission
The Figure shows that the levels of penetration are low when compared to other
countries in the region such as Kenya that has a penetration rate of around 15
percent and Tanzania whose penetration rate stands at around 11 percent.
30
An influential study by a consortium of leading international consultancy firms
estimates the cost of taxes in the overall tax burden associated to the cost of
mobile phone ownership in a cross section of 50 economies (see GSM
Association, 2005). It ranks Uganda in second position as the country with the
highest taxes on mobile phone services internationally. The current tax rate on
mobile phone services in Uganda is 30 percent whereas it is around 25 percent
and 26 percent in Tanzania and Kenya respectively. Whether this difference in
tax rates is what explains the differences in penetration levels would require
somewhat more sophisticated analysis which can not be undertaken in the scope
of the present assignment and more importantly due to data limitations.
Nonetheless, one can not rule out the fact that affordability is a major reason for
the low penetration levels in Uganda. Table 10 presents mobile and local call
tariff in Uganda, Kenya and Tanzania. On average, the cost of making a call are
higher in Uganda than in any of the other east African countries. This may
explain the relatively low penetration levels alluded to earlier.
Table 10: Tariff benchmarking
Average mobile tariff- pre-paid in the EA Region
0100200300400500600700
2000 2001 2002 2003 2004 2005
Years
Ug-
Shs
Uganda Kenya Tanzania
31
Local fixed tariff- 1 min U shs
0
50
100
150
200
2000 2001 2002 2003 2004 2005 2006
Years
U s
hs
Uganda Kenya Tanzania
The foregoing sections have provided a description of the effects of current sector
taxation policies on uptake and demand for services. We also undertook a
benchmarking exercise in which we compared the tax rates obtaining in Uganda
to those in the region. Our exposition indicates that the current tax regime in
Uganda has had adverse consequences on the sector. It should, however, be
pointed out that this kind of descriptive work can not be relied on to provide
conclusive analysis since it does not say anything about the statistical plausibility
of the underlying relationships. There is thus need to increase the statistical
reliability of the relationships by undertaking an econometric analysis.
The subsequent section undertakes an econometric estimation of the demand
and penetration elasticities for telecommunication services and applies them to
gain an insight into the nature of “excess burden” arising from the current sector
tax policy. The specifications also form the basis for policy simulations and
scenario analysis.
6 Econometric methodology and analysis
This section undertakes an econometric estimation of price and penetration
elasticities of the various telecommunication services in Uganda. It also estimates
the cross elasticities between mobile and fixed line services. The main thrust in
this section is to examine and understand the nature and size of the underlying
relationships between demand for the major categories of telecommunication
services and tariffs. The elasticity estimates also enable us to establish the extent
to which different parties (consumers and service providers) share in tax
increases, that is, who pays what? In addition, the elasticity estimates obtained in
this section form the basis for model forecasting and simulation which are
undertaken in a subsequent subsection. A more detailed conceptual analysis of
the possible relationships between tax induced tariff increases and demand for
services is presented in the previous sections. The approach to elasticity
measurement employed in this report entailed relating a measure of demand for
telecommunication services and tariff changes through regression analysis. The
various elasticity estimates are presented in what follows.
6.1 Modelling Price Elasticities for Mobile Services
The dependent variable employed in this study is the demand for
telecommunication services. There are a number of suggestions in the literature
on how to proxy measures that capture demand for telecommunication services.
33
The most common ones include number of calls, call duration or minutes of use
and revenue from specific call types. Others are number of telephones and
penetration of telephones. We employed minutes of use as a measure of demand.
The price variable is defined as cost per minute. The variables are transformed
into their natural logarithmic form so the coefficients can be interpreted as
elasticities. The price elasticity estimates are presented in Tables 11 and 12.
Table 11: Mobile price elasticity estimates Dependent variable: mobile minutes of use Variable Coefficient t-statistic Prob. Constant 3.659620 10.28156 0.0000 Price per minute -0.375192 -6.197367 0.0000
Table 12: Fixed line price elasticity estimates Dependent variable: fixed minutes of use Variable Coefficient t-statistic Prob. Constant 2.323101 7.75683 0.0000 Price per minute -0.137471 -2.398232 0.0310
The low price elasticity estimates can be interpreted to mean that most of the tax
increments are passed on to consumers in the form of higher prices. This means
that consumers are made to bear most of the burden of the high taxes. In absolute
terms, the elasticity estimate of fixed line services is lower than that for mobile
services. This can be interpreted to mean that fixed line service users shoulder a
higher tax burden when compared to their mobile service counterparts. This
result seems to be plausible if one is to adopt the view that most fixed line users
are either institutions and commercial premises or generally above average
income residential establishments. These are less likely to reduce services
because of modest increases in tariffs.
34
6.2 Modelling Cross Elasticities
In cases where services can be substituted (such as mobile and fixed line
telecommunication services), it is possible that an increase in price of one service
may result in an increase in demand for the other (substitute) service. Owing to
the fact that taxes and tariffs on mobile and fixed line services have not been
changing proportionately, it was imperative to analyse cross elasticities between
these two services. It was important to establish whether the relatively higher
taxes and tariffs on mobile services have resulted in a shift of demand in favour
of fixed line services. The cross elasticity estimates for fixed and mobile services
in Uganda are presented in Tables 13 and 14.
Table 13: Mobile services demand and price of fixed line services Dependent variable: mobile minutes of use Variable Coefficient t-statistic Prob. Constant 2.29419 5.843973 0.0000 Fixed line services price -0.168220 -2.239130 0.0419
Table 14: Fixed line services demand and price of mobile services Dependent variable: fixed minutes of use Variable Coefficient t-statistic Prob. Constant 2.403441 20.77622 0.0000 Mobile services price -0.134480 -6.905913 0.0000
The results suggest that a one percentage point increase in fixed line tariffs
reduces demand for mobile services by about 0.17 percentage points. On the
other hand a one percentage point increase in mobile services tariffs reduces
fixed line services demand by 0.13 percentage points. In other words, these
results mean that a tariff increase of one service will result in a reduction of
demand for the substitute service. This contradicts the theoretical predictions but
35
is generally plausible in view of the declining trends in the telecommunications
sub-sector. This result is also plausible if it is interpreted to suggest that in an
effort to keep within a given budget for telecommunication services, an increase
in price of one service may induce households to ultimately reduce demand of all
services as they attempt not to exceed their telecommunication budgetary
allocations.
6.3 Modelling Penetration Elasticities
Increases in taxes and tariffs may also discourage penetration, that is, may slow
down the growth rate of new subscriptions. In order to analyse the effects of
changes in costs on penetration of the various telecommunication services, we
estimated penetration elasticities. The results are presented in Table 15.
Table 15: Regression analysis results for penetration Dependent variable: penetration
Variable Coefficient t-Statistic Prob. C -17.89665 -12.76946 0.0000
The dependent variable is measured as lines per 100 inhabitants. The average
tariff is used as an indicator of the cost of telephone services. UR is the
proportion of urban to rural population whereas inc refers to income per capita.
The low penetration elasticity means that tax increases are passed on to
consumers in the form of high taxes. The increased costs of telephone airtime
resulting from increased taxes over the past few years may thus explain the
recent slow down in penetration growth rates.
7 Policy change simulation and analysis
36
Using the statistical model specifications in the preceding section as well as the
current sector tax rates we also undertook a simulation exercise to analyse the
possible impact of some modest changes in taxes rates. We consider the
following scenarios:
i. a one percent per year reduction of the present taxes on phone air time
over the next four years (2007 to 2010) for mobile and fixed line services
on demand and penetration; and,
ii. a three percent per year reduction of excise duty over the next four years
(2007 to 2010), effectively eliminating it (excise duty) by the year 2010 on
demand and penetration.
In order to compare the impact of various tax changes, a base case scenario was
created, which projects patterns in consumption of telecommunications services
and penetration over the next four years (2007 to 2010). Changes as a result of
adjustments in tax rates in the new scenarios are then compared against this base
case scenario and calculated for a four year period (2007 to 2010). It was assumed
that all changes in taxes would be translated into equivalent changes in prices, in
addition to any market driven tariff changes such as competition and declining
cost of infrastructure and devices. The analysis also assumed that all tax change
measures are introduced in early 2007, and their full impact is felt by the end of
the first year, although in reality changes may be delayed.
Our base case scenario assumes a number of intervening factors that will result
in increased usage of telecommunication services. These include an upward
growth in per capita income, increased urbanisation, enhanced competition and
37
declining prices for handsets. However, an even faster expansion can realised if
there were some modest revisions to current sector tax policy.
A one percent per year reduction in taxes on telephone airtime over our forecast
period (2007 to 2010) would reverse the current declining trend in demand for
mobile telecommunications services into a positive and upward trend. In
particular, such a tax policy would translate into a 30 percent increase in minutes
of use as opposed to a 9 percent reduction over the same period under the
current tax policy (Figure 9).
Figure 9: Impact of a one percent per year reduction in taxes on mobile phone airtime
1.2
1.3
1.4
1.5
1.6
1.7
1.8
2006 2007 2008 2009 2010
MOUF (Scenario 1) MOUF (Baseline)
MOUF
A gradual reduction and eventual elimination of excise duty on telephone
airtime would on the other hand result in a 56 percent increase in demand for
mobile services over the period 2007 to 2010, compared to a base case reduction
of 9 percent over the same period.
Figure 10: Impact of reduction (and eventual elimination) of excise duty on mobile phone airtime
38
1.2
1.4
1.6
1.8
2.0
2.2
2.4
2.6
2006 2007 2008 2009 2010
MOUF (Scenario 1) MOUF (Baseline)
MOUF
A one percent per year reduction in taxes on fixed line telephony airtime over
our forecast period (2007 to 2010) would result in 4.24 perent increase in demand
for fixed line services as opposed to a 38.4 decline over the same period under
the current tax policy (Figure 11).
Figure 11: Impact of a one percent per year reduction in taxes on fixed line usage
0.9
1.0
1.1
1.2
1.3
1.4
1.5
1.6
1.7
2006 2007 2008 2009 2010
LNMOUT1F (Scenario 1) LNMOUT1F (Baseline)
LNMOUT1F
A one percent per year reduction in the cost of telephone airtime over our
forecast period would result in an increase of penetration levels by 17.3 percent
39
over the 2007 to 2010 period as opposed to a 6.7 percent increase predicted by the
base case scenario over the same period (Figure 12).
Figure 12: Impact of a one percent per year reduction in taxes on penetration
0.80
0.85
0.90
0.95
1.00
1.05
1.10
1.15
2006 2007 2008 2009 2010
TELF (Scenario 1) TELF (Baseline)
TELF
On the other hand, a gradual and eventual elimination of excise duty by the year
2010 would result in a 34.3 percent increase in penetration as opposed to a 6.7
percent change predicted by the base case scenario over the same period (Figure
13).
Figure 13: Impact of reduction (and eventual elimination) of excise duty on penetration
0.8
0.9
1.0
1.1
1.2
1.3
1.4
07Q1 07Q3 08Q1 08Q3 09Q1 09Q3 10Q1 10Q3
TELF (Scenario 1) TELF (Baseline)
TELF
40
8. Summary and recommendations
This study sought to assess the impact of Uganda’s ICT sector taxation policies
and prices on the demand and penetration patterns of telecommunication
services. The first part of the study gave an overview of the structure and
performance of the telecommunications sector over the past decade. The second
part of the study sets the context in which the apparently high level of
telecommunications sector taxes in Uganda can be possibly be explained and
then assesses the possible effects of tax policy variables on some key
telecommunications sector performance indicators such as penetration, usage
and investment. The tax policy itself is also an assessed in light of some vitally
important tenets of a good tax and tax system, specifically efficiency and equity.
Perhaps owing to limited competition in the sector, increases in taxes are passed
on to consumers in the form of higher tariffs. This has over time resulted in a
slowdown in uptake of services and sector investment. Indirectly, such a slow
down in uptake of services reduces tax revenue to the government treasury as
well as a slow down in overall economic growth. The present sector tax system is
also shown to be both inequitable and inefficient. Interestingly, our simulation
results suggest that there is still scope for turning around the present declining
trends. The main recommendation for revitalising the sector and ensuring its
rapid expansion lies in some modest reductions in tax rates. In order to minimise
disruptions in governmental services funded by tax revenue generated from the
telecommunications sector, we suggest small and modest reductions in tax rates
that are stretched over a number of years. These hold the key for revamping the
rapid expansion of the sector. At an indirect level, the increased uptake of
services from these modest reductions in taxes should result in an even greater
41
increase in revenue for the government treasury and overall productivity
growth. Thus, modest tax reductions should result in a “win-win” situation.
42
References
Antonelli, C. (1991), “The Diffusion of Advanced Technologies in Developing Countries”, Paris: OECD. Bird M.R. (1987), “A new look at indirect taxation in developing countries”, World Development, 15(9):1151-1161. Gamble, Jr. R.C. (1989), “Excise Taxes and the Price Elasticity of Demand”, The Journal of Economic Education, 20(4):379-389. GSM Association (2005), “Tax and the digital divide: how new approaches to taxation can connect the unconnected”. Mchugh, Richard (1996), “Telecommunications taxation: the Georgia case”, Andrew Young School of Policy Studies, FRP Report No. 96.3. Nordhaus William D. (2002), “Productivity Growth and the New Economy”, Brookings Papers on Economic Activity, 2:211-244. Prieger, J.E., Sexton, T.A. and A. Nellen (2003), “The taxation of telecommunications in California in the information age”, California Policy Research Center. Republic of Uganda, Ministry of Finance (undated), “Tax Regime on Telecommunication Equipment”. Uganda Communications Commission, (2006), “Terms of Reference for Consultancy to Review the Sector Taxation Policies and Determine the Elasticity of Penetration and Price of the Various Telecommunication Services”, Kampala, 11th May, 2006. Wheatley, Jeffery J. (1998), “Price Elasticities for Telecommunications Services with Reference to Developing Countries”, Department of Media and Communications, London School of Economics and Political Science.