1 4 1. 0 8 7 C H UHK'AKY INTHRNATIONAl. REFERENCE CENTR FOR COMMUNITY WATER SUPPLY CHILD SURVIVAL Risks and the Road to Health DEMOGRAPHIC DATA FOR DEVELOPMENT PROJECT Institute for Resource Development/Westinghouse
Transcript
1 4 1. 0
8 7 C H
UHK'AKYINTHRNATIONAl. REFERENCE CENTRFOR COMMUNITY WATER SUPPLY
CHILDSURVIVAL
Risks and the Road to HealthDEMOGRAPHICDATA FORDEVELOPMENTPROJECT
Institute for Resource Development/Westinghouse
Child Survival:Risks and the Road to Health
Library of Congress Cataloging in Publication Data
Galway, Katrina, 1955- ;Child Survival.
"Prepared for the Agency for International Development, Officeof Population and Office of 1 lealth by the Institute for ResourceDevelopment at Westinghouse."
Statistics. 2. Children— Health and hygiene-Developing countries. 3. Child health services— :.Developing countries. 1. Wolff, Brent, 1959- .11. Sturgis, Richard, 1936-, III. Institutefor Resource Development at Westinghouse (Columbia,Md.) IV. United States. Agency for InternationalDevelopment. Office of Population. V. United States.Agency for International Development. Office of Health.VI. Title. [DNLM: 1. Developing Countries, 2. Health.3. Infant, Mortality. 4, Infant, New Born, Diseases.5. Probability. WA 900.1 G183c|RJ103.D44G35 1987 362. l'9892'00091724021 86-34280
Slide reproductions of the figures used in this report, amicrocomputer diskette copy of the 10 appendix tables,and multiple copies of this report are available uponrequest. Refer to the order form on the inside back coverof this report.
Child Survival:Risks and the Road to Health
Prepared by
The Demographic Data for Development Project
Katrina GalwayBrent Wolff
Richard Sturgis
Institute for Resource Development/Westinghouse
March 1987
. . . ! . ^ i i i | .NThRNATIONAL. REFL^FNCEC^^i-' '-0\i CC«*'\!^i\'\ WAi"L:H; SUPPLYAN'J SALTATION (Ir-C)P.O. Box 1)3,-0. '2^09 AD The Hagu«Tol. (070) 814911 ext 141/142
o
Adaiowledgments
A report prepared for the Agency for International DevelopmentOffice of Population and Office of Healthby the Institute for Resource Development/Westinghouse.
This report was supported by the United States Agency for International Development(AID), through Demographic Data for Development Project Contract No. AID/DPE-3000-C-00-2017-00, and IQC Contract No. PDC-1406- 1-1L-4062-00 at the Institute forResource Development/Westinghouse. Support for printing was provided by the Academyfor Educational Development (A tD). The contents of the report do not necessarily reflectthe views or policies oi AID, AED, or Westinghouse.
The authors express appreciation and special thanks to many colleagues who contributedto this report. Alfred Buck, Neal Halsey, and Henry Mosley gave early guidance in thedevelopment of the report. Pamela Johnson, Coordinator for Child Survival, Office ofHealth at AID, gave early guidance and continued to provide, assistance throughout theproduction of the report. The valuable assistance of the following reviewers is also appre-ciated: Brigitta Bucht on the projections, Robert Black on the Diarrheal Disease section,Sandra Huffman on the Malnutrition section, Deborah Maine on the High Risk Fertilitysection, and Eugene. Mcjunkin on the Water and Sanitation section. Advice and technicalsupport were provided by John Haaga for child malnutrition estimates, Carol Chan ofthe Expanded Programme on Immunization of the World I lealth Organization (WHO)and Sydney Moore of the Population Information Program on immunization statistics,and James Tulloch of the Programme for the Control oi Diarrheal Diseases of WHO ondiarrheal disease estimates. The. authors gratefully acknowledge the assistance ol PhyllisAvedon for editorial support; Shea O. Rutstein for technical support, and Caroline Sturgisfor graphics support. Staff members of the Population Policy Development Division ofAID, where the Demographic Data for Development Project is located, gave support anddirection to the. report, especially John Crowley and Judith Seltzer. Persons associatedwith the Office of Health of AID also provided periodic assistance, in particular Jack Lawsonand Sally Stansfield. Valuable assistance was also received from the stall oi the DemographicData for Development Project: David Cantor, Alene Gelbard, Nancy McGin; Joseph Regan,and Jane Weymouth.
Editors Note:
Infant and Child Mortality RatesThis report clarifies the presentation and interpretation of infant and child mortality ratesin two ways: first, mortality rates are reported as percentages. Second, child mortalityrates are reported as the percentage of children born who die between exact ages 1 and5. Because the denominator for both rates is the same, infant and child mortality ratesare additive, i.e., adding inlant mortality rates to child mortality rates provides percen-tages of children born who die before age 5.
CONTENTS IPAGE
I World Patterns and Rates of Child Survival 1
Major Impediments to Child Survival andStrategies for their Removal 9
n Diarrheal Disease 10
III Vaccine-Preventable Diseases 16
IV Acute Respiratory Infection 22
V Malaria 25
VI Malnutrition 31
VH High-Risk Fertility Behavior 39
Socioeconomic Factors and Child Survival 45
Vm Education and Literacy 46
IX Availability of Modern Health Services 51
X Income Per Capita and Government Expenditures 54
XI Food Availability 56
XII Water Supply and Sanitation Facilities 59
Child Survival Summary Chart 61
Selected Bibliography 65
Appendices
PAGE
Appendix 1: Child Survival Statistics '..'.. 75
Table 1: Numbers of Infants and Children Age 1-4 if 1980-85 MortalityLevels Continue 76
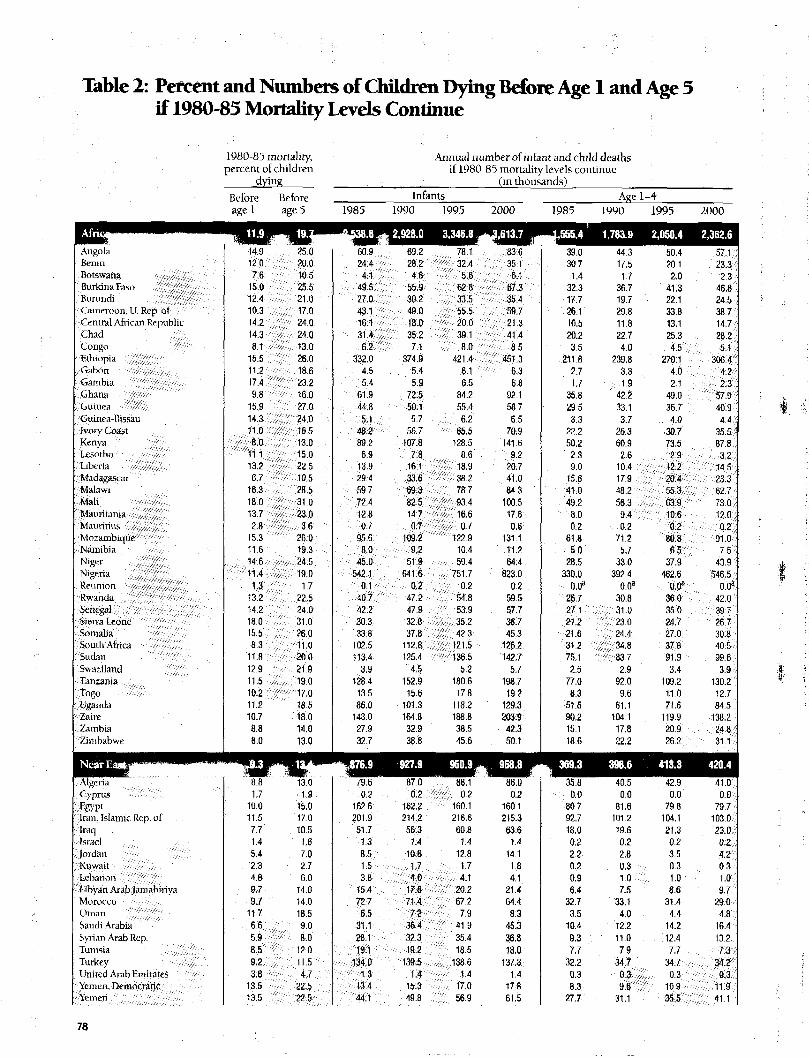
Table 2: Percent and Numbers of Children Dying before Age 1 and Age 5if 1980-85 Mortality Levels Continue 78
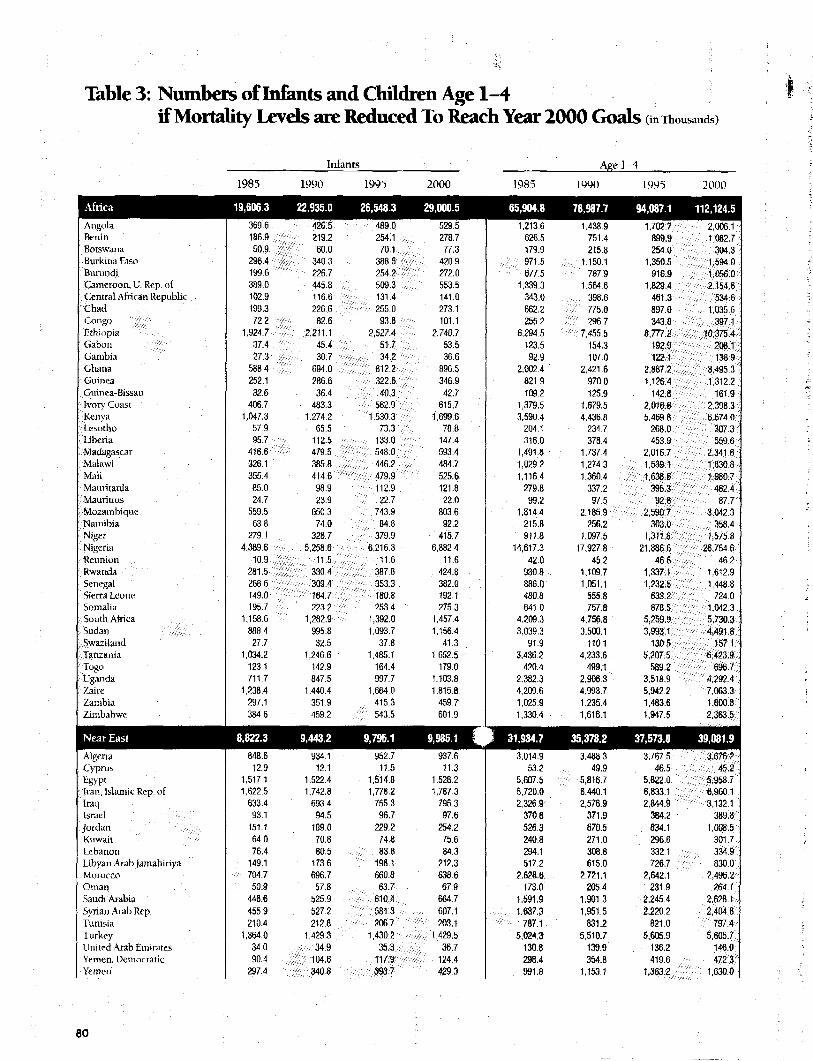
Table 3: Numbers of Infants and Children Age 1-4 if Mortality Levelsare Reduced to Reach Year 2000 Goals 80
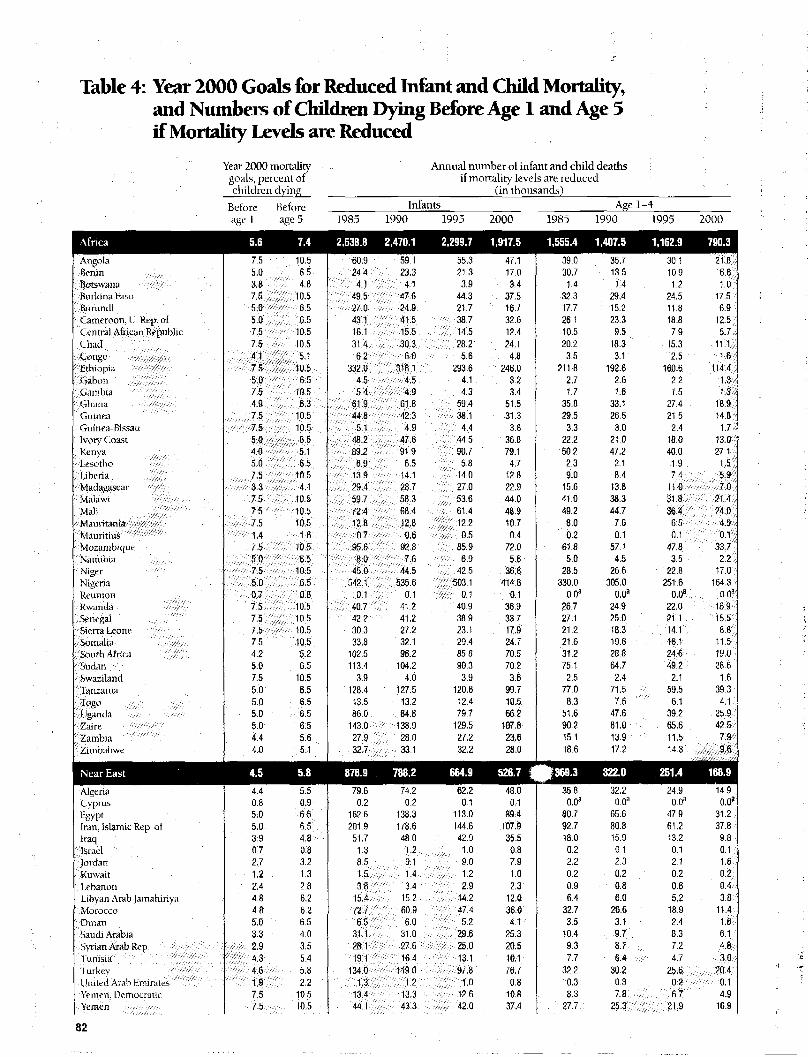
Table 4: Year 2000 Goals for Reduced Infant and Child Mortality, andNumbers of Children Dying before Age 1 and Age 5 if MortalityLevels are Reduced 82
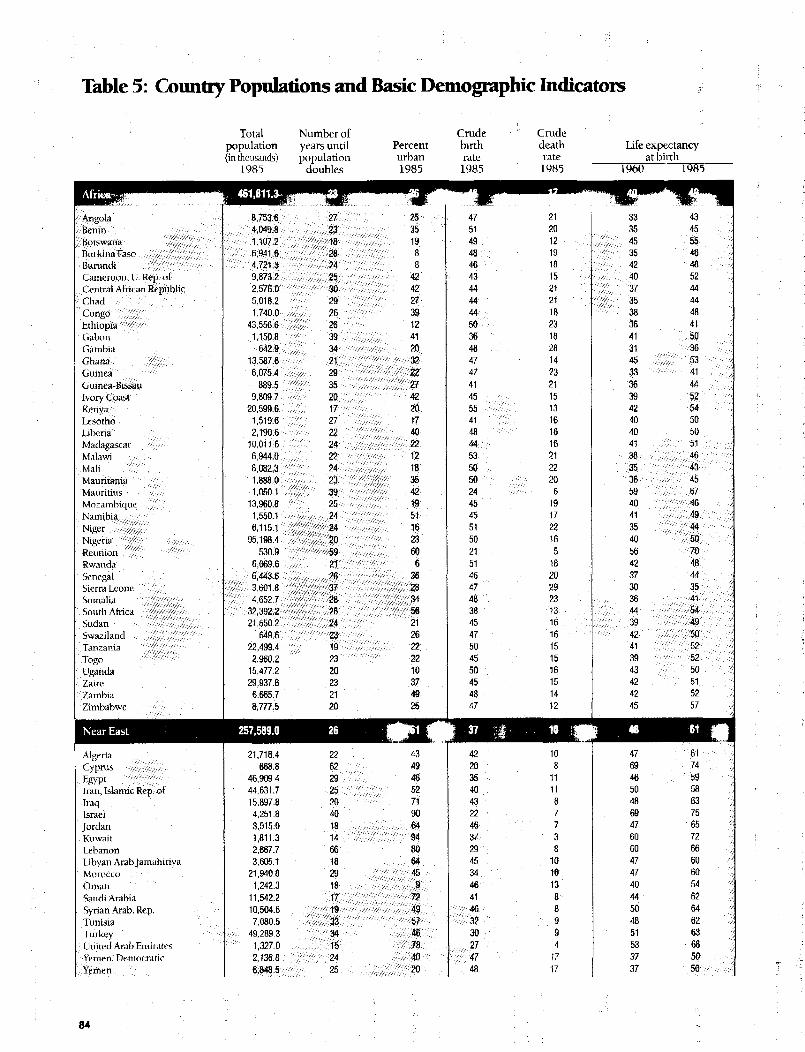
Table 5: Country Populations and Basic Demographic Indicators 84
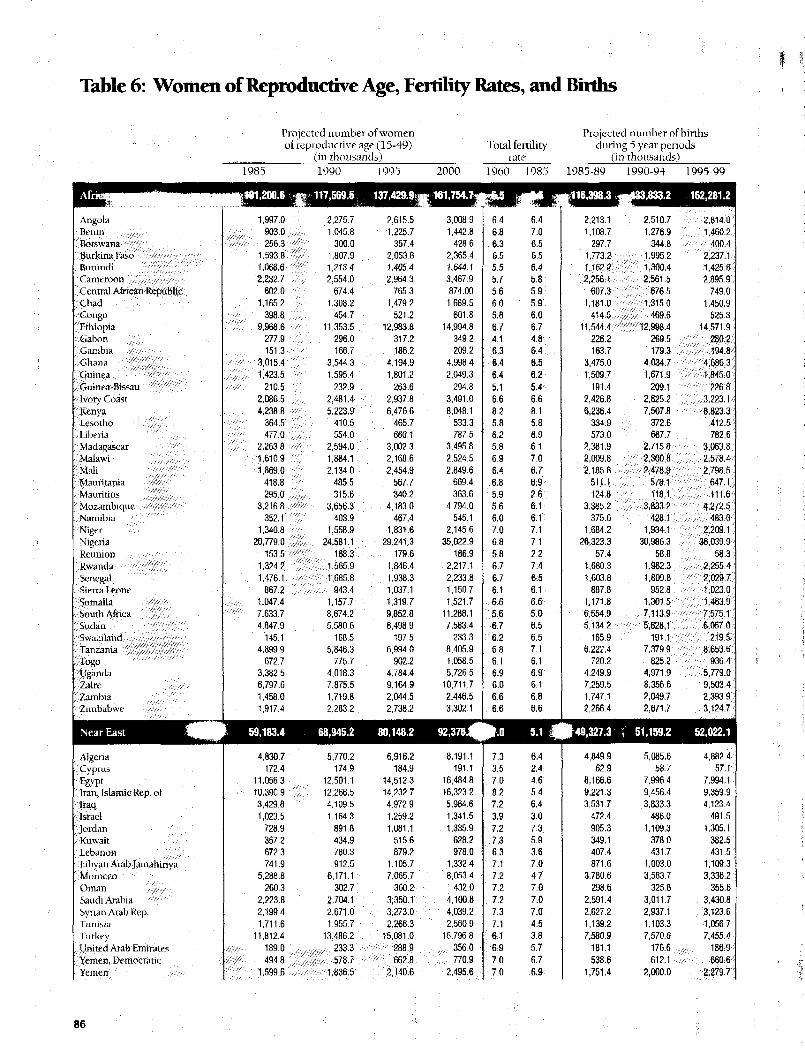
Table 6: Women of Reproductive Age, Fertility Rates, and Births 86
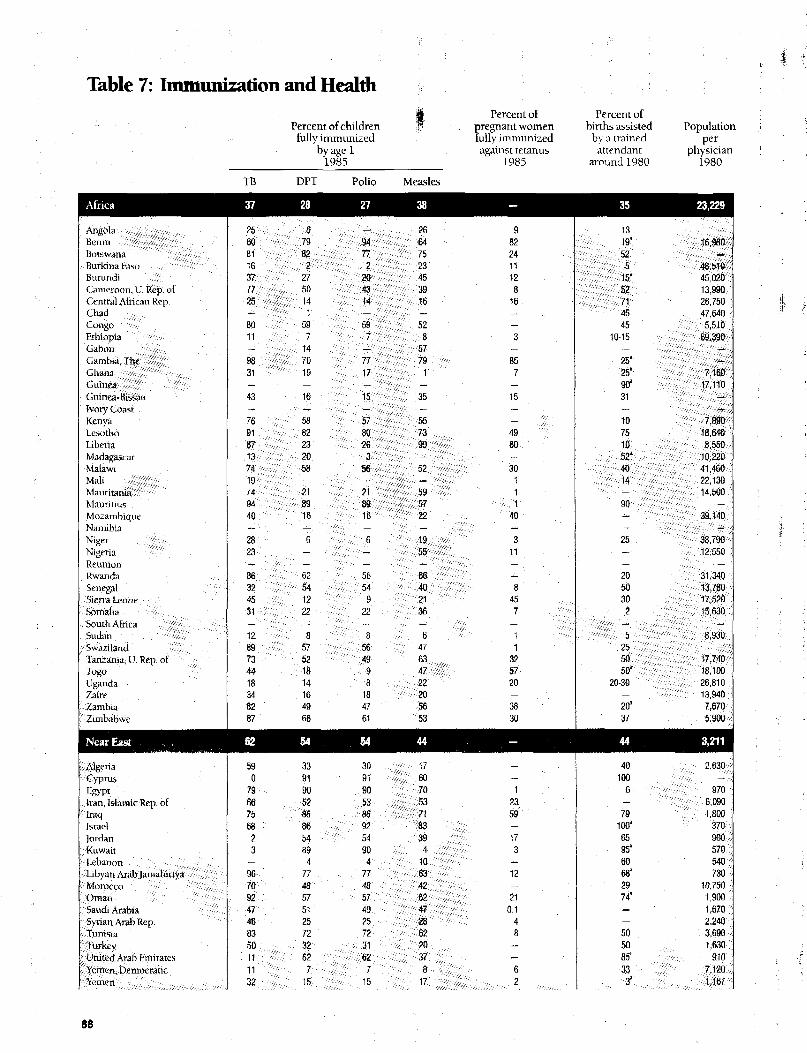
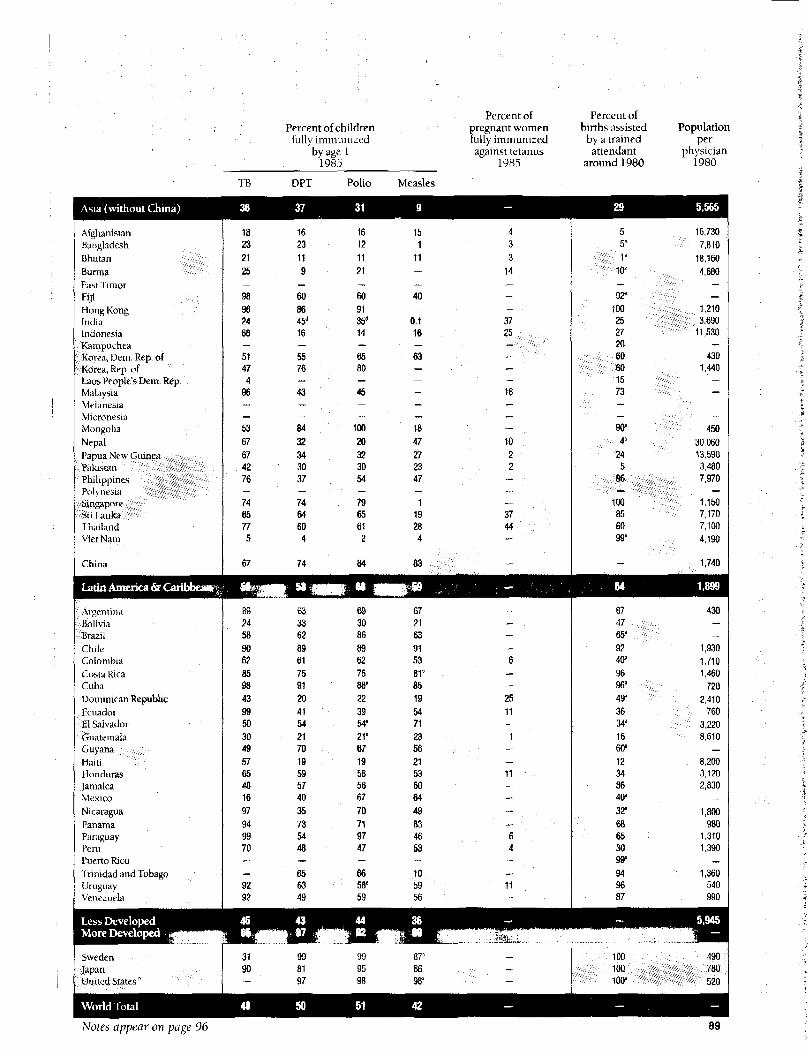
Table 7: Immunization and Health 88
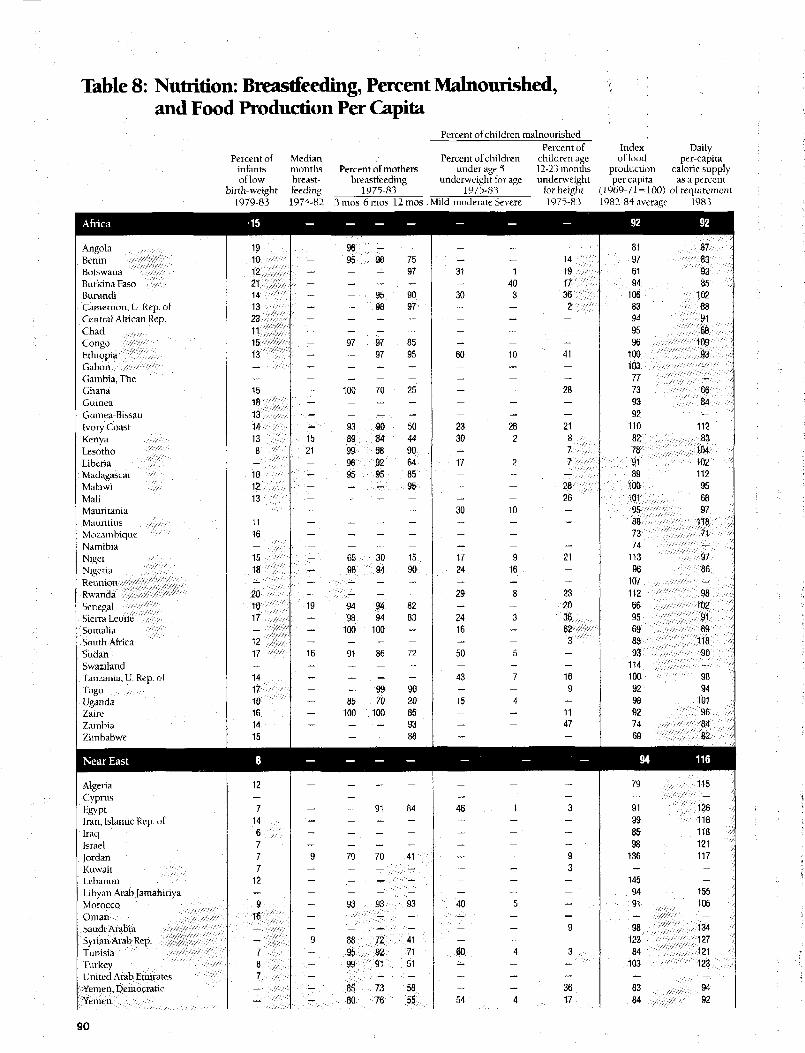
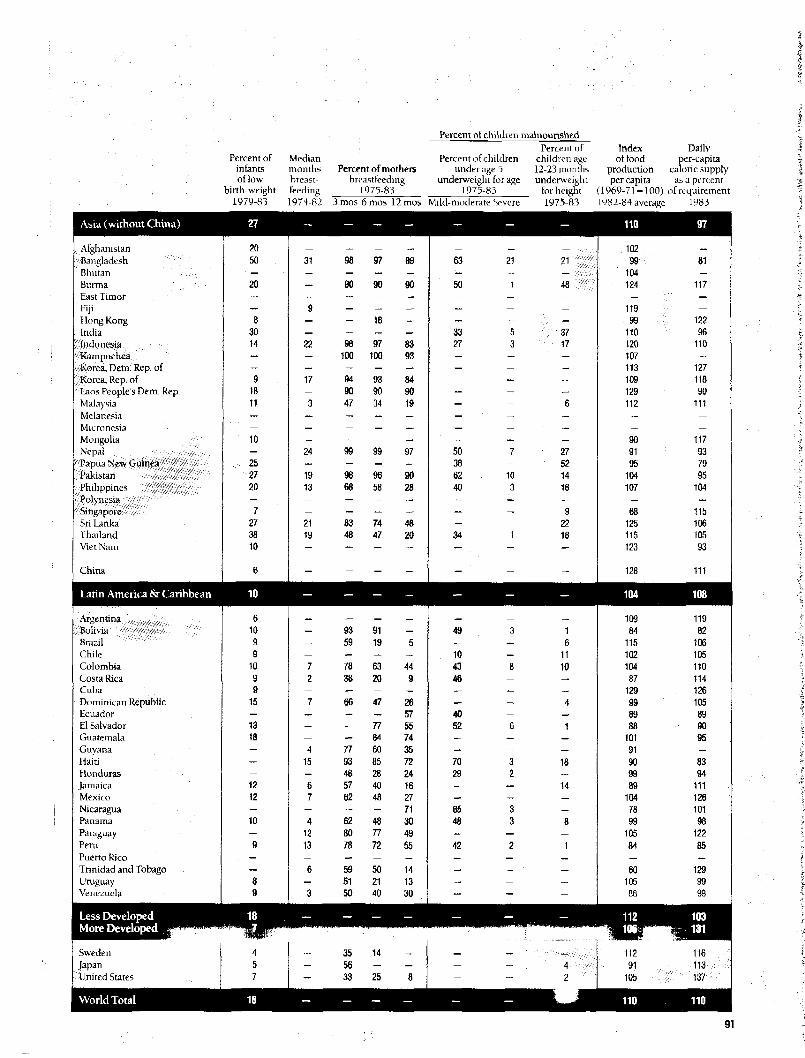
Table 8: Nutrition: Breastfeeding, Percent Malnourished, and Food
Production Per Capita 90
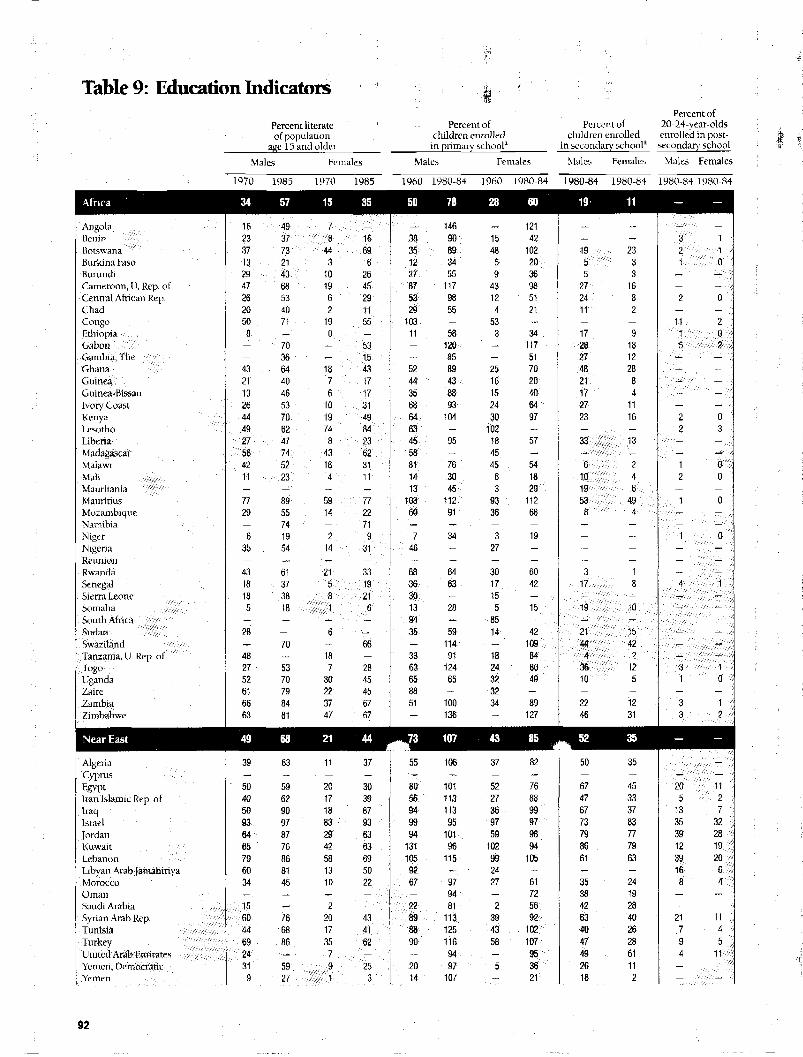
Table 9: Education Indicators 92
Table 10: Economic and Water and Sanitation Indicators 94
Appendix 2: Methodology of Projections 97
Appendix 3: Definitions and Sources of Data 98
Appendix 4: Countries and Regions 101
list of Figures
I PAGEFigure 1-A Percent of Total Population Under Age 5 by Region 6
Figure 1-B Numbers of Children Under Age 5 by Region at 1980-85Mortality Levels and at Goals lor Year 2000 Reduced MortalityLevels 6
Figure 1-C Number of Child Deaths at 1985 Mortality Levels and atReduced Mortality Levels 7
Figure 2-A Diarrhea Mortality as a Proportion of Mortality from All Causes:Rural Bangladesh 10
Figure 2-B Estimated Annual Episodes of Childhood Diarrhea and AverageNumber of Days of Diarrheal Illness—Developing Regions andSelected U.S. Example 11
Figure 2-C Estimated Median Diarrheal Episodes Per Year by Age 12
Figure 2-D Oral Rehydration Solution 13
Figure 2-E Estimated Access and Use of ORT in Developing Regions 14
Figure 2-F Impact of Hygiene Education on the Incidence and Duration ofDiarrheal Illness: Guatemala 15
Figure 3-A Annual Child Deaths from Vaccine-Preventable Diseases and
Deadis Prevented by Immunization in Developing Countries 16
Figure 3-B Neonatal Mortality With and Without Health Intervention 17
Figure 3-C Measles Case Fatality Rates by Age—Percent of Infected
Children Who Die From Measles—West Africa 18
Figure 3-D Immunization Coverage by Region—Percent of 1-Year-Olds Fully Immunized 19
Figure 3-E Immunization Coverage and Incidence of Immunizable Diseasesfor Selected Developing Countries, 1974-1984 20
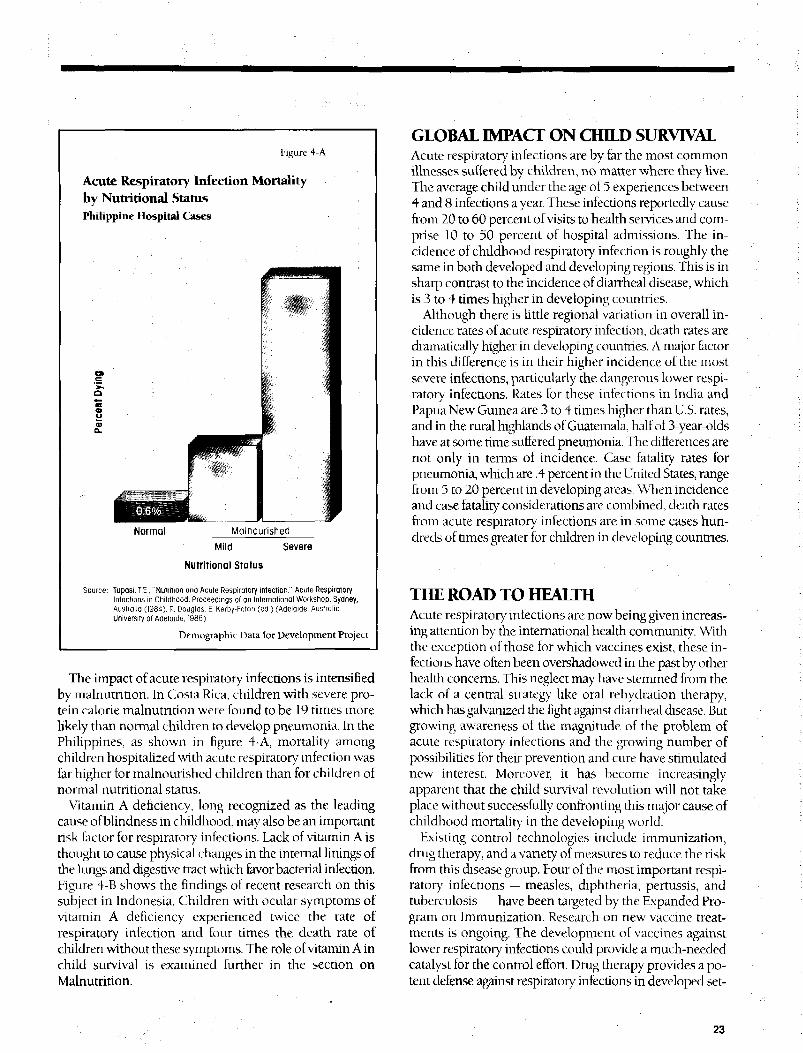
Figure 4-A Acute Respiratory Infection Mortality by Nutritional Status-Philippine Hospital Cases 23
Figure 4-B Incidence of Acute Respiratory Infection Among Children Withand Without Ocular Symptoms of Vitamin A Deficiency:Indonesia : 24
Figure 5-A The Life Cycle of Malaria 25
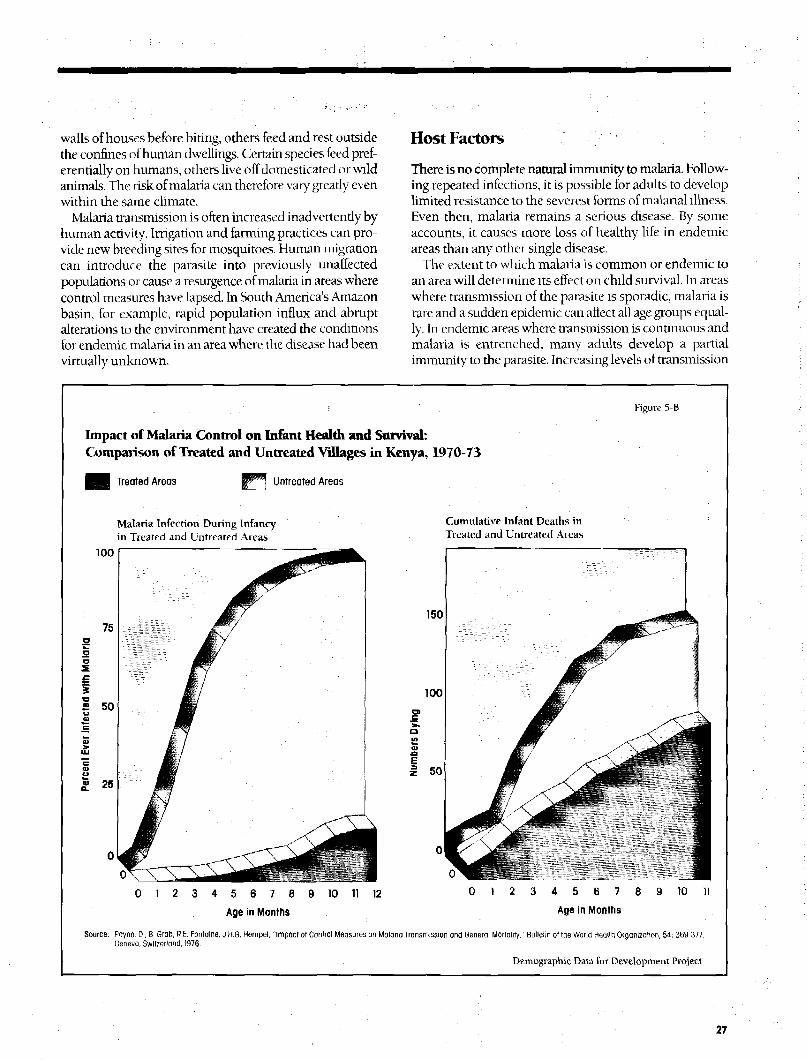
Figure 5-B Impact of Malaria Control on Infant Health and Survival:Comparison of Treated and Untreated Villages in Kenya,1970-1973 27
Figure 5-C Global Trends in Malaria: Number of Cases Reported, 1974-1984 28
Figure 3-D Regional Trends in Malaria: Number of Cases Reported,1974-1984 29
Figure 6-A Risk of Death by Nutritional Status: Children Age 1 - 36 Months 31
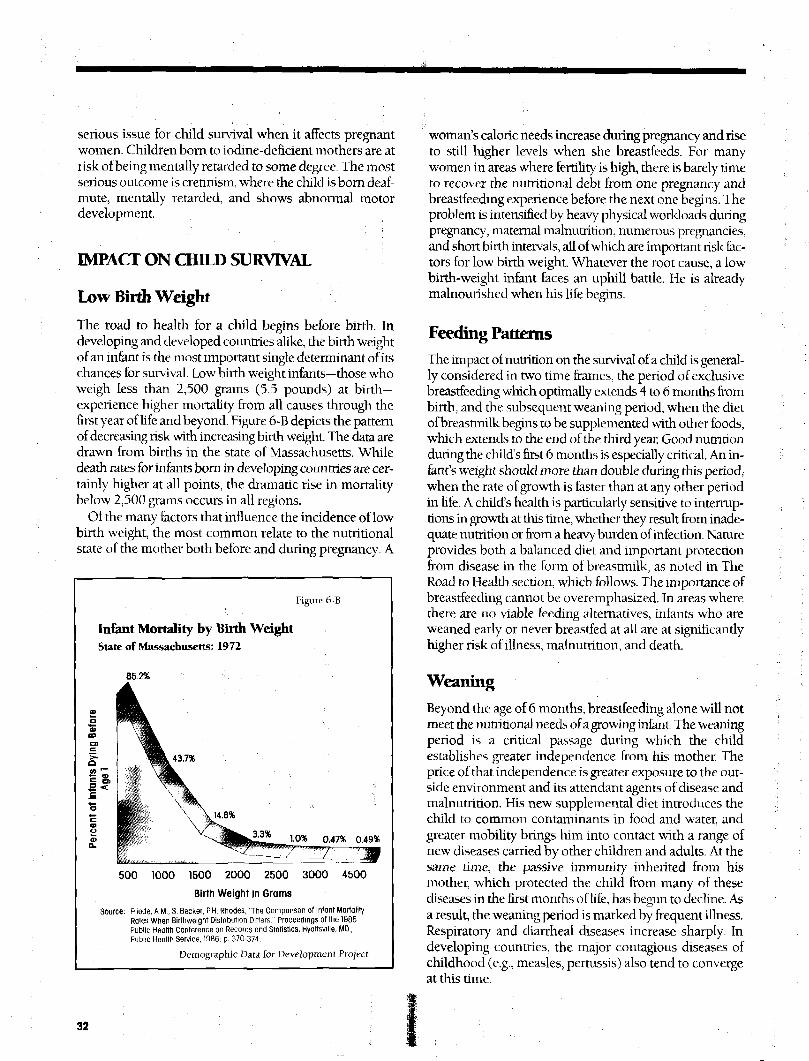
Figure 6-B Infant Mortality by Birth Weight 32
PAGEFigure 6-C Regional Patterns of Acute Protein-Calorie Malnutrition 33
Figure 6-D Estimates of Childhood Malnutrition in Developing Regions,1980 34
Figure 6-E Percent Low Birth Weight: U.S. and Developing Regions, 1982 35
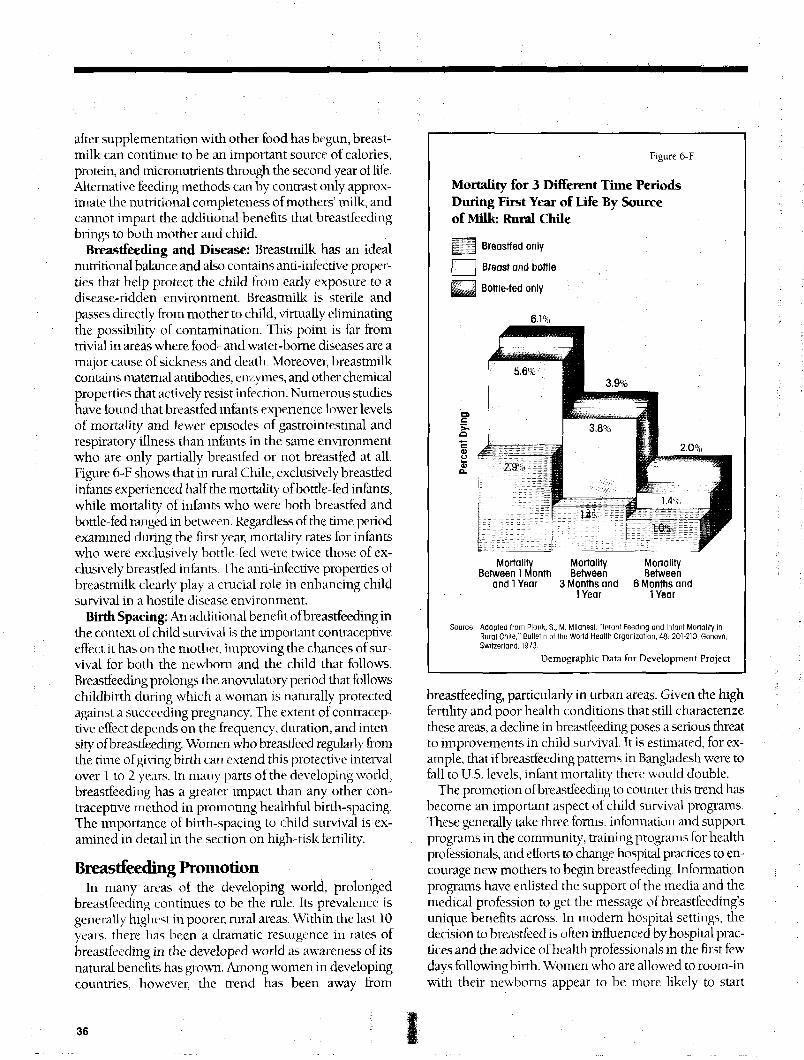
Figure 6-F Mortality lor 3 Different Time Periods During First Year of LifeBy Source of Milk: Rural Chile 36
Figure 6-G Impact of Breastfeeding Promotion: Two Examples fromCosta Rica 37
Figure 6-H The Road to Health: Model Growth Chart 38
Figure 7-A Percent of Births Close to Another Birth 39Figure 7-B Percent of Children Who Die Before Age 5, When Births are
Spaced at Least 2 Years Apart, and When a Preceding and/orFollowing Birth Occurs Within 2 Years 39
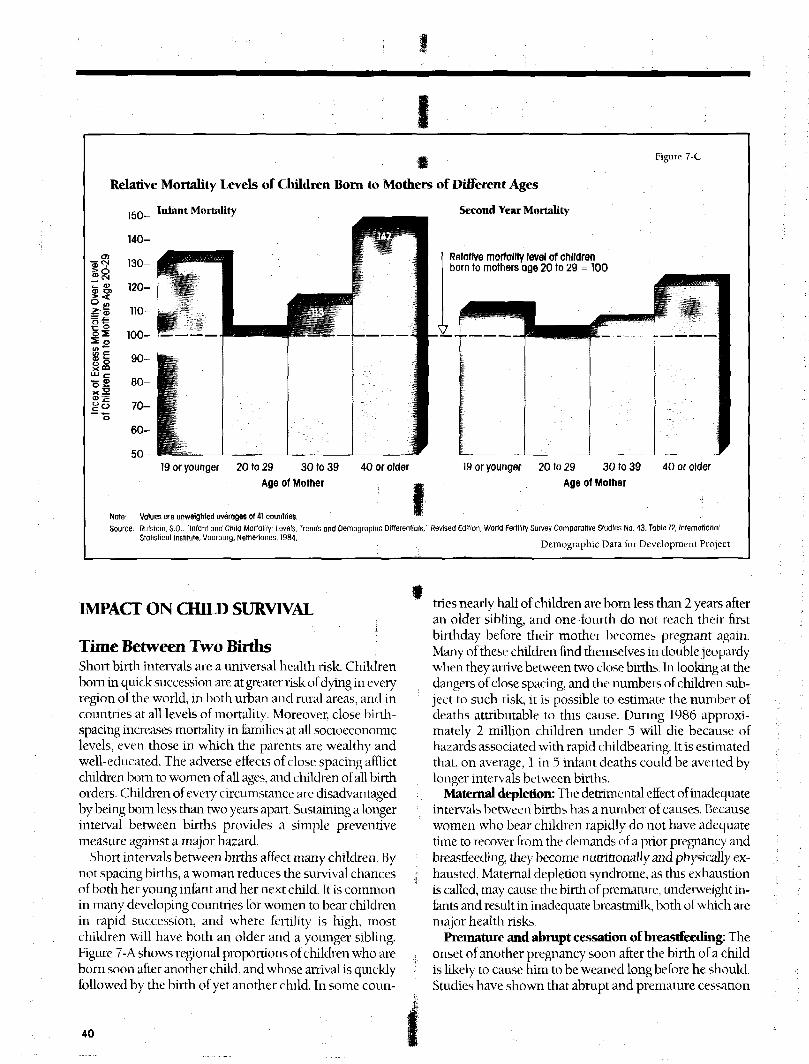
Figure 7-C Relative Mortality Levels of Children Born to Mothers ofDifferent Ages ... 40
Figure 7-D Percent of Women Age 20-24 Who Had at Least One Birth as aTeenager 41
Figure 7-E Relative Mortality Levels of Children by Birth Order 42
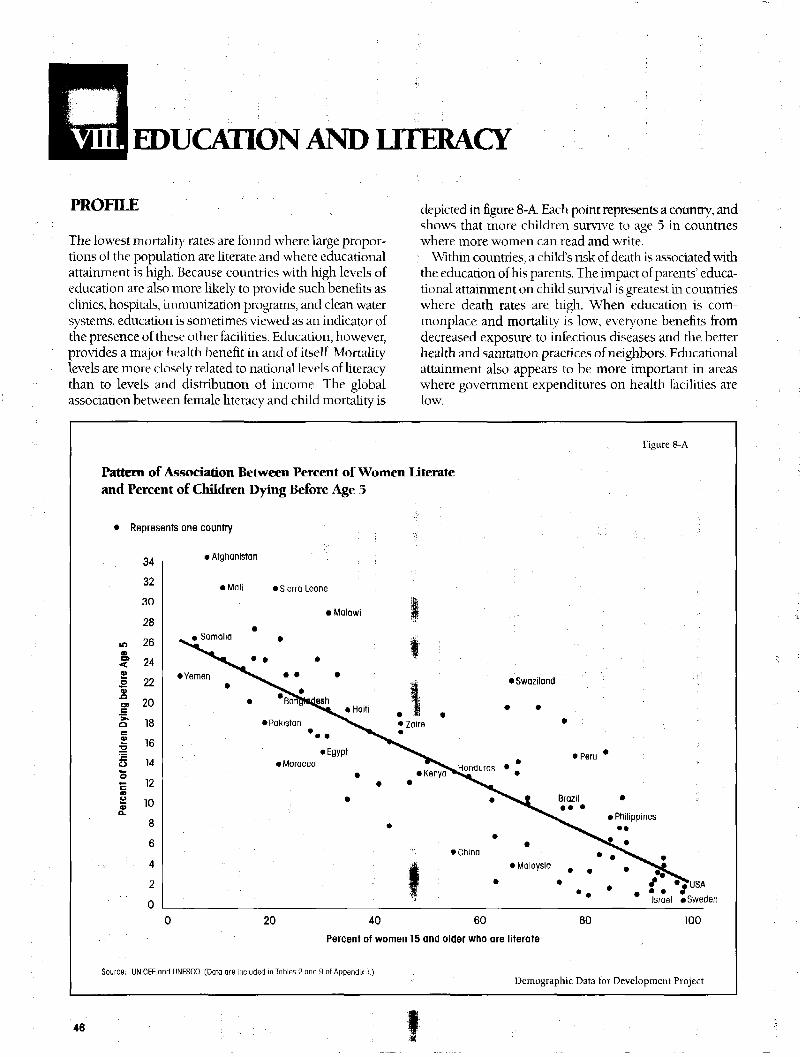
Figure 8-A Pattern of Association Between Percent of Women Literate andPercent of Children Dying Before Age 5 46
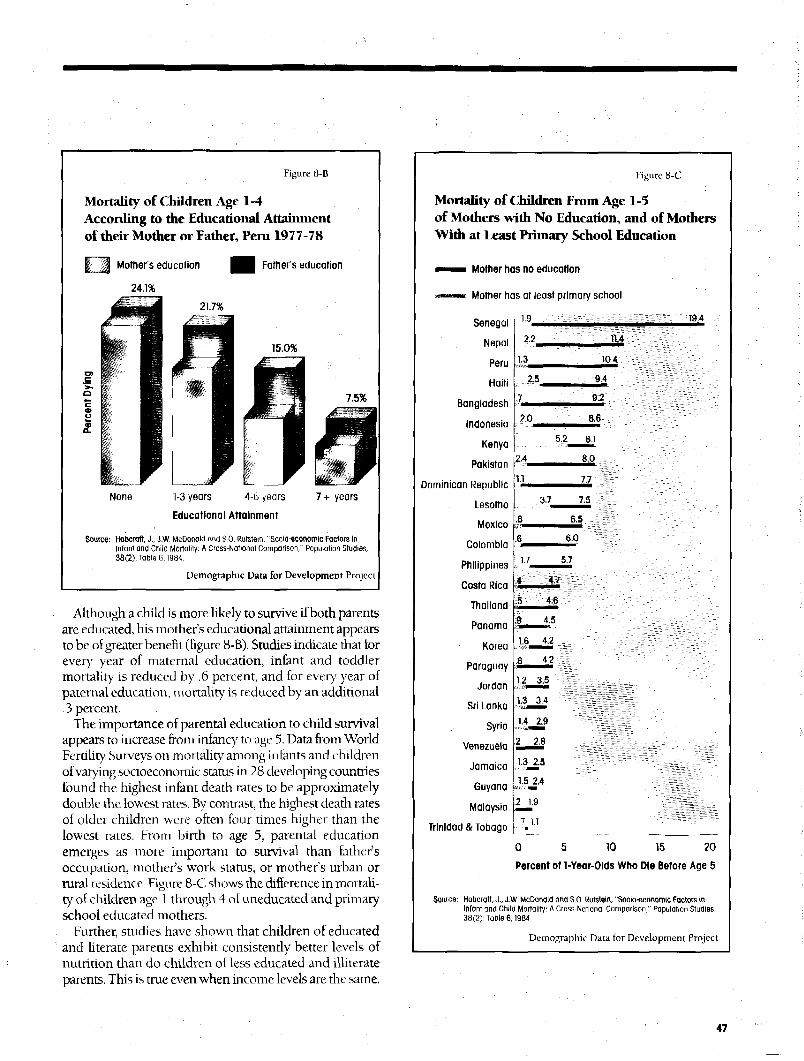
Figure 8-B Mortality of Children Age 1-4 According to the EducationalAttainment of their Mother or Father, Peru 1977-78 47
Figure 8-C Mortality of Children Age 1-5 of Mothers with No Education,and Mothers with at Least Primary School Education 47
Figure 8-D Percent of Adult Women Who Ever Attended School,Distributed by Highest Level Ever Attended: Kenya 1979 48
Figure 8-E Percent of Men and Women Who Can Read and Write 49
Figure 8-F Percent of Boys and Girls Who Attended Primary School in
1970 and 1980-84 49
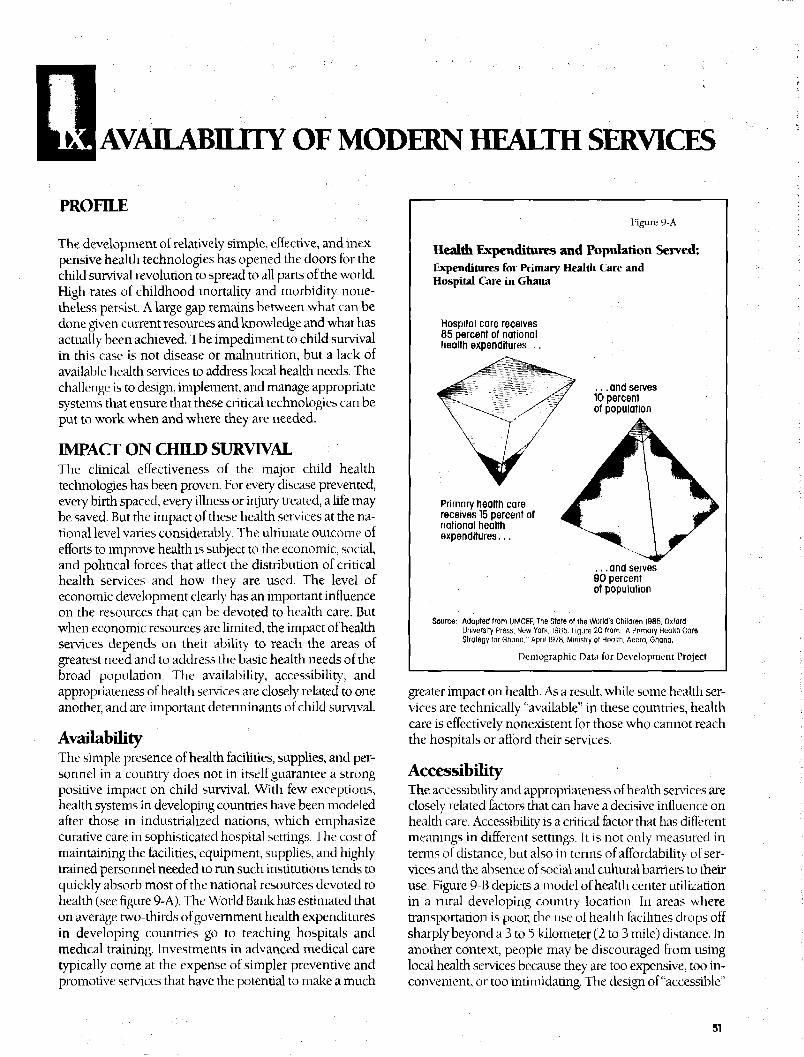
Figure 9-A Health Expenditures and Population Served 51
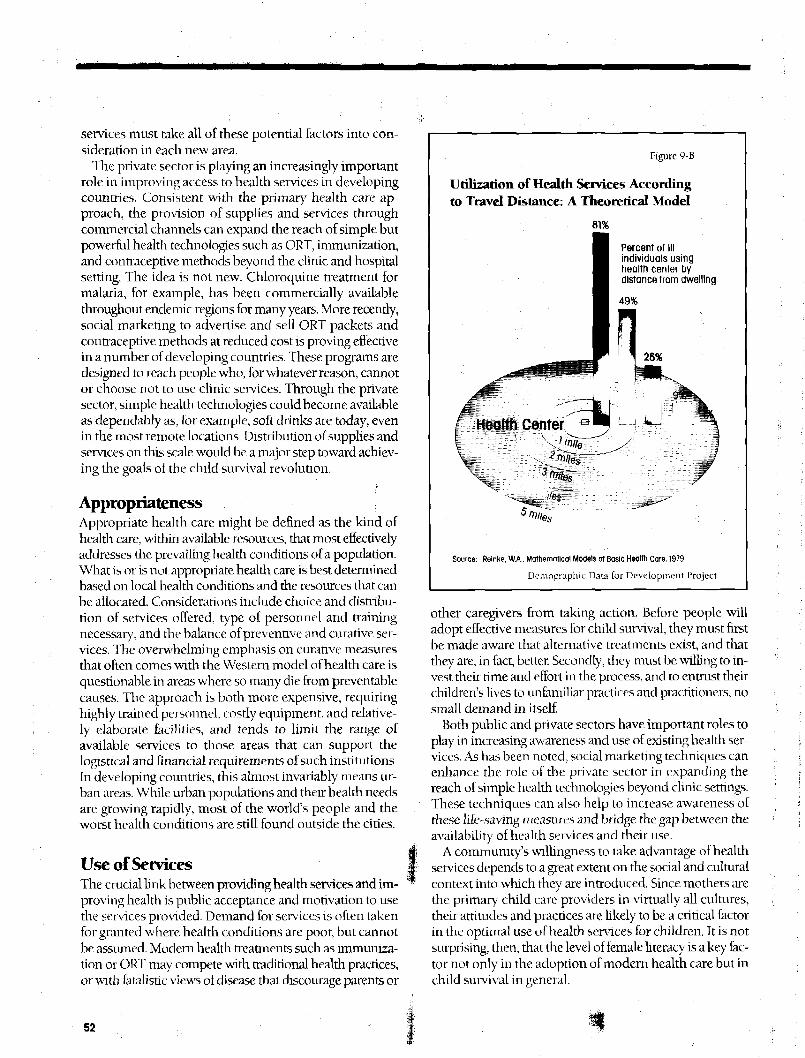
Figure 9-B Utilization of I Iealdi Services According to Travel Distance 52
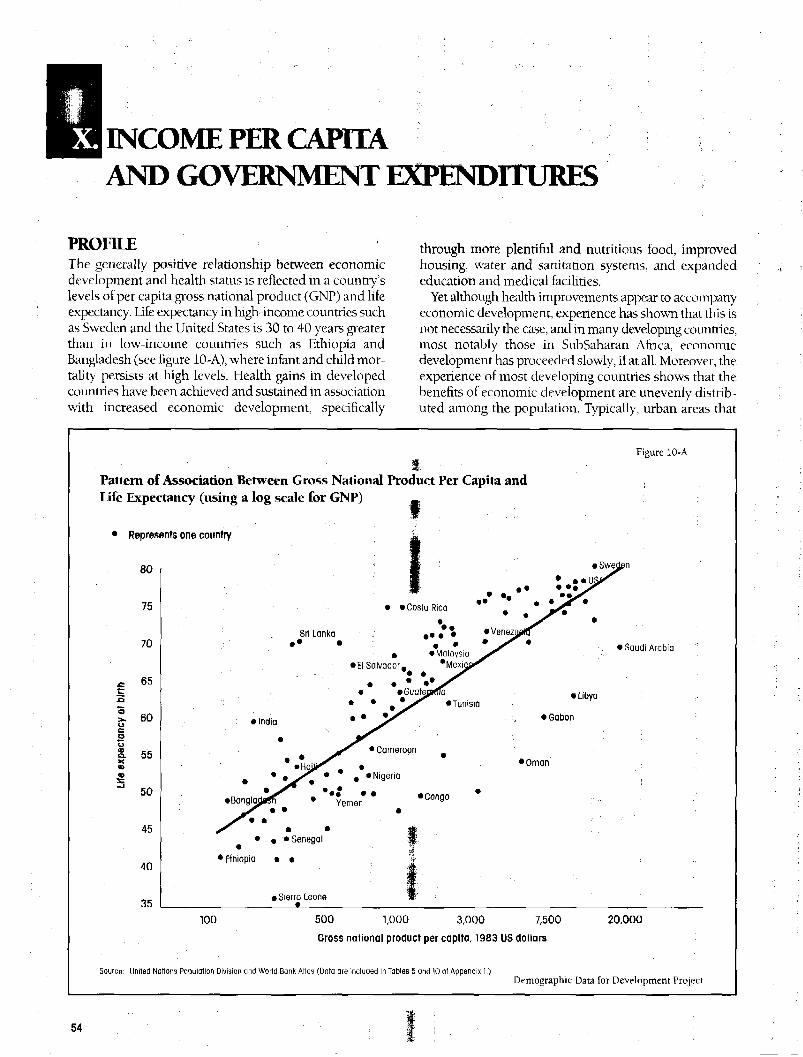
Figure 10-A Pattern of Association Between Gross National Product PerCapita and Life Expectancy 54
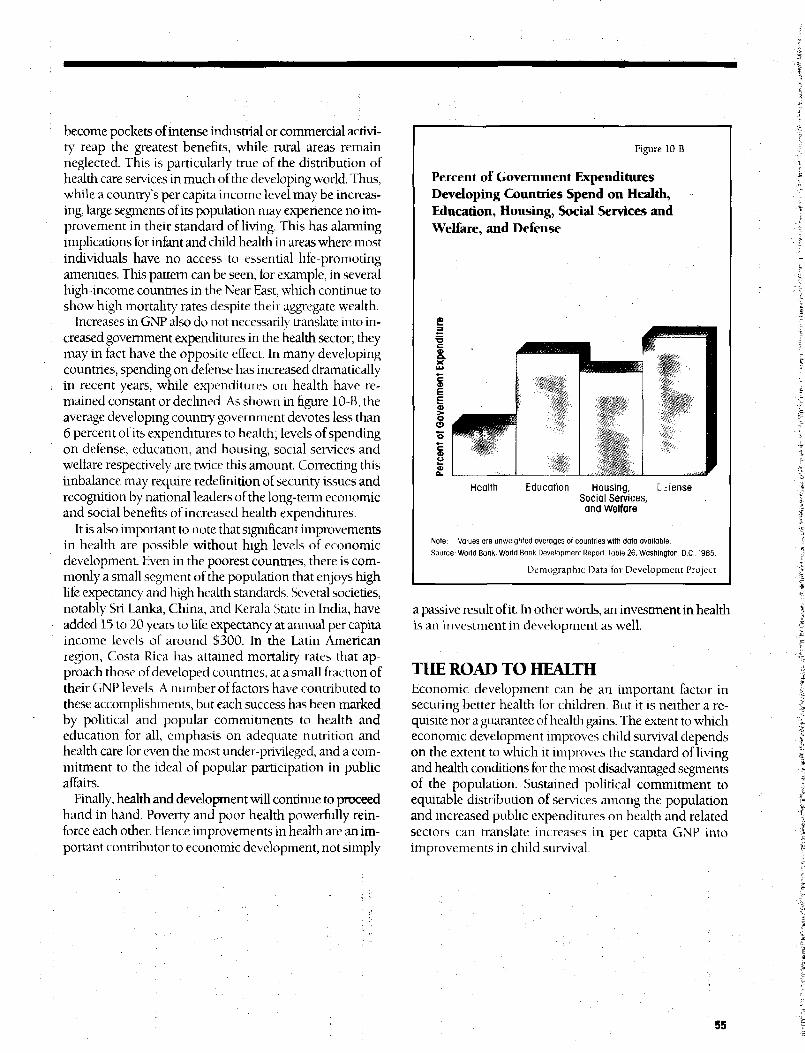
Figure 10-B Percent of Government Expenditures Developing CountriesSpend on Health, Education, Housing, Social Services andWelfare, and Defense 55
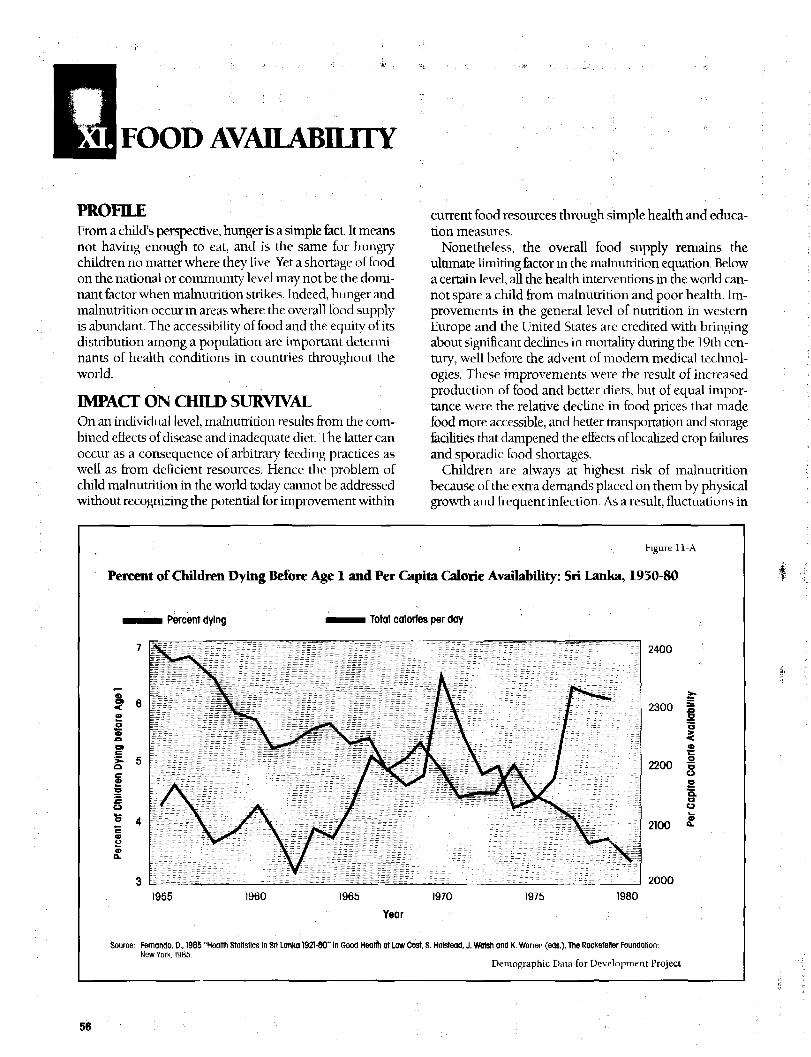
Figure 11-A Percent of Children Dying Before Age 1 and Per Capita CalorieAvailability: Sri Lanka, 1950-80 56
Figure 12-A Percent of Population widi Access to Safe Water and SanitationFacilities 59
list of MapsPAGE
Map 1A World Child Mortality Rates !' 8
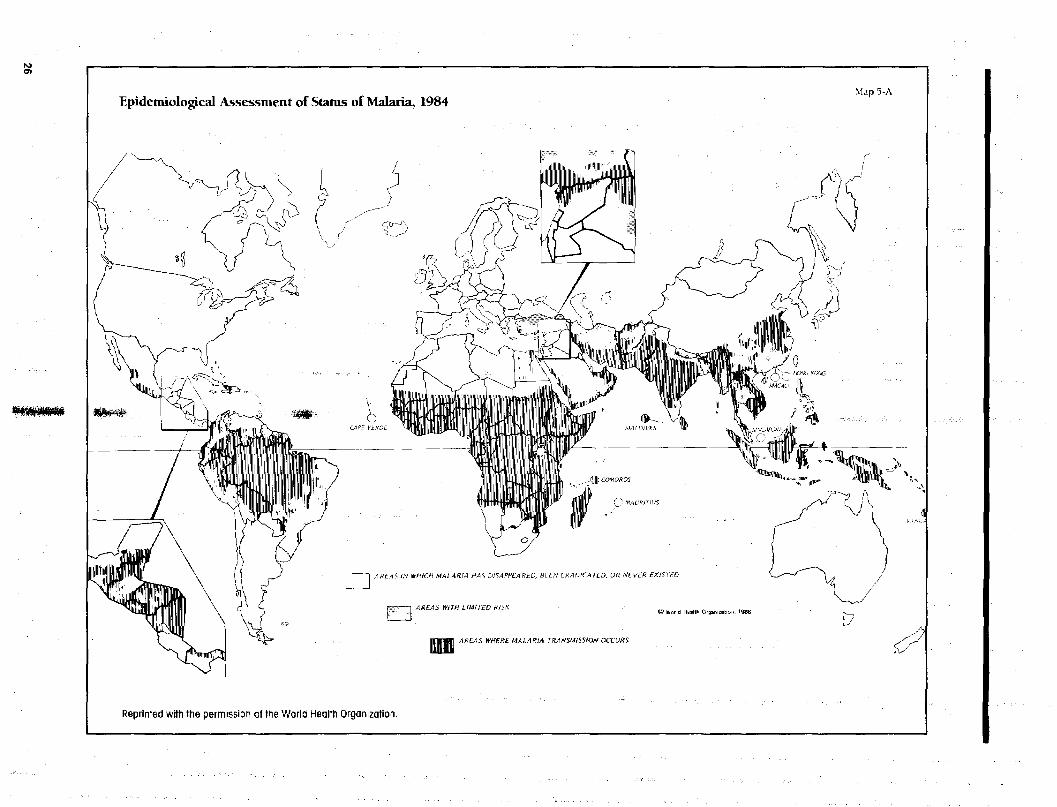
Map 5A Epidemiological Assessment of Status of Malaria, 1984 , 26
Map 11A 1983 Per Capita Food Production as a Percent of 1969 to 1971Production 57
list of Fact SheetsPAGE
Fact Sheet 1 Child Mortality and Numbers of Deaths by Region
A: Deaths of Children Under Age 5 as a Percent of All Deaths,
:. 1985 3
B: Percent of Deaths Occurring in Each Region, 1985 3
C: Percent of Children Dying Before Age 1 and Before Age 5 3
Fact Sheet 2 Births by Region
A: Percent of World Births Occurring in Each Region 4
B: Number of Births During 1985-2000 4
C: Average Number of Children Women Bear 4
D: Number of Women of Reproductive Age, 1985-2000 4
Fact Sheet 3 Geographic Inequalities in Child MortalityA: Mortality of Children of Urban, Educated, Professional
Parents, and of Rural, Uneducated, Agricultural Parents 5
B: Percent of Children Dying Before Age 5: Range and Average
for Regions and Selected Countries 5
C: Percent of Children Dying Before Age 5: Range and Average
for Rural and Urban Areas of Selected Countries 5
list of Tables |PAGE
Tahle 7A Percent of Married Women Age 15-44 Who Do Not Want toBecome Pregnant and Who Know About and Use Contraception 43
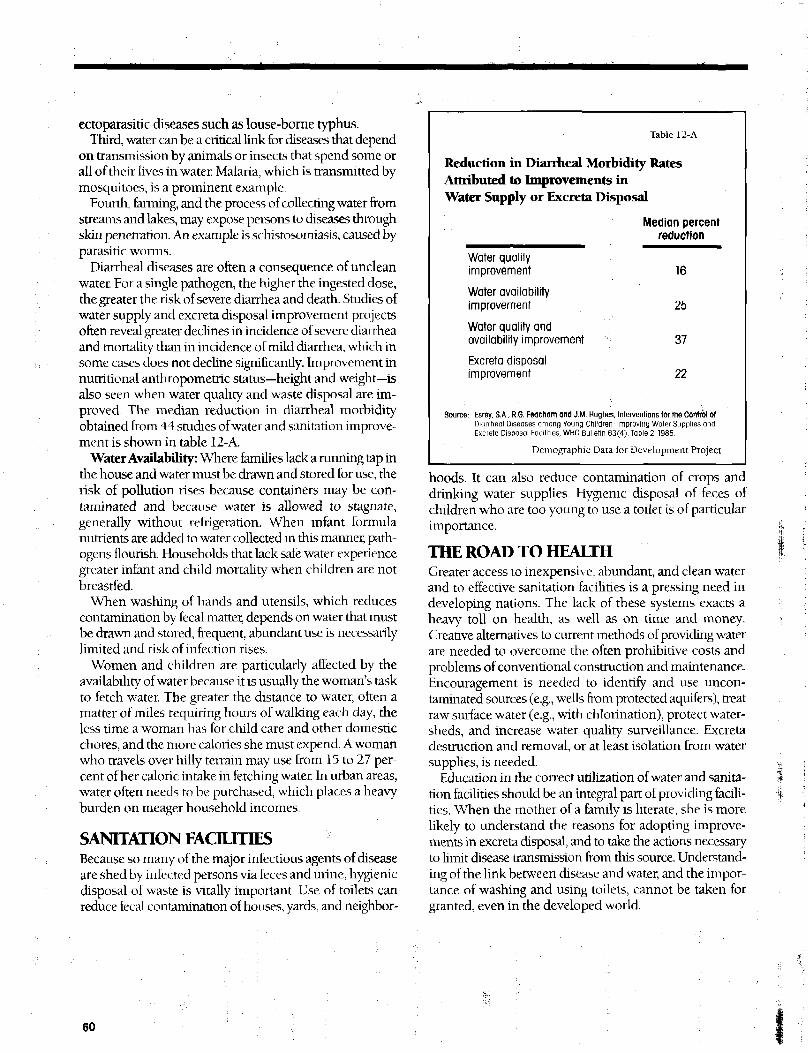
Table 12A Reduction in Diarrheal Morbidity Rates Attributed toImprovements in Water Supply or Excreta Disposal 60
World Patterns andRates of Child Survival
WORLD PATTERNS AND RATESOF CHILD SURVIVAL
A child bom in one of the high-mortality African and Asiancountries today is on average 20 times more likely to diebefore reaching age 5 than a child born in the United States,japan, or Sweden. The "accident" of geographic location ofbirth—and the risk of dying that accompanies this accident—have little or nothi ng to do with genetic inheritance andnothing at all to do with choice by the child. The level ofchildhood mortality in developing countries signals bothalarm and opportunity: alarm because of the startlinglygreater risk of death children face in these countries; oppor-tunity because we have the means at hand to dramaticallyreduce childhood mortality.
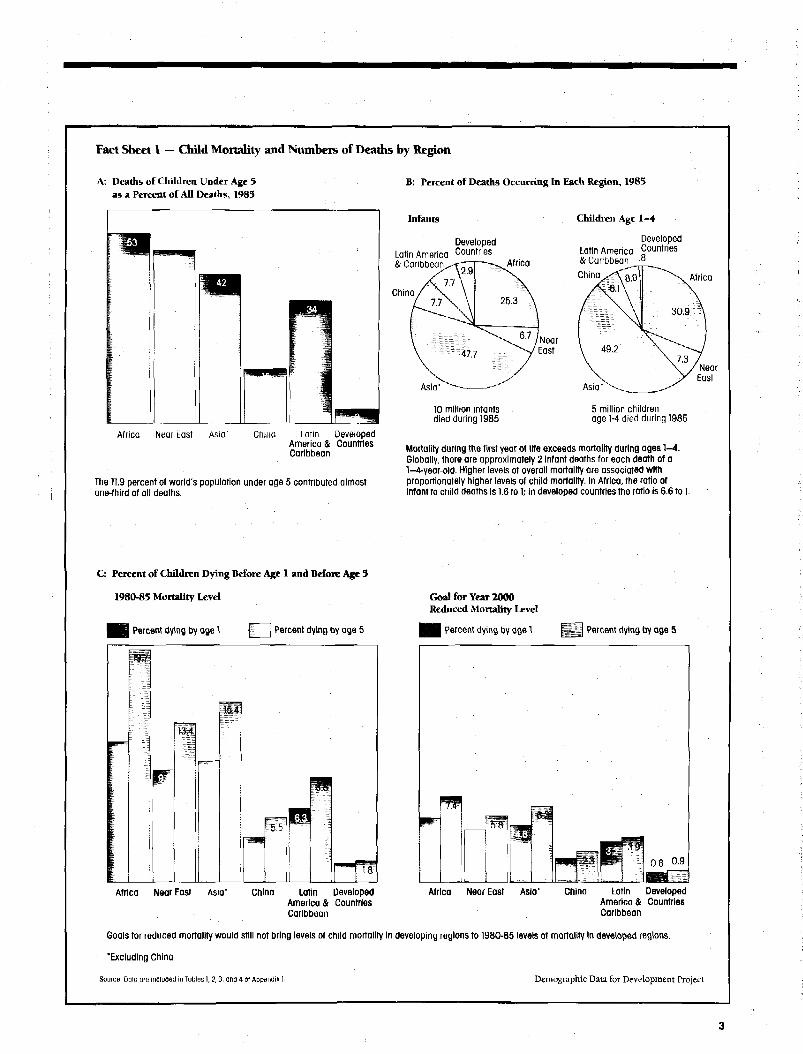
The scarcity and uneven distribution of health facilitiesand services and the marginal economic and human re-sources that invite infant and childhood disease occurwithin distinct world and country boundaries, as shown inFact Sheet 1. Of every 100 children born in Africa, 12 diebefore age 1; 10 of every 100 infants die in Asia, 9 in theNear Hast, and 6 in Latin America and the Caribbean. InJapan and Sweden, by contrast, fewer than 1 percent ofnewboms fail to reach their first birthday. The U.S. rate isslighdy higher than 1 percent; the average for all developedcountries is closer to 2 percent. The death of a child, arelatively rare tragedy for parents in developed countries,is a frequent occurrence in the developing world. In Egypt,for example, two-thirds of women experience the death ofone or more children by age 50.
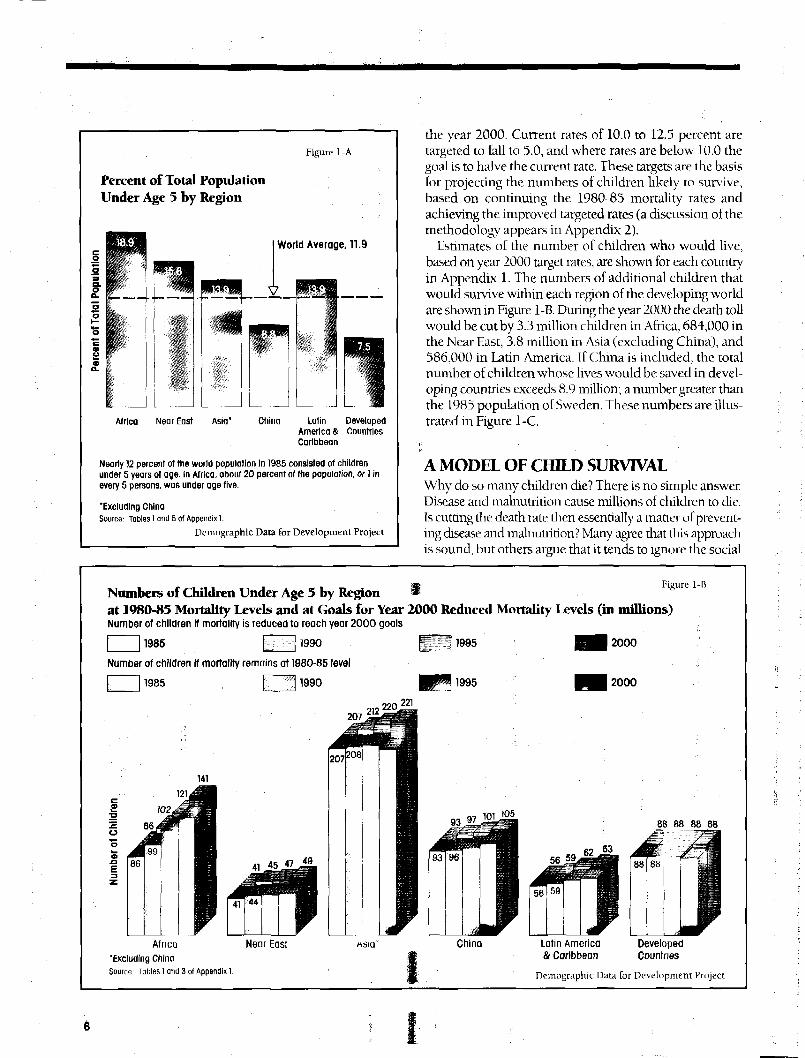
In 1985 there were 570 million children under 5 in theworld, a total higher than the population of the Africancontinent. They account for almost 12 percent of theworld's total population, as seen in Figure 1 -A. During the15 years between 1985 and 2000, approximately 2 billionchildren are projected to be born. Of this number, 87 per-cent (1.8 billion) will be born in the developing world. At1980-85 levels of infant and child mortality in these coun-tries, 240 million of these children can be expected to diebefore age 5. If mortality levels were instead comparable tothose of developed countries, 87 percent, or 207 million ofthese children, would live. This is a child population almostas large as the total number of inhabitants in 1985 of theUnited Kingdom, West Germany, France, and Poland.
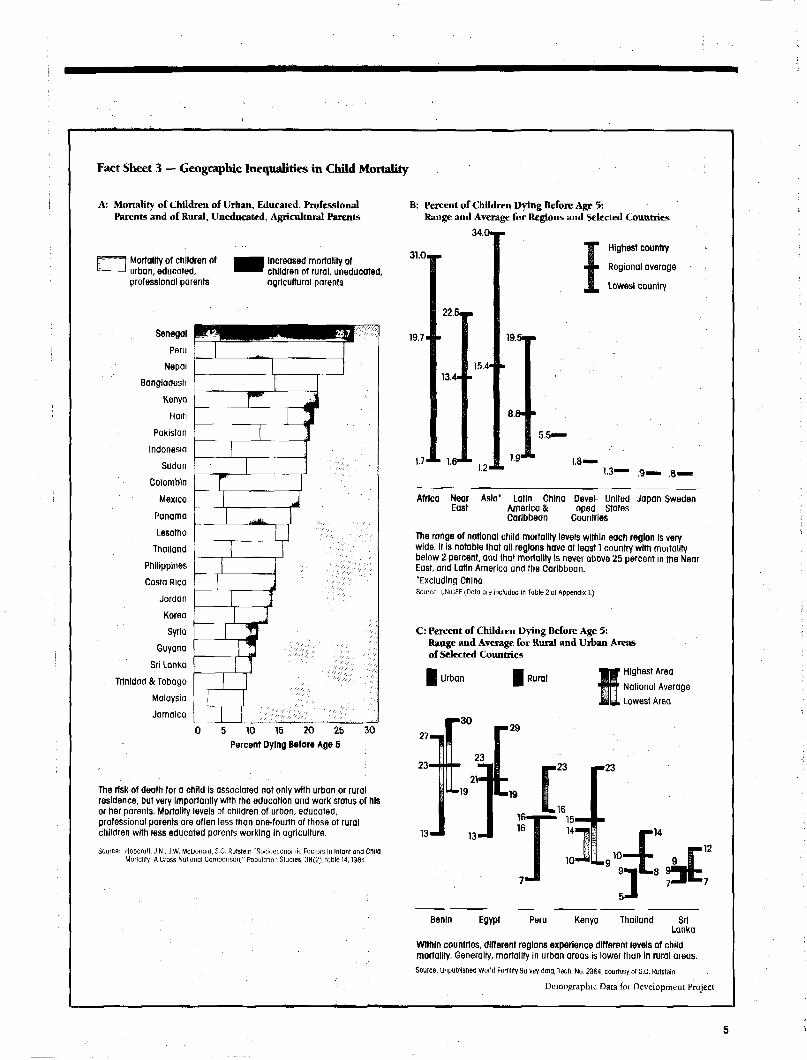
The wide variations in nsk of death between developedand developing regions are also seen within regions. Whi lenearly 20 percent of all African children die before reachingage 5, this proportion rises to 31 percent in Sierra Leoneand falls to a relatively low 13 percent in Zimbabwe. Varia-tions among countries within world regions are shown inFact Sheet 3.
' Large differences i n levels of childhood mortality oftenoccur within the same country. Regional differences withincountries are often as large or larger than those betweencountries and world regions. Consistent differences arefound both between urban and rural areas of countries andamong the urban and rural areas themselves. As shown inFact Sheet 3, the risk of dying before age 5 in a rural area canbe twice that of an urban area in die same country. Further,the highest mortality levels found in urban areas within acountry are often higher than the levels of better-off ruralareas.
These dramatic differences in levels of infant and child-hood mortality underlie worldwide concern for the tremen-dous inequities in children's opportunities to survive andbe healthy. Yet these geographical inequities are in onesense cause for hope. Although a country may be locatedin a developing region, it does not necessarily follow thatit will have high child mortality rates; some countries ineach region already have relatively low rates. Moreover,varying rates within countries indicate that low childhoodmortality can and is being achieved.
The major impediments to child survival have beenidentified, as have many strategies for removing these im-pediments. Infectious and parasitic diseases, malnutrition,and the risks associated with high levels of fertility are themajor obstacles. Because they flourish in poverty, lastingsolutions to these problems may require long-term socio-economic development. Nonetheless, for every major im-pediment to child survival, we now have the means, withincurrent resources, to rapidly and dramatically reduce theterrible burden of illness and death on the world's children.Among the most effective are oral rehydration therapy,mother and child immunizations, and wider spacing ofbirths, which can save millions of lives and prevent untoldsuffering in developing countries between now and the endof the century.
MORTALITY REDUCTION TARGETSIncreased understanding of the various impediments andthe possibilities for their removal, heightened by theremarkable achievements of child survival projects invarious countries, is stimulating national and internationalefforts to lower childhood death rates. Of the various targetslor reductions in infant and child mortality by the year2000 that have been suggested, this report uses the follow-ing: In countries where rates of infant mortality are above12.5 percent, the target is to reduce this number to 7.5 by
Fact Sheet I — Child Mortality and Numbers of Deaths by Region
B: Percent of Deaths Occurring In Each Region, 1985
Infants
A: Deaths of Children Under Age 5as a Percent of All Deaths, 1985
DevelopedLatin America Countries& Caribbean.
China
Africa
Africa Near East Asia' China Latin DevelopedAmerica & CountriesCaribbean
The 11.9 percent of world's population under age 5 contributed almostone-third of all deaths.
Children Age 1-4
DevelopedLatin America Countries& Caribbean °
China Africa
NearEast
Asia' Asia"
NearEast
10 million infantsdied during 1985
5 million childrenage 1-4 died during 1985
Mortality during the first year of life exceeds mortality during ages 1-4.Globally, there are approximately 2 Infant deaths for each death of a1-4-year-old. Higher levels of overall mortality are associated withproportionately higher levels of child mortality. In Africa, the ratio ofInfant to child deaths is 1.6 to 1; In developed countries the ratio Is 6.6 to 1.
C: Percent of Children Dying Before Age 1 and Before Age 3
1980-83 Mortality Level
Percent dying by age 1 Percent dying by age 5
Africa Near East Asia' China Latin DevelopedAmerica & CountriesCaribbean
Goal for Year 2000Reduced Mortality Level
| H Percent dying by age 1 | J . ' . ,1 Percent dying by age 5
mm
rflF 0.8 0.9
Africa Near East Asia* China Latin DevelopedAmerica & CountriesCaribbean
Goals for reduced mortality would still not bring levels of child mortality in developing regions to 1980-85 levels of mortality in developed regions.
'Excluding China
Source: Data are included in Tobies 1,7,3, and 4 of Appendix 1. Demographic Data for Development Project
Fact Sheet 2 — Births by Region
A: Percent of World Births Occurring in Each Region
f~~\ 1985-1990 p ^ 1990-1995 | | § g 1995-2000
B: Number of Births During 1985-2000(in thousands)
DevelopedCountries268,073
LatinAmerica &Caribbean194,314
Africa402,513
,127
China312,163
Africa Near East Asia' China Latin DevelopedAmerica & CountriesCaribbean
Including China, more than 50 percent of the world's children areprojected to be born in Asia between 1985 and 2000 . Due to anincreasing number of women of childbearing oge and high birth rates,the percentage of the worlds children born in Africa Is expected toincrease rapidly.
C: Average Number of Children Women Bear
% 6 . 6 1
mgm4.2 I 3.9'3$
1 ;
Africa Near East Asia' China Latin DevelopedAmerica & CountriesCaribbean
Fertility of women In developing countries Is almost twice that of womenIn developed countries. In some African countries women bear enoughchildren to replace their generation fourfold, while In some Europeancountries and the United States, fertility is below replacement level.
'Excluding ChinaSource United Nations (Data are Included in Table 6 of Appendix I.)
Near East152,509
Asia"711,838
More than 2 billion children are projected to be born In the worldbetween 1985 and 2000 . Some 87 percent, or 1.8 billion, will be born indeveloping countries.
D: Number of Women of Reproductive Age:1985-2000 (in millions)
1985 [~] 1990 1995 2000
503
453
404
357
92
346334
312
276
312309
302296r-f
Africa Near East Asia" China Latin DevelopedAmerica & CountriesCaribbean
The number of women of reproductive age will increase through the endof the century, reflecting momentum from higher birth rates In the past.As a result, the total number of births occurring each year Is projected togrow, despite overall declines in fertility taking place In all regions of theworld.
Demographic Data for Development Project
Fact Sheet 3 — Geographic Inequalities in Child Mortality
A: Mortality of Children of Urban, Educated, ProfessionalParents and of Rural, Uneducated, Agricultural Parents
P 1 Mortality of children ofk— - 1 urban, educated,
professional parents
Senegal
Peru
Nepal
Bangladesh
Kenya
Haiti
Pakistan
Indonesia
Sudan
Colombia
Mexico
Panama
Lesotho
Thailand
Philippines
Costa Rica
Jordan
Korea
Syria
Guyana
Sri Lanka
Trinidad & Tobago
Malaysia
Jamaica
I Increased mortality of' children of rural, uneducated,
agricultural parents
f5 10 15 20 25
Percent Dying Before Age 5
30
The risk of death for a child Is associated not only with urban or ruralresidence, but very Importantly with the education and work status of hisor her parents. Mortality levels of children of urban, educated,professional parents are often less than one-fourth of those of ruralchildren with less educated parents working In agriculture.
Source: Hobcroll. J.N., J.W, McDonald, 5.0. Rjfsfein "Socioeconomic Factors in Infant ana ChildMortality: A Cross Notional Comparison," Population Studies, 38(2), Table 14,1984
B; Percent of Children Dying Before Age 5:Range and Average for Regions and Selected Countries
3 4 . 0 M
Highest country
Regional average
Lowest country
31.0,
19.7-
1.7
22.5—
13.415.4
1.2'
19.5—
8.8" •
5.5—
1.81.3 .8.
Africa Near Asia" Latin China Devel- United Japan SwedenEast America & oped States
Caribbean Countries
The range of national child mortality levels within each region Is verywide. It is notable that all regions have at least 1 country with mortalitybelow 2 percent, and that mortality Is never above 25 percent in the NearEast, and Latin America and the Caribbean.'Excluding ChinaSource: UNIUEF (Data ore included In Table 2 of Appendix 1.)
C: Percent of Children Dying Before Age 5:Range and Average for Rural and Urban Areasof Selected Countries
U r b a n Rural1 Highest Area1 National Average
, Lowest Area
• 29
23
13
Benin Egypt Peru Kenya Thailand SriLanka
Within countries, different regions experience different levels of childmortality. Generally, mortality in urban areas is lower than in rural areas.
Source: Unpublished World Fertility Survey data, Teen. No. 2364, courtesy ol s.o. Rutstein.
Demographic Data for Development Project
Figure 1-A
Percent of Total PopulationUnder Age 5 by Region
World Average, 11.9
Africa Near East Asia* China Latin DevelopedAmerica & CountriesCaribbean
Nearly 12 percent of the world population In 1985 consisted of childrenunder 5 years of age. In Africa, about 20 percent of the population, or 1 inevery 5 persons, was under age five.
"Excluding ChinaSource: Tables 1 and 6 of Appendix 1.
Demographic Data for Development Project
the year 2000. Current rates of 10.0 to 12.5 percent aretargeted to fall to 5.0, and where rates are below 10.0 thegoal is to halve the current rate. These targets are the basisfor projecting the numbers of children likely to survive,based on continuing the. 1980-85 mortality rates andachieving the improved targeted rates (a discussion of themethodology appears in Appendix 2).
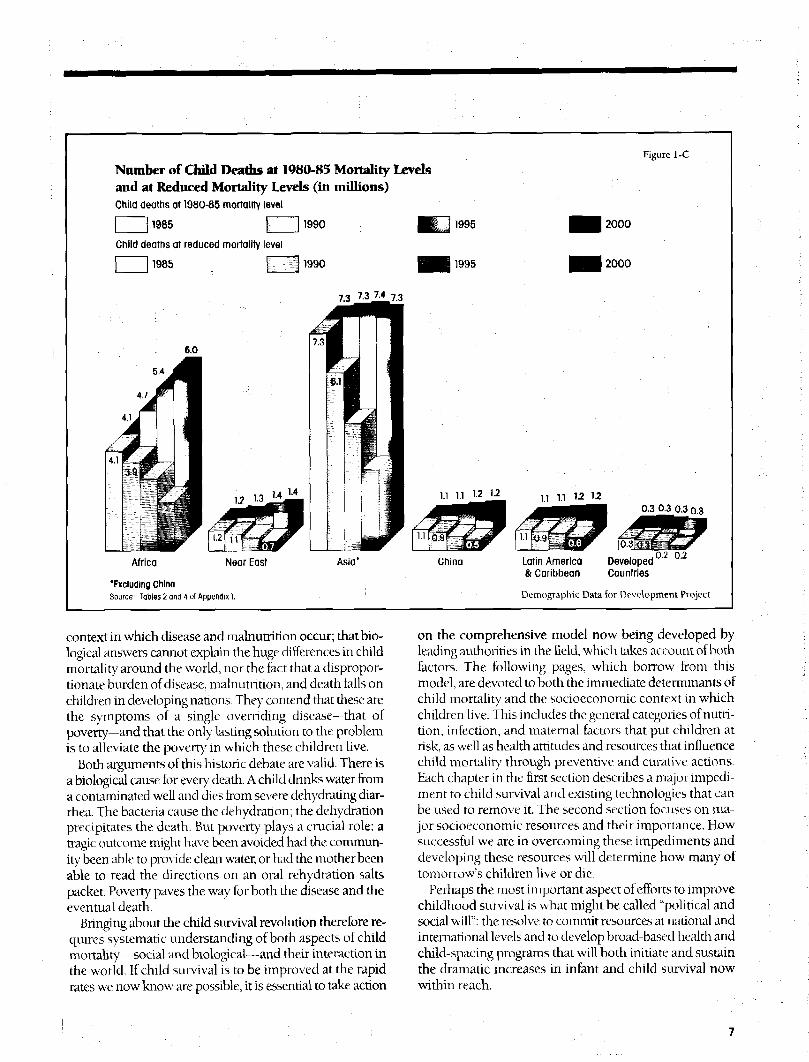
listimates of the number of children who would live,based on year 2000 target rates, are shown for each countryin Appendix 1. The numbers of additional children thatwould survive within each region of the developing worldare shown in Figure 1-B. During the year 2000 the death tollwould be cut by 3.3 million children in Africa, 684,000 inthe Near Hast, 3.8 million in Asia (excluding China), and586,000 in Latin America. If China is included, the totalnumber of children whose lives would be saved in devel-oping countries exceeds 8.9 million; a number greater thanthe 1985 population of Sweden. These numbers are illus-trated in Figure 1-C.
A MODEL OF CHILD SURVIVALWhy do so many children die? There is no simple answer.Disease and malnutrition cause millions of children to die.Is cutting the death rate then essentially a matter of prevent-ing disease and malnutrition? Many agree that this approachis sound, but others argue that it tends to ignore the social
Numbers of Children Under Age 5 by Regionat 1980-85 Mortality Levels and at Goals for Year 2000 Reduced Mortality Levels (in millions)Number of children if mortality is reduced to reach year 2000 goals
| 11985 M ^ j 1990 •
Number of children if mortality remains at 1980-85 level
| 11985 ; KZB 199° W^ 1995 •• B M 2000
, 221
Figure 1-B
Li J1995 2000
Africa
'Excluding ChinaSource: Tables 1 and 3 of Appendix 1.
Latin America& Caribbean
DevelopedCountries
Demographic Data for Development Project
Number of Child Deaths at 1980-85 Mortality Levelsand at Reduced Mortality Levels (in millions)Child deaths at 1980-85 mortality level
| 11985 I ] 1990
Child deaths at reduced mortality level
| | 1985 | 11990
Figure 1-C
1995
1995
6.0
54
Africa Near East Asia' China
'Excluding ChinaSource: Tables 2 and 4 of Appendix).
Latin America Developed& Caribbean Countries
0-2 0.2
Demographic Data for Development Project
context in which disease and malnutrition occur; that bio-logical answers cannot explain the huge differences in childmortality around the world, nor the fact that a dispropor-tionate burden of disease, malnutrition, and death falls onchildren in developing nations. They contend that these arethe symptoms of a single overriding disease—thaL ofpoverty—and that the only lasting solution to the problemis to alleviate the poverty in which these children live.
Both arguments of this historic debate are valid. There isa biological cause for every death. A child drinks water froma contami nated well and dies from severe dehydrating diar-rhea. The bacLeria cause the dehydration; the dehydrationprecipitates the death. But poverty plays a crucial role: atragic outcome might have been avoided had the commun-ity been able to provide clean water, or had the mother beenable to read the directions on an oral rehydration saltspacket. Poverty paves the way for both the disease and theeventual death.
Bringing about the child survival revolution therefore re-quires systematic understanding of both aspects of childmortality—social and biological—and their interaction inthe world. If child survival is to be improved at the rapidrates we now know are possible, it is essential to take action
on the comprehensive model now being developed byleading authorities in the field, which takes account of bothfactors. The following pages, which borrow from thismodel, are devoted to both the immediate determinants ofchild mortality and the socioeconomic context in whichchildren live. This includes the general categories of nutri-tion, infection, and maternal factors that put children atrisk, as well as health attitudes and resources that influencechild mortality through preventive and curative actions.Each chapter in the first section describes a major impedi-ment to child survival and existing technologies that canbe used to remove it. The second section focuses on ma-jor socioeconomic resources and their importance. Howsuccessful we are in overcoming these impediments anddeveloping these resources will determine how many oftomorrow's children live or die.
Perhaps the most important aspect of efforts to improvechildhood survival is what might be called "political andsocial will": the resolve to commit resources at national andinternational levels and to develop broad-based health andchild-spacing programs that will both initiate and sustainthe dramatic increases in infant and child survival nowwithin reach.
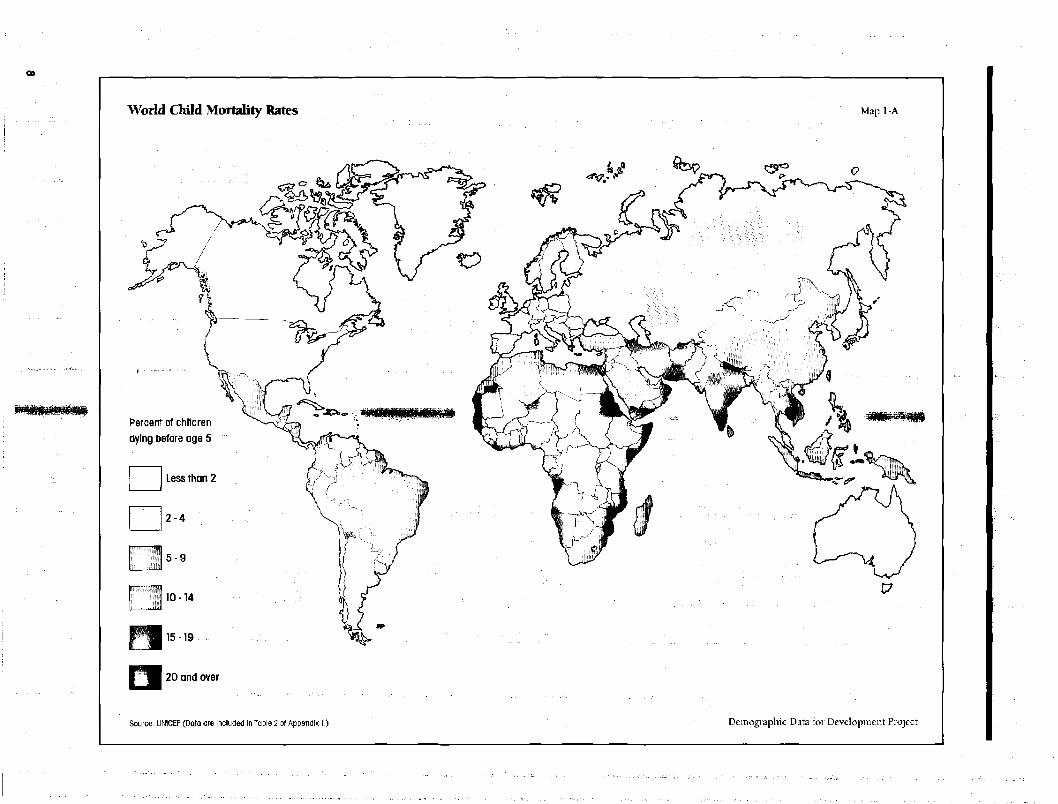
World Child Mortality Rates Map 1-A
Percent of childrendying before age 5
Less than 2
2 - 4
5 - 9
10-14
15-19
20 and over
Source: UNKEF (Data are included in Table 2 of Appendix 1.) Demographic Data for Development Project
Major Impediments to Child Survivaland Strategies for their Removal
Diarrheal disease is the leading cause of infant and childdeath in the world today. It is also one of the most frequentcauses of childhood illness and a major contributor to theproblem of childhood malnutrition. In developing regionsbetween one-fourth and one-third of deaths under age 5have been attributed to this cause. In absolute terms, anestimated 5 million children die from diarrhea every year.At least 60 percent of these deaths result from acute dehy-dration, which we now know can be readily prevented.
AgentDiarrhea is only the common symptom of a large numberof intestinal diseases. The source of infection may be avirus, a bacteria, or a parasite, or, often, a combination ofthese. They all share the ability to alter intestinal function,increasing fluid loss from the body and decreasing theretention of nutrients. The severity of an episode varieswidely, depending on the type of diarrhea and the inten-sity of infection. Cholera has a well-earned reputation asthe most deadly diarrheal disease. It can kill in a matter ofhours and has clai med more lives in recorded history thanany single infectious disease, including the bubonic plague.Yet cholera can also be a relatively mild disease, which il-lustrates the broad range in severity of diarrheal infections.The impact of diarrhea is seen less in the severity of in-dividual cases than in the effects of the recurring mild in-fections that characterize childhood in many developingcountries.
Diarrhea kills primarily through dehydration. Althoughlife-threatening dehydration occurs in only 1 percent of allepisodes, it is responsible for 60 to 70 percent of all diar-rhea deaths. Without treatment, severe episodes literallywring out body fluids from the victim faster than they canbe replaced. The first symptoms of dehydration appear afterfluid loss equivalent to 5 percent of body weight. Whenfluid loss reaches 10 percent, shock often sets in, and thecascade of events that follows can culminate in deathunless there is immediate intervention. Rehydration,whether given orally or intravenously, is the only effectivetherapy.
Transmission FactorsDiarrheal disease is primarily transmitted from person toperson via soiled hands and via food and water that havebeen contaminated by human waste. It is characteristicallyendemic in areas where sanitation and hygienic habits arepoor. Seasonal cycles play an important role. In general, the
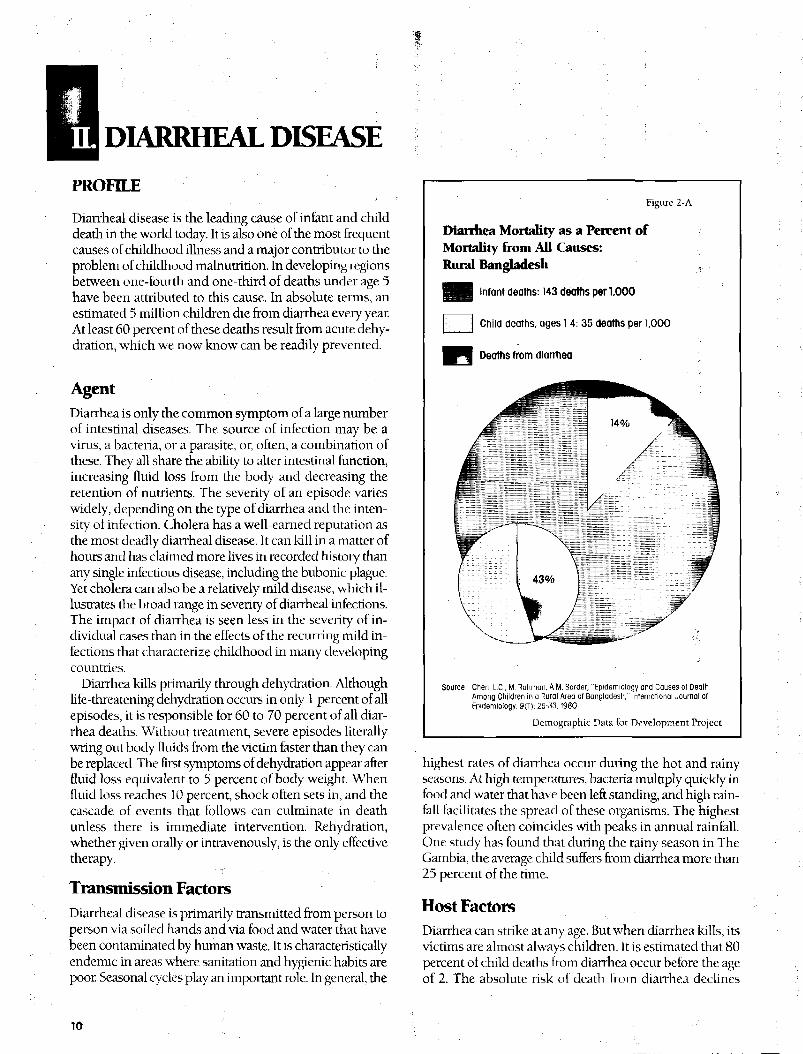
Figure 2-A
Dianhea Mortality as a Percent ofMortality from All Causes:Rural Bangladesh
M l Infant deaths: 143 deaths per 1000
Child deaths, ages 1-4: 35 deaths per 1,000
Deaths from diarrhea
Source: Chen, L.C.. M. Rahman, A.M. Sarder, "Epidemiology and Causes of DeathAmong Children in a Rural Area of Bangladesh," International Journal ofFpidemiology, 9(1): 25-33,1980,
Demographic Data for Development Project
highest rates of diarrhea occur during the hot and rainyseasons. At high temperatures, bacteria multiply quickly infood and water that have been left standing, and high rain-fall facilitates the spread of these organisms. The highestprevalence often coincides with peaks in annual rainfall.One study has found that during the rainy season in TheGambia, the average child suffers from diarrhea more than25 percent of the time.
Host FactorsDiarrhea can strike at any age. But when diarrhea kills, itsvictims are almost always children. It is estimated that 80percent of child deaths from diarrhea occur before the ageof 2. The absolute risk of death from diarrhea declines
10
through the remainder of childhood, following the generaldecline for overall mortality. Rut diarrhea then becomes amore important cause of death in relation to other causes.An analysis of child mortality in Bangladesh is shown infigure 2-A. The proportion of diarrheal deaths rises from 14percent of all infant deaths to more than 40 percent of alldeaths among 1- through 4-year-olds.
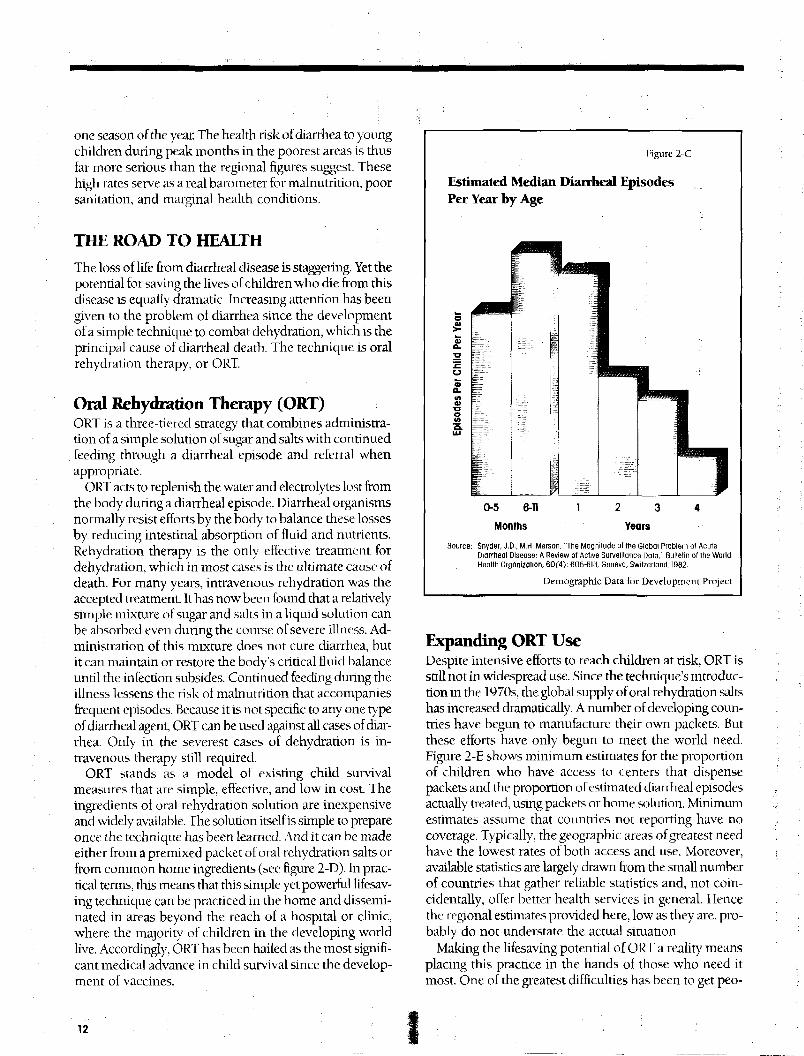
The reasons for this increased vulnerability lie in theunique transition children must undergo from their initialstate of nutritional and immunological dependence. Duringthe first 4 to 6 months of life, a fully breastfed infant receivesboth a complete diet and disease protection from breast-milk. Exclusive breastfeeding also spares the infant earlyexposure to contaminated food and water. The inevitableintroduction of supplemental foods, however, requires anadjustment to diseases in the environment—an adjustmentnot unlike that experienced by travelers in new surround-ings. As seen in figure 2-C, the highest rates of diarrheaamong children, which occur from the age of 6 monthsthrough age 1, coincide with the weaning period.
Diarrhea and malnutrition are so closely related that theymay arguably be considered a single complex ol diseases.Diarrhea causes malnutrition. During a diarrheal episodea child is likely to eat less, either because of loss of appetiteor intentional withholding of food, and absorbs less of thefood he does eat due to the effect of the diarrhea itself. Atthe same time, malnutrition increases the risk from diar-rhea. Poorly fed children suffer longer and more severeepisodes. Even children who are ol normal weight but haveselective vitamin A deficiency appear to be more vulnerableto diarrheal attacks. The reciprocal effects of malnutritionand diarrhea tend to multiply each other, together becom-ing a more powerful agent of death than either one alone.
An isolated case of mild diarrhea carries an impercep-tible risk. Yet children in developing countries face multipleepisodes ol acute diarrhea every year. In some areas thetotal is as high as 12. The cumulative nutritional deficitfrom these relentless infections can interrupt nonnalgrowth and development and place the child in aprecarious nutritional and health status.
GLOBAL IMPACT ON CHILD SURVIVAL
Current knowledge of the true global prevalence of diar-rheal disease suffers from a serious shortage of accuratedata. Nonetheless, available estimates provide a roughoutline of who is at greatest risk and where the problemis most concentrated.
For the year 1984, the World Health Organizationestimated that there were over a billion episodes of acutechildhood diarrhea and almost 5 million child deaths fromthis cause alone. More than 90 percent of these episodesand almost all of the deaths occur to children in develop-
Figure 2-B
Estimated Annual Episodes of ChildhoodDiarrhea and Average Number of Days ofDiarrheal IllnessDeveloping Regions and Selected U.S. Example
25 days
•^^^^B
17 days
13 days10 days
Near East Latin U.S.America &Caribbean
Regions
Note; An average episode of diarrhea is expected to last 5 days.
Source; For Developing Regions: World Health Organization, "Fourth ProgrammeReport for Control of Diarrheal Diseases 1983-198'!, Program for Controlol Diarrheal Diseases, Geneva, Swiliorland, 1985.
For U.S.: An average rate of 1 09 episodes/child unoer 5/year wascalculnted from a community study in Michigan,Mortto, A.S., J.S. Koopman, "IMc: lecumseh Study. XI. Occurrence olAcute Enteric Ilintiyy in the Community," American journal ofEpidemiology, 112(3): 323-333,1980
Demographic. D;Ua for Development Project
ing countries. The incidence of acute child diarrhea in thedeveloping world is 3 to 4 times greater than in the UnitedStates and other developed countries.
The median diarrheal incidence figures for each regionare shown in figure 2-B, which also shows the averagenumber of days during a year that a child in the regionmight surfer from diarrhea. These estimates, which are con-servative, suggest the great burden of illness on childrenfrom this disease alone. The estimated annual attack ratefor Africa of almost 5 diarrheal episodes per child denotesa formidable health risk. Assuming that each episode lastsan average of 5 to 6 days, a child born in Africa today willspend 1 month of every year with diarrhea. Averages andmedians, however, always obscure the variation observedfor such a large and diverse area as Africa. Estimated inci-dence rates over the continent range from 2 to 10 episodesannually. The greatest burden of illness falls on the youngestchildren and the highest frequency is experienced during
one season of die year. The health risk of diarrhea to youngchildren during peak months in the poorest areas is thusfar more serious than the regional figures suggest. Thesehigh rates serve as a real barometer for malnutrition, poorsanitation, and marginal health conditions.
THE ROAD TO HEALTH
The loss of life from diarrheal disease is staggering. Yet thepotential for savi ng the lives of children who die from thisdisease is equally dramatic. Increasing attention has beengiven to the problem of diarrhea since the developmentof a simple technique to combat dehydration, which is theprincipal cause of diarrheal death. The technique is oralrehydration therapy, or ORT.
Oral Rehydration Therapy (ORT)ORT is a three-tiered strategy that combines administra-tion of a simple solution of sugar and salts with continuedfeeding through a diarrheal episode and referral whenappropriate.
ORT acts to replenish the water and electrolytes lost fromthe body during a diarrheal episode. Diarrheal organismsnormally resist efforts by the body to balance these lossesby reducing intestinal absorption of fluid and nutrients.Rehydration therapy is the only effective treatment fordehydration, which in most cases is the ultimate cause ofdeath. For many years, intravenous rehydration was theaccepted treatment. It has now been found that a relativelysimple mixture of sugar and salts in a liquid solution canbe absorbed even during the course of severe illness. Ad-ministration of this mixture does not cure diarrhea, butit can maintain or restore the body's critical fluid balanceuntil the. infection subsides. Continued feeding during theillness lessens the risk of malnutrition that accompaniesfrequent episodes. Because it is not specific to any one typeof diarrheal agent, ORT can be used against all cases of diar-rhea. Only in the severest cases of dehydration is in-travenous therapy still required.
ORT stands as a model of existing child survivalmeasures that are simple, effective, and low in cost. Theingredients of oral rehydration solution are inexpensiveand widely available. The solution itself is simple to prepareonce the technique has been learned. And it can be madeeither from a premixed packet of oral rehydration salts orfrom common home ingredients (see figure 2-D). In prac-tical terms, this means that this simple yet powerful lifesav-ing technique can be practiced in the home and dissemi-nated in areas beyond the reach of a hospital or clinic,where the majority of children in the developing worldlive. Accordingly, ORT has been hailed as the most signifi-cant medical advance in child survival since the develop-ment of vaccines.
Hgure 2-C
Estimated Median Diarrheal EpisodesPer Year by Age
0-5 6-11
Months
Source: Snyder, J,D., M.H. Merson, "The Magnitude of the Global Problem of AcuteDiarrheal Disease: A Review of Active Surveillance Dale" Bulletin of the WorldHealth Organization, 60(4): 605-613, Soneva, Switzerland, 1982,
Demographic. Data for Development Project
Expanding ORT UseDespite intensive efforts to reach children at risk, ORT isstill not in widespread use. Since the technique's introduc-tion in the 1970s, the. global supply of oral rehydration saltshas increased dramatically. A number of developing coun-tries have begun to manufacture their own packets. Butthese efforts have only begun to meet the world need.Figure 2-E shows minimum estimates for the proportionof children who have access to centers that dispensepackets and the proportion of estimated diarrheal episodesactually treated, using packets or home solution. Minimumestimates assume that countries not reporting have nocoverage. Typically, the geographic areas of greatest needhave the lowest rates of both access and use. Moreover,available statistics are largely drawn from the small numberof countries that gather reliable statistics and, not coin-cidentally, offer better health services in general. Hencethe regional estimates provided here, low as they are, pro-bably do not understate the actual situation.
Making the lifesaving potential of ORT a reality meansplacing this practice in the hands of those who need itmost. One of the greatest difficulties has been to get peo-
pie to recognize the need for treatment before it is too late.Diarrhea is a common fact of life for many children.Perhaps only 10 percent of cases become dehydrated, andthe symptoms of dehydration appear late in the course ofthe disease. People in local communities, especiallymothers, need to learn how and when to give ORT whentheir children contract acute diarrhea. Caregivers must becarefully taught to use the correct proportions of salts inwater, because an over-diluted solution is less ellecdve andone that is too concentrated can be dangerous. The impor-tance of using the cleanest possible water must also bestressed, to avoid exposing the child unnecessarily to fur-ther contaminants. But even if safe water is not readilyavailable, the benefits of fluid replacement in diarrhea faroutweigh the risk of using contaminated water to make uporal rehydration solution. The crucial role that water playsin disease transmission and health in general is discussedfurther in chapter 12.
Finally, the spread of ORT can be greatly accelerated bycarefully designed and implemented programs. This dif-ficult work is now being undertaken in efforts to make ORTand diarrheal control an integral part of comprehensivehealth services for children in the future.
The Importance of Continued Feeding
The solution of sugar and salt may prevent dehydration,but does not address the problem of malnutrition that diar-rhea frequently precipitates. Continued feeding through adiarrheal episode plus extra intake during the recoveryperiod are essential if a child is to maintain normal growthand development. It is especially important for childrenwho are still breastfeeding.
Unfortunately, the common response to diarrhea is tostop feeding altogether. Tt is a problem of conflicting percep-tions of this disease. Common sense tells many parents thatdiarrhea works like a pipe. If you stop feeding things in atthe top, they will stop coming out at the bottom. This beliefis seemingly confirmed by the observation mat diarrhea in-creases with feeding. Much of the food and liquid ingestedduring diarrhea is indeed lost. But while gut function isreduced, the body can still absorb over 50 percent ofnutrients during a diarrheal episode. Continued feeding inconjunction with oral rehydration is thus best for the child.Even if the diarrhea appears to get worse, feeding is a farbetter alternative than fasting.
Young children in many parts of the world spend a
Figure 2-D
Oral Rehydration Solution
Oral Rehydration Salt (ORS) Solution3.5 grams Sodium chloride20 grams Glucose2.9 grams Trlsodlum citrate dlhydrate*1.5 grams Potassium chloride1 liter of cleanest water
OR
Home Solution1 level teaspoon Table salt8 level teaspoons Sugarpinch Baking soda"pinch Potassium salt'1 liter of cleanest water
• Although the World Health Organization now recommends the use of trlsodlum citrate, oral rehydration packets substituting 2.5 grams ot sodium bicarbonate remain safe andhighly effective." Although these increase the effectiveness of home solution, it is still effective without them. Readily available foods such as bananas, orange juice, and green coconut watercontain potassium, although relatively large quantities of these foods are needed to replace potc-ssium lost from diarrhea
Source: World Health Organization, Treatment and Prevention of Acute Diarrhea: Guidelines for Trainers of Health Workers, Geneva, Switzerland, 1985.
Demographic Data for Development Project
13
Estimated Access and Use of ORT In Developing Regions
^ ^ H Percent of Children with access to centers dispensing oral rehydratlon salt packets
8 % • • ' : • •
Figure 2-H
rtivitu Near East
Percent of diarrhea episodes treated with oral rehydratlon salt packets3 %
Latin nu& Caribbean
12%
Africa Near East Asia*
Percent of diarrhea episodes treated with ORT (packets or home solution)
5% 17% 12%
Latin America& Caribbean
12%
Africa Near East Asia* Latin America& Caribbean
"Excluding China
Note; Regional averages represent minimum estimates for access and use. Countries not reporting are assumed to have no coverage.Source: Addpted from data provided by the Program for the Control of Oiorrheal Diseases/World Hedlth Orgdnization,
Ddta Available ds of Moy 8,1986.
Demographic Data for Development Project
significant proportion of their lives with diarrhea. If foodor breastmilk were to be withheld lor each episode, itwould be tantamount to requiring the hardest-hit childrento last for a full month or more out of every year.
Diarrhea PreventionHandwashing: The ultimate aim of diarrhea control pro-grams is to prevent the disease itself. Improvements insanitation and water supplies will certainly play an impor-tant and necessary role in the permanent reduction ol diar-rheal illness. But the costs of building these systems andmaintaining them once they are built are prohibitive for
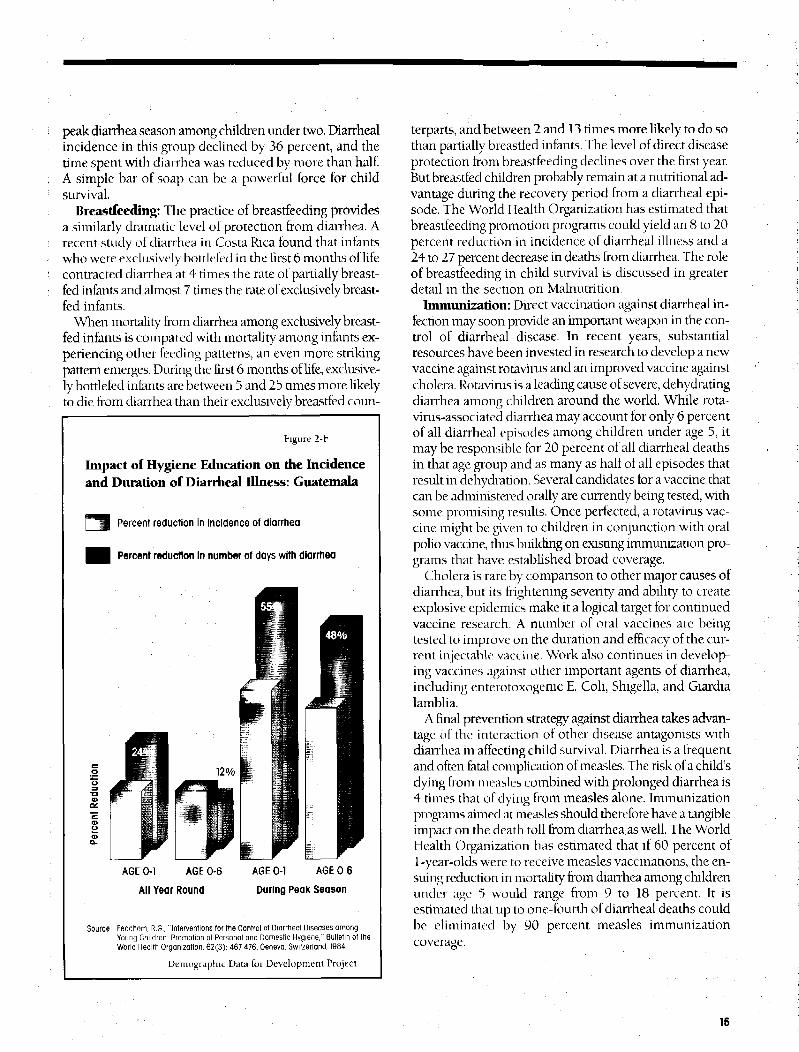
many areas at current levels of development. Meanwhile,a number of simple preventive measures can have an im-mediate impact on the incidence ol diarrheal disease. Thepromotion of simple hygienic practices within thehousehold is a good example. Figure 2-F shows the impactof a program in Guatemala to promote health awarenessand good hygiene among mothers in the country's Pacificlowlands. The incidence of diarrhea was lower and thelength of diarrheal episodes shorter among children ofmothers in the program than among children in similar liv-ing conditions whose mothers did not participate in theprogram. The most dramatic results were achieved at the
14
peak diarrhea season among children under two. Diarrhealincidence in this group declined by 36 percent, and thetime spent with diarrhea was reduced by more than half.A simple bar of soap can be a powerful force for childsurvival.
Breastfeeding: The practice of breastfeeding providesa similarly dramatic level of protection from diarrhea. Arecent study of diarrhea in Costa Rica found that infantswho were exclusively bouleled in the first 6 months ol lifecontracted diarrhea at 4 times the rate of partially breast-fed infants and almost 7 times the rate of exclusively breast-fed infants.
When mortality from diarrhea among exclusively breast-fed infants is compared with mortality among infants ex-periencing other feeding patterns, an even more strikingpattern emerges. During the first 6 months of life, exclusive-ly bottlefed infants are between 5 and 25 times more likelyto die from diarrhea than their exclusively breastfed coun-
Figure 2-F
Impact of Hygiene Education on die Incidenceand Duration of Diarrheal Illness: Guatemala
|""*H Percent reduction in incidence of diarrhea
H Percent reduction In number of days with diarrhea
AGE 0-1 AGE 0-6
All Year Round
AGE 0-1 AGE 0-6
During Peak Season
Source; Feochem, RG•, "Interventions for the Control of Diorrheal Diseases amongYoung Children: Promotion of Personal and Domestic Hygiene," Bulletin of theWorld Health Organization, 62(3): 467-476, Geneva, Switzerland, 1984,
Demographic Data for Development Project
terparts, and between 2 and 13 times more likely to do sothan partially breastfed infants. The level of direct diseaseprotection from breastfeeding declines over the first year.But breastfed children probably remain at a nutritional ad-vantage during the recovery period from a diarrheal epi-sode. The World Health Organization has estimated thatbreastfeeding promotion programs could yield an 8 to 20percent reduction in incidence of diarrheal illness and a24 to 27 percent decrease in deaths from diarrhea. The roleof breastfeeding in child survival is discussed in greaterdetail in the section on Malnutrition.
Immunization: Direct vaccination against diarrheal in-fection may soon provide an important weapon in the con-trol of diarrheal disease. In recent years, substantialresources have been invested in research to develop a newvaccine against rotavirus and an improved vaccine againstcholera. Rotavirus is a leading cause of severe, dehydratingdiarrhea among children around the world. While rota-virus-associated diarrhea may account for only 6 percentof all diarrheal episodes among children under age 5, itmay be responsible for 20 percent of all diarrheal deathsin that age group and as many as half of all episodes thatresult in dehydration. Several candidates for a vaccine thatcan be administered orally are currently being tested, withsome promising results. Once perfected, a rotavirus vac-cine might be given to children in conjunction with oralpolio vaccine, thus building on existing immunization pro-grams that have established broad coverage.
Cholera is rare by comparison to other major causes ofdiarrhea, but its frightening severity and ability to createexplosive epidemics make it a logical target for continuedvaccine research. A number of oral vaccines are beingtested to improve on the duration and efficacy of the cur-rent injectable vaccine. Work also continues in develop-ing vaccines against other important agents of diarrhea,including enterotoxogenic E. Coli, Shigella, and Giardialamblia.
A final prevention strategy against diarrhea takes advan-tage ol the interaction of other disease antagonists withdiarrhea in affecting child survival. Diarrhea is a frequentand often fatal complication of measles. The risk of a child'sdying from measles combined with prolonged diarrhea is4 times that of dying from measles alone. Immunizationprograms aimed at measles should therefore have a tangibleimpact on the death toll from diarrhea, as well. The WorldHealth Organization has estimated that if 60 percent of1-year-olds were to receive measles vaccinations, the en-suing reduction in mortality from diarrhea among childrenunder age 5 would range from 9 to 18 percent. It isestimated Lhat up to one-fourth of diarrheal deaths couldbe eliminated by 90 percent measles immunizationcoverage.
15
VACCINE-PREVENTABLE DISEASES
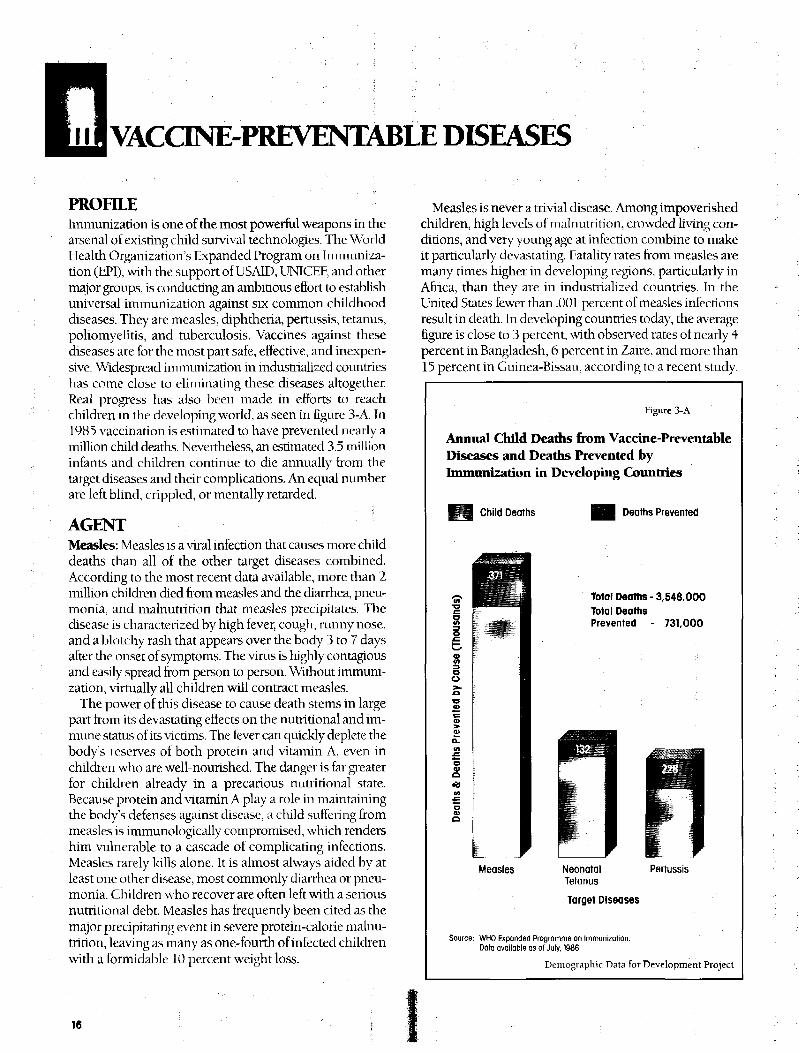
PROFILEImmunization is one of the most powerful weapons in thearsenal of existing child survival technologies. The WorldHealth Organization's Expanded Program on Immuniza-tion (tiPI), with the support of USAID̂ UNTCEF, and othermajor groups, is conducting an ambitious eftbrt to establishuniversal immunization against six common childhooddiseases. They are measles, diphtheria, pertussis, tetanus,poliomyelitis, and tuberculosis. Vaccines against thesediseases are for the most part safe, effective, and inexpen-sive. Widespread immunization in industrialized countrieshas come close to eliminating these diseases altogether.Real progress has also been made in efforts to reachchildren in the developing world, as seen in figure 3-A. In1985 vaccination is estimated to have prevented nearly amillion child deaths. Nevertheless, an estimated 3.5 millioninfants and children continue to die annually from thetarget diseases and their complications. An equal numberare left blind, crippled, or mentally retarded.
AGENTMeasles: Measles is a viral infection that causes more childdeaths than all of the other target diseases combined.According to the most recent data available, more than 2million children died from measles and the diarrhea, pneu-monia, and malnutrition that measles precipitates. Thedisease is characterized by high fever, cough, runny nose,and a blotchy rash that appears over the body 3 to 7 daysafter the onset of symptoms. The virus is highly contagiousand easily spread from person to person. Without immuni-zation, virtually all children will contract measles.
The power of this disease to cause death stems in largepart from its devastating effects on the nutritional and im-mune status of its victims. The lever can quickly deplete thebody's reserves of both protein and vitamin A, even inchildren who are well-nourished. The danger is far greaterfor children already in a precarious nutritional state.Because protein and vitamin A play a role in maintainingthe body's defenses against disease, a child suffering frommeasles is immunologically compromised, which rendershim vulnerable to a cascade of complicating infections.Measles rarely kills alone. It is almost always aided by atleast one other disease, most commonly diarrhea or pneu-monia. Children who recover are often left with a seriousnutritional debt. Measles has frequently been cited as themajor precipitating event in severe protein-calorie malnu-trition, leaving as many as one-fourth of infected childrenwith a formidable 10 percent weight loss.
Measles is never a trivial disease. Among impoverishedchildren, high levels of malnutrition, crowded living con-ditions, and very young age at infection combine to makeit particularly devastating. Fatality rates from measles aremany times higher in developing regions, particularly inAfrica, than they are in industrialized countries. In theUnited States fewer than .001 percent of measles infectionsresult in death. In developing countries today, the averagefigure is close to 3 percent, with observed rates of nearly 4percent in Bangladesh, 6 percent in Zaire, and more than15 percent in Guinea-Bissau, according to a recent study.
Figure 3-A
Annual Child Deaths from Vaccine-PreventableDiseases and Deaths Prevented byImmunization in Developing Countries
Child Deaths Deaths Prevented
oo
Total Deaths - 3,548.000Total DeathsPrevented - 731,000
Measles NeonatalTetanus
Target Diseases
Pertussis
Source; WHO Expanded Programme on Immunization.Data available as of July, 1986,
Demographic Data for Development Project
16
Tetanus: Tetanus is a highly lethal infection caused bythe toxin of the tetanus bacillus. It is responsible for closeto one million deaths each year; most of those who suc-cumb are newborn infants. This organism exists harmlesslyin the gut of many animals and humans. It is only when thebacillus enters through the skin or an open wound that itbecomes fatal. The usual mode of transmission is throughexposure to the soil, where excreted tetanus spores canremain intact for years. People of all ages can be suscept-ible to infection. It is of particular concern to those who livein rural areas and in the unsanitary conditions under whichthe tetanus bacillus thrives. Vaccination with tetanus toxoidconfers immunity for up to 10 years and can provideimportant protection for older children and adults in high-risk areas.
Neonatal Tetanus: Tetanus that occurs during the firstmonth of life, or neonatal tetanus, accounts for the greatestnumber of deaths from this disease. It results primarilyfrom unsanitary practices surrounding birth. The newly cutumbilical stump provides an easy portal of entry for thetetanus bacillus, which can be introduced by contaminatedcutting instruments or by the traditional dressings some-times placed on the umbilical stump. The first sign ofneonatal tetanus is inability to feed. In a matter of days, thedisease proceeds to general muscular stiffness with spasmsand convulsions. Death follows rapidly. Most deaths occurbetween 4 and 14 days of birth, several days after the firstsymptoms appear. Without treatment neonatal tetanus isalmost uniformly fatal; the assumed case fatality rate is 85percent Hven when treatment is available, mortality is highbecause babies are rarely brought to the hospital beforesevere symptoms have set in.
Until recently, the global significance of neonatal tetanushad gone largely undetected. The death of a child duringits first few weeks of life may be hidden from view forcultural reasons. In many traditional societies, a child mustsurvive for a certain period of time after birth before it isacknowledged as a "life." Naming ceremonies and otherrituals marking the arrival of a new life are purposelydelayed by those accustomed to high rates of infant mor-tality. The fatalistic attitudes that prevent parents fromseeking help also make them unlikely to report the deathof a newborn infant. As a result, the problem of neonataltetanus has been endowed with what has been called a"peculiar quietness," going largely unrecognized as a ma-jor cause of infant death.
The true magnitude of neonatal tetanus mortality isuncertain. Current estimates hold that close to 1 millioninfants die from this cause every year. In some areas itaccounts for more than half of all deaths in the first monthof life and 1 in 10 deaths during the first year.
Prevention is the only viable strategy against this disease.Unlike other diseases discussed in this section, tetanus is
Figure 3-B
Neonatal Mortality With and WithoutHealth Intervention
Cause of Death
^ H Neonatal Tetanus All Other Causes
ooo
S.
MothersImmunized
Against TetanusDuring Pregnancy:
No TrainedBirth Attendant
Delivery by aTrained BirthAttendant:
No Immunization
NoHealth
Intervention
Source: Stansfleld, J.P., A. Galazka, "Neonatal Tetanus in the World Today," Bulletin ofthe World Health Orgoniiolion, 62(4): 647 669, Genevo, Switzerland, 1984.
Demographic Data for Development Project
not contagious. It can be prevented by immunization andimproved sanitary conditions, especially those surroundingmaternity care. Immunization strategies against neonataltetanus hold out the greatest hope for the immediate future.The timing of this disease requires an unorthodox solution.When a pregnant woman is immunized, her fetus alsoreceives immunity, hollowing birth, the child enjoys thispassive immunity for up to 5 months, safely past the periodof highest risk. Basic improvements in maternity care alsohave important implications for child survival. Iigure 3-Bshows the influence of trained birth attendants andimmunization of pregnant women on neonatal mortalityfrom tetanus and from all causes combined. As might beexpected, delivery by trained birth attendants reducedneonatal mortality from all causes to a greater extent thanimmunization against tetanus. Immunization against neo-natal tetanus, however, provided virtually complete protec-tion to infants of immunized mothers. Compared withthose receiving no special care, newborns in both programsenjoyed a significant reduction of mortality during the first
17
month of life, 72 percent and 54 percent respectively,which underscores the importance of pre- and postnatalhealth care.
Pertussis (Whooping Cough): Pertussis, an acutebacterial infection of the respiratory tract, claims the livesof nearly 600,000 children each year. Without immuniza-tion, the toll in developing countries might, be closer to750,000 child deaths annually. Characterized by a violentcough and whooping sound with inhaled breath, pertussisis a prolonged, exhausting illness. The severest symptomsusually occur over a period of 2 to 4 weeks. A residualcough may last for months. It is highly contagious. Onaverage, 80 percent of children in an unimmunizedpopulation will contract this disease. An estimated 1.5 to2 percent of infected children die from pertussis and itsconsequences, especially from pneumonia. As withmeasles, children who recover are often left with a nutri-tional debt that weakens their resistance to the effects ofother illness. More than half of the children in one Africanstudy suffered a critical 5 percent weight loss. It took from1 to 3 months for many of these children to regain theirprevious weight and resume normal growth. The burdenon health from this preventable disease may thus be fargreater than can be measured directly.
Polio: Polio is more of a crippler than a killer. It is a viraldisease spread indirectly from person to person via con-taminated food and water. An estimated 272,000 childrencontracted paralytic polio in 1985 and perhaps one in tenof these died as a result of the infection. Spearheaded by thePan American Health Organization's drive to eradicatepolio from die Americas before the next decade, the worldis gaining the edge on this dread disease. The estimatednumber of cases prevented by polio immunization indeveloping countries in 1985 was almost half the reportedincidence of childhood polio in that year.
Polio was once thought to be a relatively rare disease thatoccurred more frequently in developed than developingcountries. The disease seemed rare because most polio in-fections are silent. Only one of every 200 children infectedgoes on to develop paralysis. Amid poor health conditions,frequent exposure to polio virus begins at birth. Recentlameness surveys in developing countries reveal previouslyunsuspected high levels of crippling polio, comparable tothose of the worst epidemics in industrialized countriesbefore the development of vaccines. Some 3 to 10 childrenper 1,000 are affected in endemic areas.
Diphtheria: Since immunization against diphtheriabegan, this once-dreaded disease has been all but relegatedto memory in temperate countries. In the United States, torexample, the number of reported cases averaged four peryear during the early 1980s, occurring mostly in unim-munized adults. Little is known about the scope of diph-theria in the developing world. Perhaps 5,000 children die
Hgure 3-C
Measles Case Fatality Rates by AgePercent of Infected Children Who Die FromMeasles: West Africa
8%
0%
2 3 4Age In Years
Source: Foster, SO., "Immunizable and Respiratory Diseases and Child Mortality,"Child Survival; Strategies tor Research Population and Development Review,Supplement to Vol. 10, L.C. Chen, H, Mosely (ed,) (New York: The PopulationCouncil, 1984),
Demographic. I Data for Development Project
each year from this cause. While this death toll is low com-pared with that of a disease like measles, immunization re-mains a priority. The infection is severe, killing 10 to 15percent of its victims. Many children in endemic areasdevelop an early natural immunity as a result of constantsubtle exposure to the bacteria through the skin. Ironically,as health and sanitary conditions improve, such exposuredecreases, depriving children of this natural immunity andmaking them susceptible to the severe respiratory form ofdiphtheria later in life. Immunization thus becomes acritical factor in preventing the rise of both morbidity andmortality from diphtheria.
Tuberculosis (TB): Once the leading cause of death inEurope, tuberculosis now appears to be declining through-out the world. Throughout its history, the disease has beenassociated with the poverty and crowded living conditionsthat favor its spread. It is now rare in developed countries,but remains common in developing regions, where it con-tinues to be a major cause of illness and death. Althoughthe true scope of this disease among children is unknown,it is estimated that 30,000 children die. from tuberculosiseach year.
Tuberculosis is a chronic disease that usually starts in thelungs and may spread to other organs. Most child deathsresult from a severe form of the disease known as TBmeningitis, which develops when infection spreads to the
18
layers surrounding the brain. like polio, most tuberculosisinfections are silent. Between 1 and 2 percent of thoseharboring the bacillus develop outward symptoms eachyear. But unlike polio, tuberculosis is not self-limiting.Without treatment, the bacillus may persist in the lungs ofthe victim indefinitely, ready to cause infection later in life.An infected infant has a 10 percent chance of developingdisease in later childhood or as an adult.
Host FactorsIt is striking that the same childhood diseases can be so in-nocuous in one context and so devastating in another.Their tremendous impact on child survival in developingcountries stems from four principal factors: low levels ofimmunization (discussed in the next section), young ageat infection, the presence of malnutrition and other com-plicating diseases, and lack of available health care.
Age at infection can have a strong influence on the sever-ity of the disease. Childhood diseases tend to strike at muchearlier ages in developing countries than in industrializedcountries. In poor, densely populated areas, as many as halfof children will have suffered measles by their first birthday;virtually all have been infected by age 3. Contributing fac-
tors include crowded living conditions that give childrenearly exposure to the outside world. A child who lives inone room with a number of older siblings or who rides onhis mother's back to a crowded marketplace is likely to beexposed to most common childhood diseases at a veryearly age. In developed countries, by contrast, mostchildren first encounter this intensity of exposure whenthey enter school at age 4 or 5. The pattern of decliningfatality rates from measles with increasing age (figure 3-C)shows that an infant with measles is 8 times more likely todie than a 5-year-old with the same infection. Similarly, therisk of death among infants with pertussis is 3 times that ofchildren 1 or older.
The combination of malnutrition and concurrent illnessis a recurring theme in discussions of the major determi-nants ot child mortality. The case of measles provides aclassic example of the interplay between these factors.Severely malnourished children have been shown to suffertwice the measles mortality of children on adequate diets.Under famine conditions, when the prevalence of mal-nutrition soars, as many as half of children who contractmeasles die from it. Most measles deaths follow com-plicating infections, usually diarrhea and pneumonia. A
Figure 3-0
Immunization Coverage by RegionPercent of 1-Year-Olds Fully Immunized
Measles in Peru Pertussis in Saudi Arabia Polio in Brazil1 5 0 ' * : : • • : - : * « s r . | o o 1 5 0 y : • • • • • • . ••••••;. ::;: 1 0 0 S ;• .• f < 100
Source; World Health Organization/Expanded Program on Immunization. •: '% Demographic Data for Development Project
Bangladesh study found measles followed by prolongeddiarrhea to be four times more likely to be fatal thanmeasles alone. The synergistic effect of the interaction oftwo diseases thus far outweighs the total of their individualeffects.
Lack of health care is another contributor to high fatalityrates from childhood diseases. Some of these diseases canbe cured medically. Pertussis and diphtheria respond toantibiotics; tuberculosis can be halted by a complex drugregimen; and it is possible to save some children from thegrip of tetanus by the use of muscle relaxants and anti-toxins. But few in the developing world have access to suchadvanced medical services, and for other diseases, such asmeasles or polio, there is no known cure. Immunization isthe only alternative. In any case, the continuing lack ofavailable health care is one of the strongest arguments forimmunization.
THE ROAD TO HEALTHWe hold the means to prevent millions of child deaths inour hands. The virtual elimination of the six target diseasesin industrialized regions puts this goal within reach of thedeveloping world. It is no longer a question of the abilityto control these diseases; it is a question of the will to takethe necessary steps.
Immunization CoverageThe latest available immunization rates for the majorregions of the world are shown in figure 3-D. They reflectthe progress that has been made and the distance remain-ing to the goal of universal immunization. Africa lags wellbehind other regions in terms of overall coverage. Fewerthan 40 percent ol infants receive full immunization againstany of the six target diseases before their first birthday.
20
Asian countries (excluding China), provide higher levelsof coverage of all diseases but measles; immunizationagainst this disease is lower in Asia than in any other region.India, which has more children than any country in theworld, has only recently initiated a measles immunizationdrive. Even when India is excluded from the regionalaverage, measles immunization coverage averages less than20 percent. China, by contrast, is reported to have reachedmore than half of all infants with each vaccine; nearly 83percent are said to be protected against measles. Thegreatest overall success rates in the developing world havebeen achieved by Latin America and the Caribbean, wherebetween one-half and two-thirds ol infants are reportedlyimmunized annually against each ol the six target diseases.
The World Health Organization's Expanded Program onImmunization (EPI) faces significant challenges. Becausethe targeted diseases strike in infancy in developing regions,effective immunization must occur before a child's firstbirthday. Vaccinations must not be given too early,however, because they can be neutralized by the passiveimmunity inherited from the mother. This leaves a rela-tively brief period of time during which it is crucial to reachdie child. Additional problems include the need to refriger-ate vaccines until they can be administered. Breaks i n therequired "cold chain" have a cumulative effect on vaccinepotency, especially on the potency of "live" vaccines suchas those against polio and measles. If there are too manybreaks, the vaccine becomes useless before it can reach thechild. Public awareness may be the most important factorin the success or failure of these programs. Adequate sup-plies, facilities, and personnel mean little if local com-munities are not informed of the availability of services ormotivated to use them. Dropouts often plague immuniza-tion efforts, as when parents who bring in their children forthe first inoculation of DPT or oral polio vaccine fail toreturn lor the second or third shot.
Vigorous communication activities that get the messageacross to the critical audience can be of enormous benefit.Effective communication systems serve three purposes:they educate people about the importance of immuniza-tion to children's health, overcome misconceptions thatdiscourage its widespread use, and explain where andwhen immunization services are available.
Nationally publicized "immunization days," during whichthousands—or even millions—of children are immunized
have been staged in some countries. These widely publi-cized efforts tend to reach children who might otherwisehave gone unprotected. If these campaigns have adrawback, it is that they may sidetrack efforts to establishthorough systems of routine immunization to protectfuture generations. However successful they may be, singlecampaigns do not eliminate the ongoing need for im-munization. The absolute size of this need is vast. In 1985there were 10.3 million infants living in developing coun-tries, only one quarter to one half of whom received im-munizations against any of the 6 EPI target diseases. By theyear 2000, the number of surviving infants is projected togrow to over 115 million annually. That means that everyyear there will be almost one million more children to im-munize than there were the year before. Overall, a projected1.8 billion infants will require immunization between 1985and the year 2000. The goal of universal coverage can beachieved and sustained, but coordinated and systematic ef-forts will be required to support the necessary specialinitiatives.
Despite logistical difficulties of immense proportions,there is widespread agreement that the goal of universal im-munization of children can be achieved before the end ofthe century. WHO's Expanded Program on Immunizationis receiving broad-ranging support and other internationalorganizations and world leaders have added their voices tothe call for universal immunization of children by 1990.The Pan American Health Organization is spearheading adrive to eradicate polio from the Americas by that year. Theworldwide demand for vaccines has tripled during the pastyear, and many countries have staged massive national im-munization drives. The series ol graphs in figure 3-E showsthe impact ol immunization on the incidence of disease inselected countries. Increasing immunization rates ofchildren under age 1 accompany a general decline in thepattern of the specific target disease. The benefits of theseprograms are expected to accrue rapidly. As levels of im-munization rise, the number of susceptible children in agiven area declines. Above a certain level, different for eachdisease, transmission can be brought to a virtual halt, whichmeans that even children who have not been vaccinatedare sheltered from infections. The analogy has been madeof a stone hitting sand. When a child contracts a diseaseand there is no one for him to pass it on to, the epidemicstops before it begins.
21
ACUTE RESPIRATORY INFECTION
A host of other infectious and parasitic diseases can strikechildren. Some are universal diseases of childhood, others arelimited to developing countries. Some are determined byclimatic conditions, others by crowding and poor hygienic prac-tices. Their impact on child survival is magnified by malnutri-tion and little or no access to health care. The following sectionfocuses on the two most important, infectious and parasiticdiseases that affect children: acute respiratory infection andmalaria.
PROFILEWith the exception of diarrhea, no single group of diseasesclaims as many child lives as acute respiratory infections.These infections are estimated to account for 20 to 25 per-cent of all child deaths in the developing world. In absoluteterms, up to 4 million children die from these infectionsevery year. In some areas, acute respiratory infectionoutranks diarrheal disease as the leading cause of deathunder age 5.
AgentAs with diarrhea, acute respiratory infections are caused bya wide variety of disease agents. More than 300 types ofbacterial and viral sources have been identified, includingfour of the vaccine-preventable target diseases (measles,diphtheria, pertussis, and tuberculosis). These infectionsrange in severity from the common cold to bacterialpneumonia.
Acute respiratory infections are traditionally divided intotwo main categories: those of the upper respiratory tractand those of the lower respiratory tract. The latter group,by far the most important cause of deaths from thesediseases, is the focus of current health strategies. Bacterialinfection of the lower respiratory tract is particularlydangerous; bacterial pneumonia dominates all forms ofthese infections as a killer of children. Control of lowerrespiratory infection is problematic, however, because it isrelatively rare by comparison to upper respiratory infectionand difficult to diagnose. It often develops from seeming-ly harmless upper respiratory infections, which have anotorious tendency to invite secondary, complicatingillness.
Transmission FactorsAcute respiratory infections are primarily spread from per-son to person through die air. Their principal transmissionfactors are high population density, crowded living condi-tions, and seasonal changes that favor the spread of disease.
The evolutionary theory of disease holds that acute respi-ratory infections came into being when humans began toform permanent settlements with large numbers of inhab-itants. Measles, for example, requires a minimum popula-tion of 100,000 in order to remain endemic in an area.Because high population density facilitates the transmis-sion of person-to-person diseases, isolated rural com-munities that generally lack health benefits, may, in thecase of acute respiratory infections, enjoy a health advan-tage over populous urban areas.
Within households, crowded living conditions also favorthe spread of respiratory infection. In the often-primitivetraditional dwellings and poor housing where most of theworld's children grow up, it is common for the entire familyto sleep in the same room. Infants and young children arethus exposed at early ages to diseases brought into thehome by parents and older siblings. Moreover, intimate liv-ing conditions can increase the intensity of diseasetransmission. Both very early age at infection and increasedintensity of infection have been implicated in the extraor-dinarily high fatality rates attributable to acute respiratoryinfections in developing countries.
Seasonal epidemics of these infections are a universalaffliction of our species, regardless of economic classifica-tion or political boundaries. Every climate has its season ofincreased disease transmission. The cold weather "fluseason" in temperate climates corresponds to the humidrainy seasons of the tropics.
Host FactorsThe principal risk factors for child mortality from acuterespiratory infection are young age, low birth weight, andpoor nutritional status. Death rates are highest during thefirst year of life. These infections, particularly pneumonia,are often the leading cause of infant death in impoverishedareas. As with other diseases, the deadly power of a severeinfection is multiplied by the convergence of such lactorsas weaning, the gradual loss of passive immunity, andincreasing exposure to disease that mark the passage ofchildren through the critical first year of life.
An important contributor to high infant mortality fromacute respiratory infections is low birth weight. Death ratesfrom all causes are significantly higher for infants weighingless than 2,500 grams (5.5 pounds) at birth, who appear tobe especially vulnerable to respiratory illness. Pneumoniaheads the list of infectious causes of death. The link bet-ween low birth weight and early death is reflected in theelevated infant mortality rates of developing regions, whereabout one child in six is born underweight.
Source: Tupasi, T.E., "Nutrition and Acute Respiratory Infection," Acute RespiratoryInfections in Childhood, Proceedings o( an International Workshop, Sydney,Australia (1984), R. Douglas, E. Kerby-Faton (e<i) (Adolaide, Australia:University of Adelaide, 1985)
Demographic Data tor Development Project
The impact of acute respiratory infections is intensifiedby malnutrition. In Costa Rica, children with severe pro-tein calorie malnutrition were found to be 19 times morelikely than normal children to develop pneumonia. In thePhilippines, as shown in figure 4-A, mortality amongchildren hospitalized with acute respiratory infection wasfar higher for malnourished children than for children ofnormal nutritional status.
Vitamin A deficiency, long recognized as the leadingcause of blindness in childhood, may also be an importantrisk factor for respiratory infections. Lack of vitamin A isthought to cause physical changes in the internal linings ofthe lungs and digestive tract which favor bacterial infection.Figure 4-B shows the findings of recent research on thissubject in Indonesia. Children with ocular symptoms ofvitamin A deficiency experienced twice the rate ofrespiratory in lection and four times the death rate ofchildren without these symptoms. The role of vitamin A inchild survival is examined further in the section onMalnutrition.
GLOBAL IMPACT ON CHILD SURVIVALAcute respiratory infections are by far the most commonillnesses suffered by children, no matter where they live.The average child under the age of 5 experiences between4 and 8 infections a year. These infections reportedly causefrom 20 to 60 percent of visits to health services and com-prise 10 to 50 percent of hospital admissions. The in-cidence of childhood respiratory infection is roughly thesame in both developed and developing regions. This is insharp contrast to the incidence of diarrheal disease, whichis 3 to 4 times higher in developing countries.
Although there is little regional variation in overall in-cidence rates of acute respiratory infection, death rates aredramatically higher in developing countries. A major factorin this difference is in their higher incidence of the mostsevere infections, particularly the dangerous lower respi-ratory infections. Rates for these infections in India andPapua New Guinea are 3 to 4 times higher than U.S. rates,and in the rural highlands of Guatemala, half of 3-year-oldshave at some time suffered pneumonia. The differences arenot only in tenns of incidence. Case fatality rates forpneumonia, which are .4 percent in the United States, rangefrom 5 to 20 percent in developing areas. When incidenceand case fatality considerations are combined, death ratesfrom acute respiratory infections are in some cases hun-dreds of times greater for children in developing countries.
THE ROAD TO HEALTHAcute respi ratory infections are now beinggiven increas-ing attention by the international health community. Withthe exception ol those for which vaccines exist, these in-fections have often been overshadowed in the past by otherhealth concerns. This neglect may have stemmed from thelack of a central strategy like oral rehydration therapy,which lias galvanized the light against diarrheal disease. Butgrowing awareness of the magnitude of the problem ofacute respiratory infections and the growing number ofpossibilities for their prevention and cure have stimulatednew interest. Moreover, it has become increasinglyapparent that the child survival revolution will not takeplace without successfully confronting this major cause ofchildhood mortality in the developing world.
Existing control technologies include immunization,drug therapy, and a variety of measures to reduce the riskfrom this disease group. Four of the most important respi-ratory infections — measles, diphtheria, pertussis, andtuberculosis — have been targeted by the Expanded Pro-gram on Immunization. Research on new vaccine treat-ments is ongoing. The development of vaccines againstlower respiratory infections could provide a much-neededcatalyst for the control effort. Drug therapy provides a po-tent defense against respiratory infections in developed set-
23
Figure 4-B
Incidence of Acute Respiratory Infection Among ChildrenWith and Without Ocular Symptoms of Vitamin A Deficiency*—Indonesia
Without ocular symptoms With ocular symptoms
5+Age in Years
" With ocular symptoms = children with night blindness or Bltot's spots at both start and end of 3-month observation interval.Without ocular symptoms = children with normal eyes at both start and end of interval.
Source: Sommer, A, J. Kat/, I Torwotjo, "Increased Risk ot kospiraforv Disease and Diarrhea in Children with Pre-existing Mild Vitamin A Deficiency,"American Journal ot Clinical Nutrition 40,1984.
Demographic Data for Development Project
tings, but its use poses special difficulties in many develop-ing countries. Requirements for facilities, trained healthpersonnel, diagnostic capabilities, and continuous drugsupplies can be daunting. Most developing countries lackthe resources to provide this type of curative service tomore than a small segment of the population in need.
Additional measures that would aid efforts to controlacute respiratory infections include promoting good nutri-tion, i improving housing conditions, and expanding healthfacilities and health education. Teaching mothers and othercaregivers to recognize the early stages of lower respiratory
infection in areas where medical help is available could belifesaving for many children.
Reductions in respiratory diseases accounted for a signifi-cant proportion of the mortality decline in developedcountries over the last century. Much of this decline tookplace before the introduction of modem medical cures. Im-provements in nutrition, sanitation, and housing condi-tions are generally given most of the credit. Si milar socio-economic improvements aided by current medical knowl-edge hold the promise of still more rapid declines fordeveloping countries.
24
MALARIA
PROFILEMalaria has been called "the king of diseases." The hun-dreds of pathogens that cause diarrhea and respiratory in-fections may claim more lives, but no single agent ofdisease can match the power of the malaria parasite to in-flict suffering and death. More than half of the world'spopulation continues to live at some risk of malaria. On-ly a small fraction of the estimated 200 to 400 million newcases occurring each year are ever reported.
Malaria plays a critical role in child survival: pregnantwomen, infante, and young children are at greatest risk ofsevere infection. This group is also at disproportionate riskof death. In areas where transmission is heavy, malaria mayaccount for as many as 10 percent of all deaths before age5. The disease also contributes to high rates of spontaneousabortion, low birth weight, and malnutrition in affectedareas. Despite determined efforts to eradicate or controlmalaria, it remains a powerful enemy of health and survivalin much of the developing world today.
AgentThe parasite responsible for malaria, a plasmodium, re-quires the interaction of human and mosquito to completeits life cycle, as shown in figure 5-A, Plasmodia, whichreproduce inside the mosquito, are passed into the humanblood stream when the mosquito bites. Once inside thehuman, the plasmodium passes through several stages, in-fecting first the liver and then the red blood cells, causingthe classic pattern of chills, fever, and sweating, sometimeswith del i ri um, that can result in death. Some forms of themalarial parasite lodge in the liver, where they retain thepotential to cause recurrences of the disease throughout thelifetime of the victim. When an infected human is bitten bya mosquito, the seeds, or gametocytes, of the plasmodiumin the blood pass to the insect, and the cycle begins anew.
Transmission FactorsDepending on its prevalence in an area, malarial disease isconsidered to be either epidemic or endemic. Epidemicmalaria occurs sporadically in areas where the disease isunstable. Malaria is said to be endemic to an area if theparasite is always present in the population at some level.The extent to which conditions for transmission are metdetermines the extent to which malaria becomes stable, orendemic.
The level of malaria in a community is determined by acombination of environmental factors and the interactivebehavior of human and mosquito. As a primary condition,the parasite requires the presence of both humans and
JMalaria parasiteenters the bodywith the bite of aninfected mosquito
PMalaria first infectsthe liver
Another mosquitobites, draws inmalaria gameto-cytes, andbecomes infected
^Parasite beginsreproductive phase
pMalaria next Infectsthe red blood cells
Demographic Data for Development Project
malaria-carrying Anopheles mosquitoes in sufficientnumbers to ensure continuous transmission. The mosquitopopulation and consequent risk of disease fluctuate withseasonal patterns of temperature, humidity, and theavailability of breeding sites. Warm, humid climates favorthe reproduction of both the mosquito host and the para-site itself. Favorable climatic conditions also extend themosquito's life span, thereby increasing the spread of thedisease. Thus, although malaria has essentially been erad-icated in Europe and the southern United States, it remainsdeeply entrenched in most tropical and subtropical cli-mates where mosquitoes can live and breed year-round.
The insects behavioral patterns play an important rolein the transmission and control of malaria. There are manydifferent species of Anopheles mosquito, each with vary-ing patterns of breeding and feeding. Some breed in shadedareas, some in bright sunlit water; some rest on the inside
25
Epidemiologtcal Assessment of Status of Malaria, 1984Map 5-A
AREAS IN WHICH MALARIA HAS DISAPPEARED. BEEN ERADICATED. OR SEVER EXISTED
Reprinted with the permission of the World Health Organization.
walls of houses before biting, others feed and rest outsidethe confines of human dwellings. Certain species feed pref-erentially on humans, others live off domesticated or wildanimals. The risk of malaria can therefore vary greatly evenwithin the same climate.
Malaria transmission is often increased inadvertendy byhuman activity. Irrigation and fanning practices can pro-vide new breeding sites for mosquitoes. Human migrationcan introduce the parasite into previously unaffectedpopulations or cause a resurgence of malaria in areas wherecontrol measures have lapsed. In South America's Amazonbasin, for example, rapid population influx and abruptalterations to the environment have created the conditionsfor endemic malaria in an area where the disease had beenvirtually unknown.
Host Factors
There is no complete natural immunity to malaria. Follow-ing repeated in lections, it is possible for adults to developlimited resistance to the severest forms of malarial illness.Even then, malaria remains a serious disease. By someaccounts, it causes more loss of healthy life in endemicareas than any other single disease.
The extent to which malaria is common or endemic toan area will determine its effect on child survival. In areaswhere transmission of the parasite is sporadic, malaria israre and a sudden epidemic can affect all age groups equal-ly. In endemic areas where transmission is continuous andmalaria is entrenched, many adults develop a partialimmunity to the parasite. Increasing levels of transmission
Figure 5-B
Impact of Malaria Control on Infant Health and Survival:Comparison of Treated and Untreated Villages in Kenya, 1970-73
Treated Areas Untreated Areas
Malaria Infection During Infancy
in Treated and Untreated Areas
Cumulative Infant Deaths in
Treated and Untreated Areas
100
75
£ 50
150
100
0 1 2 3 4 5 6 7 8 9 10 11 12
Age in Months
0 1 2 3 4 5 6 7 8 9 10 11
Age in Months
Source: D^ B G r ^ - f j ^ ° n t a ' n e - J H G ' HemDel< " l m P° c t ° f Con™ Measures on Malaria Transmission ana General Mortality." Bulletin of the World Health Organization, 54; 369 377,
Demographic Data for Development Project
27
lower the average age at first infection, thereby shifting theheaviest burden of illness and death towards the youngestage group. At the highest levels, 100 percent of children suf-fer from malaria before age 5. Most of these children willexperience their first infection in infancy.
Pregnant women are at heightened risk from malariainfection. For reasons that are not clearly understood,women lose whatever partial immunity they may haveagainst the parasite during early pregnancy, lmmunologi-cally, they revert to the status of young children. Thisphenomenon is most pronounced during a first pregnancyand diminishes with each successive pregnancy. Upon thebirth of the child or shortly thereafter, the women regaintheir ability to resist the disease. But severe malarial infec-tions during the exposed period can cause stillbirth, fetalgrowth retardation, or premature delivery. Low birthweight among surviving infants greatly increases their riskof death from all causes through the first year of life (seesection on Malnutrition).
The potential health gains from controlling this singledisease are enormous. The direct impact of malaria onchild survival is still a debated issue. Malaria accounts for10 percent of all child deaths in highly endemic areas, butthis figure does not include the silent contribution malariamakes to deaths from other causes. Figure 5-B illustrates the
Higure 5-C
Global Trends in MalariaNumber of Cases Reported, 1974-1984
— World (excl. China, Africa)
• - • !? ' , ' • •
1974 1976 1977 1978 1979 1980 1981 1982 1983 1984
Years
Source: WHO/Malario Action Programme
Demographic Data for Development Project
dramatic results of a controlled insecticide program inKenya. Two comparable villages in a heavily infested areawere selected for this study. In one village, the interior wallsof die houses, where the indigenous species of mosquitoesrest before feeding, were sprayed regularly with insecticide.No spraying was done in the control villages. Over a 5-yearperiod, general mortality in the treated village declined byhalf and infant mortality was reduced by 40 percent incomparison to the control village. Although the healthbenefits from programs of this sort have proved difficult tosustain without commensurate progress in health care ser-vices and general development, they are a clear indicationof the potential of malaria control to enhance health status.
GLOBAL IMPACT ON CHILD SURVIVAL
More than half of the world's population lives in areaswhere malaria is still endemic. About a fifth, largely indeveloped countries, live in areas where malaria has beeneradicated. The credit for this achievement belongs to acombination of socioeconomic development and specialprograms that succeeded in arresting the transmission ofmalaria. Antimalarial activities in most of the regions wheremalaria is endemic have significantly reduced once-uncontrolled levels ot transmission. Yet an importantminority of the world's population—largely located in Sub-Saharan Africa—continues to suffer the full effects of un-controlled malaria. Control efforts in these areas have pro-ved either too difficult or too costly to maintain. Active pro-grams to fight malaria have yielded tangible gains, but theyhave failed to eradicate die disease from those areas whereit is most deeply entrenched. Consequently, any slowdownin the battle against malaria could result in its rapidresurgence to uncontrolled levels.
Global trends in malaria, as shown in figure 5-C, reflectan unstable equilibrium. The total number of reportedmalaria cases declined between 1977 and 1983, with aslight upturn for the latest year reported (1984). Regionaltrends, however, present a pattern ol mixed success. Muchof the world decline comes from effective antimalarial cam-paigns in the Asia region. The most significant reductionsoccurred in India and China, which together account for56 percent of the world population at risk.
By contrast, the malaria situation in the Americas regionas a whole has steadily deteriorated during the last decade.The major negative factors underlying the rise in reportedmalaria cases include the introduction of malaria to newlypopulated areas, the increasing resistance of malaria to in-secticide and drug treatment programs, and financial pres-sures that threaten funding for costly antimalarial activities.
The experience of the Near East testifies to the dangersof complacency in the struggle against this disease. Duringthe early 1970s control efforts appeared to be successfully
28
Regional Trends in Malaria: Number of Cases Reported, 1974-1984
' Patterns may result from unreliable reportingDemographic Data for Development Project
reining in malaria in this region. A sudden resurgence in thelast half of the decade, however, dampened prospects forearly eradication. Turkey provides a case in point.Antimalarial programs there had contained malaria at lowlevels, but the conditions for epidemic malaria persisted.When the malaria parasite was reintroduced into heavilypopulated areas where control measures had lapsed, theresult was an explosive epidemic. The number of reportedcases nearly quadrupled each year for 3 years, rising fromfewer than 3,000 in 1974 to some 115,000 by 1977.
SubSaharan Africa continues to be the primary focus ofmalaria in the world today. Of the 421 million inhabitantsof this region, 372 million live in areas where malaria isendemic, more than half of them in hyperendeinic areaswhere u-ansmission is constant and intense. The quality ofthe malaria reporting is generally so poor that no real trendsfor the African region can be discerned from the informa-tion available, but there appears to have been little im-
provement in the malaria situation in this region.A new and ominous development has also begun to
hamper control efforts: current achievements are beingchallenged by the appearance of new drug-resistant strainsof malaria and insecticide-resistant mosquitoes. Reports ofmalarial infections that do not respond to the standardchloroquine treatment are becoming increasingly wide-spread. Resistance to the second line of drug defense, fan-sidar, has been reported in South Fast Asia and SouthAmerica. Similarly, the effectiveness of insecticides thatonce served as powerful weapons against malaria is beingthreatened by the emergence of malaria-carrying mos-quitoes that have become resistant to one or more of die in-secticides currently in use. Often-indiscriminateagricultural spraying practices have been implicated in thisnew threat to existing control activities. These drug and in-secticide resistance problems make the development ofnew control techniques an urgent issue.
29
THE ROAD TO HEALTH
The key to controlling malaria lies in interrupting the in-teraction between human and mosquito. The two principalstrategies of malaria control are 1) to target the mosquitovector of malaria and 2) to arrest the parasite cycle withinhumans.
Vector-control programs represent only the Latest battlein the historic war against malaria. Development of power-ful insecticides such as DDT was once expected to pave theway for eradication of the disease. Insecticides do in factdeserve much of the credit tor reducing the worldwide tollof death and suffering attributable to malaria, but it is nowclear that excessive reliance on this method of control giveslimited results at best and at the same time fosters insec-ticide resistance.
Experience has demonstrated the greater effectiveness ofbalanced campaigns that combine chemical control withenvironmental measures to limit breeding sites and reducehuman exposure. The possibilities here are vast. Hn-vironmental control strategies can be tai lored to local com-munities and local mosquito species. And simple educa-tion for malaria prevention can tap into a powerful yet oftenoverlooked resource: peoples' ability to take care ofthemselves.
The other principal strategy against malaria consists offighting parastic infection. Antimalarial drugs, especiallythe compound chloroquine, have been the mainstay oftreatment and prevention programs. The provision of anti-
maiarials for curative purposes represents the simplest levelof malaria control. This strategy, which is common in Sub-Saharan Africa, has little effect on the transmission ofmalaria, but does reduce mortality from severe infections.Regular periodic doses can also be used to prevent malarialinfection. As with insecticides, however, the broad use ofthese drugs to prevent malaria represents a double-edgedsword in terms of promoting the evolution of resistantstrains of the parasite. Recent research has yielded a newcrop of antimalarial drugs. One of these, mefloquin, hasproven effective against, the most dangerous form of thedisease and is in the final stages of testing. The Chinesehave been studying a drug called qinghaosu, which isderived from an ancient herbal remedy for malaria. Re-searchers hope that rational use of these new treatmentscan either prevent drug resistance or delay its advent
A new weapon against malaria may soon be added to dieexisting arsenal: a vaccine agai nst the first stage of malariainfection may be available within the next decade. Primatesimmunized with a test vaccine have successfully resisteda direct "challenge" by the malarial parasite. Field trials arepresently under way and research on vaccines for theadditional stages of malaria is in progress. Questions as yetunanswered about a malaria vaccine include its cost, theduration of its protection, and whether it can be given toyoung children. Authorities caution against the expectationthat a malaria vaccine will be the "magic bullet" that canreplace other control efforts. Nonetheless, a vaccine pro-mises to be an important addition to ongoing programsagainst malaria.
I
30
MALNUTRITION
PROFILE
Malnutrition is in many respects the common denomi-nator of the disease and deprivation processes that reducechild survival. Undernutrition affects nearly 40 percent ofall children in developing countries and contributes direct-ly or indirectly to an estimated 60 percent of all childdeaths. Lack of food is only part of the problem. Diseaseitself is a principal agent of child malnutrition. A heavyburden of infection places a formidable strain on what mayalready be a precarious nutritional balance. As a result, thechild is left with a nutritional debt that causes dangerouslags in growth and further vulnerability to the cycle ofdisease and malnutrition. Another major factor inmalnutrition is human behavior. Feeding practices, for ex-ample, especially during illness, can make the differencebetween normal growth and malnutrition, or even betweenlife and death.
Protein-Calorie Malnutrition
Malnutrition can result from a dietary deficiency in any orall of the three major nutrient groups: proteins, calories,and micronutrienLs such as vitamins and minerals. Protein-calorie malnutrition is by far the most common type ofmalnourishment It occurs when a child's total protein andenergy intake becomes inadequate for normal growth. Achild is considered to have protein-calorie malnutrition ifhis weight falls below the critical level of 80 percent of thestandard median weight for his age group. Below this level,the child's risk of death increases exponentially. The graphin figure 6-A shows the experience of children under age3 in Punjab, North India. Their probability of death wasfound to nearly double with each 10 percent drop inweight-for-age below the 80 percent level.
The most severe levels of protein-calorie malnutrition arekwashiorkor and marasmus. Although they represent onlya small part of the malnutrition picture, these extremeshave become familiar to television audiences as a result ofcoverage of recent disasters in Africa. The flaky skin, thin-ning hair and swollen bellies of child victims are symp-tomatic of kwashiorkor. It results from a reduction in pro-tein metabolism relative to calories that can be precipitatedby a chronic dietary imbalance or a severe infection suchas measles. Marasmus is characterized by a state of emacia-tion seen most frequently among famine victims. It occurswhen protein and calories are equally and drastically defi-cient from the diet. Children cannot survive long in eitherof these states. Without improvement, death comesquickly.
Figure 6-A
Risk of Death by Nutritional Status:Children Age 1-36 Months, Punjab, India
12%
acIB
Less Than 60 60-69 70-79 80+
Percent of the Median Standard Welght-for-Age
Source: Keilmann, A.A., C. McCord "Weight-for-Age as an Index of Risk 01 Death inChildren," Lancet, June 10,1978,
Demographic Data for Development Project
Vitamin A DeficiencyAlthough micron utrients are only required in minutequantities, their absence from a diet can carry severe con-sequences. Of die many vitamins and minerals essential toa balanced diet, vitamin A, iron, and iodine play especiallyprominent roles in child survival. Vitamin A deficiency haslong been recognized as the leading cause of childhoodblindness in the world. Now, however, there is evidencethat the impact of vitamin A deficiency on a child beginswell before it induces blindness. Indonesian childrenmanifesting mild symptoms of vitamin A deficiency werefound to be at 3 times greater risk of illness and 4 to 12times greater risk of death than children with no outwardsymptoms. The presence of these mild symptoms wasmore closely associated with subsequent illness and deaththan even the presence of protein-calorie malnutrition.
Iron and Iodine DeficienciesIron deficiency is the leading cause of anemia, an ex-hausting disease that affects more than half of all childrenand pregnant women in the developing world.
Iodine deficiency causes goiter in adolescents and adultsbut is rarely seen in children. It becomes an especially
31
serious issue for child survival when it affects pregnantwomen. Children bom to iodine-deficient mothers are atrisk of being mentally retarded to some degree. The mostserious outcome is cretinism, where the child is bom deaf-mute, mentally retarded, and shows abnormal motordevelopment.
IMPACT ON CHILD SURVIVAL
Low Birth Weight
The road to health for a child begins before birth. Indeveloping and developed countries alike, the birth weightof an infant is the most important single determinant of itschances for survival. Low birth weight infants—those whoweigh less than 2,500 grams (5.5 pounds) at birth-experience higher mortality from all causes through thefirst year of life and beyond. Figure 6-B depicts the patternof decreasing risk with increasing birth weight The data aredrawn from births in the state of Massachusetts. Whiledeath rates for infants bom in developing countries are cer-tainly higher at all points, the dramatic rise in mortalitybelow 2,500 grams occurs in all regions.
Of the many factors that influence the incidence of lowbirth weight, the most common relate to the nutritionalstate of the mother both before and during pregnancy. A
Figure 6-B
Infant Mortality by Birth WeightState of Massachusetts: 1972
85.2%
500 1000 1500 2000 2500 3000 4500
Birth Weight in Grams
Source: Friede, A.M., S. Becker, PH. Rhodes, "The Comparison of Infant MortalityRates When Birthweight Distribution Differs," Proceedings of the 1985Public Health conference on Records and Statistics, Hyattsville, MD,Public Health Service, 1986: p. 370-374.
Demographic Dam for Development Project
woman's caloric needs increase during pregnancy and riseto still higher levels when she breastfeeds. For manywomen in areas where fertility is high, there is barely ti meto recover the nutritional debt from one pregnancy andbreastfeeding experience before the next one begins. Theproblem is intensified by heavy physical workloads duringpregnancy, maternal malnutrition, numerous pregnancies,and short birth intervals, all of which are important risk fac-tors for low birth weight. Whatever the root cause, a lowbirth-weight infant faces an uphill battle. He is alreadymalnourished when his life begins.
Feeding Patterns
The impact of nutrition on the survival of a child is general-ly considered in two time frames, the period of exclusivebreastfeeding which optimally extends 4 to 6 months frombirth, and the subsequent weaning period, when the dietof breastmilk begins to be supplemented with other foods,which extends to the end of the third year. Good nutritionduring the child's first 6 months is especially critical. An in-fant's weight should more than double during this period,when the rate of growth is faster than at any other periodin life. A child's health is particularly sensitive to interrup-tions in growth at this time, whether they result from inade-quate nutrition or from a heavy burden of infection. Natureprovides both a balanced diet and important protectionfrom disease in the form of breastmilk, as noted in TheRoad to Health section, which follows. The importance ofbreastfeeding cannot be overemphasized. In areas wherethere are no viable feeding alternatives, infants who areweaned early or never breastfed at all are at significantlyhigher risk of illness, malnutrition, and death.
Weaning
Beyond the age of 6 months, breastfeeding alone will notmeet the nutritional needs of a growing infant. The weaningperiod is a critical passage during which the childestablishes greater independence from his mother. Theprice of that independence is greater exposure to the out-side environment and its attendant agents of disease andmalnutrition. His new supplemental diet introduces thechild to common contaminants in iood and water, andgreater mobility brings him into contact with a range ofnew diseases carried by other children and adults. At thesame rime, the passive immunity inherited from hismother, which protected the child from many of thesediseases in the first months of life, has begun to decline. Asa result, the weaning period is marked by frequent illness.Respiratory and diarrheal diseases increase sharply. Indeveloping countries, the major contagious diseases ofchildhood (e.g., measles, pertussis) also tend to convergeat this time.
32
Figure 6-C
Regional Pattern of Acute Protein-Calorie MalnutritionMedian Prevalence of Low Weight-for-Height (Wasting) by Age
Near EastLatin America& Caribbean
17.9
1 1 Africa Asia
Under 1 year
Age In Years
Note: Points represent regional medians (or each age group. Data were available lor 25 countries.
Source: Keller, W, CM Fillmore, "Prevalence of Protein-energy Malnutrition," World Health Statistics Quarterly, 36(2), Geneva, Switzerland, 1983.
Demographic Data for Development Project
Nutritionally, the child switches from a diet that isbiologically determined to one that is socially determined,often to his detriment. Traditional weani ng diets frequentlylack sufficient quantities ol essential nutrients, particularlyprotein, vitamin A, and iron. Sometimes the problem is anabsolute lack of food. More often, however, available foodsthat contain these elements are not considered "appro-priate" for young children. Foods for young children needto have more calories per given amount, because whilechildren's caloric needs are high, their stomachs are small.They cannot consume as much as adults, and thereforehave difficulty in meeting energy needs from normal adultfoods. For their part, children often have their own ideasabout what is appropriate to eat. Foods high in protein andvitamin A are often excluded from weaning diets. As aresult, children are at higher risk of malnutrition during theweaning period than at any other time. The regional pat-terns of acute protein-calorie malnutrition depicted infigure 6-C show a dramatic peak around age 1, which cor-responds to the midpoint of the weaning period. Acuteprotein-calorie malnutrition, or wasting, is measured by the
ratio of a child's weight to his or her height. Below 80 per-cent of the median weight for healthy children of the sameheight, a child is said to be acutely malnourished. Thismeasure is considered to be a sensitive indicator of a child'simmediate nutritional status and health risk. The problemsof vitamin A deficiency and nutritional anemia also reachtheir highest levels in early childhood. The impact of poorweaning practices and heavy burdens of infection is seenin the high yearly toll of deaths in this age group.
The Disease-Malnutrition linkThe strong interaction between disease and malnutritionstems from both biological and social causes. Biologically,many diseases raise a child's metabolic rate and hence hisfood requirements. Certain parasitic organisms actuallycompete with the child for ingested food, and diarrhealdiseases work to inhibit food absorption. Very oftendiseases occur together, posing a serious challenge to theneeds of a child who may already be limited to a sub-sistence diet. On the individual level, the child's loss of ap-
33
petite is apt to further limit food intake. On a social level,when a child becomes sick, the parental response may beto stop regular feeding, which results in further deteriora-tion of the child's nutritional status.
As disease can precipitate malnutrition, so malnutritioncan complicate disease. Deprived of essential nutrients, thebody loses its normal ability to resist disease. Both theseverity and duration of disease have been shown toincrease in moderately and severely malnourishedchildren. Consequently, mortality from common com-municable diseases is far higher among children in poordeveloping populations than among children who receiveadequate diets.
The synergism of disease and malnutrition—the tenden-cy of these conditions to complement and intensify eachother when combined—is an important factor in child sur-vival. At a critical level of growth retardation and diseaseburden, this synergism establishes a vicious cycle thatculminates in death. It has been estimated that malnutri-tion is a contributing factor in 60 percent of all infant andchild deaths in the developing world.
THE GLOBAL MAGNITUDE OFMALNUTRITION
The world has made significant progress in the battleagainst hunger over the last two decades. Many countriesthat were once periodic victims of famine have nowbecome net. food exporters. India is an example of such acountry (see the section on Food Availability). This pro-gress is reflected in a general decline in infant and childmortality during this period, but much remains to be done.In me developing world today, it is estimated that nearly 40percent of all children under 5 suffer Irom acute or chronicprotein-calorie malnutrition. In absolute numbers, thistranslates into 141 million children in 1980. Figure 6-Dshows the estimated regional prevalence of this conditionamong children. More than one-third of African childrenfall below 80 percent of their expected weight-for-age, asdo almost half of children in the Asian region. Theestimated prevalence is lower in Latin America and theNear Hast at 21 and 24 percent respectively. Because ofAsia's large population size and high proportions ol
Figure 6-D
Estimates of Childhood Malnutrition in Developing Regions, 1980
Number and Percent of Children Age 6 to 60 MonthsAbove and Below 80 Percent of the Median Standard Weight-for-Age
Malnourished children Normal children
20.6 million (35.1%)
10.6 million (24.6%)
38.0 million (64.9%)
32.7 million (75.4%)
Near East
99.1 million (48.3%) Asia
11.6 million (21.1%)
106 million (51,7%)
43.4 million (78.9%)
Latin America & Caribbean
100 80 60 40 20 0 20 40 60 80 100
Number of children In millions
Malnourished children - . Normal children
Note: Low weight-for-age may reflect current, acute malnutrition, the accumulated effects of chronic and acute malnutrition or both. It does not necessarily represent an immediate
Source: Adapted from Haaga, J , C. Kenrick, K, Test, J. Mason, "An Estimate of the Prevalence of Child Malnutrition in Developing Countries," World Health Statistics Quarterly, Table 38,Geneva, Switzerland, 1985
Demographic Data for Development Project
34
Figure 6-E
Percent Low Birth WeightU.S. and Developing Regions, 1982
S.
Africa Near East Asia Latin America U.S.
&
Caribbean
Source: Adapted from World Health Organization, "The Incidence of 1 ow BirttlWeight: An Update," Weekly Fpidemiologic Record, 69(27): 205-212,Goneva, Switzerland, 1984
Demographic Data for Development Project
underweight children, some 70 percent of the world'smalnourished children are found in this region.
The high global prevalence of malnutrition is especiallyastonishing in view of the fact that the estimates were madefrom data based around 1980, when the world was relative-ly Iree of famine. These children are the victims of the per-sistent diseases and sometimes subtle nutritional depriva-tion that act under "normal" conditions of poverty. Suchsevere and deadly forms of protein-calorie malnutrition asmarasmus and kwashiorkor are in fact relatively rare ifhighly visible extremes of a much more pervasive problem.
As a closely related precursor of protein-calorie malnutri-tion, low birth weight follows the same geographic pattern.In figure 6-11, the regional percentage of all births under2,500 grams (5.5 pounds) is shown for 1982. The problemis severest in Asia where an estimated 27 percent of infantsbom in 1982 were below this weight. In India, whichaccounts for more than half of births in this region, ex-cluding China, 30 percent of newborns were criticallyunderweight, as were fully half of infante in Bangladesh.African countries report between 10 and 20 percentunderweight births, with an average of 15 percent. By con-trast, fewer than 7 percent of all infants bom in the UnitedStates weighed less than 2,500 grams. This tiny proportion
of newborns nonetheless accounted for two-thirds of U.S.deaths in the first month of life and 20 percent of infantdeaths from 28 days to the end of the first year.
Each year more than a half-million children becomeblind for lack of vitamin A; two-thirds die within weeks oflosing their sight. Another 6 to 7 million children arebelieved to suffer from milder forms of vitamin A defi-ciency, which has been identified as a significant publichealth problem in 21 developing countries.
Iron deficiency anemia most often affects women ofchildbearing age and young children. Pregnant women arethe most susceptible. Although this is true for bothdeveloped and developing countries, anemia in thedeveloping world is 4 to 5 times more frequent. Frequentinfections and deficient diets consign more than half ofdeveloping country children to the draining effects ofanemia. More than 60 percent of pregnant women areaffected in Asia and Africa. This reflects the greater iron re-quirements of women in general and especially of pregnantwomen, whose needs are likely to be increased in develop-ing countries by iron-poor diets and parasitic infections.
THE ROAD TO HEALTHThe ultimate resolution of the problem of global malnutri-tion lies in a people's ability to feed themselves. Short-termrelief efforts play a lifesaving role during extreme cycles offamine, but food scarcity issues can only be permanentlyresolved through long-term economic: development.
In this context, however, it is important to recognize thatsimple measures to improve health and feeding practicescan be expected to have a significant impact on malnutri-tion and child survival while long-term development isproceeding.
Improved Health and NutritionDuring PregnancyPrevention of low birth weight is the first step on the roadto health. A number of possible courses of action canreduce the risk of low birth weight. Both reducing heavyworkloads during pregnancy and providing dietary supple-ments to women at high risk act to diminish the nutritionalstrains of pregnancy. The strong association between high-risk fertility and low birth weight underscores the impor-tance of family planning in preventing low birth weight andimproving maternal and child health.
BreastfeedingThe nutritional value, anti-infective properties, and birth-spacing effects of breastfeeding make it one of the mostpowerful forces for enhancing child survival. Nutritionally,breastmilk provides the optimal balance and quantity ofessential nutrients to infants up to 6 months of age. Even
35
alter supplementation with other food has begun, breast-milk can continue to be an important source of calories,protein, and micronutrients through the second year ot life.Alternative feeding methods can by contrast only approx-imate the nutritional completeness of mothers' milk, andcannot impart the additional benefits that breastfeedingbrings to both mother and child.
Breastfeeding and Disease: Breastmilk has an idealnutritional balance and also contains anti-infective proper-ties that help protect the child from early exposure to adisease-ridden environment. Breastmilk is sterile andpasses directly from mother to child, virtually eliminatingthe possibility of contamination. This point is far fromtrivial in areas where food- and water-borne diseases are amajor cause of sickness and death. Moreover, breastmilkcontains maternal antibodies, enzymes, and other chemicalproperties that actively resist infection. Numerous studieshave tound that breastfed infants experience lower levelsof mortality and fewer episodes of gastrointestinal andrespiratory illness than infants in the same environmentwho are only partially breastfed or not breastfed at all.Figure 6-F shows that in rural Chile, exclusively breastfedinfants experienced half the mortality of bottle-fed infants,while mortality of infants who were both breastfed andbottle-fed ranged in between. Regardless ol the time periodexamined during the first year, mortality rates for inlantswho were exclusively bottle-fed were twice those of ex-clusively breastfed infants. The anti-infective properties ofbreastmilk clearly play a crucial role in enhancing childsurvival in a hostile disease environment.
Birth Spacing: An additional benefi tot breastfeeding inthe context of child survival is the important contraceptiveeffect it has on the mother, improving the chances of sur-vival for both the newborn and the child that follows.Breastfeeding prolongs the anovulatory period that followschildbirth during which a woman is naturally protectedagainst a succeeding pregnancy. The extent of contracep-tive effect depends on the frequency, duration, and inten-sity of breastfeeding. Women who breastfeed regularly fromthe time of giving birth can extend this protective intervalover 1 to 2 years. In many parts of the developing world,breastfeeding has a greater impact than any other con-traceptive method in promoting healthful birth-spacing.The importance of birth-spacing to child survival is ex-amined in detail in the section on high-risk fertility.
Breastfeeding PromotionIn many areas of the developing world, prolonged
breastfeeding continues to be the rule. Its prevalence isgenerally highest in poorer, rural areas. Within the last 10years, there has been a dramatic resurgence in rates ofbreastfeeding in the developed world as awareness of itsnatural benefits has grown. Among women in developingcountries, however, the trend has been away from
Figure 6-F
Mortality for 3 Different Time PeriodsDuring First Year of Life By Sourceof Milk: Rural Chile
| T 31 Breastfed only
| | Breast and bottle
| ^ J Bottle-fed only
6.1%
5.6%3.9%
3.8%
2.0%
2 . 9 % ;.'•
MortalityBetween 1 Month
and 1 Year
1.4%
MortalityBetween
3 Months andlYear
•fezm 1-4%
1.0%
MortalityBetween
6 Months andlYear
Source; Adapted from Plank, S., M. Milanesi, "Intanl Feeding and Infant Mortality InRural Chile," Bulletin ot the world Health Organization, 48: 201-210, Geneva,Switzerland, 13/3.
Demographic Data for Development Project
breastfeeding, particularly in urban areas. Given the highfertility and poor health conditions that still characterize,these areas, a decline in breastfeeding poses a serious threatto improvements in child survival. Tt is estimated, for ex-ample, that if breastfeeding patterns in Bangladesh were tofall to U.S. levels, infant mortality there would double.
The promotion of breastfeeding to counter this trend hasbecome an important aspect ol child survival programs.These generally take three forms: information and supportprograms in the community, training programs lor healthprofessionals, and efforts to change hospital practices to en-courage new mothers to begin breastfeeding. Informationprograms have enlisted the support ot the media and themedical profession to get the message of breastfeeding'sunique benefits across. In modem hospital settings, thedecision to breastfeed is often influenced by hospital prac-tices and the advice of health professionals in the first fewdays following birth. Women who are allowed to room-inwith their newboms appear to be more likely to start
36
breastfeeding, which both fosters intimacy between motherand child and increases the likelihood that the mother willcontinue to breastfeed. Figure 6-G shows the results of anintensive breastfeeding promotion program in Costa Rica.Rural hospitals that instituted a rooming-in policy wit-nessed a significant rise in the number of mothers breast-feeding at birth and during the child's first year. Whenrooming-in and other activities were undertaken to en-courage breastfeeding, another hospital program recordeda 75 percent drop in neonatal mortality rates over 5 years,mostly from a decrease in diarrhea deaths.
Improved Weaning PracticesThe promotion of careful weaning practices is another im-portant health intervention. The extent of risk incurred inthe weaning transition depends on when it begins and howabruptly it ends. Gradual weaning is safest for the child. Ashe grows accustomed to a supplemental diet, he still enjoysa level of disease protection from breastmilk and receivesthe benefits of an important source of proteins, calories, andvitamins. In fact, breastmilk may provide the major source
of such essential nutrients as iron and vitamin A when theyare lacking from weaning foods. In a hostile disease en-vironment, early and abrupt weaning has serious healthimplications for the child. Sudden cessation ofbreastfeeding can occur if the child becomes sick or themother becomes pregnant again. Deprived of a gradualtransition, the child must adjust to a new diet, increased ex-posure to disease, and loss of immune protection all atonce. The younger the child, the more dangerous suchabrupt weaning becomes.
Healthy weaning means insuring that the child's new dietcontains the nutrients necessary to sustain normal growthand development. Efforts to ensure healthy weaning varyfrom providing direct food supplements to pre-schoolchildren to simple education and the promotion of low-cost, locally available weaning foods. A single vitamin Acapsule costs as little as 2 cents and can protect a childagainst blindness and probably other illness for a full 6months. In the case of micronutrients like iron and iodine,programs at the national level to fortify common foods soldin markets provide more comprehensive protection.
Figure 6-G
Impact of Breastfeeding PromotionTwo Examples from Costa Rica
Impact of Rooming-in on Level andDuration of BreastfeedingTwo Rural Hospitals in Costa Rica
No Roomlng-ln Rooming-ln
Impact of Breastfeeding Promotion onNeonatal Mortality
This child is breastfed from birth and starts normal growth. But his weaning begins late and ends abruptly. When measles strikes,followed by a prolonged case of diarrhea, weight loss becomes critical. Brought Into a clinic with protein calorie malnutrition, the childstarts a special program, receiving dietary supplements and Immunization, while his mother learns simple techniques for ORT anddisease prevention. Even with occasional Infections, the child's growth rebounds and within a year he Is back on the rood to health.
Demographic Data for Development Project
Feeding During IllnessRepeated illness need not result in serious growth lags andmalnutrition. The importance of continued feedingthrough disease episodes must be stressed, especially whenthe conventional wisdom calls for withholding food, livenwhen feeding is continuous, a child can lose weight fromserious or prolonged infection. Extra feeding is essential tofuel a child's "catch-up growth" during the recovery period.
Growth MonitoringGrowth monitoring is one of the cornerstones of globalstrategies to improve child survival. When periodic
measurements of weight are recorded on a growth chartover time, the chart provides a progress report of a child'sgrowth and development from birth. The "road to health"charted by the upper and lower lines in figure 6-H describesthe normal range of weights for healthy children from birthto age 5. A child who enjoys steady weight gain and can staybetween these lines has greatly improved his chances lorsurvival over those of a child who slips below the lowerlimit into malnutrition. The chart is a sensitive indicator ofpauses or lags in growth over time. Regular measurementscan alert parents to the dangers of undemutrition and theneed for additional feeding.
38
HIGH-RISK FERTILITY BEHAVIOR
PROFILEThree aspects of childbearing have an important effect onchild survival beyond ihe. risks posed by malnutrition, in-fection, and lack of health care. They are the mother's ageat birth, the number of children she has previously home,and the length ot time between births. Of these factors, thebirth interval appears to have the greatest impact on childsurvival. A child who is bom soon after another child, orwhose birth is rapidly followed by another birth, has amuch greater chance of dying. Many children are placed indouble jeopardy by being born between two short intervals.Short intervals are 2 years or less, a time period that givesa mother at most little more than a year to breastfeed, torecover from the physical and nutritional strains ofpregnancy and breastfeeding, and to prepare for the nextchild. The shorter the interval the greater the risk to thechild. By the same token, when 1, 2, or 3 years are addedto the interval, the child's survival chances tend to riseaccordingly.
Figure 7-A
Percent of Births Close to Another Birth
Preceding Birth IntervalLess Than 2 Years
Africa Near East Asia Latin America &Caribbean
Following Birth IntervalLess than 18 Months
A.iica East Asia Latin America &Caribbean
Note: Values are the unweighted average percent of surveyed countries in agiven region.
Source: Hobcraft, J , J.W. McDonold and SO. Rutsteln, "Child-Spacing Effects onInfant and Early Child Mortality." Population Index, 49(4): 585-618. table 2,Princeton University, N.J., 1983.
Demographic Data for Development Project
Figure 7-B
Percent of Children Who Die Before Age 5,When Births are Spaced at Least 2 Years Apart,and When a Preceding and/or Following BirthOccurs Within 2 Years
Mortality level of children bornat least 2 years apart
M M Increased mortality level of children born less than2 years after another child
B ^ H Increased mortality level of children born less than 2 yearsafter another child, and then closely followed by another child
Indonesia
Nepal
Peru
Lesotho
Haiti
Bangladesh
Pakistan
Ecuador
Korea
Ghana
Kenya
Thailand
Mexico
Colombia
Philippines
Sudan
Jordan
Syria
Sri Lanka
7
11
9
11
10•I"?. ?
10
5 •„• ; . . . K
5 13
8 12
13
19
14
16
18
14
15
13 21
15
19
13 21
16 20
17 20
16 18
16 17
j 14
13•
13
25
25
24
25
29
28
29t
M
29
^ 2 6
24i^m
24M
23
23
35
34
32
32
31
tom
0 10 20 30
Percent of Children Dying Before Age 5
Source: Hobcraft, J., J.W McDonald and SO. Rutsteln, "Child-Spacing Effects onInfanl and Early Child Mortality," Population Index, 49(4): 585-618, Table 9,Princeton University, N.J., 1983.
Demographic Data for Development Project
39
IFigure 7-C
Relative Mortality Levels of Children Born to Mothers of Different Ages
Second Year Mortality
•52
si3
Relative mortality level of childrenborn to mothers age 20 to 29 = 100
. • V
19 or younger 20 to 29 30 to 39
Age of Mother
40 or older
I19 or younger 20 to 29 30 to 39 40 or older
Age of Mother
Note: Values are unweighted averages of 41 countries.Source: Rutstein. SO, 'Infant and Child Mortality: Lovels, Trends and Demographic Differentials," Revised Edition, World Fertility Survey Comparative Studies No. 43, Table 12, International
Statistical Institute, Voorburg, Netherlands, 1984.Demographic Data tor Development Project
IMPACT ON CHILD SURVIVAL
Time Between Two BirthsShort birth intervals are a universal health risk. Childrenborn in quick sucx:ession are at greater risk oldying in everyregion of the world, in both urban and rural areas, and incountries at all levels of mortality. Moreover, close birth-spacing increases mortality in families at all socioeconomiclevels, even those in which the parents are wealthy andwell-educated. The adverse effects of close spacing afflictchildren bom to women of all ages, and children of all birthorders. Children of every circumstance are disadvantagedby bei ng born 1 ess than two years apart. Sustaining a longerinterval between births provides a simple preventivemeasure against a major hazard.
Short intervals between births affect many children. Bynot spacing births, a woman reduces the survival chancesof both her young infant and her next child. It is commonin many developing countries for women to bear childrenin rapid succession, and where fertility is high, mostchildren will have both an older and a younger sibling.Figure 7-A shows regional proportions of children who arebom soon after another child, and whose arrival is quicklyfollowed by the birth of yet another child. In some coun-
tries nearly half of children are born less than 2 years afteran older sibling, and one-fourth do not reach their firstbirthday before their mother becomes pregnant again.Many of these children find themselves in double jeopardywhen they arrive between two close births. In looking at thedangers of close spacing, and the numbers of children sub-ject to such risk, it is possible to estimate the number ofdeaths attributable to this cause. During 1986 approxi-mately 2 million children under 5 will die because ofhazards associated with rapid childbearing. It is esti matedthat, on average, 1 in 5 infant deaths could be averted bylonger intervals between births.
Maternal depletion: The detrimental effect of inadequateintervals between births has a number of causes. Becausewomen who bear children rapidly do not have adequatetime to recover from the demands of a prior pregnancy andbreastfeeding, they become nutritionally and physically ex-hausted. Maternal depletion syndrome, as this exhaustionis called, may cause the birth of premature, underweight in-fants and result in inadequate breastmilk, both ol which aremajor health risks.
Premature and abrupt cessation of breastfeeding: Theonset of another pregnancy soon after the birth of a childis likely to cause him to be weaned long be fore he should.Studies have shown that abrupt and premature cessation
40
of breastfeeding is a major risk to the health of youngchildren, particularly when it coincides with a pregnancy.
Competition: Children close in age are placed in com-petition with each other lor the same maternal and familialresources. Individual parental time and attention arenecessarily lessened, and family resources, including food,must be stretched lurther. Competition for family resourcesappears to be more critical among 2-,3-, and 4-year-oldsthan among children under two. This is seen in the fact thatonly beyond age 1 is excess mortality lessened when a closesibling dies.
Maternal mortality: Women who bear children in closesuccession are deprived of time needed to recover from thedemands of pregnancy, labor, and breastfeeding. Exhaus-tion and higher rates of complications increase their riskof death and jeopardize the survival chances of theirchildren.
Related risks: A number of factors intervene to preventclear understanding of why a short interval between birthsis such an impediment to survival. For example, somehouseholds may have conditions that affect all children—acommon cause that reduces their survival chances. Thedeath of a child may spur an early new pregnancy to re-place the lost child. The newly born child, arriving after ashort interval, is then likely to be exposed to the same fac-tors that killed the first child. Women who breastfeed all oftheir children briefly (for such reasons as disinterest or theneed to work) place each child at a disadvantage, andresume ovulation sooner than those who continue tobreastfeed. Brief breastfeeding duration both decreases sur-vival chances and shortens the interval to the next concep-tion. Although death rates are higher for children of teenagemothers, who are highly likely to have closely spacedbirths, high child mortality is correlated with short birth in-tervals in all age groups.
Magnitude of the risk: In studies of data collected by theWorld Fertility Surveys (WFS), the mortality of childrenbom at least 2 years apart is compared with that of childrenbom in more rapid succession. In every country mortali-ty rates are higher for children with a close prior birth; inhalf of the countries infant mortality rates are more thandouble for these children, irrespective of whether a subse-quent birth follows. If births are spaced as closely as 3 birthswithin 2 years, first-month mortality triples in more thanhalf of the countries. The effect of a close prior birth con-tinues beyond age 1, though with lessened severity.
When a child's birth is quickly followed by another birth,the risk of death during age 1 is often doubled, and the riskof death during ages 2, 3 and 4 often increases by 50 per-cent. Figure 7-B shows mortality from birth to age 5 forwell-spaced children and increased mortality associatedwith short prior intervals, and associated with both shortprior and subsequent intervals. On average, the mortalityof children bom soon after another child is 80 percent
Hgure 7-D
Percent of Women Age 20-24Who Had at Least One Birth as a Teenager
Bangladesh
Jamaica
Java and Bali
Pakistan
Nepal
Dominican Republic
Jordan
Mexico
Guyana
Colombia
Panama
Costa Rica
Fiji
Thailand
Malaysia
Peru
Philippines
United States-
Sri Lanka
Korea
0 20 40 60 80 100
Percent Who Had a Teenage Birth
• Percent of women exact oge 20 •. • .
Sources: Casterline, JB. and J. Trussel. "Age at First Birth," World Fertility Survey Com-parative studies No. 15, Toble 3, International Statistical Institute, Voorburg,Netherlands, 1980.1984 Cohort Fertility Tables, Division ot Natality Statistics,National Center tor Health Statistics.
Demographic Data for Development Project
higher, and the mortality of children bom between twoshort intervals more than doubles.
Age of Mother at BirthChildren bom to mothers in either veiy young or very oldreproductive age groups are less likely to survive. Teenagemothers are often biologically, emotionally, socially, andeconomically ill-prepared for childbearing. Mothers intheir late 30s and 40s, especially those who beganchildbearing at an early age, may be less able to withstandthe stresses of pregnancy, delivery, and breastfeeding. Theeffect of mother's age is most important during the first yearof life. Beyond infancy the effect diminishes; during ages 1to 5, levels of excess mortality decline. Figure 7-C illustrates
41
the generally observed relationship between mother's ageand the survival of her children. Figure 7-D shows the pro-portion of women who bear a child as a teenager in selectedcountries. Although older age has been assumed to be amajor determinant of child survival, some WFS data sug-gest that the combination oCmany births and too-short in-tervals may be the more important factor.
Number of Children a Woman hasBorne PreviouslyFirstborn children and those who follow many brothersand sisters exhibit high mortality, as illustrated in figure 7-E.Compared with children bom second or third, excess mor-tality of firstborns is acute soon after birth, but after age 1,firstborns are no longer at a disadvantage. Mortality ofchildren of high birth orders is high at all ages. Thesechildren may suffer from competition from siblings, aremore likely to be cared for by someone other than theirmother (usually an older sister), and their births are morelikely to have been considered unwanted. Though the asso-ciation between high fertility and low socioeconomic statusamplifies the disadvantage, being born at a high order is amortality disadvantage at all levels of parental wealth andeducation.
THE ROAD TO HEALTH
Children who are closely spaced, have numerous siblings,or are born to mothers in the youngest and oldestchildbeari ng ages are at a significantly increased risk ot dy-ing. Differences in risk, particularly when births are closelyspaced, can be enormous. The global death toll from high-risk fertility among children under age 5 will probablyexceed 2 million during 1986 alone.
Fertility behavior is deeply rooted in the cultural,economic, and political fabric of a nation. Changes in thenumber of children parents desire, and in the belief thatbirths cannot or should not be planned, imply majorchanges in family relations, the status ot women, expecta-tion oflife for children, and the outlook mat certain aspectsof life are predetermined. Contraceptive technology existsthat can enable couples to effectively plan births. It is nottechnology that is lacking, but global access to thistechnology, as well as national, familial, and individualmotivation to use it. Although information and educationprograms can encourage family planning, without effectivedistribution and a reliable source of supplies, efforts and en-thusiasm can be undermined.
Surveys of fertility and contraceptive use in developing
Figure 7-E
Relative Mortality Levels of Children by Birth Order
1 5 Q _ Infant Mortality
140-
130-
i 120-
110-
100-
« Second Year Mortality
<B IB
Relative mortality level of children
born 2nd or 3rd - 100
ist born 2nd or 3rd 4th to 6th 7th or higher
Birth Order
1st born znd or 3rd 4th to 6th 7th or higher
Birth Order
Note: Values are unweighted averages of 41 countries.
Source; Rutstein, Shea a , "Infant and Child Mortality: Levels, Trends and Demographic Differentials," Revised Edition, World Fertility Survey Comparative Studies No. 43, Table 14, Interna-tional Statistical Institute, Voorburg, Netherlands, 1984.
Percents not wanting a birth are adjusted to excluc
Age 15-44 Who Do Not WantUse Contraception
Percent whodo not want abirth during
the next year
70-76_
65'41"IT—
54'33-78—
76
74-86—-
8627"
7V84-—8T90-55—_
9189
_899087848488919379—
78929,788*9084-92"——
e the percent undecided or not stated
Percentwho do notwant any
more births
831_114351414471822
534241366719
48514276434242586566
5274584969537259534062597654656331745657
to Become Pregnant
Percent who useTraditional
method
191024373141112
• 155570
46411100121253
2158148948243333651325612
Modernmethod
119161103010428
23212215351
93624432674173256
451129524357432732213242449345725184938
Percent who knowOnly
traditionalmethods
27169
66152122112
000100
0010200000
06000001000000001601
At leastone modern
method
13802861188361620595089
9010092789824
961007910092527595100100
9951991009610099909983958693100909995789998
Table 7-A
Percentknowing a
source for anymodern method
_57
__43___ ;__46
__
_78-
46__97_15_
7789
7038
_899969
___55679478__65
-
Traditional methods include douche, withdrawal, rhythm, abstinence, "other." Modern methods includevoluntary sterilization, oral contraceptives, intrauterine devices (lUDs), condoms, injectables, and vaginal methods (spermicides, diaphragms and caps).method includes women who also know traditional methods.' only fecund married women are included+ lor married women aged 15-49, "use" stotistics ore for ever-married women, "source"* percents not warning a birth ore for 1978
statistic is for all women
Sources: "Fertility ond Family Planning Surveys," Population Reports, series M, No, 8. Population Information Program, Johns Hopkins University, Baltimo3,6,7,9, "Kenya Contraceptive Prevalence Survey," Central Bureau of Statistic , Ministry of Planning and National Development, Nairobi, Kenyc
iemographit
Women knowing at least one modern
e. Md. September-October 1985. tables.1984,
Data for Deve lopment Project
43
I
Icountries indicate that most women who want anotherchild do not want the birth within the next year. Mostwomen know that well-spaced children are healthier. In aWHO study of 42,000 women in Latin America, NorthAfrica, and Asia, more than 90 percent of respondents saidthat short birth intervals harm child health; in Zimbabwechildren born too close together are said to "bum" eachother. Table 7-A shows the proportions of women who donot want a birth during the next year, who want no morebirths at all, and who know about and use contraception.These patterns suggest that when contraception is empha-sized as a spacing tool, it may be more widely adopted.
One indicator of the unmet need for contraception is theproportion of married women of reproductive age whoacknowledge not wanting a child in the immediate futureyet use no form of contraception. In most countriessurveyed, more than 75 percent of women did not want abirth during the next year. Nonetheless, from a fourth to in
some areas nearly all of these women were using no con-traceptive method whatever, abstinence-based methodsincluded. By this indicator, the unmet need for contracep-tion is greatest in Africa, where in most countries surveyedit exceeds 80 percent. The level of unmet need also exceeds80 percent in Bangladesh, Nepal and 1 laid, and ranges from24 to 71 percent in the rest of Asia and Latin America.
If a family's goal is to have as many surviving children aspossible, high levels of fertility will be preferred, eventhough their children's survival chances are jeopardized.A terrible price is paid for this means of achieving desiredfamily size. Yet it must be recognized that changes in goalsand philosophy are required if deaths from high-risk fer-tility are to be significantly reduced. Healthful spacing ofbirths and bearing children at healthful ages have suchtremendous positive effects on child survival that marshall-ing the political and social will necessary to initiate thesechanges deserves the consideration of all.
44
Socioeconomic Factors and Child SurvivalEducation and LiteracyAvailability of Modern Health ServicesIncome Per Capita and
Government ExpendituresFood AvailabilityWater Supply and Sanitation Facilities
45
EDUCATION AND LTTERACY
PROFILE
The lowest mortality rates are found where large propor-tions of the population are literate and where educationalattainment is high. Because countries with high levels ofeducation are also more likely to provide such benefits asclinics, hospitals, immunization programs, and clean watersystems, education is sometimes viewed as an indicator ofthe presence of these other facilities. Education, however,provides a major health benefit in and of itself. Mortalitylevels are more closely related to national levels of literacythan to levels and distribution of income. The globalassociation between female literacy and child mortality is
depicted in figure 8-A. Each point represents a country, andshows that more children survive to age 5 in countrieswhere more women can read and write.
Within countries, a child's risk of death is associated withthe education of his parents. The impact of parents' educa-tional attainment on child survival is greatest in countrieswhere death rates are high. When education is com-monplace and mortality is low, everyone benefits fromdecreased exposure to infectious diseases and the betterhealth and sanitation practices of neighbors. Educationalattainment also appears to be more important in areaswhere government expenditures on health facilities arelow.
Figure 8-A
»Malawi
i Somalia
Pattern of Association Between Percent of Women Literateand Percent of Children Dying Before Age 5
• Represents one country
n . t • Afghanistan
32• Mali • Sierra Leone
30
28
•n 26
f 24I 22% 20
o 18
| 16
O 14
I -1 '°
8
6
4
2
0
• Swaziland
• Peru
• Philippines
7Israel • Sweden
20 40 60
Percent of women 15 and older who are literate
80 100
Source; UNICEF and UNESCO. (Data ace included in Tables 2 and 9 of Appendix I )Demographic Data for Development Project
46
Figure 8-B
Mortality of Children Age 1-4According to the Educational Attainmentof their Mother or Father, Peru 1977-78
Mothers education
24.1%
Fathers education
21.7%
15.0%
7.5%
None 1-3 years 4-6 years
Educational Attainment
7 + years
Source: Hobcraft, J., J.W. McDonald ana SO, Rutstein, Socio-economic Factors InInfant and Chila Mortality: A Cross-National Comparison," Population Studies,38(2) : Table 6,1984.
Demographic Data for Development Project
Although a child is more likely to survive if both parentsare educated, his mother's educational attainment appearsto be of greater benefit (figure 8-B). Studies indicate that forevery year of maternal education, infant and toddlermortality is reduced by .6 percent, and for every year ofpaternal education, mortality is reduced by an additional.3 percent.
The importance of parental education to child survivalappears to increase from infancy to age 5. Data from WorldFertility Surveys on mortality among infants and childrenof varying sodoeconomic status in 28 developing countriesfound the highest infant death rates to be approximatelydouble the lowest rates. By contrast, the highest death ratesof older children were often four times higher than thelowest rates. From birth to age 5, parental educationemerges as more important to survival than father'soccupation, mother's work status, or mother's urban orrural residence. Figure 8-C shows the difference in mortali-ty of children age 1 through 4 of uneducated and primaryschool educated mothers.
Further, studies have shown that children of educatedand literate parents exhibit consistently better levels ofnutrition than do children of less educated and illiterateparents. This is true even when income levels are die same.
Figure 8-C
Mortality of Children From Age 1-5of Mothers with No Education, and of MothersWith at Least Primary School Education
Mother has no education
Mother has at least primary school
Senegal : 1 9
Nepal
Peru
Haiti
Bangladesh
Indonesia
Kenya
Pakistan
Dominican Republic
Lesotho
Mexico
Colombia
Philippines
Costa Rica
Thailand
Panama
Korea
Paraguay
Jordan
Sri Lanka
Syria
Venezuela
Jamaica
Guyana
Malaysia I — 9
Trinidad & Tobago j 7 . u
2.2
1.3
2.5
.7
2.0
2.4
1.1
11.4
10.4
9.4
9.2
8.6
5.2 61
8.0
7.7
19.4
0 5 10 15 20
Percent ot 1-Year-Olds Who Die Before Age 5
Source: Hobcraft, J., J.W. McDonald and SO. Rutstein, "Socio-economic Factors inInfant and Child Mortality: A Cross-National Comparison," Population Studies,38(2): Table 6,1984
Demographic Data for Development Project
47
IMPACT ON CHILD SURVIVAL
Education can help persons mobilize resources for ahealthier community and maximize their effective use.Schooling imparts useful skills and knowledge, andestablishes new attitudes.
Literacy: Parents who can read and write have greateraccess to information. A literate mother who can read theinstructions on a packet of oral rehydration salts is morelikely to administer them correctly. She can better unders-tand posters that offer child-care advice. The ability to writeenables her to record her children's vaccinations, and tomonitor their growth in height and weight.
Skills in using institutions: Women who have attendedschool have had experience with an institution beyond thefamily, and may be more likely to approach, and have skillsin using, clinics and other medical institutions. They maybe less shy and more articulate in asking questions ofhealth professionals. These women may also be more likelyto perceive such services as a right, and to insist that theirchildren be given attention.
Grasping new ideas: Education improves the ability todeal with new ideas, and to accept concepts that, appearcontrary to common sense. The process of taking a childto a stranger, who, by sticking a needle in him, makes himhowl and break out in a fever is difficult to perceive as ahealth benefit. A child suffering from diarrhea appears tohave an excess of water, not to need more. Education is thebridge to understanding that vaccination and oral rehydra-tion are lifesaving procedures that must be undertaken ifa child is to survive.
Learning self-reliance: Educated parents are less likelyto be fatalistic about their children's health—to instead takemore active, personal responsibility for their care. School-ing may also lessen reliance on the opinions of elders, giv-ing educated family members the freedom to follow a moreindependent course in efforts to improve their well-being.
Changing perspectives on health: Schooling canchange mothers' perspectives on child care and health byencouraging the provision of resources to their children.Although education generally improves attitudes towardhealth, it can sometimes have negative effects, as whenbreastfeeding, by being presented as old-fashioned, isdiscouraged.
Greater productivity: Educated parents tend to be betteroff economically. When they earn higher wages, they canbuy more and better food, and obtain better medical care.Educated parents may also be more productive at home,e.g., in effectively preparing and storing food.
Figure 8-D
Percent of Adult Women Who EverAttended School, Distributed by HighestLevel Ever Attended, Kenya 1979
Attended College
Attended Secondary
Attended Primary
1.1
20-24 25-OH 35-44
Age in 1979
45-54 55 +
Source: United Nations Demographic Yearbook 1983, Tables 26 and 38,United Nations, New York, N.Y. 1985
Demographic Data for Development Project
THE ROAD TO HEALTH
Health and education have many characteristics in com-mon: as human capital investments embodied byindividuals, both are valuable in the long run; both are thejoint outcome of public efforts and individual decisions;and both, in addition to being of intrinsic value, act to in-crease economic activity and earnings.
Education is a critical element in improving child sur-vival. Educated parents are more skilled in child care, andbetter able to mobilize limited resources to improve health.Moreover, each additional year of parental education, par-ticularly maternal education, is beneficial to the survival ofa family's children, and this education increases in impor-tance to the child between birth and age 5.
Unfortunately, the benefits of maternal education havehad little impact because until recently few women wereable to attend school. The educational attainment ofyounger women will be significantly higher, based on cur-
48
Figure 8-E
Percent of Men and Women Who Can Read and Write
Illiterate Literate
Men
Women
Africa Near East
" Excluding China
Source; UNtSCO (Data are included in Table 9 ol Appendix 1.)
Asia' China Latin America& Caribbean
Demographic Data for Development Project
Figure 8-F
Percent of Boys and Girls Who Attended Primary School in 1960 and 1980-84
r"'"™'j Boys ^ ^ Girls
77%
1960 iyaU-84
Africa
1960 1960-84
Near East
1960 1980-84
Asia*
100%
93%
1983
China
1960 1980-84
Latin America& Caribbean
"Excluding ChinaNpte: Gross enrollment ratio Bxceeds 100 percent when persons of other age groups are attending school; percents for boys in 1980-84 In the Neor East ond China, and for boys and
girls in 1980-84 in Latin America & Caribbean ore truncated to 100 percentSource: UNESCO (Data are included in Table 9 ot Appendix 1.) Demographic Data for Deve lopment Project
49
rent levels of enrollment. An example of progress in theenrollment of women is shown for Kenya in figure 8-D.Only about one-third of women are literate in all develop-ing regions except Latin America and the Caribbean. Pro-portions of literate men and women are shown in figure8-E. Though enrollment has increased for girls, it still lagsbehind enrollment of boys. Differing educational oppor-tunities for boys and girls and the progress made in this areaover the past 2 decades are shown in figure 8-F. Primaryenrollment is approaching 100 percent for boys in allregions except Africa; girls are almost 100 percent enrolledin China, Latin America, and the Caribbean.
Fewer than half of children who go to primary school goon to secondary school. The gap between male and femaleenrollment in secondary school is even wider. Only 11 per-
cent of African, 35 percent of Near Eastern, 28 percent ofAsian, and 51 percent of Latin American/Caribbean girlsare enrolled in secondary school.
The need for increased education is clear, as is the needfor a major commitment to prioritize education for women.Although progress is being made, further strides are neededto reach 100 percent enrollment of boys and girls. Becausefemale education is such an important benefit to children,the argument can be made that education of girls should begiven greater emphasis. Secondary education, which fur-ther broadens the base of understanding about disease andhealth, becomes an essential goal once high levels ofprimary education are achieved. In areas where a large pro-portion of adult women have never gone to school, adultliteracy programs offer an important alternative.
50
AVAILABILITY OF MODERN HEALTH SERVICES
PROFILE
The. development of relatively simple, effective, and inex-pensive health technologies has opened the doors for thechild survival revolution to spread to all parts of the world.High rates of childhood mortality and morbidity none-theless persist. A large gap remains between what can bedone given current resources and knowledge and what hasactually been achieved. The impediment to child survivalin this case is not disease or malnutrition, but a lack ofavailable health services to address local health needs. Thechallenge is to design, implement, and manage appropriatesystems that ensure that these critical technologies can beput to work when and where they are needed.
IMPACT ON CHILD SURVIVALThe clinical effectiveness of the major child healthtechnologies has been proven. For every disease prevented,every birth spaced, every illness or injury treated, a life maybe saved. But the impact of these health services at the na-tional level varies considerably. "Hie ultimate outcome ofefforts to improve health is subject to the economic, social,and political forces that affect the distribution of criticalhealth services and how they are used. The level ofeconomic development clearly has an important influenceon the resources that can be devoted to health care. Butwhen economic resources are limited, the impact of healthservices depends on their ability to reach the areas ofgreatest need and to address the basic health needs of thebroad population. The availability, accessibility, andappropriateness of health services are closely related to oneanother, and are important determinants ot child survival.
AvailabilityThe simple presence of health facilities, supplies, and per-sonnel in a country does not in itself guarantee a strongpositive impact on child survival. With few exceptions,health systems in developing countries have been modeledafter those in industrialized nations, which emphasizecurative care in sophisticated hospital settings. The cost ofmaintaining the facilities, equipment, supplies, and highlytrained personnel needed to run such institutions tends toquickly absorb most of the national resources devoted tohealth (see figure 9-A). The World Bank has estimated thaton average two-thirds of government health expendituresin developing countries go to teaching hospitals andmedical training. Investments in advanced medical caretypically come at the expense of simpler preventive andpromotive services that have the potential to make a much
Figure 9-A
Health Expenditures and Population Served:Expenditures for Primary Health Care andHospital Care in Ghana
Hospital care receives85 percent of nationalhealth expenditures...
.. .and serves10 percentof population
Primary health carereceives 15 percent ofnational healthexpenditures...
, . . and serves90 percentof population
Source: Adapted from UNICER The State of the World's Children 1985, OxfordUniversity Press. New York, 1985 Figure 20 from A Primary Health CareStrategy tor Ghann, April 1978, Ministry ot Health, Accra, Ghana.
Demographic Data for Development Project
greater impact on health. As a result, while some health ser-vices are technically "available" in these countries, healthcare is effectively nonexistent for those who cannot reachthe hospitals or afford their services.
AccessibilityThe accessibility and appropriateness of health services areclosely related factors that can have a decisive influence onhealth care. Accessibility is a critical factor that has differentmeanings in different settings. It is not only measured interms of distance, but also in terms of affordability of ser-vices and the absence ot social and cultural barriers to theiruse. Figure 9-B depicts a model of health center utilizationin a rural developing country location. In areas wheretransportation is poor, the use of health facilities drops offsharply beyond a 3 to 5 kilometer (2 to 3 mile) distance. Inanother context, people may be discouraged from usinglocal health services because they are too expensive, too in-convenient, or too intimidating. The design of "accessible"
51
services must take all of these potential factors into con-sideration in each new area.
The private sector is playing an increasingly importantrole in improving access to health services in developingcountries. Consistent with the primary health care ap-proach, the provision of supplies and services throughcommercial channels can expand the reach of simple butpowerful health technologies such as ORT, immunization,and contraceptive methods beyond the clinic and hospitalsetting. The idea is not new. Chloroquine treatment formalaria, for example, has been commercially availablethroughout endemic regions tor many years. More recently,social marketing to advertise and sell ORT packets andcontraceptive methods at reduced cost is proving effectivein a number of developing countries. These programs aredesigned to reach people who, for whatever reason, cannotor choose not to use clinic services. Through the privatesector, simple health technologies could become availableas dependably as, for example, soft drinks are today, evenin the most remote locations. Distribution of supplies andservices on this scale would be a major step toward achiev-ing the goals of the child survival revolution.
i
AppropriatenessAppropriate health care might be defined as the kind ofhealth care, within available resources, that most effectivelyaddresses the prevailing health conditions of a population.What is or is not appropriate health care is best determinedbased on local health conditions and the resources that canbe allocated. Considerations include choice and distribu-tion of services offered, type of personnel and trainingnecessary, and the balance of preventive and curative ser-vices. The overwhelming emphasis on curative measuresthat often comes with the Western model of health care isquestionable in areas where so many die from preventablecauses. The approach is both more expensive, requiringhighly trained personnel, costly equipment, and relative-ly elaborate facilities, and tends to limit the range ofavailable services to those areas that can support thelogistical and financial requirements of such institutions.In developing countries, this almost invariably means ur-ban areas. While urban populations and their health needsare growing rapidly, most of the world's people and theworst health conditions are still found outside the cities.
Use of ServicesThe crucial link between providing health services and im-proving health is public acceptance and motivation to usethe services provided. Demand for services is often takenfor granted where health conditions are poor, but cannotbe assumed. Modem health treatments such as immuniza-tion or ORT may compete with traditional health practices,or with fatalistic views of disease that discourage parents or
Figure 9-B
Utilization of Health Services Accordingto Travel Distance: A Theoretical Model
81%
Percent of IIIindividuals usinghealth center bydistance from dwelling
5'tile's
Source: Reinke, W.A, Mathematical Models of Basic Health Care, 1979
Demographic Data for Development Project.
other caregivers from taking action. Before people willadopt effective measures for child survival, they must firstbe made aware that alternative treatments exist, and thatthey are, in fact, better. Secondly, they must be willing to in-vest their time and effort in the process, and to entrust theirchildren's lives to unfamiliar practices and practitioners, nosmall demand in itself.
Both public and private sectors have important roles toplay i n increasing awareness and use of existing health ser-vices. As has been noted, social marketing techniques canenhance the role oi the private sector in expanding thereach of simple health technologies beyond clinic settings.These techniques can also help to increase awareness ofthese life-saving measures and bridge the gap between theavailability of health services and their use.
A community's willingness to take advantage of healthservices depends to a great extent on the social and culturalcontext into which they are introduced. Since mothers arethe primary child care providers in virtually all cultures,their attitudes and practices are likely to be a critical factorin the optimal use of health services for children. It is notsurprising, then, that the level of female literacy is a key fac-tor not only in the adoption of modern health care but inchild survival in general.
52
The experience of Kerala State in India provides a goodexample of what can be achieved when the three issues ofavailability, accessibility, and appropriateness of health careare effectively addressed through the public sector. Thestate has achieved high health standards despite its ex-tremely low level of economic development. Within India,it is paradoxically the poorest state in terras of per capita in-come levels, and the most advanced in terms of life expec-tancy and infant survival. One of Kerala's distinguishingfeatures is its political commitment to provide basic healthservices to all, including the poorest and traditionally mostunderserved portion of the population. As a result, aminimum level of health care that includes both preven-tive and curative services has been made widely accessible.Perhaps most remarkable is Kerala's high utilization rate ofthese services. In terms of outpatient visits to clinics andbabies born in health facilities, Kerala stands well aboveneighboring states with comparable health systems. Thisachievement appears to be linked to the traditionally highliteracy rates in Kerala, especially among women. They arenot only more open to the notion of modern health care fortheir children, they demand it. The state's high standardslor equitable health care are believed to be a tangible reflec-tion of this demand.
Kerala's example also points out that improvements inhealth are rarely isolated—that they are likely to be accom-panied by other aspects of development. In the. case ofKerala, social rather than economic development has madethe di (Terence. liducation has played a major role, as has thegovernment's commitment to secure health as a goal in itsown right.
THE ROAD TO HEALTH
Primary Health CareThe primary health care approach provides a solid foun-dation for addressing the health needs of developing areasby using the means at hand. It is at the heart of current ef-forts to make better use of today's limited health resources,and has been adopted and endorsed by all of the major in-ternational organizations concerned with health, includingthe World Health Organization, UNICEF, and the UnitedStates Agency for International Development. Primaryhealth care is the basis of an international drive to improvehealth for all by the year 2000, with special emphasis onreducing the toll of illness and death among children.
Primary health care is particularly well-suited to solvingthe problems of availability, accessibility, andappropriateness in developing countries. It entails a com-prehensive approach to health that is designed to shift thetraditional emphasis from a few specialized institutions tothe areas of greatest need — the local communities. Theconcept is simple: a country's greatest resource for healthis the potential for its people to take care of themselves. Ahealth system that is community-based can combineeducation and community participation with the provisionof essential health services. When health services areweighed in the local context, efforts to make them ap-propriate for local needs and accessible to everyonebecome an integral part of the planning process.
The success ol community based health servicesultimately rests on the approval and active participation ofthe local community. Primary health care includes ac-tivities in each ol the major categories—preventive,curative, promotive, and rehabilitative. They are limitedonly by what is economically and culturally feasible on thelocal level. Although the design of services for each com-munity will vaiy according to local health needs, a list ofessential services provides a common framework for aprimary health care system:
• education concerning prevailing health problems andthe methods ol preventing and controlling them;
• promotion of food supply and proper nutrition;
• maternal and child health care, including familyplanning;
• immunization against the major infectious diseases;
• prevention and control of locally endemic diseases;
• appropriate treatment of common diseases and injuries;
• provision of essential drugs; and
• basic sanitation and an adequate supply of safe water.
One of the. most important aspects of the primary healthcare approach is that it recognizes that improvements inhealth are an integral part of development, not simply abyproduct of it. This has been confirmed in Costa Rica, SriLanka, China, and India's Kerala State. In each country, suc-cess meant reaching out to provide health services to thosemost often excluded. And in each country, children havebeen found to benefit the most when health conditionsimprove.
53
INCOME PER CAPITAAND GOVERNMENT EXPENDITURES
PROFILEThe generally positive relationship between economicdevelopment and health status is reflected in a country'slevels of per capita gross national product (GNP) and lifeexpectancy, life expectancy in high-income countries suchas Sweden and the United States is 30 to 40 years greaterthan in low-income countries such as Ethiopia andBangladesh (see figure 10-A), where infant and child mor-tality persists at high levels. Health gains in developedcountries have been achieved and sustained in associationwith increased economic development, specifically
through more plentiful and nutritious food, improvedhousing, water and sanitation systems, and expandededucation and medical facilities.
Yet although health improvements appear to accompanyeconomic development, experience has shown that this isnot necessarily the case, and in many developing countries,most notably those in SubSaharan Africa, economicdevelopment has proceeded slowly, if at all. Moreover, theexperience of most developing countries shows that thebenefits of economic development are unevenly distrib-uted among the population. Typically, urban areas that
16'..
Pattern of Association Between Gross National Product Per CapitaLife Expectancy (using a log scale for GNP) m
9•
£
o>~oB
Life
exp
ectc
Source;
Represents one country A
80
75
70
65
60
55
50
45
40
35
1 .;'••• • " C o s t a Rica *
Figure 10-A
and ,
• Sweden
• ^ ' w
Sri Lanka • • • • * • •VenezyoW
• * * : • . * . * j r • . «Saudi Arabiaa • Malaysia ^ r
• El Salvador, * M e x i ^ ^
• • " *\r• •GuatepOa # L i b y a ;
• • • , *l/r «Tunisia
••;. .India • " J< ' • G ° b O n
j ^ •Cameroon
• • J ^ • • 'Nigeria
•Banglaa^T • ''%me' * •Congo 'J*r • • •
j T * *• • •• Senegal f j |
•Ethiopia • • . 4.
# Sierra Leone w '
100 500 1,000 3,000
Gross national product per capita, 1983
United Nations Population Division and World Bank Atlas (Data are included in Tables 5 and 10 of Appendix 1.)
• Oman
7,500 20,000
US dollars
Demographic Data for Development Project
54
become pockets of intense industrial or commercial activi-ty reap the greatest benefits, while rural areas remainneglected. This is particularly true of the distribution ofhealth care services in much of the developing world. Thus,while a country's per capita income level may be increas-ing, large segments of its population may experience no im-provement in their standard of living. This has alarmingimplications for i nfant and child health i n areas where mostindividuals have no access to essential life-promotingamenities. This pattern can be seen, for example, in severalhigh-income countries in the Near East, which continue toshow high mortality rates despite their aggregate wealth.
Increases in GNP also do not necessarily translate into in-creased government expenditures in the health sector; theymay in fact have the opposite effect. In many developingcountries, spending on defense has increased dramaticallyin recent years, while expenditures on health have re-mained constant or declined. As shown in figure 10-13, theaverage developing country government devotes less than6 percent of its expenditures to health; levels of spendingon defense, education, and housing, social services andwelfare respectively are twice this amount. Correcting thisimbalance may require redefinition of security issues andrecognition by national leaders of the long-term economicand social benefits of increased health expenditures.
It is also important to note that significant improvementsin health are possible without high levels of economicdevelopment. Even in the poorest countries, there is com-monly a small segment of the population that enjoys highlife expectancy and high health standards. Several societies,notably Sri I_anka, China, and Kerala State in India, haveadded 15 to 20 years to life expectancy at annual per capitaincome levels of around $300. In the Latin Americanregion, Costa Rica has attained mortality rates that ap-proach those of developed countries, at a small fraction oftheir GNP levels. A number of factors have contributed tothese accomplishments, but each success has been markedby political and popular commitments to health andeducation for all, emphasis on adequate nutrition andhealth care for even the most under-privileged, and a com-mitment to the ideal of popular participation in publicaffairs.
Finally, health and development will continue to proceedhand in hand. Poverty and poor health powerfully rein-force each other. Hence improvements in health are an im-portant contributor to economic development, not simply
Figure 10-B
Percent of Government ExpendituresDeveloping Countries Spend on Health,Education, Housing, Social Services andWelfare, and Defense
Health Education Housing, CifenseSocial Services,and welfare
Note: Values are unweighted averages of countries with data available.
Source: World Bank, World Bank Development Report, lable 26, Washington, DC, 1985.
Demographic: Data for Development Project
a passive result of it In other words, an investment in healthis an investment in development as well.
THE ROAD TO HEALTHEconomic development can be an important factor insecuring better health for children. But it is neither a re-quisite nor a guarantee of health gains. The extent to whicheconomic development improves child survival dependson the extent to which it improves the standard of livingand health conditions for the most disadvantaged segmentsof the population. Sustained political commitment toequitable distribution of services among the populationand increased public expenditures on health and relatedsectors can translate increases in per capita GNP intoimprovements in child survival.
55
FOOD AVAILABILITY
PROFILEFrom a child's perspective, hunger is a simple feet. It meansnot having enough to eat, and is the same for hungrychildren no matter where they live. Yet a shortage of foodon the national or community level may not be the domi-nant factor when malnutrition strikes. Indeed, hunger andmalnutrition occur in areas where the overall food supplyis abundant. The accessibility of food and the equity of itsdistribution among a population are important determi-nants of health conditions in countries throughout theworld.
IMPACT ON CHILD SURVIVALOn an individual level, malnutrition results from the com-bined effects of disease and inadequate, diet. The latter canoccur as a consequence of arbitrary feeding practices aswell as from deficient resources. Hence the problem ofchild malnutrition in the world today cannot be addressedwithout recognizing the potential for improvement within
current food resources through simple health and educa-tion measures.
Nonetheless, the overall food supply remains theultimate limiting factor in the malnutrition equation. Belowa certain level, ail the health interventions in the world can-not spare a child from malnutrition and poor health. Im-provements in the general level of nutrition in westernliurope and the United States are credited with bringingabout significant declines i n mortality during the 19th cen-tury, well before the advent of modern medical technol-ogies. These improvements were the result of increasedproduction of food and better diets, but of equal impor-tance were the relative decline in food prices that madefood more accessible, and better transportation and storage,facilities that dampened the effects of localized crop failuresand sporadic food shortages.
Children are always at highest risk of malnutritionbecause of the extra demands placed on them by physicalgrowth and frequent infection. As a result, fluctuations in
; . Kigure 11-A
Percent of Children Dying Before Age 1 and Per Capita Calorie Availability: Sri Lanka, 1950-80
Percent dying i Total calories per day
£ 5
2400
2300
22200 0
2
2100
2000
1955 1960 1965 1970
Year
1975 1980
Source: Fernando, D, 1986 "Health Statistics In Sri Lanka 1921-80" In Good Health at Low Cost, S. Hdlstead, J. Walsh and K Warren (eds.). The Rockefeller Foundation;New York. 1985.
Demographic Data for Development Project
56
Map 11-A
1982-84 Per Capita Food Production as a Percent of 1969-71 Production
No Data
Source: World Bonk (Data are included inToble S of Appendix!)Demographic Data for Development Project
the overall food supply are reflected in the level of childmortality. The pattern of food availability and infant mor-tality in Sri Lanka, as shown in figure 11-A, suggests a directrelationship. Each increase in total caloric energy supplyper capita is followed by a decrease in the infant mortali-ty rate, often with a 1-year lag time. When energy availabili-ty decreased, in most cases the infant mortality rate ex-perienced an increase over a 1- to 2-year period.
Global Food SupplyDuring die last two decades, food availability has increasedfor the world as a whole, despite rapid population growthand short-term fluctuations caused by famine and war. Thetrend can be seen in map 11-A, in which the average indexof food production for 1982-84 is expressed as a percent ofper capita food production around 1970. The mostremarkable advances have been achieved in South EastAsia, once the focus of global malnutrition. India, whichsuffered periodic famines well into this century, is now anet food exporter. Although malnutrition still exists inmany areas of Asia, the trend is toward increasing food self-sufficiency and better nutrition for the broad population.Many countries in the Near East and Latin America and theCaribbean have also enjoyed net gains in available foodcalories per capita by comparison to 10 or 20 years ago. Themajor exception to these positive regional trends is Africa.For all but a handful of countries in SubSaharan Africa, therate of food production has not kept pace with populationgrowth. Many factors have contributed to this stagnation,including political instability, the worldwide economicrecessions of the 1970s and 1980s, some of the highestpopulation growth rates ever observed, and, most recently,the catastrophic drought that has affected much of Sub-Saharan Africa. As a result, there is less available food percapita in Africa as a whole today than there was 20 yearsago.
THE ROAD TO HEALTH
On the one hand, resolution of the problem of malnutri-tion in the developing world is linked to long-term growthin the availability of food, as it was in the history of westernindustrialized countries. Yet on the other hand, the experi-ence of several countries in the developing world hasshown that malnutrition can be greatly reduced evenwithin present constraints on total food supply andeconomic development. In their recent study "Good Healthat Low Cost," the Rockefeller Foundation details the modelefforts of selected developing countries to reduce mortalityand improve health. The subject areas are China, Sri Lanka,Costa Rica, and Kerala State in India. All lour have achievedrates of mortality and life expectancy that approachdeveloped country levels while remaining within develop-ing country levels of GNP. The countries represented dif-
fer widely in levels of development, types of economicsystem, and forms of government. But their success at im-proving health within developing economy constraintscontains common elements that can be applied elsewhere.These five basic elements are:
• strong commitment to health as a social goal,
• social welfare orientation to development,
• widespread participation in the political process,
• equality of health services coverage for all social groups,and
• linking health programs with general economicdevelopment.
In all four areas, efforts to raise general nutritional stan-dards were only one part of a broad campaign to improveliving conditions through education, health, and variousother development initiatives. Each program directly or in-directly contributed to the success of the others. Togetherthey made a significant impact on health conditions wheresingly they might have failed.
Making basic food supplies accessible to those in needand distributing them equitably have been key elements ofnutrition programs in all four of the examples. Each areahas developed its own approach toward achieving thesegoals. China has utilized its planned economy to institutea two-pronged strategy to promote food self-sufficiencyamong production groups while providing safeguards forperiods during which food production falls short. Keralaand Sri Lanka have traditionally relied on subsidies andrationing plans that provide up to 20 percent of total calorieintake for low-income households. The system has beeneffective in reaching low-income families who might other-wise be hard-pressed to feed themselves. Costa Rica hastaken yet. another approach, using the primary health caresystem to target groups at high risk of malnutrition and pro-vide them with supplemental foods. This effort includesschool lunch programs, supplements for pregnant womenand children threatened with malnutrition, and generalfood assistance programs.
Finally, all four have demonstrated the political will tosupport health and nutrition initiatives despite their cost.These programs represent a substantial investment: beforeSri Lanka was hit by an economic crisis and forced to cutback, the rationing coupon system for rice and other essen-tial foods accounted for up to 24 percent of its total govern-ment budget. Kerala State invested 17 percent of its statebudget on its subsidy and rationing plan. The investmentand effort required to plan, implement, and manage theprograms was in all cases substantial. But in terms ofabsolute dollars, the gains in health and nutrition wereachieved at relatively modest cost.
58
WATER SUPPLY AND SANITATION FAdLTriES
PROFILEClean water is a critical factor in maintaining good healthand preventing illness. A "safe" water supply includestreated surface waters or untreated but uncontaminatedwater such as that from protected boreholes, springs, andsanitary wells. Reasonable access in an urban area is pro-vided by a public fountain or stand post located not morethan 200 meters from a residence. In rural areas access isdeemed reasonable when members of a household do nothave to devote a disproportionate part of the day to fetchingdie family's water Though daily water requirements vary bybody weight, health status, clothing, activity, and climate,the average adult male needs a daily minimum of 2 to 2.5liters for drinking, and an additional 20 to 40 liters for per-sonal and domestic hygiene.
Today, only half of the population of developing coun-tries (excluding China) has access to safe water, and onlya third has access to sanitation facilities. Among regions,Africa has the smallest portion of the population served.Within countries, the worst conditions are found in ruralareas, even though in these areas the availability of spaceand materials may make the construction of sanitationfacilities (e.g., pit latrines) relatively simple. Regional access
of urban and rural populations to safe water and sanitationfacilities is shown in figure 12-A. In recognition of the direstatus of water supplies and sanitation facilities in thedeveloping world, the United Nations declared 1981-1990as the International Water Supply and Sanitation Decade.This decade is dedicated to speeding the construction ofnew water supply and excreta disposal facilities, and tomaximizing the probability that they will be correctlyoperated, maintained, and used. At mid-decade the goal ofuniversal access by 1990 remains distant.
WATERWater Quality: Water affects health in four major ways.First, water can carry pathogens which, when ingested insufficient quantity, can infect the drinker and cause micro-biological diseases (e.g., cholera and typhoid). Water mayalso carry toxic substances such as industrial wastes.
Second, water is important for cleanliness, especially forflushing away feces and urine. Hand-washing is an impor-tant personal health measure. Washing, domestically andin personal hygiene, reduces the incidence of diarrhealdiseases, skin diseases such as yaws, eye diseases such astrachoma (a leading cause of preventable blindness), and
Percent of Population with Access to Safe Water and Sanitation Facilities
Safe Water : Sanitation Facilities
With accessWith access Without access
Figure 12-A
Without access
Urban
Rural
Africa Near East Asia' Latin America& Caribbean
Africa Near East Asia" Latin America& Caribbean
"Excludes China
Note: Regional estinfacilities is 48'
Source; United Nations, General Assembly, Economic and Social Council (Dato are included in Table 10 of Appendix 1).
Note: Regional estimates are averages for countries with data available. Regional estimates in the U.N. source document differ slightly; Asia, percent with urban sanitationfacilities is 48%.
general Assembly, Economic and Social Council (Dato are included in Table 10 of Appendix 1)
Demographic Data for Development Project
59
ectoparasitic diseases such as louse-bome typhus.Third, water can be a critical link for diseases that depend
on transmission by animals or insects that, spend some orall of their lives in water. Malaria, which is transmitted bymosquitoes, is a prominent example.
Fourth, farming, and the process of collecting water fromstreams and lakes, may expose persons to diseases throughskin penetration. An example is schistosomiasis, caused byparasitic worms.
Diarrheal diseases are often a consequence of uncleanwater. For a single pathogen, the higher the ingested dose,the greater the risk of severe diarrhea and death. Studies ofwater supply and excreta disposal improvement projectsoften reveal greater declines in incidence of severe diarrheaand mortality than in incidence of mild diarrhea, which insome cases does not decline significantly. Improvement innutritional anthropometric status—height and weight—isalso seen when water quality and waste disposal are im-proved. The median reduction in diarrheal morbidityobtained from 44 studies of water and sanitation improve-ment is shown in table 12-A.
Water Availability: Where families lack a running tap indie house and water must be drawn and stored for use, therisk of pollution rises because containers may be con-taminated and because water is allowed to stagnate,generally without refrigeration. When infant formulanutrients are added to water collected in this manner, path-ogens llourish. Households that lack safe water experiencegreater infant and child mortality when children are notbreastfed.
When washing of hands and utensils, which reducescontamination by fecal matter, depends on water that mustbe drawn and stored, frequent, abundant use is necessarilylimited and risk of infection rises.
Women and children are particularly affected by theavailability of water because it is usually the woman's taskto fetch water. The greater the distance to water, often amatter of miles requiring hours of walking each day, theless time a woman has for child care and other domesticchores, and the more calories she must expend. A womanwho travels over hilly terrain may use from 15 to 27 per-cent of her caloric intake in fetching water. In urban areas,water often needs to be purchased, which places a heavyburden on meager household incomes.
SANITATION FACILITIESBecause so many of the major infectious agents of diseaseare shed by infected persons via feces and urine, hygienicdisposal of waste is vitally important. Use of toilets canreduce fecal contamination of houses, yards, and neighbor-
Table 12-A
Reduction in Diarrheal Morbidity RatesAttributed to Improvements inWater Supply or Excreta Disposal
Water qualityimprovement
Water availabilityimprovement
Water quality and •availability improvement
Excreta disposalimprovement
Median percentreduction
16
25
37
22
Source: Esrey, S A , R.G. Feacham and J.M. Hughes, Interventions for the Control o(Diorrheal Diseases among Young Children: Improving Water Supplies andExcreta Disposal hocilities, WHO Bulletin 63(4), Table 2,1985
Demographic Data for Development Project
hoods. It can also reduce contamination of crops anddrinking water supplies. Hygienic disposal of feces ofchildren who are too young to use a toilet is of particularimportance.
THE ROAD TO HEALTHGreater access to inexpensive, abundant, and clean waterand to effective sanitation facilities is a pressing need indeveloping nations. The lack of these systems exacts aheavy toll on health, as well as on time and money.Creative alternatives to current methods of providing waterare needed to overcome the often prohibitive costs andproblems of conventional construction and maintenance.Encouragement is needed to identify and use uncon-taminated sources (e.g., wells from protected aquifers), treatraw surface water (e.g., with chlorination), protect, water-sheds, and increase water quality surveillance. Excretadestruction and removal, or at least isolation from watersupplies, is needed.
Education in the correct utilization of water and sanita-tion facilities should be an integral part of providing facili-ties. When the mother of a family is literate, she is morelikely to understand the reasons for adopting improve-ments in excreta disposal, and to take the actions necessaryto limit disease transmission from this source. Understand-ing of the link between disease and water, and the impor-tance of washing and using toilets, cannot be taken forgranted, even in the developed world.
• Oral Rehydration Therapy (ORT):— Administration of oral rehydration solution— Continued feeding— Referral when appropriate
• Breastfeeding• Hygienic practices in household (e.g., handwashing, hygienic
handling and storage of food and water)• Improved water and sanitation supplies• Immunization
• Immunization by age 1• Adequate nutrition• Less crowded living conditions
• Immunization by age 1• Hygienic treatment of wounds and injuries
• Immunization of women of childbearing age• Hygienic conditions and practices at birth (especially sterile
treatment of umbilical cord)• Assistance at birth bv trained birth attendants
ACUTE RESPIRATORY INFECTION
MALARIA
MALNUTRITION
• Immunization for vaccine-preventable diseases• Curative drug therapy• Adequate nutrition• Improved housing conditions (e.g., less crowding)• Health education for parents and other caregivers to recognize and
seek treatment for severe respirator)' infection• Expanded availability of services for the treatment of acute
respiratory infections
• Environmental control of mosquito vector (e.g., limiting breeding sites)• Chemical control of mosquito vector (e.g., spraying with
insecticides)• Limiting malaria transmission through preventive action (e.g., use
of screens and bed nets)• Anti-malarial drugs• Possible vaccine in next decade• Education on the patterns and prevention ot malaria
• Improved maternal health and nutrition during pregnancy• Breastfeeding• Improved weaning practices (e.g., timely initiation, adequate
duration, and maintenance of a balanced diet through weaning)• Improved child feeding practices (e.g., meeting the protein, energy,
and micronutrient needs of a growing child)• Feeding during illness• Growth monitoring
HIGH-RISK FERTILITY • Lengthening birth intervals• Shifting childbearing away from very young and very old repro-
ductive ages• Avoiding very high parity• Breastfeeding• Provision of family planning services:
— Wide and reliable distribution of contraceptive methods— Information and education on use and benefits of family planning
62
SOQOECONOMIC FACTORS AND CHILD SURVIVAL SELECTED INGREDIENTS OF THE ROAD TO HEALTH
EDUCATION AND LITERACY
AVAILABILITY OF MODERN HEALTH SERVICES
INCOME PER CAPITAAND GOVERNMENT EXPENDITURES
• Priority on primary and literacy education, especially for girls• Increase percentage of girls receiving secondary education• Literacy programs for no n literate adult women
• Provision of health services that are reliably available, accessible toall, and appropriate for local health conditions
• Balance between preventive and curative services• Emphasis on the primary health care approach. The main tenets of
this approach are:— Education concerning prevailing health problems and the
methods of preventing and controlling them— Promotion of food supply and proper nutrition— Maternal and child health care, including family planning— Immunization against the major infectious diseases— Prevention and control of locally endemic diseases— Appropriate treatment of common diseases and injuries— Provision of essential drugs— An adequate supply ofsafe water and basic sanitation
• Long-term development with the equitable distribution ofeconomic resources
• Reduction of financial barriers to access to health care• Commitment to wide participation in the provision and use of
health services
FOOD AVAILABILITY
WATER SUPPLY AND SANITATION FACILITIES
Efficient distribution and use of existing food resourcesLong-term growth in food availabilityDistribution of food supplies to those in greatest need (e.g., supple-ments for mothers and children in high-risk groups, food rationing,food subsidy programs)
Education in use of sanitation facilitiesEducation in importance ofsafe waterReduction of time and money required to obtain waterReduction of the need for home storage of waterPromotion of washing for personal and domestic hygieneEfficient management of existing water resources:— Identification and use of uncontaminated sources— Treatment of raw surface water— Protection of watersheds— Increased water quality surveillance— Destruction/removal of excreta— isolation of excreta from water supplies
63
64
Selected Bibliography
65
Selected Bibliography: Diarrheal Disease
Black, R.E., et al., "Handwashing to Prevent Diarrhea in Day-Care Centers," American Journal of Epidemiology 113(4):445-451,1981.
Black, R.E., "Diarrheal Diseases and Child Morbidity and Mortality," Child Survival: Strategies for Research, Populationand Development Review, Supplement to Vol. 10, L.C. Chen, H. Mosely (ed.) (New York: The Population Council, 1984).
Black, R.E., K.H. Brown, S.Becker, "Malnutrition is a Determining Factor in Diarrheal Duration, but not Incidence, amongYoung Children in a Longitudianl Study in Rural Bangladesh," The American Journal of Clinical Nutrition, 37:87-94,January, 1984.
Brown, K.H., W.C. MacLean, "Nutritional Management of Acute Diarrhea: An Appraisal of the Alternatives," Pediatrics,73(2): 119-125, February, 1984.
Chen, L.C., M. Rahman, A.M. Sarder, "Epidemiology and Causes of Death among Children in a Rural Area of Bangladesh,"International Journal of Epidemiology, 9(1): 25-33,1980.
Chen, L.C., "Interactions of Diarrhea and Malnutrition: Mechanisms and Interventions," Diarrhea and Malnutrition, LC.Chen and N.S. Scrimshaw (ed.) (Tokyojapan: Plenum Press, 1983), pp. 3-1.9.
De Zoysa,"I.~ R.G. Feachem, "Interventions for the Control of Diarrhoeal Diseases among Young Children:Chemoprophylaxis," Bulletin of the World Health Organization, 63(2): 295-315, Geneva, Switzerland, 1985.
Esrey, S.A., R.G. FeachemJ.M. Hughes, "Interventions for the Control of Diarrhoeal Diseases among Young Children:Improving Water Supplies and Excreta Disposal Facilities," Bulletin of the World Health Organization, 63(4): 757-772,Geneva, Switzerland, 1985.
Feachem, R.G., "Interventions for the Control of Diarrhoeal Diseases among Young Children: Supplementary FeedingPrograms," Bulletin of the World Health Organization, 61 (6): 967-979, Geneva, Switzerland, 1983.
Feachem, R.G.," Interventions for the Control of Diarrhoeal Diseases among Young Children: Promotion of Personal andDomestic Hygiene," Bulletin of the World Health Organization, 62(3): 467-476, Geneva, Switzerland, 1984.
Feachem, R.G., R.C. Hogan, M.H. Merson, "Diarrhoeal Disease Control: Reviews of Potential Interventions," Bulletin ofthe World Health Organization, 61(4): 637-640, Geneva, Switzerland, 1983.
Feachem, R.G., M. A. Koblinsky, "Interventions for the Control of Diarrhoeal Diseases among Young Children: Promo-tion of Breastfeeding," Bulletin of the World Health Organization, 62(2): 271 -291, Geneva, Switzerland, 1984.
Feachem, R.G., M.A. Koblinsky, "Interventions for the Control of Diarrhoeal Diseases among Young Children: MeaslesImmunization," Bulletin of the World Health Organization, 62: 641-652, Geneva, Switzerland, 1984.
Koster, FT, G.C. Curl in, K.M.A. Aziz, A. Haque, "Synergistic Impact of Measles and Diarrhoea on Nutrition and Mortalityin Bangladesh," Bulletin of the World Health Organization, 59(6): 901-908, Geneva, Switzerland, 1981.
Monto, A.S.J.S. Koopman, "The Tecumseh Study. XI. Occurrence of Acute Enteric Illness in the Community," AmericanJournal of Epidemiology, 112(3): 323-333, 1980.
Nagaty, A., "Oral Rehydration Cuts Child Mortality From Diarrhea in Half," Diarrhea Control Newsletter, 1:10-11,1983.
Parker, R.L., W. Rinehart, P.T. Piotrow, L Doucette, "Oral Rehydration Therapy (ORT) for Childhood Diarrhea," PopulationReports, series L, No.2, Population Information Program, The Johns Hopkins University, Baltimore, Md., 1985.
66
Rowland, M.G.M., "Epidemiology of Childhood Diarrhea in The Gambia," Diarrhea and Malnutrition, LC. Chen, N.S.Scrimshaw (ed.) (Tokyo, Japan: Plenum Press, 1983), pp. 87-97.
Sahni, S., R.K Chandra, "Malnutrition and Susceptibility to Diarrhea: With Special Reference to the Antiinfective Prop-erties of Breast Milk," Diarrhea and Malnutrition, L.C. Chen, N.S. Scrimshaw (ed.) (Tokyo, Japan: Plenum Press, 1983),pp. 99-109.
Snyder, J.D., M.H. Merson, "The Magnitude of the Global Problem of Acute Diarrhoeal Disease: A Review of ActiveSurveillance Data," Bulletin of the World Health Organization, 60(4): 605-613, Geneva, Switzerland, 1982.
World Health Organization Scientific Working Group, "Parasite-Related Diarrhoeas." Bulletin of the World HealthOrganization, 58(6): 819-830, Geneva, Switzerland, 1980.
World Health Organization, "CDD Morbidity, Mortality, and Treatment Survey Results," Program for Control of Diar-rhoeal Diseases, Geneva, Switzerland,. 1985.
World Health Organization, "Fourth Programme Report for Control of Diarrhoeal Diseases 1983-1984," Program forControl of Diarrhoeal Diseases, Geneva, Switzerland, 1985.
World Health Organization, "ORA Use and Access in 1983," Program for Control of Diarrhoeal Diseases, Geneva,Switzerland, 1985.
World Health Organization, "CDD Estimates of ORS Access and ORS/ORT Use in 1984," Program for Control of DiarrhoealDiseases, Geneva, Switzerland, 1985.
Cook, R., "Pertussis in Developing Countries: Possibilities and Problems of Control through Immunization," The ThirdInternational Symposium on Pertussis, C.R. Manclark andJ.C. Hill (ed.) (Washington, D.C.: Dept. of Health, Educationand Welfare, Public Health Service, National Institutes of Health, 1979).
Foster, S.O., "Immunizable and Respiratory Diseases and Child Mortality," Child Survival: Strategies for Research, Populationand Development Review, Supplement to Vol. 10, LC. Chen, H. Mosely (ed.) (New York: The Population Council, 1984).
Henderson, R.H., "Vaccine Preventable Diseases of Children: The Problem," in Protecting the World's Children: Vaccinesand Immunization, A Bellagio Conference (New York: The Rockefeller Foundation, 1984).
Koster, FT, G.C. Curlin, KM.A. Aziz, A. Hague, "Synergistic Impact of Measles and Diarrhea on Nutrition and Mortalityin Bangladesh," Bulletin of the World Health Organization, 59(6): 901 -908, Geneva, Switzerland, 1981.
LaForce, F.M., M.S. Lichnevski, J. Keja, R.H. Henderson, "Clinical Survey Techniques to Estimate Prevalence and AnnualIncidence of Poliomyelitis in Developing Countries," Bulletin of the World Health Organization, 58(4): 609-620, Geneva,Switzerland, 1980.
Sherris, J.D., R. Blackburn, S.H. Moore, S. Mehta, "Immunizing the World's Children," Population Reports, Series L, No. 5,Population Information Program, The Johns Hopkins University, Baltimore, Md. March-April, 1986.
Stansfield, J.P., A. Galazka, "Neonatal Tetanus in the World Today," Bulletin of the World Health Organization, 62(4): 647-669,Geneva, Switzerland, 1984.
World Health Organization, "Expanded Program on Immunization: Global Status Report," Weekly Epidemiological Record,60(34): 261-268, Geneva, Switzerland, 1985.
67
World Health Organization, "The WHO's Expanded Programme on Immunization: A Global Overview 1985," World HealthStatistics Quarterly, 38: 232-252 Geneva, Switzerland, (1986).
Foster, S.O., "Immunizable and Respiratory Diseases and Child Mortality," Child Survival: Strategies for Research, Populationand Development Review, Supplement to Vol. 10, LC. Chen, H. Mosely (ed.) (New York: The Population Council, 1984).
Leowski, J., "Worldwide Mortality from Acute Respiratory Infections in Children Under 5 Years of Age," Submitted forpublication, World Health Statistics Quarterly, Geneva, Switzerland, 1986.
Miller, D.L., "Issues for the Future of ARI Control," Acute Respiratory Infections in Childhood, Proceedings of an Inter-national Workshop, Sydney, Australia (1984), R. Douglas, E. Kerby-Eaton (ed.) (Adelaide, Australia: University of Adelaide,1985).
Parker, R.L., "Primary Health Care Interventions for Acute Respiratory Illness in Children," Paper presented at a Seminaron ARI, FKMUI, Jakarta, Indonesia, 11 February, 1985.
Pio, A., et al., "The Magnitude of the Problem of Acute Respiratory Infections," Acute Respiratory Infections in Childhood,Proceedings of an International Workshop, Sydney, Australia (1984), R. Douglas, E. Kerby-Eaton (ed.) (Adelaide, Australia:University of Adelaide, 1985).
Riley, I., "The Aetiology of Acute Respiratory Infections in Children in Developing Countries," Acute Respiratory Infectionsin Childhood, Proceedings of an International Workshop, Sydney, Australia (1984), R. Douglas, E. Kerby-Eaton (ed.)(Adelaide, Australia: University of Adelaide, 1985).
Sommer, A., G. Hussaini, I. Tarwotjo, "Increased Mortality in Children with Mild Vitamin A Deficiency," The Lancet, 10:585-588, September, 1983.
Sommer, A., J. Katz, I. Tarwotjo, "Increased Risk of Respiratory Disease and Diarrhea in Children with Pre-existing MildVitamin A Deficiency," American Journal of Clinical Nutrition, 40,1984.
Tupasi, T.E., "Nutrition and Acute Respiratory Infection," Acute Respiratory Infections in Childhood, Proceedings of anInternational Workshop, Sydney, Australia (1984), R. Douglas, E. Kerby-Eaton (ed.) (Adelaide, Australia: University ofAdelaide, 1985).
World Health Organization, "A Programme for Controlling Acute Respiratory Infections in Children: Memorandum froma WHO Meeting," Bulletin of the World Health Organization, 62(1): 47-58, Geneva, Switzerland, 1984.
Selected Bibliography: Malaria
Brabin, B.J., "An Analysis of Malaria in Pregnancy in Africa," Bulletin of the World Health Organization, 61(6): 1005-1016,Geneva, Switzerland, 1983
Bradley, D., A. Keymer, "Parasitic Diseases: Measurement and Mortality Impact," Child Survival: Strategies for Research,Population and Development Review, Supplement to Vol. 10, LC. Chen, H. Mosely (ed.) (New York: The Population Council,1984).
Ghana Health Assessment Project Team, "A Quantitative Method of Assessing the Health Impact of Different Diseasesin Less Developed Countries," International journal of Epidemiology, 10(1): 73-80,1981.
68
Miller, L R , "Malaria," Tropical and Geographical Medicine, K.S. Warren, A.A. Mahmoud (ed.) (New York: McGraw-Hill,1984).
Payne, D., B. Grab, R.E. Fontaine, J.H.G. Hempel, "Impact of Control Measures on Malaria Transmission and GeneralMortality," Bulletin of the World Health Organization, 54: 369-377, Geneva, Switzerland, 1976.
Pawlowski, Z.S., "Implications of Parasite-Nutrition Interactions from a World Perspective," From the Symposium Nutritionand Parasitic Infection presented by the American Institute of Nutrition, New Orleans, Louisiana, April 16,1982, FederationProceedings 43(2): 256-260, February, 1984.
World Health Organization, "Recent Progress in the Development of Malaria Vaccines: Memorandum from a WHOMeeting," Memorandum From the Scientific Working Group in the Immunology of Malaria, held in Geneva on 26-28 March1984, Bulletin of the World Health Organization, 62(5): 715-726, Geneva, Switzerland, 1984.
World Health Organization, Tropical Disease Research, Seventh Programme Report, 1985.
World Health Organization, "World Malaria Situation 1983," World Health Statistics Quarterly, 38: 193-231, Geneva,Switzerland, 1985.
World Health Organization, "World Malaria Situation 1984," World Health Statistics Quarterly, 39, Geneva, Switzerland,1986.
Selected Bibliography: Malnutrition
Cameron, M., Y. Hofvander, Manual on Feeding Infants and Young Children, Oxford University Press, Delhi, 1983.
Chen, L C , A. Chowdhury, S.L. Huffman, "Anthropometric Assessment of Energy-protein Malnutrition and SubsequentRisk of Mortality among Preschool Aged Children," American Journal of Clinical Nutrition, 33: 1836-1845,1980.
Chen, L C , N.S. Scrimshaw (ed.), Diarrhea and Malnutrition, United Nations University, Tokyo, Japan, 1983.
Chen, L C , H. Mosely (ed.), Child Survival: Strategies for Research, Population and Development Review, Supplement toVol. 10,1984.
Douglas R., E. Kerby-Eaton (ed.), Acute Respiratory Infections in Childhood: Proceedings of an International Workshop,University of Adelaide, Adelaide, Australia, 1984.
Friede, A.M., S. Becker, P.H. Rhodes, "The Comparison of Infant Mortality Rates When Birthweight Distribution Differs,"(Unpublished article), Centers for Disease Control, Atlanta, Ga.
HaagaJ., C Kenrick, K. Test, J. Mason, "An Estimate of the Prevalence of Child Malnutrition in Developing Countries,"World Health Statistics Quarterly, 38, Geneva, Switzerland, 1985.
Institute of Medicine, "Preventing Low Birthweight: Summary," Committee to Study the Prevention of Low Birthweight,National Academy Press, Washington, D.C, 1985.
Keller, W, CM. Fillmore, "Prevalence of Protein-Energy Malnutrition," World Health Statistics Quarterly, 36(2), Geneva,Switzerland, 1983.
Kielmann, AA, C. McCord "Weight-for-Age as an Index of Risk of Death in Children," Lancet, June 10,1978.
69
Mata, L, et al., "Promotion of Breast-Feeding, Health, and Growth among Hospital-Rom Neonates, and among Infants ofa Rural Area of Costa Rica," Diarrhea and Malnutrition, L.C. Chen, N.S. Scrimshaw (ed.) (Tokyo, Japan: Plenum Press),pp. 177-203.
Prosterman, R.L., "The Decline in Hunger-Related Deaths," Hunger Project Papers 1, San Francisco, Ca., 1984.
Puffer, R.R., C.V. Serano, (ed.) Patterns of Mortality in Childhood, Pan American Health Organization, Scientific Publication262, Washington, D.C, 1973.
Rowland, M.G.M., "Epidemiology of Childhood Diarrhea in The Gambia," Diarrhea and Malnutrition, L.C. Chen, N.S.Scrimshaw (ed.) (Tokyo, Japan: Plenum Press, 1983), pp. 87-97.
Royston, E., "The Prevalence of Nutritional Anaemia in Women: A Critical Review of Available Information," World HealthStatistics QuarteAy, 35(2), Geneva, Switzerland, 1982.
Scrimshaw, N.S., C.E. Taylor, J.E. Gordon, "Interactions of Nutrition and Infection," World Health Organization, MonographSeries No. 57, Geneva, Switzerland, 1968.
Sommer, A., Nutritional Blindness, Oxford University Press, New York, 1982.
Sommer, A., G. Hussaini, I. Tarwotjo, D. Susanto, "Increased Mortality in Children with Mild Vitamin A Deficiency," Lancet,September 10,1983.
Sommer, A., J. Katz, I. Tarwotjo, "Increased Risk of Respiratory Disease and Diarrhea in Children with Preexisting MildVitamin A Deficiency," The American Journal of Clinical Nutrition, November, 1984.
World Health Organization, "The Incidence of Low Birth Weight: A Critical Review of Available Information," World HealthStatistics Quarterly, 33(3): 197-224, Geneva, Switzerland, 1982.
World Health Organization, "The Prevalence and Duration of Breast-Feeding: A Critical Review of Available Information,"World Health Statistics Quarterly, 35(2): 92-116, Geneva, Switzerland, 1982.
World Health Organization, "The Prevalence of Anaemia in the World," World Health Statistics Quarterly, 38: 289-301,Geneva, Switzerland, 1985.
World Health Organization, "The Epidemiology of Perinatal Mortality," World Health Statistics Quarterly, 38: 302-316,Geneva, Switzerland, 1985.
World Health Organization, "The Incidence of Low Birth Weight: An Update," Weekly Epidemiobgic Record, 59,27:205-212,Geneva, Switzerland, 1984.
World Health Organization, "Vitamin A: Let there be sight," In Point of Fact, 29, WHO, Geneva, Switzerland, 1985.
Casterline, J.B., J. Trussel. "Age at First Birth " World Fertility Survey Comparative Studies No. 15, International StatisticalInstitute, Voorburg, Netherlands, 1980.
Gubhaju, B.B., "The Effect of Previous Child Death on Infant and Child Mortality in Rural Nepal," Studies in Family Planning,16(4): 231-236, The Population Council, New York, July/August, 1985
Hobcraft, J.N, J.W. McDonald, S.O. Rutstein, "Child-Spacing Effects on Infant and Early Child Mortality," Population Index,49(4): 585-618, Princeton University, N.J., 1983.
Hobcraft, J.N., J.W. McDonald, S.O. Rutstein, "Demographic Determinants of Infant and Early Child Mortality: A Com-parative Analysis," Population Studies, 39: 363-385,1985.
London, K.A., et al., "Fertility and Family Planning Surveys: An Update," Population Reports, series M, No. 8, PopulationInformation Program, The Johns Hopkins University, Baltimore, Md., September-October 1985.
Maine, D., "Family Planning: Tts Impact on the Health of Women and Children," Center for Population and Family Health,Columbia University, New York, 1981.
Maine, D., et al., "Effects of Fertility Change on Maternal and Child Survival: Prospects for Subsaharan Africa," reportprepared for the Policy and Research Division, Population, Health and Nutrition Department, The World Bank,Washington, D.C, 1985.
Maine, D., R. McNamara, "Birth Spacing and Child Survival," Center for Population and Family Health, Columbia Uni-versity, New York, 1985.
McCann, M.F., et al., "Breast-Feeding, Fertility, and Family Planning," Population Reports, series J, No. 24, PopulationInformation Program, The Johns Hopkins University, Baltimore, Md., November-December 1981.
Omran, A.R., A.G.Johnston, Family Planning for Health in Africa. Carolina Population Center, Chapel Hill, N.C., 1984.
Rinehart, W., A. Kols, S.H. Moore, "Healthier Mothers and Children Through Family Planning," Population Reports, seriesJ, No. 27, Population Information Program, The Johns Hopkins University, Baltimore, Md., May-June 1984.
Rutstein, S.O., "Infant and Child Mortality: Levels, Trends and Demographic Differentials," Revised Edition, World FertilitySurvey Comparative Studies No. 43, International Statistical Institute, Voorburg, Netherlands, 1984.
Trussell, J., A.R. Pebley, "The Potential Impact of Changes in Fertility on Infant, Child and Maternal Mortality," World BankStaff Working Papers No. 698, Population and Development Series Number 23, The World Bank, Washington, D.C, 1984.
Selected Bibliography: Education and literacy
CaldwellJ.C, "Education as a Factor in Mortality Decline, An Examination of Nigerian Data," Population Studies, 33(3):395-413,1979.
CaldwellJ.C, P. McDonald, "Influence of Maternal Education on Infant and Child Mortality: Levels and Causes, "Inter-national Population Conference, 2: 79-95, Manila, 1981.
Cochrane, S.H., D.J. CHara, J. Leslie, T h e Effects of Education on Health," World Bank Staff Working Papers No. 405, TheWorld Bank, Washington, D.C, 1980.
Cochrane, S.H, J. Leslie, D J. O'Hara, "Parental Education and Child Health: Intracountry Evidence," Health Policy and Educa-tion, 2: 213-250, Elsevier Scientific Publishing Company, Amsterdam, 1982.
Cochrane, S.H., "The Effect of Education on Mortality: A Quick Review of the Evidence," World Bank Paper, The WorldBank, Washington, D.C, 1985.
Gbolahan, A.O., "Effects of Women's Education on Postpartum Practices and Fertility in Urban Nigeria," Studies in FamilyPlanning, 16(6): 321-331, The Population Council, New York, November/December, 1985.
71
. :
Hobcraft, J.N., J.W. McDonald, S.O. Rutstein, "Socio-economic Factors in Infant and Child Mortality: A Cross-nationalComparison," Population Studies 38(2): 193-223,1984.
Selected Bibliography: Availability of Modern Health Services
Golladay, E, "Health," A Sector Policy Paper, The World Bank, Second Edition. Washington, D.C., February, 1980.
Gunatilleke, G., "Health and Development in Sri Lanka: An Overview," Good Health at Low Cost, S.B. Halstead, J.A. Walsh,K.S. Warren, (ed.) (New York: The Rockefeller Foundation, 1985).
Mosely, H., "Child Survival: Research and Policy," Child Survival: Strategies for Research, Population and DevelopmentReview, Supplement to Vol. 10, L.C. Chen, H. Mosely (ed.) (New York: The Population Council, 1984).
Nag, M., "The Impact of Social and Economic Development on Mortality: Comparative Study of Kerala and West Bengal,"Good Health at Low Cost, S.B. Halstead, J.A. Walsh, K.S. Warren, (ed.) (New York: The Rockefeller Foundation, 1985).
Rohde, J.E,, "Why the Odier Half Dies: The Science and Politics of Child Mortality in the Third World," A Child Survivaland Development Revolution, P.E. Mandl (ed.) (Switzerland: LJNICEF, 1983).
Selected Bibliography: Income Per Capita and Government Expenditures
Hobcraft, J.N., J.W. McDonald, S.O. Rutstein, "Socio-economic Factors in Infant and Child Mortality: A Cross-NationalComparison," Population Studies, 38(2): 193-223 1984.
Preston, S. H., Mortality Patterns in National Populations. Academic Press. New York. 1976.
World Bank. World Bank Development Report. Washington, DC. 1985.
Halstead, S.B., J.A. Walsh, K.S. Warren, (eds.) Good Health at Low Cost. Conference Report, the Rockefeller Foundation.New York, N.Y. 1985.
Selected Bibliography: Food Availability '
Foege, W.H., "Remarks," Good Health at Low Cost, S.B. Halstead, J.A. Walsh, K.S. Warren, (ed.) (New York: The RockefellerFoundation, 1985).
Martorell, R., Sharma, R., "Trends in Nutrition, Food Supply and Infant Mortality Rates," Good Health at Low Cost, S.B.Halstead, J.A. Walsh, K.S. Warren, (ed.) (New York: The Rockefeller Foundation, 1985).
Mosely, H., "Health, Nutrition, and Mortality in Bangladesh," Research in Human Capital and Development, 1: 77-94, JAIPress, Inc., 1979.
Reutlinger, S., J. Pellekaan, "Poverty and Hunger: Issues and Options for Food Security in Developing Countries," WorldBank Policy Study, The World Bank, Washington, D.C., 1986.
72
Selected Bibliography: Water Supply and Sanitation Facilities
Blum, D., R.G. Feachem, "Measuring the Impact of Water Supply and Sanitation Investments on Diarrheal Diseases: Prob-lems of Methodology." International Journal of Epidemiology, 12(3): 357-365,1983.
Briscoe, J, "Water Supply and Health in Developing Countries: Selective Primary Health Care Revisited," American Journalof Public Health, 74(9): 1009-1013,1984.
Briscoe, J., "Evaluating Water Supply and Other Health Programs: Short-Run vs Long-Run Mortality Effects," Public HealthLondon, 99: 142-145,1985.
Briscoe, J., R.G. Feachem, M.M. Rahaman, "Measuring the Impact of Water Supply and Sanitation Investments on Diar-rhoeal Diseases: Problems of Methodology," World Health Organization, Geneva, 71 pp., 1985.
Esrey, S.A., R.G. Feachem, J.M. Hughes, "Interventions for the Control ol Diarrhoeal Diseases Among Young Children:Improving Water Supplies and Excreta Disposal Facilities," Research Bulletin of the. World Health Organization, 63(4), Geneva,Switzerland, 757-772, 1983.
Feachem, R.G., et al., "Health Aspects of Excreta and Sullage Management—A State of the Art Review," World Bank,Washington D.C., 318 pp., 1981.
International Bank for Reconstruction and Development. "Measurement of the Health Benefits of Investments in WaterSupply," Report of an Expert Panel to the International Bank for Reconstruction and Development, PUN Report No. 20,12 pp., 1976.
Mcjunkin, F.E., "Water and Human Health," Agency for International Development, Washington DC, 134 pp., 1982.
National Research Council, "Drinking Water and Health," 4 vols., Washington D.C, 939 pp., 1977" 393 pp., 1980' 415pp., 1980, and 299 pp., 1982.
United Nations, "Progress on the Attainment of the Goals of the International Drinking Water Supply and SanitationDecade, Report of the Secretary General," General Assembly, Economic and Social Council, A/40/108/E/1985/49,1985.
World Health Organization, "Maximizing Benefits to Health, An Appraisal Methodology for Water Supply and Sanita-tion Projects," Geneva, 44 pp., 1983.
73
<• I i
AppendicesChild Survival StatisticsMethodology of ProjectionsDefinitions and Sources of DataCountries and Regions
75
Table 1: Numbers of Infants and Children Age 1-4if 1980-85 Mortality Levels Continue (in Thousands)
I n f a n t s 1-4
A f r i c a
A n g o l aB e n i nB o t s w a n aB u r k i n a F a s o .. / , • > , /B u r u n d i / %:/::C a m e r o o n , U . R e p . o fC e n t r a l A f r i c a n R e p u b l i c .C h a dC o n g oE t h i o p i aG a b o n .////.,G a m b i a ://':
C i h a n aG u i n e a /G u i n e a - B i s s a u •' ' S f i / 0[ v o r y C o a s tK e n y aL e s o t h o / a :L i b e r i aM a d a g a s c a rM a l a w iM a l iM a u r i t a n i a / / vM a u r i t i u s ' ' 0M o z a m b i q u eN a m i b i a
N i g e rN i g e r i aR e u n i o n
R w a n d aS e n e g a L .;,,S i e r r a L e < i n e •''/0//.;
S o m a l i a 0 0 . ' ; :S o u t h A f r i c a ' : : 0 0 •'S u d a n • • ' 0 0 0 ; ; .' ••'•••
Swaziland •• •''''////•'i/ffi;','---T a n z a n i a ' " 0 0 0 K ' / / .•
logo 0000U g a n d aZ a i r eZ a m b i aZ i m b a b w e .
Near East
A l g e r i aC y p r u sl ; s y p [ • 0 ; ; : :[ r a n , I s l a m i c R e p . o fIraqi s r a e iJ o r d a n ;.K u w a i t ' . /."::/::;//
L e b a n o n /'/:'L i b y a n A r a b j a m a h i r i y aM o r o c c oO m a nS a u d i A r a b i aS y r i a n A r a b R e p .T u n i s i aT u r k e yUnited Arab EmiratesY e m e n , D e m o c r a t i cY^00m;m0m,,,.
{ { S i e r r a t i o r i e ' 2222^{{o{{.{{{/: "'•'•.
/Somalia;." ' •. # # #
/South Africa '••00/0) y
/Sudan • l / : 2 # # / . . .
•{•.Swaziland : # # '•
/.Tanzania .•:,.,;:..,;; .
# o g o 2{#2 .
/Uganda
{-Zaire
/Gambia
Zimbabwe
{ A l g e r i a ... . .....
/Cyprus • •••.//:::•////. {/'
;{lran, Islamic Rep. of
2:Iraq
••/Israel ....,{... ..,•,,/.
.{Jordan .. .{2222:/ • .22/{://
/{Kuwait •'{. / # « # / • • / 'i ; l i e b a n o n /./2{{{2/i{//
.wjjihyah Arab jamaimriya
Morocco' ••/.:////{/•..
Oman yy00y: •
Saudi Arabia
Syrian Arab Rep.
Tunisia • yy00yy •
Turkey • 00[yj
United Arab Emirates :{//{
;2Yfemen, Pernoeratfe2 / / / ' • •'•'•'•
j^femet).)).:)yy0)))00)).. '•
1980-85 mortality,
percent of children
dying
Before
age 1
14.9
12:0
7:6/:
15.0 {
12.4
10.3
14.2
14.3/
8.1 2
15.5 :
11:2/17.4/S
9.8 •:
15.9 :
14.3/11 .0 2
#/;58.O/2y''r'y%yyr
13.2/2
6,7 {2
16.32
18 0 /
13:7/
2.8:2
15.3
11.6
,,,/,,14.6//
Z:ft/2i.1.4/22
• '1 ,32/13.2 2
14.2
18,015,5
8 ,3 '•';
11.8 2
12.9
11.5
10.2 i11.2
10.7
8.8
8.0
iW-3i8.8
1.7
10.0
11.5
7.7
1.4
5.4
2.3
4.8
9:7
9.711 7
6:65.9 2
8.52/:
9;2'/{
3.8/
13-5 2
13.5 {
Rpforp
age 5 1985
1 9 . ^ ^ ^
25.0
22;22'2"20.0:
# / 10.5•J/.//'.'25.5 2. / / 2 / / 2 ; 2 i : o . '• ••'
#:/2i7:o': ':|f t '24.0.{f# 224.0
#2/:13.O
##26.0
2/'2'2/:18,6 ";|i:v"23.2
# • / 16.0' :.
\0) lib .."• ,
l p : : ' ; 2 4 : 0 ' ••
{#2:16.5
/2:ft'/i3.0§/:/2'1'5.O
|i2/:22.5 ,#2/10.5 ' •'
•:2{';2{"228.5" '.'
?l#:'31':0'
'002&Q:-# ! 2 2 : 3 : 6 " '••'
'"ft''"'.:26;0 •
19:3
;;i/:2'24:5.' /
#2219.0
:2//2 1.7/2:;2.̂ 22.5
Wy'iAXt :
:W:/2.:.:;31.O'. "
#/2'26.O
»/v{2211.0
{/:*:/20:02{{:22/'2i'.9
#'/2:;19.O
l;«/2;17.0
18.5
18.0
14.0
13.0
60.9 •
.'. 24:4 :/
{••••••2. ' '4.1/: |
0-tim,'••'•• 2 v 2 7 . a W
43.1 2
, 16.1 ;
•••' : ' : 3 1 . * |
•••:6M
332.0
4.5
.••/'•2/5.4
{ 2 : 6 1 . 9
44.8
•2:'//{5,t;../
2 •.:••&&'•
89,2
6.9
13.9
29.4
59.7
•,":2.72:4
12.8
' •,• ym
2 95 .6 /
• • . { . 8 . 0
••2{:{;//45{02{'.
2/'54Z.12'{:
:-0MS.').. ••M'iyy
2 42,2
• 30^3
33.8
102.5
113,4
3.9
128:4
13.5
86.0
143.0
27.9
32.7
13.0
T;9
15.0
17^0
10.5
1.6
7.0
2.7
6.0
14.0
14.0
18.5
2/222 '9.0
# / ' { &ti '•"•| / V ' ' 1 2 : 0 . '.•.'
J/2'2: 11.5)y. ::.2; '4:7''/:. /2
0)'y22*0y
176.9
79.6
0.2
162.6
201:9
51.7
1.3
8.5
"' 1:53.8
15.42
72:7
• . • . : * . s ' .
^ 1 . 1
28,1
•2:2/22!9:i/ '
0ymo:'y22/./2'/1.:3'V
::0:m ,•:• 4 4 : 1 ' ; • •
Annual number of infant and child deaths
if 1980-85 mortality
Infants
1990
^ ^ • ^ ^ ^ ^
| 2,928.0
69.2
2-' • 2S.Z '
0' • 4:ft/'
W '••55.92
/ / / , { . 30,2'
{/ 49.0
:22222,'18,O :
# v {""35:2; / •{• 7 . i
374.9X ••5:4.'
5.9
72:5
• • • • • • • • • • • . • . ' S 0 ;:i -
5.7
•'•• 5 6 . 7
107:8
•' • ':{'• 7 : 8 '
• 16:1 I2 •.&&•'•)
82:522
141/2
: ^'0))•• /2IO9:2V':'2:/.//{9;2
'•"•••:;" 5 1 / 9 2
641:6
^•'.'•2'0:2/'
:•{••• 4 7 . a
47.9
32.837.8
112,8 /
125.4
4:5
152.9
15.6
101.3
164.8
32.9
38.8
927.9
87.0
0.2 /
162.2
214:2
56:3
1:4
106
.•//•/'/I:? ••/
:2:/::;/42fl"/2:/2:/.{;J7:82.{2222/271..4//
"• "y0M
•: • • • {36 : i t : / "
• 2 2 V 3 2 . 3 / /
•: ••••:222m22/:
•/{ ••2139:5 22.'• • • ' • T : * / 2
15:3V/V
2 49.8
1995
3,346.8 ^
v 78.1•K#/32 :4 /2 ; / ; 2
'00)^)0:0yy)m&0))0):33i,y0.•2.;;{{;/255.52. :•/•:
SIK'20:0 0.
•2:i/v39,1 0y
':0y.8X>')0" 421.4 • #
. 6 : 1 • • • / • • -
6.5
84.2
55.4
yyy 6.2'
/« 65.5
128.5
8.6
;I1218.9
#S'38.2 •
:2::22V 78.7
ij!p::93.4
fI'v/16.6
«if % 0-7' • • • • ' ^ • • ' 122 .9
10.4
•.w 59.4
•#751.7
2.#/.O.2
••#2/54:8
:«»'/2.53.9
#2235.2
.{#2 42.3'
i{#:t21.5 ••
#136.5
5.2
180.6
17.8
118.2
188.8
38.5
45.6
9 5 0 . 9 ^
".',.. 88.1"
#:j; 0.2: 160.1
216.6
60.8
1.4
12.8
,y:z2, \ 1
#/2:.:4:1
#•220.2
# 2 •67.2# / •'7.9
#•2'41.9
# • ' 35.4
# 18.5
#{•138.6
0) M.40)) 17.0•#• 56.9
levels continue
(in thousands)
2000
{83-6
.•/•/•••35.1"----/-
#/6{12..
: 2 { 2 - 6 7 ; : 3 ••••{•••
# 3 5 : 4 •••• .
/ • • • / • 5 9 , 7 . "
2/2 21.3/
0m A#V{-e.5
5';45i.3
6.3
6.8
92.1
58.7
6.5
70.9
141.6
9.2
20.7
41.0
84.3
100.5
17.8
0.6
131.1
11.2
64.4
823.0
0.2
59.5
57.7
367
45.3
126.2
142.7
5.7
198.7
19.2
129.3
203:9/42.3
50.1
958.8 j86.0
0.2
160.1
215.3
63.6
1.4
14.1
1.8
4.1
21.4
64.4
8,3
45.3
36.8
18.0
137.3
1.4
178
61.5
1985
—J.555.4
39.0
30.7
1.4
32.3
17.7
26.1
10.5
20.2
3.5
211.8
2.7
1.7
35.8
29.5
3.3
22.2
50.2
2.3
9 0
15.6
41.0
49.2
8.0
0.2
61.8
. . 2 5:0
28.5
330,0
0.0a
26.7
27:1
221.2
21.6
31.2
75.1
2.5
77.0
8.3
51.6
90.2
15.1
18.6
fc 369.3
35.8
0.0
80.7
92.7
18.0
0.2
2.2
0.2
0.9
6.4
32.7
3.5
10.4
9.3
7.7
32.2
0.3
8.3
27.7
Age
1990
1,783.9
44.3
17.5
1.7
36.7
19.7
29.8
11.8
22.7
4.0
239.8
3.3
1.9
42.2
33.1
3.7
26.3
60.9
2.6
10.4
17.9
48.2
56.3
9.4
0.2
71.2
5.7
33.0
392.4
0.0a
30.8
2.«:{2:31.O
'22?>;2'23.O
•22v2{ 24.4:
•2#v34.8
:«83.7
2.9
92.0
9.6
61.1
104.1
17.8
22.2
398.6
40.5
0.0
81.6
101.2
19.6
0.2
2.8
0.3
1.0
7.5
33.1
4.0
12.2
11.0
7.9
34.7
•••'0:3{{
9:6.'i
31.1
1-4
1995
2,050.4
50.4
20.1
2.0
41.3
22.1
33.8
13.1
25.3
. 4:522
270:1
4.0 2
2,1
49.0
36.7
4.0
307
73.5
• •...22:9/.2
00m/y)wmm•WyyS&m2#2{.63:9#
•2.222:{.::/1.0:6{:2
•'•/•22O#/
80.82 2
em37.9
462.6
0.0?
36:0/2
35.0
24.7
27.0
37.8
91:9
3.4
109.2
11.0
71.6
119.9
20.9
26:2
413.3
42.9
0.0
79.8
104.1
21.3
0.2
3.5
/ 0.3
%: 1.0 •'
8.6
31.4
4.4
14.2
12.4
7.7
34:7 2
0y 0.3;
Wy 10.9/:/
•.•••'. •• 3 5 2 5 2 |
2000
2,362.6
{•57:.12:;
. :23:32{
••• -vii
46.8>
24.5
387
14.7:
28.2:;
:'/ '•: . :.5:i/
'):•• • 3 0 6 #
:/• /{•.4.22;
2{/:2/2:3S
0M40.9
4.4?35 .5 /
87.8/
'./{..•{//3:22
222''{2{i:4:52{
:{:22'/23:3:'2
2222 62:7 2
73.0/
. MM
006M0- :'9t.O:/
•2. 7 . 5 /
43.9:
546.5/
0.0*
2 ) 4 2 . 0 ••
'•0)::23J:
26.7/
30:82
40:522
99.6
3.9:2
130.2
12.7
84.5 :
138.2/
.'• ' •{•••24.82y
'••• '231.122
420.4
41.0
0.0 2
79.72
103.0/
23.0:2
0:2ft4:2*
0.31.022
9.7:'
29:0
4.8
16.42
13.2 {
.•:-y.7M
0y;y30o.00HM.#2211:9/
# • • 41.1 ':
78
1980-85 mortality,percent of children
dying
Annual number of infant and child deathsif 1980-85 mortality levels continue
(in thousands)
Asia (without China)
AfghanistanBangladeshBhutanBurma'East Timor
FijiHong KongIndiaIndonesiaKampucheaKorea, Dem. Rep. ofKorea, Rep, ofLaos People's Dem. Rep.MalaysiaMelanesiaMicronesiaMongoliaNepalPapua New GuineaPakistan ;#:PhilippinesP o l y n e s i a •••:
Jordan y y ' . ' ' :{>Xj:KuwaitLebanonLibyan Arab JamahiriyaMoroccoOmanSaudi ArabiaSyrian Arab Rep.TunisiaTurkeyUnited Arab EmiratesYemen, DemocraticYemen
Table 4: Year 2000 Goals for Reduced Infant and Child Mortality,and Numbers of Children Dying Before Age 1 and Age 5if Mortality Levels are Reduced
Africa
AngolaBeninBotswanaBurkina HasoBurundiCameroon, U. Rep. olCentral African RepublicChad
C o n g o . . , . • • •
"Ethiopia ',' :''••GabonGambiaGhanaGuineaGuinea-BissauIvory CoastKenyaLesothoLiberiaMadagascarMalawiMaliM a u r i t a n i a , . : : , ; ,MauritiusMozambique.NamibiaNigerNigeriaReunionRwandaSenegalSiena LeoneSomaliaSouth AfricaSudanSwazilandTanzaniaTogo .;£;;. ;•Uganda ;ooZaire ;„ fe'oZambiaZimbabwe ;
Near East
AlgeriaCyprusLjjyptIran, Islamic Rep. ofIraqIsraelJordanKuwait1 .cbanonLibyan Arab JamahiriyaMoroccoOmanSaudi ArabiaSyrian Arab Rep.TunisiaTurkeyUnited Aral") HmiratesYemen, DemocraticYemen , ,
Year 2000 mortalitygoals, percent ofchildren dying
Angola ,., , , ,B e n i n .;.- ••""'. ••; /.••;•' ',
BotswanaBurkina t'a?>oBurundiCameroon, U. Rep. ofCentral African Kep.ChadCongoEthiopiaGabonGambia, The , ,:/,Ghana ,•,,GuineaGuinea-BissauIvory CoastKenyaLesothoLiberiaMadagascarMalawiMaliMauritaniaMauritiusMozambiqueNamibiaNigerNigeriaReunionRwandaSenegal ;:•Siena LeoneSomaliaS o u t h A f r i c a ,;,; , ,;;•;
SudanSwazilandTanzania, U. Rep, ofTogoUgandaZaireZambiaZimbabwe
Near East
AlgeriaCyprusKgyprIran, Islamic Rep. ofIraqIsraelJordanKuwaitl A a n o n '•.•^••/,v:
!i\),/y/':Libyan ArabJamahiriya'S:W;:>f'5; •
Morocco ''' M0/MO m a n • .#*••%•••;•;
Saudi Arabia : vJSSSyrian Arab Rep. 'TunisiaTurkeyUnited Arab ritniratesYemen, DemocraticYemen
Fiji ' .•••:,,:-;Hong KongIndiaIndonesiaKampucheaKorea, Dem. Rep. ofKorea, Rep. ofLaos People's Dem. Rep.MalaysiaMelanesiaMicronesiaMongoliaNepalPapua New GuineaP a k i s t a n ''/•;'','''' ,'P h i l i p p i n e s •',•: ;',''.''','•••'.: ',P o l y n e s i a ' ••!•''••' •' 'i'\
SingaporeSri LankaThailandViet Nam
182321
25_
98
962468—51474
96__5367
674276„
7465775
1623119
_608645"16—5576_43——8432343037—74
64604
161211
21_
6091
35'14_
6580—45—_
100
20323054—7965612
151
11——
40—
0.116—63————_1847272347_1
19284
43
3
14—
—3725„
—
—
-
16—
—1022
_
—3744_
ArgentinaBoliviaBrazilChileColombiaCosta RicaCubaDominican RepublicEcuadorEl SalvadorGuatemalaGuyanaHaitiHondurasJamaicaMexicoNicaraguaPanamaParaguayPeruPuerto RicoTrinidad and TobagoUruguayVenezuela
8924589062859843
9950304957654816
97949970__9292
Less DevelopedMore Developed jMM|Mfl|fc
SwedenJapanUnited States °
45
3190—
World Total 48
6333628961
7591
204154
217019595740
35735448_656349
43
998197
50
693086
89627588'
22
3954'
21'67
1958566770719747—
6658'59
44
999598
51
672163
915381°8519
547123562153606449834653_105956
36
87"6698"
42
.....—
—6
_—2511—
1-—11-
-_
64
_
11—
——
_
55"
1'10"
92"10025272060601573
90"4'
245
86
100856099*
16,730
7,810
18,160
4,680
I1,2103,690
11,530_
4301,440
—
45030,060
13,590
3,480
7,970
1,1507,170
7,100
4,190
1,740
874765'9240"
9696'
49s
3634'
1660"
12348640"
32*68663099"
949687
430
1,930
1,7101,460
720
2,410760
3,2208,610
8,2003,1202,830
1,800980
1,3101,390
1,360540990
1001 0 0 , • • , „ . , • ,,100' ''."A^1;''/1',
490,, 780
520
Notes appear on page. 96
Table 8: Nutrition: Breastfeeding, Percent Malnourished,and Food Production Per Capita
AighanistanifiangladeshBhutanBurmaEast TimorFijiI long KongIndiaIndonesiaKampucheaKorea, Dem. Rep. ofKorea, Rep. ofLaos People's Dem. Rep.MalaysiaMelanesiaMicronesiaMongoliaNepalPapua New Guinea :,;,;,,Pakistan ' ....'•'•'.'.'Jv1.'1;P h i l i p p i n e s '''''.''}•'•''''}'••'.•!',
PolynesiaSingaporeSri LankaThailandViet Nam
China
Latin America & Carihbean
A r g e n t i n a , ,,,,,,,,
B o l i v i a '• '.••.'•.•/••.'•.••'.••.••V-;1'1.111
BrazilChileColombiaCosta RicaCubaDominican RepublicEcuadorEl SalvadorGuatemalaGuyanaHaitiHondurasJamaicaMexicoNicaraguaPanamaParaguayPeruPuerto RicoTrinidad and TobagoUruguayVenezuela
Less DevelopedMore Developed
SwedenJapanUnited States
Percent ofinfantsoflow
birth-weight1979-83
20
50
20
3014
18
11
10
25
27
20
7273810
Medianmonthsbreast-feeding1974-82
Percent of mothersbreastfeeding
1975-83
Percent of children malnourished
Percent of childrenunder age 5
underweight for age1975-83
3mos 6mos 12mos Mild-moderate Severe
21
1
31
-
9__22—
17—3
24_1913
2119
98
90
——98
100
949047
99_9868
8348
97
90
18_97
100
939034
99—9658
7447
89
90
_8393
849019
97_
9028
4820
63
50
_
3327—
_
50386240
—
34
6109Qy
1099
15
1318—_—1212
10—
9
89
—_
-
72
—
7
z—4
15—
67
41213
6_3
—9359
7838_66
_7793485762
628078
595150
9119
63
20
47
77846085284048
48
77
72
50
21
40
35 1456 -33 25
449
26575574357224162771304955
141330
49
10
43
46
40
52
7029
6648
42
10
3
Percent ofchildren age[2-23 monthsunderweight
for height1975-83
•B21— •,
48
•rt —• • • ; . ; ; • ' 3 7
• > • ; • 1 7
_
—
6
—
27521416
92218—
16
1110„
4
1_—
18_14_—
8_
1
I_
Indexof food
productionper capita
(1969-71-100)1982-84 average
10299
104124
11999 :!;
110120107113109129112
909195
104107
68125115123
128
10984
11510210487
12999onoy88
10191909989
1047899
10584
6010588
Dailyper-capita
calorie supplyas a percent
of requirement1983
MSI81—
117
12296
110
12711890
111
117937995
104
11510610593
111
11982
106105110114126105
HOey9095—8394
11112610198
12285
1299999
42
11291
105
116.,,,,;, • 113• •«• • • • 137-
91
Table 9: Education Indicators
AlgeriaCyprus
Ivan Islamic Rep. ofIraqIsraelJordanKuwait :LebanonLibyan Arab JamahiriyaMoroccoOmanSaudi ArabiaSyrian Arab Rep.TunisiaTurkeyUnited Arab KmiratesYemen, DemocraticYemen
Percent literateof population
age 15 and older
Percent ofchildren enrolledin primary school*
Males Femal Males Females
Percent ofPercent of 20-24-year-olds
children enrolled enrolled in post-in secondary school3 secondary school
Males Females Males Females
1980-84 1980-84 1980-84
AngolaBeninBotswanaBurkina FasoBurundiCameroon, U. Rep. ofCentral African Rep.ChadCongoEthiopiaGabonGambia, The ii.Ghana "'GuineaGuinea-BissauIvory CoastKenyaLesothoLiberiaMadagascarMalawiMaliMauritaniaMauritiusMozambiqueNamibiaNigerNigeriaReunionRwandaSenegalSierra LeoneSomaliaSouth AfricaSudanSwazilandTanzania, U. Rep. ofl o g o ';,'•'
UgandaZaireZambiaZimbabwe
504050936 4 '•••
65796034_1560446924319
596290978776868145
_766886
• _
5927
201718832942581310_22017357
„ 9'."'.'•.' 1
303987936363695022' - ^ /••'•'•'•
4341
.•• 62.':
253
805694999413110592:
V,V67• • . . • • • —
•:-•' 22'
• • • • • % ; -
8 8 '•'•:
90„
2014
1011131139510r96115
~ •
97948111312511694:'.97107
5227369759102992427—2394358—5
„
768899979894105_61725692102107953621
50 35
67476773798661_353842634047492616
45333783777963—24192840262861112
2051335391239168—_21.794
„
11273228192064_—114511_
92
Asia (without China)
AfghanistanBangladeshBhutanBurmaEast TimorFijiHong KongIndiaIndonesiaKampucheaKorea, Dem. Rep. ofKorea, Rep. ofLaos People's Dem. Rep.MalaysiaMelanesiaMicronesiaMongoliaNepalPapua New GuineaPakistanPhilippines . ',PolynesiaS i n g a p o r e . •.•,1'1 ••.•.• • ' • '
•Sri l.anka '•",'•ThailandViet Nam
China
Latin America & Caribbean
ArgentinaBoliviaBrazilChileColombiaCosta RicaCubaDominican RepublicEcuadorHI SalvadorGuatemalaGuyanaHaitiHondurasJamaicaMexicoNicaraguaPanamaParaguayPeruPuerto RicoTrinidad and TobagoUruguayVenezuela
Percent literateof population
age 15 and older
Percent ofPercent of Percent of 20-24-year-olds
children enrolled children enrolled enrolled in post-in primary school' in secondary school'1 secondary school
Table 10: Economic and Water and Sanitation Indicators
A f r i c a . . . , . . , . . , .
Angola .; ,Benin " oV'1,'; ' •
Bo t swana
Burkina FasoBurundiCameroon, U. Rep. ofCentral African Rep.ChadCongo ,,E t h i o p i a • ';,'•/•'.'•"•'•.
GabonGambia, TheGhanaGuineaGuinea-BissauIvory CoastKenyaL e s o t h o •.,.
Liberia
MadagascarMalawiM a l i ':•, '•••::'.
Mauritania ,'Mauritius ''••'Mozambique.NamibiaNigerNigeriaReunionRwandaSenegalSierra I eoneSomaliaSouth AlricaSudanSwazilandTanzania, U. Rep. ofTogoUgandaZaireZambiaZ,imbab\ve
S3" ..."""AlgeriaCyprusEgyptIran, lalamic Rep, ofIraqIsraelJordanKuwaitLebanonLibyan Arab JamahiriyaMoroccoOmanSaudi ArabiaSyrian Arab Rep.TunisiaTurkeyUnited Arab EmiratesYemen, Democratic?Yemen
ArgentinaBoliviaB r a z i l , 0 / / i :.\' • ••::•:ChileColombiaCosta RicaCubaDominican RepublicEcuadorEl SalvadorGuatemalaGuyanaHaitiHondurasJamaicaMexicoNicaraguaPanamaParaguayPeruPuerto RicoTrinidad and TobagoUruguayVenezuela
Less Developed .„ ...^More Developed iflHNHMSwedenJapanUnited States
World Total
3,5081,0841,0962,280
9231,032
_851
—801853666326650
1,4081,221
961 .1,066
8361,102
_
3,0392,914
408
.JBL7,9252,8259,636
—
2,510480
1,8701,8901,4101,070
—1,1601,420
6801,110
560290670
1,2702,180
8802,1101,3201,0403,8006,8302,4703,830
3065_3534_
45402021_5514——212119
49—-25—
599
12,44010,10014,080
36
3
—_
••nnniiHiH
3585—45———43653225—785580_193050_
39——
49• - m——
727886
10010099—8598_90
1005891—9191974673—
10095—
—
•HI
171253187999_32214226602555-40-261018—
963
65
» - * —( te ••.-•••*!!
-
IBB
9440
3310096
100_4164;
481004150—78-619257_
100—
—
•DM
329_43--
9263428JO2
to-2
—340
-96-2
.7—
-— ,
95
Notes to Appendix Tables
Tables 1-6
Tables 1 through 4 exclude countries with populations below 500,000 in 1980 in regional andworld totals; Less Developed and World totals in Tables 5 and 6 include all countries.
Table 2
a Values of 0.0 represent fewer than 50 deaths.
Table 4 |
a Values of 0.0 represent fewer than 50 deaths. If
Table 5
a This statistic is negative because the population is declining.
Table 7 \ ' ,a Delivered in an institution.b Measles immunization given at, or later than, 12 months and up to 60 months of age.c Figures for the United States represent the percent of children aged 5-6 entering first grade who
have been fully immunized for the specified diseases. The United States does not requireimmunization for tuberculosis with BCG.
d Less than 24 months of age. :e Two doses only.
Table 9
a Percent of children enrolled is a gross enrollment ratio and may exceed .100 if persons older oryounger than the conventional age group are attending.
b 1980-84 percent of children enrolled combines primary and secondary enrollments.
APPENDIX 2.METHODOLOGY OF PROJECTIONS
The projections presented in Appendix 1 are based on twoscenarios of infant and child mortality: the lirst assumesthere will be no changes i n mortality; the second assumesreductions in mortality adequate to achieve internationallystated goals by the year 2000. These projections have beenprepared to illustrate the differences in numbers of childrenwho will live and die if the impediments to child survivaldiscussed in this report either continue or are removed.The data show both the numbers of children who will sur-vive as a result of changes in mortality, and the reductionsin the percent dying that must be achieved for global goalsto be reached.
Mortality goals for the year 2000 are based on infant mor-tality goals suggested by the United Nations and AID: levelsol infant mortality below 10.0 (percent dying before age 1)would be reduced by half; levels of infant mortality from10.0 percent to 12.5 percent would be reduced to 5.0 per-cent; in accordance with AID, levels of infant mortalityabove 12.5 percent would be reduced to 7.5 percent.Because reductions in infant mortality are generally slowerbelow 1.0 percent and uncommon below .5 percent, infantmortality rates below 1.0 percent would be reduced to .5percent. Reductions in mortality are not. the same tor allcountries. Countries with high proportions of infants dying(e.g., Afghanistan and Sierra Leone) would drop to 40 per-cent ot their current level; countries with low proportionsof infants dying (e.g., Japan and Sweden) would drop to 70percent of their current level.
The data used in the projections are primarily from theUnited Nations. Numbers of births are the medium variantof the Population Division's World Population Pros-pects: Estimates and Projections as Assessed in 1984. Thesame numbers of births are used for both scenarios. The 5years of births are divided into 4 and 1 years of births (to
estimate numbers of infants and 1 -4 year olds) with an ad-justment for growth in the number ol births from 1980 to2000. Estimates of mortality levels are based on the percentof children dying before age 1 during the period 1980-85and before age 5 as of 1983, and are derived from theUnited Nation's Population Division and from UNICEF, TheState of the World's Children \986. For 12 countries (Gabon,Gambia, Namibia, Reunion, Swaziland, Cyprus, Hast Timor,Fiji, Melanesia, Micronesia, Polynesia, Puerto Rico) percentdying belore age 5 is estimated from the level of infant mor-tality and the Coale-Demeny model life tables. Hstimatesof the numbers of children alive at each quinquennial arebased on either a continuation of the "current"1980-85/1983 percents dying, or the "reduced" percentsdying, which are a linear decrease from the 1980-85/1983level to the 2000 goal. Separation factors are from theCoale-Demeny model life tables. Male and female separa-tion factors are adjusted to a one-sex population, assuminga sex ratio at birth of 105 males to 100 females. The region"west" is used for all areas except SubSaharan Africa, where"north" is used. All countries converge to a "west" patternof child mortality, with the level of 1 through 4 mortalitybased on the stated goal for infant mortality.
Child mortality rates are presented as 5q0; the percent ofchildren who will die before the age of 5. Though less com-mon, this statistic is easy to understand and compare withinfant mortality. As used in this report, 5q0 minus the in-fant mortality is the number of children, from 100 births,who will die between their first and fifth birthday. 5q0 wasalso chosen because it is used in the UN. Population Divi-sion and UNICEFs first internationally standardized set ofinfant mortality estimates and projections. Comparisonsof stated goals and expected levels is simplified by thepresentation ol statistics in the same format.
97
APPENDK3. **DEFtNlTIONS AND SOURCES OF DATA
BIRTHS: Number of births that will occur in a countryaccording to U.N. medium level growth projections.Sounx: United Nations, J986. World Population Prospects:Estimates and Projections as Assessed in 1984. New York:United Nations.
BREASTFEEDING, MEDIAN DURATION, IN MONTHS:Number of months after a birth after which half of mothersno longer breastfeed their children..Source: World Fertility Survey Data. Ferry, Benoit, and DP.Smith. 1983. Breastfeeding Differentials. WFS Comparative.Studies number 23. Voorburg, Netherlands. InternationalStatistical Institute.. Table 3, page 15.
BREASTFEEDING 3, 6, 12 MONTHS, PERCENT OFMOTHERS: Percent of mothers who are still breastfeedingtheir child 3,6, or 12 months afterbirth, exclusively or inaddition to other foods.Source: UNICEE The State of the World's Children 1986. NewYork: Oxford University Press. Table 2, pp. 134-35.
CALORIES, DAILY PER CAPITA SUPPLY AS APERCENT OF REQUIREMENTS: Daily per capita caloriesupply was calculated by dividing the calorie equivalent ofthe food supplies in a country by the population (suppliesinclude domestic production, imports less exports andchanges in stocks). Requirements are the number of calo-ries needed to sustain a person at normal levels of activityand health, taki ng into account age and sex distributions,average body weights, and environmental temperatures.Source: World Bank, 1986 World Development Report,Washington, D.C., Table 28, pp. 234-35.
CHILDREN AGE 1-4, NUMBER OF: Numbers of childrenage 1 liirough 4, on July 1 of a given year, based on births1 to 5 years ago, and each of 2 mortality scenarios. For adiscussion of the methodology see the Methodology of Pro-jections section.Source: Births and prevailing mortality rates are from UnitedNations, 1986. World Population Prospects: Estimates and Pro-jections as Assessed in 1984. New York: United Nations; andUNICEF. The State of the World's Children 1986. New York:Oxford University Press. Table 5, pp. 140-141.
CRUDE BIRTH RATE: Annual number of births per 1,000persons.Source: United Nations. 1986. World Population Prospects:Estimates and Projections as Assessed in 1984. New York:United Nations.
CRUDE DEATH RATE: Annual number of deaths per1,000 persons.Source: United Nations, 1986. World Population Prospects:Estimates and Projections as Assessed in 1984. New York:United Nations.
DOUBLING TIME: Number of years until 1985 popula-tion would double at the 1985 rate of growth.Source: United Nations, 1986. World Population Prospects:Estimates and Projections as Assessed in 1984. New York:United Nations.
DYING BEFORE AGE 1 AND 5, NUMBERS: Number ofinfants, and children age 1 through 4, who die during agiven year.Source: see Methodology of Projections section.
DYING BEFORE AGE 1 AND 5, PERCENT: Percent ofchildren who do not survive from birth to exact age 1, andfrom birth to exact age 5. Percent dying before age 1 are partof the percent who die before age 5, similar to a lqO and5q0..Source: United Nations, 1986. World Population Prospects:Estimates and Projections as Assessed in 1984. New York:United Nations, and UNICEF. The State of the World'sChildren 1986. New York: Oxford University Press. Table 5, pp.140-141; for projections ofpercents dying see the Methodologyof Projections section.
FOOD PRODUCTION PER CAPITA, TNDEX OF: Thisindex shows the average annual quantity of food producedper capita over a three year period from 1982 to 1984, ex-pressed as a percent of average food production from thebase period 1969-71.Source: Food and Agriculture Organization of the UnitedNations, maintained on the economic and social data baseof AID.
GROSS NATIONAL PRODUCT, PER CAPITA: Grossnational product at current market prices in U.S. dollarsdivided by die population. Dollars for 1960 have been con-verted to their value in 1983 dollars. One 1960 dollar isequal to 3.367 1983 dollars.Source: World Bank. 1986. World Bank Atlas. Washington,D.C.: World Bank, page 6; data for 1960 are from a previousWorld Bank Atlas, maintained in a computer data bank, theEconomic and Social Data Base of AID.
98
IMMUNIZED, PERCENT OF 1-YEAR-OLDS FULLY: Theestimated percent of children in 1984 who were fully im-munized against each disease or group of diseases by ex-act age 1. The requirements for full immunity depend onthe type of vaccine. The vaccination schedule recom-mended by the World Health Organization is as follows:
Tuberculosis: 1 injection of BCG (Bacterium Calmette-Guerin), which can be given at the time of birth.
Diphtheria, Pertussis, Tetanus: 3 injections with DPT vac-cine before age 1; the first is recommended 6 weeks afterbirth followed by 2 more at 1-month intervals (i.e.,10 weeksand 14 weeks).
Polio: At least 3 doses of oral polio vaccine before age 1,given 1 month apart. In areas where polio is endemic, thefirst dose is recommended at the time of birth, followed by3 more doses at the same time as the DPT injections.
Measles: 1 injection of measles vaccine, given after 9months in developing countries. Because measles vaccineis usually given later in developed countries, estimates ofimmunization coverage in these countries are based on thenumber of children under 5 who have been vaccinatedagainst measles.Source: World Health Organization/Expanded Program onImmunization (EP1). Official immunization coverage estimatesavailable as of January 20, J986,
IMMUNIZED, PERCENT OF PREGNANT WOMENFULLY IMMUNIZED FOR NEONATAL TETANUS: Theestimated percent of women giving birth in 1984 whoreceived 2 tetanus toxoid injections or 1 booster doseduring pregnancy.Source: World Health Organization/Expanded Program onImmunization (EPl). Official immunization coverage estimatesavailable as of January 20, 1986.
INFANTS, NUMBER OF: Numbers of children youngerthan age 1, on July 1 of a given year, based on births duringthe last year and each of 2 mortality scenarios. For a discus-sion ot the methodology see the Methodology of Projec-tions section.Source: Births and "current" 1980-85 mortality rates are fromUnited Nations. 1986. World Population Prospects: Estimatesand Projections as Assessed in 1984. New York: UnitedNations.
INFANT MORTALFTY GOALS: Goals for the year 2000are: reduce rates from 12.5 percent or higher to 75 percent;reduce rates from 10.0 to 12.4 percent to 5.0 percent; reducerates from 1.1 to 9.9 percent to half their current level;reduce rates of 1.0 percent and less to .5 percent.Source: statements by United Nations and AID; see theMethodology of Projections section.
LESS DEVELOPED: For statistical purposes, the lessdeveloped areas are defined as Africa, the Near East, Asia,Latin America, and the Caribbean.
LIFE EXPECTANCY: The number of years a person wouldlive if exposed to the mortality rates that each age group ex-periences in a given year.Source: United Nations, 1986. World Population Prospects:Estimates and Projections as Assessed in 1984. New York:United Nations.
LITERACY: Percent of persons aged 15 and older who canread and write. Definitions of ability can differ greatly fromcountry to country.Source: UNESCO. Statistical Yearbook 1985.
LOW BIRTH WEIGHT: 2,500 grams (5.5 pounds) or less.Source: UMCEF. The State of the. World's Children 1986. NewYork: Oxford University Press. Table 2, pp. 134-35.
MALNOURISHED, MILD/MODERATE AND SEVERE,PERCENT OF CHILDREN UNDER5: Mild/moderate isbetween 60 percent and 80 percent of desirable weight forage; severe is less than 60 percent of desirable weight forage..Source: UNlCEE. The State of the World's Children 1986. NewYork: Oxford University Press. Table 2, pp. 134-35.
MALNOURISHED, UNDERWEIGHT FOR HEIGHT:The percent oI children with less than 77 percent of themedian weight-for-height of the U.S. National Center forHealth Statistics reference population..Source: UNlCEE The Stale of the World's Children 1986. NewYork: Oxford University Press. Table 2, pp. 134-35.
MORE DEVELOPED: l;or statistical purposes, the moredeveloped areas are denned as Europe, the USSR, NorthAmerica, Japan, Australia, and New Zealand.
MORTALITY, 1980-85 LEVEL AND REDUCED LEVEL:Percent of children who would die before their first, or fifth,birthday if mortality rates prevailing in 1980-85 continue,or if there is a linear decline to mortality goals for 2000.Source: "Current" 1980-85 mortality rates are from UnitedNations, 1986. World Population Prospects: Estimates and Pro-jections as Assessed in 1984. New York: United Nations; andUNlCEE The State of the World's Children 1986. New York:Oxford University Press. Table 5, pp. 140-141; for projectedmortality rates, see the Methodology of Projections section.
MORTALITY RATE, INFANT: The number of deaths toinfants under 1 year ofage in any calendar year per 1,000live births. This report uses the more common percent rateand expresses rates per 100, rather than per 1,000.
PHYSICIAN, POPULATION PER: A country's totalpopulation in 1980 divided by the number of physiciansin that country.Source: World Bank. 1985, World Development Report.Washington, DC, table24, pp. 220-21.
POVERTY, ABSOLUTE LEVEL: That income level belowwhich a minimum nutritionally adequate diet plus essen-tial non-food requirements is not affordable.Source: IJNICEE The State of the World's Children 1986. NewYork: Oxford University Press, Table 6, page 142-43.
SANITATION FACILITIES: Sanitation facilities may in-clude the collection and disposal, with or without treat-ment, of human excreta and wastewaterby water-bornesystems or the use of pit latrines and similar installations(no definition provided in the source document; thisdefinition is from WHO. 1976. World Health StatisticsReport, vol. 29, no. 10. Geneva).Source: United Nations General Assembly, Economic andSocial Council, 1985. Report of the Secretary-General. Progressin the Attainment of the Goah of the International DrinkingWater Supply and Sanitation Decade.
SCHOOL ENROLLMENT, PRIMARY, SECONDARYAND POST-SECONDARY: The enrollment ratio is thetotal number of children enrolled in school, whether or notthey belong in the relevant age group for that level, express-ed as a percent of the total number of children in the rele-vant age group for the level. PerceriLs may exceed 100 if per-sons who are older than the conventional age are attending.The relevant age group is defined by individual countryeducational systems, except for post-secondary school,when 20-24 is always the age group used.Source: UNESCO. Statistical Yearbook 1985.
TOTAL FERTILITY RATE: The average number ofchildren that will be bom to a woman if she lives throughher reproductive years and bears the same number ofchildren as women at each age group bear in a given year.Source: United Nations, 1986. World Population Prospects:Estimates and Projections as Assessed in 1984. New York:United Nations.
TOTAL POPULATION: The total number of persons resi-dent in a given country on 1 July of a given year, irrespec-tive of nationality..Source: United Nations, 1986. World Population Prospects:Estimates and Projections as Assessed in 1984. New York:United Nations.
TRAINED ATTENDANT, PERCENT OF BIRTHSASSISTED BY: Trained attendants include physicians,nurses, midwives, trained primary health care and otherhealth workers, and trained traditional birth attendants.National coverage levels are drawn from official estimatesand sample surveys over a broad 10-year period. 1 f no directfigures were available,the percent of births in institutionshas been substituted as a conservative estimate for trainedattendant coverage.Source: World Health Organization/Division of Family Health.
URBAN: Varies according to national definitions; cautionis advised in country-to-country comparisons (e.g., Nigeriauses a size cutoff of 20,000 persons, Peru uses a size cutoffof 100 occupied dwellings, Chile looks for the. presence ofcertain public and administrative services, and many coun-tries merely name a few cities). Rural is defined as the restof the country.Source: Individual countries, United Nations, 1986. WorldPopulation Prospects: Estimates and Projections as Assessed in1984. New York: United Nations.
WATER, ACCESS TO SAFE/ADEQUATE DRINKING:"Safe" commonly includes treated surface waters or un-treated but uncontam mated water such as that from pro-tected boreholes, springs, and sanitary wells. "Reasonableaccess" in urban areas is defined as a public fountain orstand post located not. more than 200 meters from a house.In rural areas reasonable access is when members of thehousehold do not have to spend a disproportionate part ofthe day in fetching the family's water needs (no definitionprovided in the source documents; this definition is fromWHO. 1976. World Health Statistics Report, vol. 29, no. 10.Geneva).Source: United Nations General Assembly, Economic andSocial Council, 1985. Report, of the Secretary-General. Progressin the Attainment of the Goals of the International DrinkingWater Supply and Sanitation Decade. Where data were notavailable for 1983, the source is UN1CEE The State of theWorld's Children 1986. New York: Oxford University Press.Table :i, pp. 136-37.
WOMEN OF REPRODUCTIVE AGE, NUMBERS OF:The total number of women age 15 through 49 resident ina given country on 1 July of a given year, irrespective ofmarital status and fertility.Source: United Nations. 1986. World Population Prospects:Estimates and Projections as Assessed in 1984. New York:United Nations.
100
APPENDIX 4.COUNTRIES AND REGIONS
Data are presented for all developing countries with a 1980population of at least 500,000. Several small south Pacificnations have been grouped together. These groups are:Melanesia, which includes New Caledonia, SolomonIslands, and Vanuatu; Micronesia, which includes Guam,Kiribati, Nauru, Pacific Islands, Tuvalu, Johnston Island,Midway Islands, Pitcairn, Tokelau, and Wake Islands;Polynesia, which includes American Samoa, Cook Islands,French Polynesia, Nine, Samoa, Tonga, Wallis, and I'utunaIslands. Data for three developed nations, the United States,Sweden, and Japan, are presented for comparativepurposes.
Regions are based on AID country groupings. It shouldbe noted that AID, the United Nations and the WorldHealth Organization group countries into slightly differentregions.
Except as otherwise noted, regional statistics are weightedaverages of statistics ol countries for which data areavailable. Total population statistics (e.g., Gross NationalProduct) are weighted by the 1985 total population ofcountries; infant statistics (e.g., mortality and immuniza-tion) are weighted by the number of births or 1 -year olds.Because dates ol information vaiy, regional estimates maybe composed of statistics and weights of different dates.
101
Slides, Diskettes, and Multiple Copiesfor Lecturing, Teaching, and Further Analysis
Slide reproductions of the figures and maps in this report, copies of the 10 appen-dix tables on microcomputer diskette, and multiple copies of this report are avail-able upon request. The full set of 60 slides comes in transparent plastic slidesheets clipped inside a plastic three-ring binder. Data from the appendix tables areavailable on a single 5'A" diskette, stored in Lotus 1-2-3 (v.l) worksheet files or,optionally, in ASCII files.
To order, simply photocopy the following form, or send in a written requestspecifying the number of slide sets, diskettes, or copies desired. Requests shouldinclude checks for the full amount payable to IRD/Westinghouse.
Order FormSLIDESPlease send _ _ _ _ _ sets of slide reproductions of figures in the Child Survival Reportat $35.00 per set.
DISKETTESPlease send diskettes containing the ten tabular appendices from theChild Survival Report at $10.00 per diskette. Please send the files formatted as(check one):