Abstract The distillation towers of styrene monomer (SM) plants consume a considerable amount of expensive and toxic 2,4-dinitro-6-sec-butyl phenol (DNBP) as a polymerization retarder. The minimization of the operating cost, as well as preventing environmental pollution, is highly desirable to maximize the profit and have a clean technology. How- ever, it is not easy to predict the actual usage of DNBP in the tower because of the nonlinear behavior of the industrial distillation tower in the polymerization process, and also the inaccuracy of experimental results of the DNBP in outlet products. To overcome these difficulties, a prediction model for determining DNBP consumption using a hybrid mod- el in which the ANN in combination with Particle Swarm Optimization (PSO) is proposed in this study. Moreover, all useful parameters (9 parameters) in different years have been gathered from the industrial DCS system for training ANN. After combining PSO with ANN, the main valid parameters have been filtered. From nine proposed settings, five of them have been selected and used for predicting DNBP consumption in the SM plant. The obtained results showed that the proposed ANN-PSO hybrid model is a powerful tool for predicting DNBP usage with an average relative error of 9% between technical and calculated hybrid ANN-PSO model data. Key words: DNBP, Artificial Neural Network, Particle Swarm Optimization, ANN-PSO Hybrid Hybrid Artificial Neural Network-Particle Swarm Optimization for Prediction of DNBP Polymerization Retarder Usage in Industrial Styrene Monomer Plant Ali Gavampour 1 and Alireza Behroozsarand 2* 1. Chemical Engineering Department, Islamic Azad University, Ilkhchi Branch, Ilkhchi, Iran 2. Faculty of Chemical Engineering, Urmia University of Technology, Urmia, Iran *Corresponding author: Alireza Behroozsarand, Faculty of Chemical Engineering, Urmia University of Technology, Urmia, Iran E-mail addresses: [email protected]Received 2019-10-04, Received in revised form 2019-12-14, Accepted 2019-12-28, 2020-06-14 Journal of Petroleum Science and Technology 10 (2020) 7-19 DOI:10.22078/jpst.2019.3950.1626 Journal of Petroleum Science and Technology https://jpst.ripi.ir/ INTRODUCTION Styrene monomer is a main petrochemical product that is used as a starter and base material for a variety of polymer products, especially polystyrene. In addition, styrene is generally prepared by the ethylbenzene dehydrogenation method, but it is known that styrene is easily self-polymerization in the processing of production, particularly in the distillation processing. For preventing and controlling polymerization, there are two categories of compounds that are commonly used. The first category is a sudden reaction compound, widely known as an inhibitor. Nowadays, the most usual applied retarders in the petrochemical industries are nitrophenol-based products, and in particular, DNBP. Tert butyl catechol (TBC) is an excellent inhibitor for styrene monomers while it is stored but only useful in the presence of oxygen. It is ineffective under the conditions of manufacture and treatment of styrene and has several specific inhibitors for use in these circumstances. Furthermore, one of the most common compounds is compound 1 and known as DNBP. Despite its widespread use, the mechanism of DNBP action is unknown [1]. The second category is much faster reacting and is sometimes referred to as a real inhibitor. Also, the actual market inhibitors are proprietary formulations that provide polymer inhibition rates faster than DNBP. Styrene construction usually uses DNBP as a preservative to protect against styrene polymer formation. DNBP, also known as a dinosaur, is highly toxic. The documented risk posed by DNBP to people and the environment has led regulators to incentivize action to limit its use [2]. ANN has been successfully implemented to solve engineering and scientific problems in the areas of adaptive control, pattern recognition, device vision, image processing, process detection, process monitoring, and nonlinear system identification [3]. ANN has been applied in many fields for predicting the output. Traditional approaches to solving chemical engineering
Transcript
AbstractThe distillation towers of styrene monomer (SM) plants consume a considerable amount of expensive and toxic 2,4-dinitro-6-sec-butyl phenol (DNBP) as a polymerization retarder. The minimization of the operating cost, as well as preventing environmental pollution, is highly desirable to maximize the profit and have a clean technology. How-ever, it is not easy to predict the actual usage of DNBP in the tower because of the nonlinear behavior of the industrial distillation tower in the polymerization process, and also the inaccuracy of experimental results of the DNBP in outlet products. To overcome these difficulties, a prediction model for determining DNBP consumption using a hybrid mod-el in which the ANN in combination with Particle Swarm Optimization (PSO) is proposed in this study. Moreover, all useful parameters (9 parameters) in different years have been gathered from the industrial DCS system for training ANN. After combining PSO with ANN, the main valid parameters have been filtered. From nine proposed settings, five of them have been selected and used for predicting DNBP consumption in the SM plant. The obtained results showed that the proposed ANN-PSO hybrid model is a powerful tool for predicting DNBP usage with an average relative error of 9% between technical and calculated hybrid ANN-PSO model data.
Hybrid Artificial Neural Network-Particle Swarm Optimization for Prediction of DNBP Polymerization Retarder Usage in Industrial Styrene Monomer Plant
Ali Gavampour1 and Alireza Behroozsarand 2*
1. Chemical Engineering Department, Islamic Azad University, Ilkhchi Branch, Ilkhchi, Iran 2. Faculty of Chemical Engineering, Urmia University of Technology, Urmia, Iran
*Corresponding author: Alireza Behroozsarand, Faculty of Chemical Engineering, Urmia University of Technology, Urmia, IranE-mail addresses: [email protected] 2019-10-04, Received in revised form 2019-12-14, Accepted 2019-12-28, 2020-06-14
Journal of Petroleum Science and Technology 10 (2020) 7-19DOI:10.22078/jpst.2019.3950.1626
Journal of Petroleum Science and Technology
https://jpst.ripi.ir/
INTRODUCTIONStyrene monomer is a main petrochemical product that is used as a starter and base material for a variety of polymer products, especially polystyrene. In addition, styrene is generally prepared by the ethylbenzene dehydrogenation method, but it is known that styrene is easily self-polymerization in the processing of production, particularly in the distillation processing. For preventing and controlling polymerization, there are two categories of compounds that are commonly used. The first category is a sudden reaction compound, widely known as an inhibitor. Nowadays, the most usual applied retarders in the petrochemical industries are nitrophenol-based products, and in particular, DNBP. Tert butyl catechol (TBC) is an excellent inhibitor for styrene monomers while it is stored but only useful in the presence of oxygen. It is ineffective under the conditions of manufacture and treatment of styrene and has several specific inhibitors for use in these circumstances.
Furthermore, one of the most common compounds is compound 1 and known as DNBP. Despite its widespread use, the mechanism of DNBP action is unknown [1]. The second category is much faster reacting and is sometimes referred to as a real inhibitor. Also, the actual market inhibitors are proprietary formulations that provide polymer inhibition rates faster than DNBP. Styrene construction usually uses DNBP as a preservative to protect against styrene polymer formation. DNBP, also known as a dinosaur, is highly toxic. The documented risk posed by DNBP to people and the environment has led regulators to incentivize action to limit its use [2].ANN has been successfully implemented to solve engineering and scientific problems in the areas of adaptive control, pattern recognition, device vision, image processing, process detection, process monitoring, and nonlinear system identification [3]. ANN has been applied in many fields for predicting the output. Traditional approaches to solving chemical engineering
A. Gavampour et al. Journal of Petroleum Science and Technology 10 (2020) 7-198
problems often have their constraints, such as in the modeling of extraordinarily complex and nonlinear systems. Also, ANN can solve complex problems in several practical
uses. There are several applications of ANN in chemical engineering science [4]. The topics and a brief description of them in relevant literature are introduced in Table 1.
Table 1 A summary of the neural network application in chemical engineering science.
No. Studied topics Description year Ref.
1Adaptive neural network control for continuous stirred tank
reactor process
An adaptive neural network control algorithm for a class of two continuous stirred tank reac-
tors with unknown functions was proposed.2013 [5]
2Artificial neural network prediction of chemical oxygen
demand in the dairy industry effluent treated by electroco-agulation
An artificial neural network was constructed to model chemical oxygen demand after electro-
coagulation.2014 [6]
3Automatic startup of nuclear reactors using differential
neural networksThe nuclear plant considered as a black box is
identified by a differential neural network.2007 [7]
4Design and optimization of Artificial Neural Networks
for the modeling of superconducting magnets operation in tokamak fusion reactors
Artificial neural networks (ANNs) for the eval-uation of the heat load to the cryoplant were
proposed.2016 [8]
5Dynamic modeling of batch polymerization reactors via the
hybrid neural-network rate-function approach
The simulated verification and validation of the hybrid neural-network rate-function (HNNRF) approach for modeling batch reactor systems
were provided.
2007 [9]
6Elaboration of a neural network system for semi-batch
reactor temperature control: an experimental study
A neural controller to regulate the tempera-ture in a semi-batch pilot-plant reactor was
developed.1996 [10]
7Experimental investigation and artificial neural networks
(ANNs) modeling of electrically-enhanced membrane bioreactor for wastewater treatment
A new configuration of an electrically-en-hanced membrane bioreactor was introduced to
treat medium-strength wastewater.2016 [11]
8Hybrid first-principle–neural-network approach to model
the liquid-liquid reacting system
A detailed investigation was carried out to check the ability of multilayer neural networks to model the simultaneous mass transfer and
chemical reaction in the liquid-liquid reacting system.
1999 [12]
9Multi-stage modeling of a semi-batch polymerization reac-
tor using artificial neural networks
Three different approaches for modeling a semi-batch polymerization reactor using artifi-
cial neural networks (ANN) were studied.1999 [13]
10Neural network based nonlinear model predictive control
for an intensified continuous reactor
The intensified continuous reactor was de-signed to replace a conventional batch reactor for three-phase catalytic slurry hydrogenation.
2015 [14]
11On-line fault detection of a fuel rod temperature measure-
ment sensor in a nuclear reactor core using ANNs
A detailed method for fault detection of an in-core three-wire resistance temperature detector
(RTD) sensor was introduced.2015 [15]
12Performance improvement of artificial neural networks
designed for safety key parameters’ prediction in nuclear research reactors
A new methodology of a suitable artificial neural network architecture improving its
performances’ capabilities in predicting two significant parameters in safety assessment was
found.
2009 [16]
13State estimation by artificial neural networks in a continu-
ous bioreactor
A neural network state observer to estimate biomass, substrate, and methane in a continu-
ous anaerobic reactor was proposed.2013 [17]
14Water-gas shift reaction in membrane reactors: Theoretical investigation by artificial neural network model and exper-
imental validation
A theoretical approach via artificial neural networks model for studying the water gas
shift reaction in hydrogen-selective membrane reactors was presented.
2015 [18]
A. Gavampour et al. Journal of Petroleum Science and Technology 10 (2020) 7-199
As shown in Table 1, ANN has been applied in different areas of chemical engineering science, such as process control (Nos.1, 6, and 10), chemical and biochemical reactors (Nos. 3, 4, 5, 7, 9, 11, 13, and 14), heat transfer (Nos. 4, 6, and 11), Membrane process (Nos.7 and 14), chemical reactions (No. 14), and parameter prediction (Nos. 2 and 12).In this study, the prediction of DNBP consumption in a styrene monomer production plant was considered. For this purpose, a hybrid ANN-PSO method for the identification of useful parameters from goal parameters was proposed. Then, the modified ANN as a black-box model was used for modelling the separation section of a styrene monomer plant and model predictions compared with technical data.
Materials And Methods
Styrene Monomer Production Process
Styrene is generally produced on a large scale by the catalytic dehydrogenation of ethylbenzene (EB). Usually, optimized design and operation of the styrene reactor are needed as this equipment is essential in the styrene production process [19]. Moreover, the EB dehydrogenation is an equilibrium, exothermic, and reversible reaction. This reaction acts in low-performance but is catalytically high-performance in the presence of iron oxide and hot steam. In addition, it is strongly related to temperature and pressure, and conditions with high temperature and low pressure are favored [20]. The schematic and industrial block flow diagrams (BFD) of ethylbenzene (EB) and SM plant are shown in Figure 1 a and b, respectively.According to this figure, ethylene and benzene as main feeds of the EB unit enter into the alkylation reactor for EB
Fig 1 (a)The schematic and (b) an industrial (Monsanto/Lummus Crest styrene process [22]) block flow diagrams of EB and SM units.
This process occurs at 220 to 255 degrees Celsius and 3.4 MPa. In addition, this reaction is exothermic that results in low-temperature growth from a catalyst bed to one after another [20]. That is why alkyd reactors are typically equipped with moderate coolers to stay in full temperature. Then ethylbenzene is used to produce low-grade polyethylene benzene (PEB), as shown by Eqs. (2 and 3):C6 H6+2C2 H4↔C6 H4-(C2 H5)2 (2)benzene+2ethylene↔diethylbezene(DEB)C6 H6+3C2 H4↔C6 H6-(C2 H5)3 (3)benzene+3ethylene↔triethylbezene(TEB)These primary side reactions are exothermic and generate significant amounts of heat. PEB is separated from EB and then converted to EB in the transalkyation reactor at 190-220 ºC and 3- 3.5 MPa [20]. After alkylation reactions, dehydration of EB is carried out to produce styrene as a final product. A list of chemical reactions in the dehydration process is shown in Table 2.
production. Furthermore, benzene alkylation with ethylene is the main route for the industrial production of EB on a large scale (Equation 1). The plant operates continuously and uses two different reactors for alkylation and remobilization. In the alkylation reactor, ethylene, in its liquid phase, goes through almost a complete reaction accompanied by the excess of benzene, which is essential to form EB [Eq. (1)]:
Table 2 List of dehydration process reactions [21].Number Reaction Chemical Equation No.
1 C6 H5 CH2 CH3→C6 H5 CHCH2+H2 (4)
2 C6 H5 CH2 CH3→C6 H6+C2 H4 (5)
3 C6 H5 CH2 CH3+H2→C6 H5 CH3+CH4 (6)
4 2H2 O+C2 H4→2CO+4H2 (7)
5 H2 O+CH4→CO+3H2 (8)
6 H2 O+CO→CO2+H2 (9)
A. Gavampour et al. Journal of Petroleum Science and Technology 10 (2020) 7-1910
Crude styrene is a combination of many components such as unreacted EB, benzene, toluene, tar, and styrene monomer as the main products. Therefore, distillation in industrial styrene plants was used to obtain pure styrene as a product. The schematic diagram of an industrial styrene plant is shown in Figure 1-b. As can be seen in this figure, styrene monomers, recycled EB, benzene, toluene, gasoline, and tar are the styrene separation part of the plant. The hot gas effluent from the hydrogenation solution primarily comprises styrene, hydrogen, reactive ethylbenzene, divinylbenzene, water , lower benzene content, toluene, methane, ethane, carbon monoxide, carbon dioxide, and various polymer components. Moreover, the effluent gas from the dehydrogenation reactor may be tendentiously entered into a condenser wherein styrene, unreacted EB, divinylbenzene, various polymeric materials, and the aqueous compounds are condensed with hydrogen, methane, ethane, carbon monoxide, carbon dioxide, benzene, and toluene remaining in the gas phase.As mentioned in Figure 1-b (Slow-reacting compound) and Figure 2 (Fast reacting compound ), two methodologies of polymer content control in styrene monomer plants are as follows: 1- Slow-reacting compound, typically known as a retarder, for example, DNBP.DNBP is a reliable and economical means of protecting the tower during an emergency shutdown. But DNBP is very toxic. Because DNBP solubility in water is a potential hazard to the environment. However, DNBP is initially sold as herbicide, its use in agriculture has long been banned in the United States and many other countries. While the risk of exposure to DNBP in an industrial environment is less than the rural environment, DNBP is not safe at all because the LD50 is very low. Industrial accidents occur, and operators and the situation in the proximity of the plant are always at danger until DNBP is used. In recent years, the potential risks of using DNBP in styrene have been highlighted in many
countries. In addition, DNBP is also a significant generator of NOx during burning. In a typical styrene plant, DNBP is removed from the machine with heavy dough, and usually, water flows as fuel. When the amount of fuel is recovered, the combustion of the fungus containing DNBP produces a significant amount of NOx. Up to a quarter of DNBP (by weight) is converted to NOx when burned. Also, NOx is an environmental pollutant, and in many countries, there are NOx emission limitations in place. Therefore, with the environmental problems mentioned above, the minimum and proper use of DNBP can be one of the most critical challenges in the styrene units.2- Fast reacting compound, typically known as an inhibitor, for example, Prism NALCO inhibitor.To develop a new class of retarder, there are two main criteria. First, it must be less toxic than DNBP and generate less NOx when burned. Second, it should have similar polymer control properties (reaction rate) as DNBP. To date, the only product introduced to the market with these features is Prism NALCO inhibitor.In Figure 2, a schematic flow diagram of the styrene purification section for the SM unit is shown. Raw styrene from the reaction section enters the light tower of the purification section first. Furthermore, this tower is designed to remove ethylbenzene as well as water on the overhead, leaving styrene and other heavy components in the bottom. The lights tower feeds the product tower where styrene is distilled overhead, leaving heavier compounds to exit from the tower bottom. Before the DNBP retarder, the polymer control program involved the use of DNBP retarder. In addition, DNBP was injected into the reflux line of the lights tower. The objective of this study was the prediction of DNBP retarder value to reflux stream in styrene plant using a hybrid ANN-PSO algorithm, while adequate polymer control is being maintained both during regular operation and in case of an emergency shutdown.
Fig. 2 DNBP retarder injection position in the studied styrene plant.
A. Gavampour et al. Journal of Petroleum Science and Technology 10 (2020) 7-1911
Applied Hybrid Algorithm
ANN Algorithm
ANN now plays an essential role in modelling, controlling, and optimizing polymerization processes. Moreover, ANNs are one of the most accurate and widely used in forecasting models. It has been shown that a network can approximate each continuous function to any desired accuracy. Furthermore, ANNs are nonlinear and non-parametric methods, unlike traditional plans. However, they may be incomplete because the primary mechanism is nonlinear. Real-world systems are often nonlinear. In addition, ANNs are known as stable competition for different polymerization models.The use of local neural networks for applications where the mechanistic description of the interdependence of dependent and unknown variables is unknown or very complex has become increasingly common. Also, they (i.e. local neural networks) are now the most popular artificial learning tool with applications in areas such as pattern recognition, classification, process control, and optimization [22-29]In the past decade, many articles have been reviewed by a colleague who has published good results on the application of ANNs in the literature. However, several studies with the ANN were not performed because of weak predictions from the ANN. These failures have led to criticism of the ANN's ability to cope with a variety of different processes. To some extent, this criticism is founded because although the ANNs have been known for some time, they are still in the early stages of developing their basic theory, and many improvements have been made to their structure. Still, many trials of their applications failed because the researchers don't try to use more than one layer hidden in the ANN topology or don’t provide ANN with enough data to train.Most articles on the use of local ANNs employed multilevel, forward-facing, and fully interconnected understanding networks. The reasons for using this type of ANN are its simplicity, ease of programming, and excellent results. Because this ANN is a universal function, it means that if the network topology is allowed to change freely, it can form each broken curve that shows the type of ANN.
PSO Algorithm
PSO is one of the most critical methods of swarm intelligence. Use the velocity vector information alongside the best local and global quality to update the current value of the different parameters of each particle problem in the swarm. It thus calculates the value of the optimization function for each particle of congestion at the corresponding locations. Accordingly, the velocity vector associated with each particle is updated based on the historical background of each particle’s problem parameters and inappropriate performance value. This history stores the knowledge gained by each particle as well as the congestion as a whole and conceptually displays an autobiographical memory. In this manner, the misfit-function estimation of every particle in the swarm is updated by utilizing the social behavior of the swarm that adjusts to its surroundings by returning to the promising location of solution space by searching for desirable overtime performance values. It can be used to solve a wide range of optimization problems, such as unrestricted optimization problems,
limited optimization problems, nonlinear programming as in polymerization process, multi-objective optimization, randomized scheduling, and combined optimization problems. Moreover, PSO is presented in literature and is successful in common applications. In Figure 3, the flow diagram of the PSO algorithm is shown.
Hybrid ANN-PSO Algorithm
The prediction of chemical consumption in the polymerization process plays a vital role in the planning of production and petrochemical plants. The precision of the operating system, which uses the accuracy of the prediction method, determines the economic and environmental aspects of the polymerization processes. Moreover, conventional methods, including time series, regression analysis, or ARMA (Autoregressive Moving Average) model, bring external inputs along with some assumptions. The use of ANNs is an economical technique. But their training, usually with a backward algorithm or other slope algorithms, is shown with some defects such as very slow convergence and easy recording at the local minimum. In this study, a combination of an ANN with a particle swarm optimization training algorithm for the development of prediction accuracy is presented. Ultimately, according to the experimental results, it is obvious that the proposed approach can achieve better predictive performance.
Mathematical Modeling
Problem Formulation
According to Figure 1, the black box of the model in this study is the separation section of an industrial styrene plant. In addition, the separation section consists of two distillation towers entitled light tower and styrene tower. In this study, all nine valid parameters (decision variables) that have been considered for modelling are related to styrene tower. These nine parameters include:•The mass feed flow rate to styrene tower,•The temperature of input feed to styrene tower,•The mass flow rate of the reflux stream to styrene tower,•The flow rate of condensate from reboiler of styrene tower,•Output temperature of the heat exchanger of styrene tower,•The temperature of the bottom stream of styrene tower,•The top pressure of styrene tower,•The flow rate of the bottom stream of the styrene tower, and•Polymer content of the bottom stream of styrene tower.All values of these parameters have been gathered from the DCS office of considered industrial styrene plant. The number of these set data is equal to 1594. The final member of these data set is the DNBP consumption value as a target value or objective function. In Table 3, an example of the data used in the modeling of the different sections is shown. In addition, the modeling work of the system was done in three steps: 1) Data analysis,2) Modeling of the system by using all data sets with ANN tool, 3) Filtration, identification, and classification of all data sets in two categories of effective and ineffective parameters by using the PSO algorithm, and4)Modeling the system by using new data sets with ANN tool.
A. Gavampour et al. Journal of Petroleum Science and Technology 10 (2020) 7-1912
Fig. 3 Mathematical flowchart of the PSO algorithm.
One of the main failures and breaks of ANNs in forecasting problems is the inappropriate distribution of data and their low accuracy. Therefore, the first step in this study was to examine the quality of the data and how they were distributed. All these analyses were performed by a statistical model of Excel software. In Table 4, all important statistical indexes of all parameters have been tabulated. Based on the results presented in Table 4, none of the variables have a normal distribution and do not show the same dispersion parameters concerning standard deviation and variance. But it is worth mentioning that it is vital that each of these variables was individually examined and the relationship between them not established and investigated.The Pearson correlation coefficient was used to analyze each of the independent variables with the dependent variable of DNBP consumption. This coefficient was used to determine the relationship between the type and direction
of the relationship between the two distance or dependent variables, or a distance variable and a relative variable. Several computational equations can be defined to compute this coefficient. The relationship used in this section to calculate the correlation coefficient (R) using Excel software is:
2 2 2 2
( ) ( )( )[ ( ) ( ) ][ ( ) ( ) ]
n xy x yRn x x n y y
−=
− −∑ ∑ ∑
∑ ∑ ∑ ∑
(10)
Eq. (10) is a calculation method using raw numbers and x and y are random variables.The Pearson correlation coefficient changes between -1 and 1. If the correlation coefficient is equal to one, it indicates a direct correlation between the two variables; in addition, a direct or positive relationship means that if one of the variables increases (or decreases), the other also increases (or decreases). The correlation coefficient of the negative one also shows the existence of a complete inverse relationship between the two variables.
A. Gavampour et al. Journal of Petroleum Science and Technology 10 (2020) 7-1913
The inverse or negative relationship shows that if one variable increases, another variable decreases and vice versa. A correlation coefficient equal to zero indicates that there is no linear relationship between the two variables. Therefore, based on the variable pairs, one is always a dependent variable, and the other is an independent variable. Also, the results are presented in Table 5.Based on the results of statistical analysis in Excel software, it has been found out that almost all selected parameters as independent variables have a direct or reverse relationship with dependent variables. However, it should be noted that some of these variables are correlated with a high correlation coefficient, such as 0.65 in the condensate flow rate, and the others are correlated with a low correlation coefficient of 0.047, which is related to the polymer content of the bottom
with a dependent variable. But the point of subscription of all variables is direct dependence and a robust linear image with the use of DNBP, and it confirms the necessity of using nonlinear methods such as NNs, which is the purpose of this research. The leading cause of the strong linear non-dependence between independent variables depends on many factors such as the non-linearity of the styrene unit process, the diversity of data, the lack of uniformity of data dispersion, different measurement methods, the lack of on-line data storage, measurement error, and the unmatched variables; moreover, there are several other factors. Hence, all computations will be based on the use of the NN toolkit in MATLAB software to provide more genuine relationships to predict the behavior between independent and dependent variables.
5 Output temperature of H.E. (°C) DNBP consumption 0.474
6 Bottom Temperature (°C) DNBP consumption 0.623
7 Top pressure (mm Hg) DNBP consumption 0.306
8 Bottom flow rate (m3/h) DNBP consumption -0.327
9 Polymer content of bottom (kg) DNBP consumption -0.0407
A. Gavampour et al. Journal of Petroleum Science and Technology 10 (2020) 7-1914
Elementary ANN Model
In recent years, the concept of NNs has gained wide popularity in many fields of chemical engineering, such as dynamic modeling of chemical processes, design of catalysts, modelling of chemical reactors, and modeling of the complex chemical process [30]. In this research, to simulate the distillation tower of the styrene monomer plant and predict the DNBP retarder consumption, the arrays of appropriate nine-layer neural networks were designed with a different number of hidden layer neurons and network training algorithms. The network includes nine input layers that provide input data to the network, ten hidden layers and an output layer that represents network response (Figure 4). The functional requirements of ANN governed the number of input and output nodes. A sigmoid transfer function was used for the hidden layer, and output transfer function was a linear function. The system was trained by using a backpropagation neural network (BPNN), and the Levenberg-Marquart method was used as a training algorithm in all modeling cases.Training designed ANN was performed using DCS results of industrial styrene plant in changes of independent vari-ables. Since the applied transfer function of hidden layers is sigmoid, all input vectors in the interval [0, 1] were scaled.
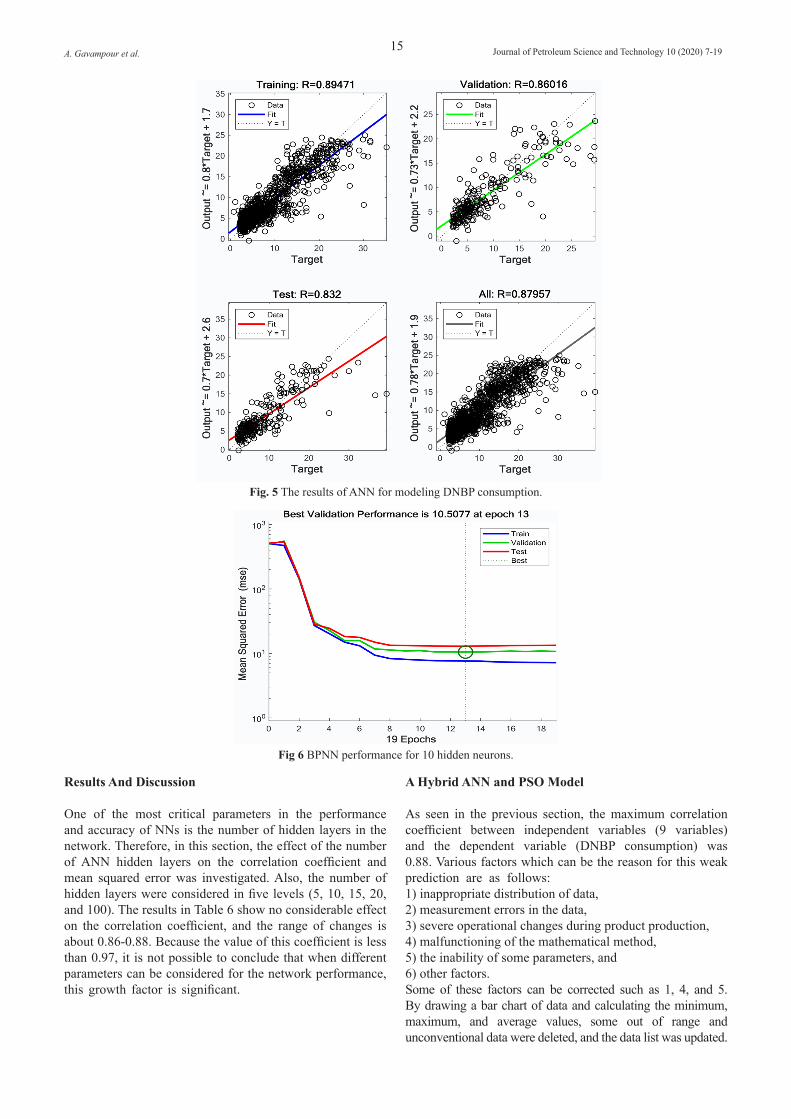
Furthermore, the data were split into three subsets: training, validation, and test set. Splitting samples play an important role in the evaluation of an ANN performance. The training set is used to estimate the model parameters, and the test set is used to check the generalization ability of the model. In this study, 1594 data were gathered from the DCS system. The training, validation, and test sets include 1116 data (75% of complete data), 239 data (15% of total data), and 239 data (15% of total data), respectively.The results of the regression between network outputs and validation and training data sets and test objectives are pre-sented in Figure 5. It can be observed that the output tracks the targets well. The correlation coefficient (R) measures the correlation between outputs and objectives. R-value of 1 means a close link and 0 a random relationship. As shown in Figure 5, the correlation coefficient between all indepen-dent variables and the dependent variable is about 0.87. Re-garding the results obtained in the previous sections, there is a better correlation between the variables compared to the separation mode. The reason for this relationship can be the relation between independent variables (according to Table 5) to predict the behaviour of the dependent variable (DNBP consumption). The performance curves of the ten hidden neurons are shown in Figure 6.
Fig 4 Final proposed neural network scheme.
Table 6 The effect of hidden layer numbers on ANN performance.
Number of hidden layers 5 10 15 20 100Training No. Sample 1116 1116 1116 1116 1116
Validation R 0.87 0.89 0.86 0.84 0.81Testing R 0.86 0.86 0.86 0.71 0.66
All R 0.88 0.86 0.87 0.88 0.87
A. Gavampour et al. Journal of Petroleum Science and Technology 10 (2020) 7-1915
Fig. 5 The results of ANN for modeling DNBP consumption.
Fig 6 BPNN performance for 10 hidden neurons.
Results And Discussion
One of the most critical parameters in the performance and accuracy of NNs is the number of hidden layers in the network. Therefore, in this section, the effect of the number of ANN hidden layers on the correlation coefficient and mean squared error was investigated. Also, the number of hidden layers were considered in five levels (5, 10, 15, 20, and 100). The results in Table 6 show no considerable effect on the correlation coefficient, and the range of changes is about 0.86-0.88. Because the value of this coefficient is less than 0.97, it is not possible to conclude that when different parameters can be considered for the network performance, this growth factor is significant.
A Hybrid ANN and PSO Model
As seen in the previous section, the maximum correlation coefficient between independent variables (9 variables) and the dependent variable (DNBP consumption) was 0.88. Various factors which can be the reason for this weak prediction are as follows:1) inappropriate distribution of data,2) measurement errors in the data,3) severe operational changes during product production,4) malfunctioning of the mathematical method,5) the inability of some parameters, and6) other factors.Some of these factors can be corrected such as 1, 4, and 5. By drawing a bar chart of data and calculating the minimum, maximum, and average values, some out of range and unconventional data were deleted, and the data list was updated.
A. Gavampour et al. Journal of Petroleum Science and Technology 10 (2020) 7-1916
After that, for identification of the main useful variables, a hybrid model of PSO and ANN was applied. The model was proposed to generate an index matrix, based on a feed-forward ANN optimized by PSO. Moreover, this optimization algorithm was employed for the identification of effective variables on the training performance of ANN. In this matrix, the number 1 means the effect, and zero means that the variable does not affect the target function. In Table 7, all information about hybrid has been tabulated.
In the first iteration of hybrid of PSO-ANN, index and g best matrix have the same values in all elements equal 2 and 1, respectively. After five iterations and calculations of the correlation coefficient at each step, final results were calculated. All output results of hybrid PSO-ANN are presented in Table 8.As shown in Table 8, after five iterations, the correlation co-efficient gained 0.998 value, and this value is desirable. But as previously mentioned, the goal of this algorithm is to iden-tify variables that are effective on DNBP consumption. Also, index matrix showed that from all nine variables, only five of them had a considerable effect on DNBP consumption. All indexes and variable topics that were effective in DNBP consumption and mentioned in Table 8 are given in Table 9. In the next step of modeling, these five data sets have been considered for training, validation, and testing the modified Neural Network model.
Modified ANN Model
After filtration of all data by using a hybrid PSO-ANN al-gorithm and removal of four data sets, the modified ANN scheme has been demonstrated in Figure 7. In modified ANN, in addition to the change in data, there is another fundamen-tal change in the choice of the type of NN. As mentioned pre-viously, a generalized regression NN method was used, while in the new state, the radial basis network was used.
Table 9 All indexes’ matrix and variable topics that are effective on DNBP consumption.
index 1 0 1 0 1 0 0 1 1
Variabletopic
Feed flowrate
Feed Temperature Reflux flowrate
Condensateflow rate
Output temperature
.of H.E
Bottom Tem-perature Top pressure
Bottom flowrate
Polymer content of
bottom
Fig 7 Final proposed modified neural network scheme.
A. Gavampour et al. Journal of Petroleum Science and Technology 10 (2020) 7-1917
Description of the function in MATLAB is as follows:net = newrb (P, T, goal, spread, MN, DF) takes two of these arguments,P: R-by-Q matrix of Q input vectorsT: S-by-Q matrix of Q target class vectorsGoal: Mean squared error goal (default = 0.0)Spread: Spread of radial basis functions (default = 1.0)MN: Maximum number of neurons (default is Q)DF: Number of neurons to add between displays (default = 25)In this study, the newrb function is used with the default setting. After 550 iterations, the mean squared error (MSE) goal reached to zero value. All of the data used in this model are similar to the previous ones, and the data classifications for training and testing were similar. In Figure 8, the performance of a radial basis network model in the training step is shown. As noted above, because of the default settings
of the function used, MSE as the main performance feature was zero after 550 iterations, and this result shows that the training is very appropriate with the modified data. Similar to the previous states in the study of neural networks, the best indicator in the investigation of the strength and accuracy of the method is to examine the outputs for testing data. According to the obtained results, it was found out that data prediction of new ANN was nearer to actual industrial data. All results of them have been tabulated in Table 10. According to this table, maximum, minimum, and average relative error (R.E.) is 21% (for 21st dataset), 0% (for 192nd
dataset), and 9%. That is value acceptable for an industrial styrene monomer plant as part of a nonlinear polymerization process. It is noted that, according to the calculated index matrix by hybrid PSO-ANN, sufficient value was used for modeling and represented in Table 10.
Fig 8 Performance diagram of the radial basis network.
Table 9 Final information and results of modified ANN.
Minimum of absolute error 0%Maximum of absolute error 21%Average of absolute error 9%
Sample data of testing step of ANN from 239th dataset.
A. Gavampour et al. Journal of Petroleum Science and Technology 10 (2020) 7-1918
Conclusions
In this study, three scenarios were considered as follows:a) Modeling all data by using a general neural network model,b) Modeling all data by hybrid PSO-ANN model, andc) Modeling selected data by radial basis network.In the first model, all industrial data were used for modelling the distillation tower of the styrene monomer plant. The goal of the modelling was to predict DNBP retarder consumption in this tower. Nine parameters noticed as active variables on DNBP retarder consumption. These parameters included: feed flow rate, feed temperature, reflux flow rate, condensate flow rate, output temperature of heat exchanger (H.E.), bottom temperature, top pressure, bottom flow rate, and polymer content of bottom.Results showed the correlation coefficient between all independent variables, and the dependent variable was about 0.87. This value was an inadequate amount (<0.99) but indicated the direct relationship between the independent variables and the dependent variable. Various factors can be the reason for this weak prediction. In addition, one of the main causes of such behavior is the inability of some parameters to be recognized. The best solution to this problem was to examine the impact of the variables on the objective parameters to remove the ineffective variables from the data set. For this study, a hybrid PSO-ANN methodology was applied. By using this algorithm, valid parameters were identified. Among the nine variables, only five of these features such as feed flow rate, reflux flow rate, output temperature of H.E., bottom flow rate, and polymer content of bottom were included. For reporting a logical relation between competent and independent variables (five variables) with the goal and dependent variable, modified ANN (newrb function used with default setting) was used. The testing step output of ANN showed that maximum, minimum, and average relative error (R.E.) between actual and calculated data was 21% (21st dataset), 0% (192nd dataset), and 9%, respectively. In addition, the obtained relative error was acceptable value for an industrial styrene monomer plant as part of a nonlinear polymerization process.Ultimately, the final results indicated that the proposed hybrid ANN-PSO method for the identification of valid parameters from goal parameters, followed by the application of modified ANN for modeling separation section of the styrene monomer plant, were acceptable ideas. Moreover, the results showed that the average relative error between technical data and calculated data of this new model was 9%. Nomenclatures
1. Gujarathi A M, Babu B V, (2010) Multi-objective optimization of industrial styrene reactor: Adiabatic and pseudo-isothermal operation, Chemical Engineering Science, 65: 2009-2026.
2. Banerjee T, Barman S C, Srivastava R K, (2011) Application of air pollution dispersion modeling for source-contribution assessment and model performance evaluation at integrated industrial estate-Pantnagar. Environmental Pollution. 159: 865-875.
3. Ramirez-Beltran N D, Jackson H, (1999) Application of neural networks to chemical process control, Computers & Industrial Engineering, 37: 387-90.
4. Himmelblau D M (2000) Applications of artificial neural networks in chemical engineering. Korean Journal of Chemical Engineering, 17: 373-92.
5. Dong-Juan L (2013) Adaptive neural network control for continuous stirred tank reactor process, IFAC Proceedings, 46: 171-5.
6. Valente G F S, Mendonça R C S, Pereira J A M, Felix L B (2014) Artificial neural network prediction of chemical oxygen demand in dairy industry effluent treated by electrocoagulation, Separation and Purification Technology, 132: 627-33.
7. Pérez-Cruz J H, Poznyak A (2007) Automatic startup of nuclear reactors using differential neural networks, IFAC Proceedings, 40: 112-7.
8. 8. Froio A, Bonifetto R, Carli S, Quartararo A, Savoldi L, Zanino R (2016) Design and optimization of artificial neural networks for the modeling of superconducting magnets operation in tokamak fusion reactors, Journal of Computational Physics, 321: 476-91.
9. Chang J S, Lu S C, Chiu Y L (2007) Dynamic modeling of batch polymerization reactors via the hybrid neural-network rate-function approach, Chemical Engineering Journal, 130: 19-28.
10. Dirion J L, Ettedgui B, Cabassud M, Le Lann M V, Casamatta G (1996) Elaboration of a neural network system for semi-batch reactor temperature control, an experimental study, Chemical Engineering and Processing. Process Intensification, 35: 225-34.
11. Giwa A, Daer S, Ahmed I, Marpu P R, Hasan S W (2016) Experimental investigation and artificial neural networks ANNs modeling of electrically-enhanced membrane bioreactor for wastewater treatment, Journal of Water Process Engineering, 11: 88-97.
12. Molga E, Cherbański R (1999) Hybrid first-principle–neural-network approach to modeling of the liquid–liquid reacting system, Chemical Engineering Science, 54: 2467-2473.
13. Yang SH, Chung P W H, Brooks B W (1999) Multi-Stage Modeling of a Semi-Batch Polymerization Reactor Using Artificial Neural Networks, Chemical Engineering Research and Design, 77: 779-83.
14. Li S. Li Y Y (2015) Neural network based nonlinear model predictive control for an intensified continuous reactor. Chemical Engineering and Processing, Process Intensification, 96:14-27.
15. Messai A, Mellit A, Abdellani I, Massi Pavan A,
A. Gavampour et al. Journal of Petroleum Science and Technology 10 (2020) 7-1919
(2015) On-line fault detection of a fuel rod temperature measurement sensor in a nuclear reactor core using ANNs. Progress in Nuclear Energy. 79: 8-21.
16. Mazrou H (2009) Performance improvement of artificial neural networks designed for safety key parameters prediction in nuclear research reactors. Nuclear Engineering and Design, 239: 1901-10.
17. 17. Hernandez S C, Bueno J A, Sanchez E N. Diaz-Jimenez L (2013) State Estimation by Artificial Neural Networks in a Continuous Bioreactor, IFAC Proceedings 46: 215-20.
18. Basile A, Curcio S, Bagnato G, Liguori S, Jokar S M, Iulianelli A (2015) Water gas shift reaction in membrane reactors, Theoretical investigation by artificial neural networks model and experimental validation. International Journal of Hydrogen Energ, 40: 5897-5906.
19. Lim H (2002) Simulation and optimization of a styrene monomer reactor using a neural network hybrid model, 35: 175-180.
20. Khlebnikova E, Dolganova I, Ivashkina E, Koshkin S (2016) Modeling of Benzene with Ethylene Alkylation, MATEC Web of Conferences, 49: 01001.
21. Tabriz Petrochemical Complex. Operating Manual Process Unit C1-Styrene Monomer, 1995.
22. Hanai T, Ohki T, Honda H, Kobayashi T (2003) Analysis of initial conditions for polymerization reaction using fuzzy neural network and genetic algorithm. Computers & Chemical Engineering, 27: 1011-1019.
23. Krothapally M, Palanki S (1997) A neural network strategy for batch process optimization. Computers and Chemical Engineering, 21: S463-S468.
24. Nascimento C A O, Giudici R, Guardani R (2000) Neural network based approach for optimization of industrial chemical processes. Computers and Chemical Engineering, 24: 2303-2314.
25. Syu M J, Tsao G T (1993) Neural network modeling of batch cell growth pattern, Biotechnology and Bioengineering, 42: 376-80.
26. Tian Y, Zhang J, Morris J (2002) Optimal control of a batch emulsion copolymerisation reactor based on recur-rent neural network models. Chemical Engineering and Processing. Process Intensification, 41: 531-538.
27. Tsen AY D, Jang S S, Wong D S H, Joseph B (1996) Pre-dictive control of quality in batch polymerization using hybrid ANN models, AIChE Journal, 42: 455-465.
28. Zhang J (1999) Inferential estimation of polymer quality using bootstrap aggregated neural networks. Neural Net-works, 12: 927-938.
29. Fernandes F A N, Lona L M F (2005) Neural network applications in polymerization processes, Brazilian Journal of Chemical Engineering, 22: 401-418.
30. Mousavi S M, Panahi P, Niaei A, Farzi A, Salari D (2019) Modeling and Simulation of Styrene Monomer Reactor: Mathematical and Artificial Neural Network Model, 3:1-7.


![,QYHUVLRQ8WLOL]LQJ$92$WWULEXWH - ripi.ir](https://static.documents.pub/doc/80x56/61aa6412adb71f28491b24a4/qyhuvlrq8wlollqj92wwulexwh-ripiir.jpg)