56
UK Consumer Digital Index 2018 Benchmarking the digital and financial capability of people in the UK

UK ConsumerDigital Index 2018
Benchmarking the digital and financial capability of people in the UK

2
New in 2018
Lloyds Bank UK Consumer Digital Index 2018
4
11
16 30 44
54
5538
4 FOREWORDS6 KEY FINDINGS8 RECOMMENDATIONS9 METHODOLOGY
AND DEFINITIONS
STATE OF THE NATIONS12 UK Consumer Digital
Index score and segmentations
UK DIGITAL SKILLS17 UK Basic Digital Skills24 Digital skills in
the workforce26 Digital behaviours
and benefits28 Online security:
a blocker to doing more online
DIGITAL DEMOGRAPHICS31 Basic Digital Skills: age
and gender32 Basic Digital Skills:
region and nation35 Registered disability36 Basic Digital skills:
income and household tenure
37 Benefit claimants with low digital capability
SPOTLIGHT ON AGE
UK FINANCIAL CAPABILITY45 Increasing divide in the
financial safety net47 Mental health and
financial advice50 Registered disabled
people have lower financial capability
51 People without a bank account
HEAR FROM OUR PARTNERS
ABOUT US
CONTENTS
New detail on Basic Digital Skills
Digital skills in the workplace
New demographics including registered disability
Money management attitudes and advice
Spotlight on 11-18 year olds
ă eą ¿ ·

3
WITH THANKS TO OUR PARTNERS
Improving lives through digital

4
Lloyds Bank UK Consumer Digital Index 2018
Since the last report was published in March 2017, we’ve taken significant steps in the right direction. Our 2018 findings show a great improvement in both financial and digital inclusion figures; 190,000 more people have a bank account and 470,000 have gained new digital skills.
New initiatives are also gaining momentum – the Department of Digital, Culture, Media and Sports’ Digital Skills Partnership, which was created in July 2017, has led to more than 70 cross-sector organisations working together to leverage best practice, citizen understanding and their passion to improve the productivity and social mobility of the UK. The Financial Inclusion Policy Forum has also been set up to ensure that people, irrespective of background or income, have a choice of financial services and products.
These initiatives are coming at the perfect time for the UK. While inclusion has improved, the number of people with all five Basic Digital Skills has remained flat year on year. Demographic data shows there are key groups who are more likely to be left behind; for example, people with a registered disability are four times more likely to be offline and almost a third of those over the age of 60 are digitally excluded. There’s an opportunity for a user-centred approach as the key to motivating and supporting those who are the hardest to reach.
Building on the previous Digital Indices, the 2018 report illustrates how digital capability can enhance financial resilience and support wellbeing. A focus of this year’s report is how financial wellbeing may impact mental health. The insight finds that people who
‘ I am delighted to share with you the findings of the third annual Lloyds Bank UK Consumer Digital Index. ’
NICK WILLIAMSTransformation Director, Lloyds Banking Group
have low financial capability are twice as likely to have money worries and financial anxiety. Overall 39% of UK adults say that money worries have ‘really affected them’ with resulting anxiety and sleep issues. Through the Group’s work with Mental Health UK and the Money Advice Service, we are working hard to support people with money worries to help alleviate these concerns.
For the first time this year, the findings also show a £13,000 difference between the annual income of those with the full five Basic Digital Skills and those without. The 2018 findings also show that the social impact of being online is clear. 82% of people credit the internet with connecting them better to friends and family, 72% says it is helping to save time, 53% say it has helped them find
a job. For those online over 60, one in three say combating loneliness is a key benefit.
I am grateful as ever for the support and insight from our many partners, particularly those in the Digital Skills Partnership, The Tech Partnership, and Ipsos MORI for providing their expert views on the report.
We welcome your feedback and updates on how you are using the findings and any ideas you may have for working with us on a more digital and inclusive future for the UK. Please contact us at [email protected] and join the conversation at #DigitalIndex18
FOREWORDS

5
Lloyds Bank UK Consumer Digital Index 2018 Forewords
I would like to thank Lloyds Banking Group for another rich and insightful report on Basic Digital Skills in the UK.
I am pleased to see 470,000 more people have at least one Basic Digital Skill compared with last year. It is also encouraging that the number of people without the full five Basic Digital Skills has fallen by almost 200,000. But we shouldn’t be complacent.
The study presents a practical picture of digital exclusion, providing insight on the barriers people face and the motivations they have for improving their digital skills. This detail is vital for the development of effective policy and impactful interventions.
To help tackle digital exclusion and increase our nation’s digital capability this government established the Digital Skills Partnership
(DSP), to build on great initiatives, both at national and local level. This will enable better collaboration between organisations across all sectors. The DSP is also supporting local partnerships to coordinate and deliver innovative programmes that will lead to thriving and inclusive local economies and communities.
We also announced we will introduce full funding for basic digital training for adults so they have the opportunity to undertake improved courses based on new national standards defining the Basic Digital Skills needed for life and work.
I am delighted that Lloyds Banking Group is playing a leading role in the DSP and that we are partnering on this vital agenda so no one is left behind as we build a Britain fit for the future.
We are once again very grateful for the opportunity to use our groundbreaking research looking at the drivers, barriers or even motivations for not using a bank account. Financial exclusion is generally one of those subjects we know should be reduced, but without understanding the hidden details within it, and people’s lived experience of being excluded, our solutions to that end fall short.
From our research this year and from the wider evidence provided in this wonderful report, we identify some huge challenges and opportunities.
For example we know that 46% of low income households who are digitally savvy say it helps them feel less alone, showing that there are more than just financial
benefits of being online. For the financially excluded, over half are recorded as having all of the Basic Digital Skills – which shows that financial and digital exclusion are not necessarily correlative.
However, we also find that 18% of those in receipt of benefits have low or no digital capability. This is most worrying in the context of managing Universal Credit claims online. We also find that 58% of financially excluded individuals become anxious just thinking about money.
There is still plenty to do to improve the nation’s financial health and this report provides details of not just what the problems are, but also a blueprint for what particular organisations can do to be a help not a hindrance.
‘ I want everyone to make the most of digital technology; the Consumer Digital Index is critical to understanding not only the scale of the work to do, but also in informing how we can deliver targeted programmes. ’
‘ For the third year, Toynbee Hall is delighted to contribute to the Lloyds Bank Consumer Digital Index. This year’s work is very important because we now have a very decent comparable set of qualitative and quantitative data with which to compare. ’SIAN WILLIAMS Director of Policy, Innovation and External Affairs Financial Inclusion Commissioner
MARGOT JAMESMinister for Digital and the Creative Industries, Department for Digital, Culture, Media and Sport

6
Lloyds Bank UK Consumer Digital Index 2018 Key findings
UK Digital Skills Financial Resilience
There are now 4.3 million people (8%) in the UK with zero Basic Digital Skills – this is 470,000 fewer people than in 2017.
11.3 million adults (21%) do not have all five Basic Digital Skills.
The proportion of UK citizens with the full five skills has plateaued. 11.3 million people have limited abilities online – the main tasks that the UK population are unable to do are:
• 43% (23.2 million) of the UK are not able to create something new from existing online images, music or video
• 24% (13 million) of the UK are not able to verify the sources of information found online
• 16% (8.6 million) of the UK are not able to fill out an online application form
There are 3.2 million people on the cusp of the full five skills. If they were to gain this missing skill, there would be 8.1 million people without Basic Digital Skills.
Please refer to page 17
There are now 8.5 million people (17%) who would struggle immediately if their income were to stop; this is 1.1 million more people than in 2017.
• The 30-39 age group are 54% more likely to struggle immediately compared with 2017
• 44% of people without a bank account struggle to cope with their finances. This compares to 14% for the rest of the UK
However, there are 1.3 million more people who could support themselves for three months or more, suggesting a growing divide in the population’s financial safety net.
• 34.8 million people in the UK have high financial capability
• There are 25% more 18-24 year olds who could cope for three months or more
• There are 190,000 fewer people without a bank account which could contribute towards the UK’s increased resilience
Financial health is impacting the UK’s mental health: 39% of UK adults say that money worries have ‘really affected them’ at some point, and they suffer from lack of sleep and feelings of anxiety:
• Women are 38% more likely than men to suffer from anxiety because of finances
• People with a registered disability are 50% more likely to not feel in control of their finances than the rest of the UK
• People without a bank account are more than three times as likely to feel anxious when thinking about money
• Managing money online can help, for example 73% of young people say that being able to access their finances 24/7 helps reduce their financial anxiety
Please refer to page 47
470,000 more people with at least
one Basic Digital Skill
Please note all appendix references are referred to as superscript numbers throughout the report. For the full appendix document please see www.lloydsbank.com/consumerdigitalindex
Regional data: digital access does not guarantee digital adoption. For this and Basic Digital Skills information, please refer to page 33
Spotlight on security: 8 in 10 people have concerns about online security – identity theft is the key driver. Please refer to page 28
8.5m people are not rainy-day ready470,000

7
Lloyds Bank UK Consumer Digital Index 2018 Key findings
Inclusivity Learn to Earn Helping People Prosper
There are key groups who could benefit from digital the most:
• 25% (3.5 million) of people with a registered disability are offline; they are four times more likely not to be online
• 28% of those over 60 are not online; 84% of this group say ‘nothing’ could motivate them to get online
• 18% of the UK adults claiming benefits* (1.2 million people) have low or no digital capability at all – this is compared with the UK average of 15%
• 56% of people without a bank account have the full five Basic Digital Skills compared with the UK average of 79%
Please refer to page 35
There are key audiences who need greater support with digital and financial skills:
• Only one-third of UK adults receive money management advice; people with low financial capability are almost twice as likely to not seek financial advice
• One in three people in the UK do not have a trusted person to talk to about their finances
• While trusted faces help people get online, 82% of those online say further digital development is self-taught
Please refer to page 49
Currently 10% of the workforce do not have Basic Digital Skills. This group earns £13,000 less than those with all five Basic Digital Skills. Those currently unemployed are also almost three times as likely to have limited digital use.The biggest driver for improving digital skills is enhancing work-based performance and productivity:
• Of those who feel they have developed digital skills in the past year, 30% (9 million people) said that the biggest motivation was a desire to improve performance and productivity at work
There is an opportunity for employers to provide more support:
• Almost one in two (47%) of the population uses the internet in the workplace
• Of that group, only 14% have developed their digital skills through work in the last 12 months
Please refer to page 24
The future workforce can’t be taken for granted:
• 11% of 18-29 year olds say they have developed their digital skills and ability to use online services at school, rising to 37% for those currently in the school system
• 700,000 11-18 year olds have no home internet access from a computer or tablet
Please refer to page 39
For the online population, there are a number of benefits:
• 4 in 10 say being online helps them feel less alone
• 7 in 10 say it helps them save time
• 5 in 10 say it has helped them find a job
• 7 in 10 say digital banking helps them avoid overdraft fees
For more information please refer to pages 27 and 49
These benefits are even greater for certain groups:
• For those with a disability, those online are 27% more likely than the rest of the UK to say the internet helps them feel less alone
• For one in three over 60 years old, digital skills help them to manage and improve their health and also to feel less alone
...and digital helps financial resilience. Those with high digital capability:
• Check their finances more than three times as often and feel more in control
• Save nearly twice as often and more than twice as much
For more information please refer to page 26
People with a registered disability
are four times as likely to be offline
9m of UK workforce demand digital skills
to succeed
21.1m people are less lonely due to digital
* Excluding pensions; for a full list please refer to the appendix glossary
x4

8
Lloyds Bank UK Consumer Digital Index 2018
Created in partnership with:
RECOMMENDATIONS: SMALL STEPS TO DRIVE BIG IMPACT
Please refer to lloydsbank.com/consumerdigitalindex for helpful tools and resources
With 470,000 fewer people with zero Basic Digital Skills and 190,000 more with a bank account, progress has been made but not enough
As the proportion of people with all five Basic Digital Skills has not changed since 2017, it is important that organisations work together to join the dots for end users.
People need to be aware of how they can access support based on their needs, not individual organisational offers. Partners can aim to ensure a joined-up approach is provided across all user’s touch points and sectors. Aligning online and offline experiences will help people to access support and advice when and where they need it.
This can only happen through the power of partnerships. Initiatives like the Digital Skills Partnership and the Financial Inclusion Policy Forum are key for leveraging understanding from different perspectives, and for reaching all possible audiences.
10% of the workforce do not have Basic Digital Skills, yet 9 million people want to improve their productivity at work through digital
Large employers have an opportunity to support their employees with skills development and life-long learning. Digital development through large organisations can drive overall change in the UK.
A Digital Champions model could also be further embedded across large organisations. Harnessing existing skills to provide face-to-face support and advocacy can help improve organisations’ capabilities and also those of customers and citizens.
The private sector is also well placed to support the education sector with skills support, helping to set up the future workforce with the financial and digital skills needed for success.
People with a registered disability are four times more likely to be offline
The public and private sectors have a key role to play in building accessible and inclusive products and services and any contact with end users must be supported with skills training.It is key that the 2018 Index data is used to understand the demographic groups who have the most to gain and that they and their needs are prioritised. For example, for the financially excluded, identification and verification measures are a key opportunity to help further reduce the number of people without a bank account.
1. Join up the journey – the power of partnerships
to put user needs first
2. Big employers can make a big difference
3. Trusted organisations must safeguard customers and
clearly communicate it
4. Design for everyone
8 in 10 people have concerns about online security; identity theft is the main reason for concernLarger organisations need to not just ensure their use of online customer data and digital is compliant, but communicate explicitly to customers that this is the case. This should be done through offline channels as well as on online platforms.Acknowledging the importance of online security to using the internet, the new Essential Digital Skills framework - launching May 2018 - brings safety and security to the fore. This framework will replace the current Basic Digital Skills measure, and enable a new annual benchmark of UK digital skills in life and work. It has been designed in collaboration with partners across sectors and signifies pan-industry and policymaker recognition that online safety and security are paramount.
Improving lives through digital

9
Lloyds Bank UK Consumer Digital Index 2018
9,000 Over 9,000 individuals are
interviewed to produce the annual insights for the
Consumer Digital Index
0
1
2
3
4
In 2018, in addition to the behavioural data and attitudinal research found in the 2017 report, the Index now incorporates four data and research approaches, including Basic Digital Skills, information on those 11-18 years old and wider research on people without a bank account.
Additional quantitative questions were also asked through Ipsos MORI’s Tech Tracker, to help further understand how people view internet safety and security.
Behavioural dataA robust and UK representative sample of one million consumers aged 18+. The data comprises 12 months of transactional behaviour. It also provides a longitudinal view to understand if or how people have shifted their financial or digital capability over the past year.
Quantitative surveys conducted by Ipsos MORI2a. 4,073 - Basic Digital Skills, 15+ years (see page 10 for definition)
2b. 1,121 - Tech Tracker, 15+ years
2c. 1,006 - Spotlight on young people, 11-18 years
Attitudinal researchFrom the one million data sample (source 1), more than 2,700 adults were selected and interviewed via telephone, allowing responses to be combined and compared with transactional behaviour. The research was undertaken to understand the digital and financial attitudes and capabilities across the UK.
People without a bank accountToynbee Hall was commissioned to interview those without a bank account to establish their experience in the digital and financial world. This year is the first time year-on-year responses have been collected.
1 million
6,200
2,713
109
Sources
Population source used: ONS Mid Year Estimates 2016 (18+ for all data – please see Source 2 for exceptions)Due to rounding of population numbers, there may be cases where numbers do not add up to totals displayed
METHODOLOGY AND DEFINITIONS

10
Lloyds Bank UK Consumer Digital Index 2018 Methodology and definitions
Methodology and approach The Basic Digital Skills measure was created by Doteveryone and partners to measure the digital skills levels of adults across the UK. The first Basic Digital Skills report was published in October 2015.
Current framework owners, The Tech Partnership, and Lloyds Bank commissioned Ipsos MORI to achieve a UK representative view of digital usage among people aged 15+.
4,000 face-to-face interviews were conducted in November 2017. Respondents were given 11 digital tasks, and were asked:
• Which tasks could you do if asked?
• Which tasks have you done in the last three months?
The answers to these questions were combined to identify a respondent’s digital skills.
BASIC DIGITAL SKILLS 2018
The Tech Partnership Basic Digital Skills framework.
Managing informationUse a search engine to look for information online
Find a website I have visited before
Download/save a photo I found online
CommunicatingSend a personal message via email or online messaging service
Carefully make comments and share information online
TransactingBuy items or services from a website
Buy and install apps on a device
Problem solvingVerify sources of information I found online
Solve a problem with a device/digital service using online help
CreatingComplete online application forms which include personal details
Create something new from existing online images, music or video
Can you..?
Those who said they could do at least one task in each of the skills categories were classified as having full Basic Digital Skills.

State of the Nations
‘Our ambition, through the Digital Skills Partnership (DSP) and Local Digital Skills Partnerships (Local DSP), is to bring organisations from across all sectors together to increase our nation’s digital skills. National and regional collaboration is critical to ensure a more collaborative, coordinated and innovative approach to meeting the digital skills challenge. We and our partners have been busy since the DSP launched last summer: Lloyds Banking Group is leading work to increase the digital capability of SMEs and charities. Microsoft and the Royal Society are convening wider support for teachers to teach a new world-leading computing curriculum. BT and Nominet are leading partners to make better use of data and creating a coherent framework for digital skills that will enable more collaboration and innovation. We’ve also just supported the launch of the first of our Local DSPs with regional partners in Lancashire, and there’ll be more on the way soon – Good Things Foundation and Tech Nation are bringing together a range of organisations to create a ‘playbook’ of best practice to help other regions to establish their own Local DSPs.
Good quality research is vital to achieve our ambition. The Consumer Digital Index report is a crucial addition to the evidence base that we, and our partners, use to understand where the gaps, challenges and opportunities are, and what kind of initiatives will have the greatest impact and where. Digital Skills and Inclusion team, Department for Digital, Culture, Media and Sport
’
Case study

12
State of the Nations
UK Average Index ScoreIn 2018, the average UK Index score is 46.5 and consistent with previous years (figure 1).
Index ScoresAs shown in figure 2, each segment has seen a slight increase in Index Score. Figure 3 shows the proportion and size of each quadrant’s population when mapped onto the UK. This and the data on pages 13 and 14 reveal that the number of people with financial capability has decreased since 2017, while digital capability has seen a marginal overall improvement.
UK CONSUMER DIGITAL INDEX SCORE AND SEGMENTATIONS
* Source for number of people without a bank account: Financial Inclusion Annual Monitoring Report (2017): https://www.birmingham.ac.uk/Documents/news/15518-CHASM-Report-Stage-4.pdf
High Digital Low Financial
33.1+0.4 since 2017
High Digital Low Financial
27.1%14.0 million
-1.6% since 2017
High Digital High Financial
53.2+0.2 since 2017
High Digital High Financial
55.2%28.6 million
+1.2% since 2017
High Financial Low Digital
49.7+0.1 since 2017
High Financial Low Digital
11.9%6.2 million
+0.1% since 2017
Low Financial Low Digital
30.8+0.4 since 2017
Low Financial Low Digital
2.8%1.4 million
-0.1% since 2017
2016
46.12017
46.62018
46.5
Figure 2: Index score by segment. 2018 vs. 2017. Source 1Figure 1: Average UK Index scores since 2016. Source 1 Figure 3: Index scores – proportion of the UK and estimated population numbers by segment. 2018 vs. 2017. Source 1
Fina
ncia
l cap
abilit
y
Digital capability
Fina
ncia
l cap
abilit
y
Digital capability
FINANCIALLY EXCLUDED : 1.5 MILLION (2.9%)*Please note: 2017 referenced figures may differ due to changes in population calculation

13
State of the Nations UK Consumer Digital Index score and segmentations
Digital capabilityThe Index digital capability measure complements Basic Digital Skills, as it analyses individuals’ actual behavioural data.
This year the methodology has been altered to better reflect digital trends.
To maintain relevancy in the way digital capability is classified, the segments have been reviewed to ensure they remain appropriate.
This year, Segment 5 has been expanded to include users with activity across multiple devices and/or the heaviest digital users. This change acknowledges that mobile-only customers or other single-device users will not be limited to Segment 4. Segments 1-3 remain unchanged and unaffected.
Figure 4: Behavioural segmentation applied to UK digital capability. Source 1
60%
50%
40%
30%
20%
10%
0%
Low digital capability High digital capability
1. Passive 2. Getting started
3. Established 4. High 5. Advanced
13%
2%
18%15%
52%
0%
6.4m
1.2m
9.3m7.3m
26.1m
0%
-3%
-7%
+10%
5. Advanced – Creating, including multiple device use for internet banking
3. Established – Digital transactions, i.e. online shopping
4. High – Managing money online (e.g. logs onto internet banking at least four times a year) and streaming content
1. Passive – No evidence of digital capabilities
2. Getting started – Basic digital communication
Key*: Percentage point difference vs. 2017
Population numbers
*Segment definitions are additive, Segment 5 ‘Advanced’ includes all segment behaviours

14
State of the Nations UK Consumer Digital Index score and segmentations
Financial capabilityThis methodology is aligned to the UK Financial Capability Strategy* created by the UK Financial Capability Board; a cross section of leaders in financial services, charity and policy sectors.
The Lloyds Bank Financial Capability segmentation is created using actual behavioural data, providing a scale from very limited access to products and services, through to those demonstrating strong borrowing, saving and repayment behaviours (figure 5).
As in previous years, financial capability is not a measure of wealth – it is a measure of how well a person is able to manage their finances.
*Source: Financial Capability Strategy for the UK, https://www.fincap.org.uk/
Figure 5: Behavioural segmentation applied to UK financial capability. Source 1
*Segment definitions are additive, Segment 5 includes all segment behaviours
60%
50%
40%
30%
20%
10%
0%
Low financial capability High financial capability
8%12%
10%
22%
0%+2%
0%
0%
-1%
4m6.2m
5.2m
11.2m
23.6m
Percentage point difference vs. 2017
Population numbers
5. Advanced – Strong borrowing and repayment behaviours; evidence of positive savings balance and frequent deposits made
3. Established – Little engagement with credit
4. High – Good borrowing and repayment behaviours
1. Limited – No access to credit and no savings
2. Getting started – No engagement with credit facilities, plus infrequent or no savings
Key*:
1. Limited 2. Getting started
3. Established 4. High 5. Advanced
47%

15
State of the Nations UK Consumer Digital Index score and segmentations
17mpeople in the UK have low
financial capability(800,000 more since 2017)
9.1mpeople in the UK have low
digital capability(140,000 fewer since 2017)
e
£
Key: Percentage of the UK population that reside in each region
Percentage of the low digital and low financial capability segments that reside in each region
2.9 million people have both low digital and financial capability2018 Index data indicates that 1.4 million people with bank accounts currently fall into the low digital and low financial capability group. However complementary research shows that 1.5 million adults in the UK do not have access to a bank account*. Without this access they are unable to evidence high digital or financial capability.
Of those with access to bank accounts who have both low financial and digital capability, 40% are aged over 60 (figure 6). As shown in figure 7, almost one-fifth of this group are in Scotland. As the comparison to regional populations shows, this is a disproportionate number of people.
* Financial Inclusion Annual Monitoring Report (2017): https://www.birmingham.ac.uk/Documents/ news/15518-CHASM-Report-Stage-4.pdf
40%Figure 6: Percentage of low digital, low financial capability adults. Split by age. Source 1
Figure 7: Percentage of low digital, low financial capability adults. Split by region. Source 1
30%
20%
10%
0%18-24 25-29 30-39 40-49 50-59 60-69 70-79 80+
4%
11%
23%
14%
4%
20%
10%
0%
Scotla
nd
London
Yorkshire
&
Humberside
South W
est
South East
Wales
North W
est
North East
West
Midlands
East England
East Midlands
Northern
Ireland
17%
8%7%
13%13%11%
8%
14%
7%4% 5%5%
12%
8%7%7% 6%7%
2%3%
18% 18%
8%
9% 9% 9% 9%

UK Digital Skills
‘Digital has really enhanced my life – I met my wife on the internet, I would never have been able to meet her without it. I also get to witness things I would normally miss with my grandson in Scotland – years ago we only would have been able to see them a few times a year, but we regularly Facetime and receive pictures from my daughter. Even on the day he was born. It really helps us to stay in contact and share precious moments. Andy, 64, Corby, East Midlands
’
Case study

17
UK Digital Skills
21% of the UK are without Basic Digital Skills In 2018, 11.3 million people in the UK do not have full Basic Digital Skills (figure 8). While this number has not changed significantly year on year, since the first Basic Digital Skills measurement in 2015 there are 2.1 million more individuals with the full five skills*.
Figure 8 also shows that 3.2 million people in the UK are on the ‘cusp’ and have four of the five skills needed for full Basic Digital Skills.
4.3m8% of the UK population have
no Basic Digital Skills at all
This is 470,000 fewer than in 2017
ă
UK BASIC DIGITAL SKILLS
*Go ON UK Basic Digital Skills (2015)**As per methodology page, not all numbers will sum to total due to rounding.
11.3m**
adults without Basic Digital Skills
542 30 1
8%
2%1%
3%
6%
79%
Figure 8: Percentage of UK adults with a number of Basic Digital Skills. 2018 vs. 2017. Source 2a
Key: Percentage point difference vs. 2017
-1%
0%
0%
-1%
+1%
0%
skills
42.6m people
skills
3.2m people
skills
1.6m people
skills
1.1m people
skill
0.5m people
skills
4.3m people

18
UK Digital Skills UK Basic Digital Skills
Basic Digital Skills task levels At a skill level, there has been little progress since last year (figure 9).
Considering the continued movement of consumer services and sales to online channels, there has not been a notable increase in the proportion of people completing online forms and solving problems digitally.
There is progress to be made in the task ‘verifying sources of information I found online’, particularly when considering the rise of ‘fake news’ and awareness of online fraud and scams.
When the 2018 skill and task data are compared to 2015, there has been an overall improvement.
Percentage point difference vs. 2015Key: Percentage point
difference vs. 2017
+2%
+2%
+2%
+1%
+1%
+1%
+2%
+3%
+1%
-
+1%
+2%
+1%
+1%
+1%
+1%
Create something new from existing online images, music or video
CreatingComplete online application forms which include personal details
Find a website I have visited before
Managing informationUse a search engine to look for information online
Download/save a photo I found online
Buy and install apps on a device
TransactingBuy items or services from a website
Verify sources of information I found online
Problem solving
Solve a problem with a device/digital service using online help
Communicating
Carefully make comments and share information online
Send a personal message via email or online messaging service
88%
91%
88%
79%
89%
80%
88%
85%
87%
76%
73%
76%
81%
85%
84%
57%
Figure 9: Basic Digital Skills and task levels for the UK. 2018 vs. 2015 and 2017. Source 2a
-2%
-1%
-
-1%
-1%
-1%
+1%
-
-
-
-1%
-1%
-
-
-
+1%

19
UK Digital Skills UK Basic Digital Skills
Of the 11.3 million people without the full five Basic Digital Skills, 3.2 million people (6%) lack only one The data reveals that of those on the cusp of full Basic Digital Skills (those with four of the five skills), 38% (1.2 million people) are over the age of 651. As outlined on page 41, the over 65 population remains a cause for concern as 28% of this group are not online at all.
For the first time there is analysis on the top tasks that the 3.2 million people could not do if asked (figure 10). Four-fifths of the ‘cusp’ group also own a laptop or desktop2, indicating that a computer-centred solution may prove successful. Understanding this detail should prove useful to organisations looking to shape targeted and impactful learning content.
People with digital skills are under-utilising themAs figure 11 demonstrates, there is a gap between people having the skills and then putting the skills to use. For example, 81% of people have the Problem Solving skill, but only 56% of this group have used it in the last three months.
SPOTLIGHT ON THE 3.2M
58% are female
29% are social grade DE
38% are over 65
80% have a laptop
³÷¿«
Managing information85%
Communicating78%
Transacting75%
Problem solving56%
Creating57%
91%
89%
87%
81%
85%
Figure 10: Top Basic Digital Skills tasks those on the cusp could not do if asked. Source 2a
Download/save a photo you found online
Solve a problem you have with a device
or digital service using online help
Buy and install apps on a device
Create something new from existing
online images, music or video
Verify sources of information you
found online
Figure 11: Basic Digital Skills. Source 2a
Key: Darker colour shows ‘done in the last three months’
Lighter colour shows ‘could do if asked, but not done in last three months’
44%81% 58%87% 77%

20
UK Digital Skills
Low income (<£17,499)
46%Renting from a Local Authority
24%Own smartphone
3%
Retired
76%Men
39%
Aged 45-64
20%Own PC/Laptop
24%Men in Social
Grade DE
21%
Aged 65+
76%Women in Social
Grade DE
35%
Without internet access at home, school or work
81%Women
61%
Figure 12: Characteristics of those with zero Basic Digital Skills. Source 2a
4.3 million UK adults (8%) have no Basic Digital Skills at allFigure 12 below shows some of the characteristics and behaviours that people without any Basic Digital Skills exhibit.
While 8% is a significant proportion of the population, progress has been made as there are 470,000 more people with at least one Basic Digital Skill than in 2017. For those without Basic Digital Skills at all, 76% are retired and over the age of 65. Figure 13 outlines the proportion of those without Basic Digital Skills by region. This shows that one-fifth of this group resides in Wales.
Figure 13: Proportion of regional population with zero Basic Digital Skills. Source 2a
Wales
South West
Scotland
London
South East
East England
East Midlands
North East
West Midlands
Yorkshire & Humberside
North West
7%
12%
6%
9%
8%
5%
6%
10%
9%
19%
9%
UK ADULTS WITH ZERO BASIC DIGITAL SKILLS
Base too small

21
UK Digital Skills UK adults with zero Basic Digital Skills
Motivation is the main barrier to getting onlineFor 39% of those offline, the main barrier to doing more online is motivation-led, as they have said the internet is of ‘no interest’ (figure 14). For 17% it is a confidence issue, as they believe the internet is too complicated for them. 16% of those offline claim privacy and security concerns are a real barrier for them. Online security also represents a key concern for the online population, as outlined on page 28.
When asked what might get them online, 78% of those offline said ‘nothing’The next opportunity was for 8% of this group who cited ‘improved online security awareness’ as a barrier to overcome3.
To access training materials and support documents to help
people get online, visit www.learnmyway.com
Figure 14: Why people offline are not using the internet. Source 3
17%
50%
40%
30%
20%
10%
0%
14%16%
12%
6%
12%
16%
5% 5%
The inte
rnet d
oesn’t
intere
st me
I think t
he inte
rnet is
too
complic
ated to
use
I’m w
orried about m
y
privacy a
nd securit
y
I don’t h
ave enough tim
e
I wouldn’t k
now where to
start
I’d ra
ther s
pend my m
oney
on other th
ings
I don’t u
nderstand th
e benefits
It’s to
o expensiv
e
Poor connectiv
ity due to
no
mobile in
tern
et cove
rage
I have
a disabilit
y that p
reve
nts
me from usin
g the in
tern
et
Poor connectiv
ity in
my a
rea
due to slo
w broadband sp
eeds
é чË É «s G
8%
I don’t h
ave a co
mputer/m
y
compute
r is curre
ntly bro
ken
"O e ђ 4
39%
Poor connectiv
ity in
my a
rea due
to no home bro
adband access
8
7%9%

22
UK Digital Skills
While the behavioural data segmentation measures digital capability, and the Basic Digital Skills survey indicates reported skills, it is important to understand the level of UK ambition to improve digital skills and the perception of progress.
30.1 million UK adults feel their digital skills have improved in the past yearIn 2018, 40% of the population (20.1 million) recognise that their digital skills have not improved at all in the past 12 months (figure 15). However, 60% of UK adults (30.1 million) do recognise an improvement. This is interesting when considered alongside the plateau in UK Basic Digital Skills. This may indicate improved digital confidence rather than actual ability, or may signal greater skills in areas beyond the current Basic Digital Skills framework.
The key motivations for this group improving their digital skills were (see figure 21 on page 25 for full list):
• 30%: improve productivity at work
• 26%: no particular reason
• 23%: improve own performance
65% 56% 54%68%
Yorkshire & Humberside
East England
East Midlands
Scotland
No
Yes
DIGITAL SKILLS: PERCEPTIONS OF PROGRESS
60%
2017
40%
18-24 25-29 30-39 40-49 50-59 60-69 70-79
I have improved my digital skills in the past year
72% 62% 62% 58% 59% 50% 55%
Figure 15: Do you think your digital skills have improved in the past year? Source 3
Figure 17: Percentage of the UK who think their digital skills have improved in the past year. Split by age. Source 3
Figure 16: Percentage of the UK who think their digital skills have improved in the past year. Split by region. Source 3
72% of 18-24 year olds acknowledge that their digital skills have improved Perhaps unsurprisingly, the group most likely to feel their digital capability has improved is those that typically have the greatest levels of digital skills: the 18-24 year olds (figure 17). Notably, half of the 60+ population also feel their digital capability has improved.
Capability does not correlate with confidence The data shows that confidence levels in digital ability are consistent irrespective of capability. 36% of people with low digital capability are concerned that their digital skills aren’t good enough, compared to 25% of people with high digital capability4. This is also the case at a regional level. Figure 16 illustrates that Yorkshire & Humberside and East England have the highest proportion of population who believe they have improved their digital skills in the past year, despite Basic Digital Skills in these regions having decreased (see page 33). In Scotland and East Midlands, digital confidence is at its lowest. See appendix 5 for full regional list.

23
UK Digital Skills Perceptions of progress
Digital independence – 8 in 10 of those online are digitally self-taughtIn the Consumer Digital Index 2017, the data showed that face-to-face support is vital to learn initially how to use the internet; 45% of people seek advice from family and friends*. This year, the findings show that after initial support to get online, 82% of the UK are self-taught (figure 18).
In order to understand whether skill level impacts learning choices, the data has been split by low and high digital capability. This shows that irrespective of digital capability levels, similar learning choices apply. The only notable difference is that those with low digital capability are twice as likely to turn to their family for help.
Key:
11%of the UK have developed
their digital skills through work
£
*Lloyds Bank UK Consumer Digital Index 2017 page 30 Self-
taug
ht
Work
Fam
ily
School
Frien
ds
6%
Bank s
taff
Source
s
Even
ing cla
sses
Loca
l su
pport
Other
90%
80%
70%
60%
50%
40%
30%
20%
10%
0%
Darker colour shows high digital capability Lighter colour shows low digital capability UK average
Figure 18: How have you developed your digital skills and ability to use online services? Comparison of how people have developed their digital skills. Split by low and high digital capability. Sources 1 and 3
82%
11%11%
16%
5%7%
70%
2%2%
31%
17%
5%
16%
83%
2%5%
8%
16%
6%
11%
5%
11%
2%
7%
2%
Informal Formal
2%6%5%
1%

24
UK Digital Skills
10% of the UK workforce are without Basic Digital SkillsWith the digital skills gap costing the UK a reported £63 billion annually*, it is vital to understand the digital capability of the current and future workforce. As shown in figure 20, 10% of those in employment do not have Basic Digital Skills. The findings also show that those currently unemployed are almost three times as likely to be without digital skills than those in employment (27%). With the digital sector creating jobs twice as quickly as the non-digital sector**, supporting working-age adults is a real opportunity.
Digital skills are worth almost £13,000 a year to UK adults in employment Figure 19 indicates that working adults in the UK with full Basic Digital Skills are paid an average annual salary of £34,500 compared with £21,250 for those without. While the data does not prove that attaining full Basic Digital Skills will cause an increase in salary, there is a clear correlation.
DIGITAL SKILLS IN THE WORKFORCE
* UK Government Digital Strategy (2017): https://www.gov.uk/government/publications/uk-digital-strategy **Tech Nation (2017): https://technation.techcityuk.com/ ***Office for National Statistics (2018): https://www.ons.gov.uk/employmentandlabourmarket/peopleinwork/employmentandemployeetypes/bulletins/uklabourmarket/february2018
Figure 20: Basic Digital Skills. Split by employment status. Source 2a
90%
89%
90%
75%
73%
72%
78%
76%
82%
99%
96%
93%
49%
50%
47%
Employed (full-time/part-time)
Unemployed
Homemaker
Student/at school
Retired
Key: 2015 2017 2018
Average Income
£34,500
Average Income
21,250
Average Income
£26,624***
£30,000 – £39,999 £17,500 – £24,999UK AVERAGE
Figure 19: Basic Digital Skills and income. Split by those with all five skills, those with zero to four skills and the UK average. Source 2a. See appendix glossary for household income bandings used.
Working population with all five skills Working population with zero-four skills

25
UK Digital Skills Digital skills in the workforce
Only 14% of workplace internet users say they have developed their digital skills at workAs found in the Business Digital Index 2017*, digital skills translate into tangible benefits in the workplace. Yet this report shows that 53% of people use the internet outside of work, but not for work. The data finds that only 14% of these workplace digital users feel like their digital skills have improved through work6. This shows that only a small proportion of digitally capable employers are developing their digital skills pipeline.
The biggest catalyst for people to improve their digital skills is work Survey results show that of the people who say that their digital skills have improved in the past year, 9 million people (30%) say that the motivation for doing so was to ‘improve performance and productivity at work’ (figure 21).
When examining this group of people and whether they have digitally developed through work, the data showed that 6% have received digital upskilling in the workplace. This suggests a gap between employer training provision and the demand for digital skills7.
30%Improve performance
and productivity at work
26%No particular reason
23%Improve own performance
6%Support from friends/family
5%Growth of
innovative tech
Life event
4%
Wanted to access online
savings
3%
Freely available online training
3%
Cheaper cost of devices
and internet
3%
Through education/school/university
3%
1%
5%Someone telling
me about the benefits
1%
*Lloyds Bank (2017): www.lloydsbank.com/businessdigitalindex
Figure 21: If you have improved your digital skills in the past year – what was your motivation to do so? Source 3
6% of those who upskilled in digital to improve their workplace productivity
achieved this through work
ą
Manage my finances
online
Access Universal
Credit

26
UK Digital Skills
9 in 10 internet users manage their money online 2018 data shows that 88% of the UK are using digital banking8. As figure 22 demonstrates, for those managing their money online, the main benefits centre around flexibility, ease, and peace of mind. Two-thirds of the UK (62%) are worrying less due to the ability to track and access their finances at any time.
Digitally capable consumers exhibit more financially resilient behaviours As digital money management becomes more prevalent, key benefits are being reported. The segmentation data shows that people with high digital capability are more likely to have stronger financial behaviours. Highly digitally capable people are:
• More than three times as likely to check their bank balance
• Saving nearly twice as often
• Saving more than twice as much
This trend is the same regardless of income level9.
saving nearly 2x as often
2x
more than 3x as likely to check their bank balance
3x
saving more than 2x as much
2x
People with high digital capability are:
DIGITAL BEHAVIOURS AND BENEFITS
*This graph is not comparable against 2017 as responses are not the same
Figure 22: Benefits of managing money online*. Source 3
½Ç
·s
Less intrusive than face to face
Other
It’s easier to send / transfer money abroad
Save as little or as much as I likeO
ę
±K
÷Worry less, as can track finances
Access and manage money 24/7
Payments are easier
No queue or appointments
Move money when I want
81%
62%
55%
90%
80%
70%
60%
50%
40%
30%
20%
10%
0%
O ę± ½K Ç÷ · s
68% 67%
47%
37%
7%
76%

27
UK Digital Skills Digital behaviours and benefits
Greater digital capability breeds greater benefits Figure 23 shows the top benefit of being online is better connecting with friends and family (82%, +6% year on year)10.
The data shows how the benefits correlate with digital capability. Compared to Segment 3, Segment 5 are 53% more likely to have found a job and 26% more likely to have saved money and improved their health through use of the internet. This shows that the greater the digital capability, the greater the benefits.
42% of people also report it is helping them to feel less alone – this is important when considering that research from the Jo Cox Commission* shows that loneliness is as harmful to health as smoking 15 cigarettes a day.
As the table on the right outlines, regardless of digital capability levels, this benefit is consistently realised.
* Jo Cox Commission (2018): https://www.jocoxloneliness.org/
more likely to save time
27%more likely to have
found a job
53%more likely to use digital to manage their health
26%more likely to feel part
of a community
19%
Consumers with the highest digital capability are:
Digital capability
UK average 3. Established 4. High 5. AdvancedAdvanced vs. Established
(% difference)
Helps me me to better connect with friends and family 82% 72% 78% 85% 18%
Helps me to better organise my life 76% 59% 74% 79% 34%
Helps me save time, so I can enjoy myself more 72% 59% 67% 75% 27%
Helps me save money 69% 57% 66% 72% 26%
Helped me find a job 53% 38% 44% 58% 53%
Feel more like part of a community 48% 43% 40% 51% 19%
Manage and improve health 47% 39% 41% 49% 26%
Helps me feel less alone 42% 40% 38% 43% 8%
Figure 23: Statements about the benefits of using the internet. Split by digital capability segments. Sources 1 and 3

28
UK Digital Skills
Very concerned
Not at all concerned
Slightly concerned
Somewhat concerned
Key:
As found in the recent Lloyds Bank Business Digital Index, for many, security concerns are proving to be a barrier to doing more online. Around 8 in 10 UK citizens have online security concerns, with 40% stating they are ‘very concerned’ (figure 24).
Very concernedNot at all concerned
40%
31%
12%
16%Ë
Keen to understand the drivers for this concern, survey respondents were asked to share their main reasons for being apprehensive; the main reason being identity theft (figure 25). One in two also share concerns about being monitored online, and one in four know friends and family who have experienced personal details being taken in the past.
Such concerns may be a blocker to development of the ‘Transacting’ and ‘Managing Information’ Basic Digital Skills, as they both involve using personal details and accounts online (see page 10).
ONLINE SECURITY: A BLOCKER TO DOING MORE ONLINE
ć
·
£
s
ď
É
ã
" ć ·£ sď Éã " Worried that I might break something when using the internet
Wouldn’t know where to start or what to do next
Would feel silly if my personal details were taken and people find out
Friends/family had personal details used online without consent
Worried about having my identity taken
Worried I will lose money and not get it back
Worried that if personal info was taken, it might impact other people
Don’t like the idea of being monitored online
65%
41%
25%
11%
6%
70%
60%
50%
40%
30%
20%
10%
0%
Figure 24: To what extent, if at all, are you concerned about online security? Source 2b
Figure 25: You said that you were concerned about online security, why are you concerned? Source 2b
49% 47%
19%

29
UK Digital Skills Online security: a blocker to doing more online
Financial institutions can play a big part in alleviating concernsIt is vital that the extent of the concern is understood as well as the root cause, and the measures that can be taken to rectify the problem.
For the first time, the survey asked what would help people to reduce their worries about online security.
The data shows that there is a clear opportunity for financial institutions to communicate their theft and security policies, as two-thirds of respondents would get comfort from greater communication from banks on these topics (figure 26).
For more information on our online guarantee, please visit
https://www.lloydsbank.com/help-guidance/security/ how-we-protect-you.asp
£14%
Nothing at all
ђ
56%
A clear indication on a website that the page is secure
Ë
23%
Suitable information on online forums and sites
£
14%
Suitable face-to-face expert training I can learn from
·
65%
Knowing that my bank is protecting me and my money
¯
40%
If businesses were to be fined if they didn’t have secure sites
G
Figure 26: What would help to reduce your worries about online security? Source 2b

Digital Demographics
‘My digital usage is very much as and when required. Beyond staying in contact with people, I mainly use the internet to access information such as walking routes or gardening hints and tips. I also like to learn new things and look up new recipes to try. I do sometimes feel like I am being pushed into doing things online, it doesn’t always suit me or my daughter, who has a disability. I am very old fashioned and do prefer things on paper.Alison, 60, Edinburgh, Scotland
’
Case study

31
GenderOverall there is still a gap between the digital skills levels of men and women; however, this is narrowing. In 2018 there are 2% fewer men with full Basic Digital Skills compared with last year. The number for women has remained flat (figure 28).
The behavioural data of one million consumers however suggests there is no difference between the two genders12.
ZERO DIGITAL SKILLS FULL FIVE BASIC DIGITAL SKILLS
50% 0% 50% 100%
Key: 2015 2018Figure 27: Basic Digital Skills. Split by age. Source 2a
Key: 2015 2017 2018
Figure 28: Basic Digital Skills. Split by gender. Source 2a
100%
90%
80%
70%
60%
50%
40%
30%
20%
10%
0%
82%84%80%
75%75%74%
MEN WOMEN
There are now no 15-34 year olds in the UK with zero Basic Digital SkillsWhile this is positive progress, the other end of the spectrum shows that 4% of 15-24 year olds do not have full Basic Digital Skills (figure 27); an increase of 1% from 201711.
The older age groups have seen the most progress since 2015. The 55-64 and over 65 age brackets have seen a 5% and 3% improvement respectively in the number of people with zero Basic Digital Skills.
BASIC DIGITAL SKILLS: AGE AND GENDER
Digital Demographics
15-2496%0%
93%1%
45-5485%4%
82%5%
25-3494%0%
92%1%
55-6474%8%
72%13%
35-4490%1%
89%2%
65+46%29%
43%32%
‘ The data shows that women appear to have the perception that they have lower digital skills than men, when the data demonstrates there is equal capability. It is important that women acknowledge their abilities so as to better access and leverage the opportunities that digital capability offers. ’Vivienne Artz, President of Women in Banking and Finance

32
Digital Demographics
79% of the UK’s population have achieved full Basic Digital SkillsAt a UK total level, Basic Digital Skills levels have plateaued year on year. This plateau disguises the national variations demonstrated in figures 29 and 30.
As shown in figure 29, 80% of the Scottish and English populations have full Basic Digital Skills. With 34% of the Welsh population yet to achieve all five skills, there is an opportunity to target key demographics to drive change. ONS data shows that Wales has one of the lowest proportions of social grade AB consumers* and the data shows that Basic Digital Skills is correlated to higher social grade levels13.
Examining the data at a regional level, the 2018 results show that the North East, Yorkshire & Humberside and Wales have seen declines of around 5% (figure 30). However, progress has been made in London, the South West and Scotland.
*Office for National Statistics (2013): https://www.ons.gov.uk/census/2011census
BASIC DIGITAL SKILLS: REGION AND NATION
Figure 29: Population with and without Basic Digital Skills. Split by nation. Source 2a
Wales Wales
Scotland
England England
80% 20%
80% 20%
66% 34%
Scotland
HAVE BASIC DIGITAL SKILLS DO NOT HAVE BASIC DIGITAL SKILLS
Scotland
3.6m 910,000
England
Wales
36.3m 9.1m
1.7m 880,000

33
Digital Demographics Basic Digital Skills: region and nation
Digital access does not guarantee digital adoptionThis year, UK survey respondents were asked whether they could access the internet at home, school or work via either a smartphone, computer or tablet. The data in figures 30 and 31 show that access to the internet and Basic Digital Skills levels do not appear to be linked. For example, the North East and West Midlands – two of the regions with the highest internet access levels – are two of the regions with lower levels of Basic Digital Skills.
It is important that local authorities and organisations place a focus on providing support and training opportunities, to help close the gap between access and uptake.
Base too small Base too small
Figure 30: Basic Digital Skills. Split by region. Source 2a Figure 31: Do you have internet access at home, school or work (via a computer, smartphone or tablet)? Yes respondents. Split by region. Source 2b
Wales (-5%) Wales
South West (+3%) South West
Scotland (+2%) Scotland
London (+1%) London
South East (0%) South East
East England (-2%) East England
East Midlands (-1%) East Midlands
North East (-6%) North East
West Midlands (0%) West Midlands
Yorkshire & Humberside (-5%)
Yorkshire & Humberside
North West (0%)
North West
UK Basic Digital Skills
79%UK average
91%80% 92%
71% 99%
81% 91%
71% 87%
79% 93%
86% 91%
82% 92%
78% 90%
76% 98%
66% 81%
81% 91%
Key: Above UK average Average Below UK average Key: Above UK average Average Below UK average

Case study
“By the age of 15 I was registered as blind. I became dependent on other people to help me with most things. Now through the help of technology I have regained my independence. I turn on a setting on my smartphone which allows me to use it without looking at the phone screen. As I move my finger over the screen, information is read out to me. This enables and empowers me to use technology to do things like managing my money all by myself.Adi, 36, Camden, London
”

35
Digital Demographics
For the first time, the 2018 data allows for analysis of the digital capability, behaviours and attitudes of people with a registered disability.
Registered disabled people are four times more likely to be offline The data shows that 25% of those with a registered disability (3.5 million) are offline compared with 6% of the rest of the UK14*.
Lack of motivation and confidence are blockers For the registered disabled offline population, the biggest barrier to getting online is lack of interest – mirroring the UK population as a whole15.
1. The internet does not interest me (38%, -1% vs. UK average)
2. I think the internet is too complicated to use (25%, +8% vs. UK average)
3. I wouldn’t know where to start (23%, +8% vs. UK average)
The second and third largest barriers listed above indicate that confidence and support may help to improve inclusion for this group.
As shown in figure 32, there are similar proportions of people who believe they have improved their digital skills. A marked difference though is within confidence levels; people with a registered disability are 50% more likely to be concerned that their digital skills are not good enough.
One in two people with a registered disability say using the internet helps them feel less lonely For the 75% of disabled people using the internet, there are a number of key benefits. In some instances they are more likely than people without a disability to reap the rewards of being online16:
• 27% more likely to say that the internet helps them feel less alone (52% vs. 41% UK average)
• 13% more likely to say that they feel more part of a community (54% vs. 48% UK average)
• 9% more likely to say that it helps them manage their health (50% vs. 46% UK average)
Without a registered disabilityWith a registered disabilityKey:
DIGITAL DIVIDE IS GREATER FOR PEOPLE WITH A REGISTERED DISABILITY
Figure 32: Percentage of people who agree to either statement. Split by those people with and without a registered disability. Source 3
Do not think their digital skills are good enough
36%24%
Believe they have improved their digital skills
60% 61%
* https://assets.publishing.service.gov.uk/government/uploads/system/ uploads/attachment_data/file/692771/family-resources-survey-2016-17.pdf

36
Digital Demographics
Households earning over £40,000 per year are 47% more likely to have full Basic Digital Skills As household income increases, so do levels of Basic Digital Skills (figure 33).
Compared with those earning over £40,000 a year, the low-income group is more likely to see the benefits of being online17. They are:
• 13% more likely to say it has helped them find a job
• 46% more likely to say it helps them to feel less alone
• 11% more likely to say it helps them manage and improve their health
• 29% more likely to say it helps them to feel part of a community
Opportunity for digital skills initiatives to focus on social housing The level of Basic Digital Skills continues to be highest among homeowners with a mortgage and those who rent privately (figure 34). Those with local authority or housing association accommodation have the most to gain.
91%
89%
92%
68%
67%
67%
85%
88%
89%
69%
65%
71%
58%
60%
57%
Owned with mortgage
Owned outright
Rented from private
landlord
Rented from housing
association
Rented from local
authority
BASIC DIGITAL SKILLS : INCOME AND HOUSEHOLD TENURE
Figure 33: Basic Digital Skills. Split by household income. Source 2a
Figure 34: Basic Digital Skills. Split by household tenure. Source 2a
100%
90%
80%
70%
60%
50%
40%
30%
20%
10%
0%
84% 84% 84%
94% 95% 94%
Low (<£17,499)
Medium (£17,500-£39,999)
High (£40,000+)
Key: 2015 2017 2018Key: 2015 2017 2018
65% 64%66%

37
Digital Demographics
For access to resources to support digital skills training and understanding, visit our
Useful Links and Resources site www.lloydsbank.com/consumerdigitalindex
£
Almost one in five of working-age benefit claimants have low or no digital capabilityOne of the new demographic groups examined this year is benefit claimants. Figure 36 shows that 18% of this group, an estimated 1.2 million people*, have low or no digital capability. This is higher than the UK average of 15% (see page 13).
The findings also show that the areas with the largest proportions of benefit claimants with low or no digital capability are Scotland and the North East (figure 35).
BENEFIT CLAIMANTS WITH LOW DIGITAL CAPABILITY
*Source: DWP, 2017, https://www.gov.uk/government/uploads/system/uploads/attachment_data/file/659423/dwp-quarterly-benefit-stats-summary-november-2017.pdf
High digital capabilityLow digital capability
Figure 35: Percentage of people receiving benefits with low or no digital capability. Split by region. Source 1
Figure 36: Percentage of those receiving benefits. Split by digital capability segmentation. Source 1
Wales
South West
Scotland
London
South East
East England
East Midlands
North East
West Midlands
Northern Ireland
Yorkshire & Humberside
North West
14%
20%
20%
19%
19%
16%
16%
19%
19%
19%
18%
16%
50%
45%
40%
35%
30%
25%
20%
15%
10%
5%
0%£
16%
a
2%
Ï
22%
G
49%
«
11%
£
Ïa
1. Passive – Digitally excluded
2. Getting started – Email communicators
3. Established – Online shoppers
G 4. High – Active online bankers
« 5. Advanced – Multi-device bankers

38
Spotlight on Age
‘My husband and I are quite different when it comes to managing things online. I work in a technical and creative role so I have to be digitally savvy for my job. I will do the banking online and manage all of our accounts on a day-to-day basis, mainly using my phone and the fingerprint technology. We are also going through the motions of moving house, the whole process can be done online including signing documents digitally. I much prefer using the internet as there is a trace with everything I do, and I trust it more than someone manually processing paperwork.Jeffrey only ever accesses the internet through his phone. He can send and receive emails and will look at properties and interior design ideas, but his interaction will stop there. He isn’t as trusting as I am, and definitely isn’t as interested as the children are.Recently we have bought Otis and Lila a Kindle device each, which they are already very confident using. I have set up their profiles with parental controls so I know what’s what, and they have been set to an age-appropriate level.
They also know they have a daily timer set, so they are unable to use it before 7am and after 8pm, and only have an hour of usage a day. I am keen to keep their use at a measured level for now, as they will inevitably need it more and more as they grow up.Jeffrey (48), Holly (43), Otis (9) and Lila (5), Kent, South East
’
Case study

39
3h 53min
Figure 37: Proportion of time spent online and doing school work. Split by age. Source 2c
Key: Total time online during work/weekdaysSchool work time online
60,00011-18 year olds
do not have any internet access at home at all
£
New research on 11-18 year oldsFor the first time, the 2018 Consumer Digital Index includes research on over 1,000 young people in order to better understand digital access, usage and skills among a generation typically considered to be the ‘digital natives’.
Almost half of their time spent online is for school workMost 11-18ear olds have access to the internet at home (99%)18 and use it everyday (96%)19. For the 11-15 year olds online at home, usage is just under three hours on a weekday and this rises to just under four hours for 16-18 year olds (figure 37).
11-15 year olds indicated that they spend half (49%) of all their time online at home doing their school work (figure 37) and 86% access the internet for school-related content20. The data also shows that young people from ABC1 social grades are even more likely to access the internet for school-related content and to look up information21.
* Source: BESA (2007): http://dera.ioe.ac.uk/8285/7/home_access_report_Redacted.pdf
11-18 YEAR OLDS
700,000 11-18 year olds (12%) have no home internet access from a computer or tablet 12% of this age group do not have any laptop, desktops or tablets to access the internet at home22. A further 60,000 11-18 year olds do not have any home internet access at all. 68%23 of 11-18 year olds with home internet access say that they would find it difficult to complete school work without it – this suggests that for the 700,000 without adequate device access, there could be academic implications. The last piece of comparable research was undertaken in 2007 by BESA* – this data showed that there were one million families who did not have a computer at home.
49% of time online is used
for school work
2h 48min
1h 22min
11 - 15 years old
48% of time online is used
for school work
1h 52min
16 - 18 years old
Spotlight on Age

40
100%
90%
80%
70%
60%
50%
40%
30%
20%
10%
0%
Figure 38: Do you think your digital skills have improved in the past school/work year? Yes respondents split by age. Source 2c
Figure 38 shows that in the past school year, 94% of 11-15 year olds believe that their digital skills have improved. This number reduces with age to less than three-quarters (72%) for 18-24 year olds24.
37% of 11-18 year olds have improved their digital skills through schoolOver one-third of 11-18 year olds say that they have improved their digital skills at school (figure 39) compared to only 11% of those aged 18-2925. This indicates that the future pipeline of digital skills is now stronger. Family and friends still remain an important support.
People aged 11-18 shared a number of positive attitudes regarding the internet26:
• 90% are confident in their digital skills and abilities
• 75% will use the internet to help them solve a problem
• 72% say the internet is helping them to achieve future career ambitions
16 to 18 year olds
87%
94%
11 to 15 year olds
Figure 39: How have you improved your digital skills in the past school/work year? Split by age. Source 2
Key: 11 to 18 year olds
15%
22%
23%
37%
56%
Spotlight on Age 11-18 year olds
£
§
·
Online
Family
Friends
ąSchool
UI taught myself

41
Figure 40: Top five answers among those aged over 60 to ‘What would help you get online?’ 2018 vs. 2017. Source 3
Key: 2017 2018
AGED 60+
28% of those aged over 60 are offline
In 2017, 29% of those over 60 were digitally excluded – in 2018 there has been a one percentage point improvement27. For those still offline, the three main blockers to doing more online are28:
Main barrier is motivationWhen asked what could help them get online, 84% responded ‘nothing’, which presents a real challenge for practitioners seeking to help drive change (figure 40).
43% 17% 16%
It is too complicated
for me
I have no interest in the
internet
I wouldn’t know where
to start
Spotlight on Age
10%
14%
7%
10%
5%
10%
5%
8%
84%
74%
Nothing
Trust and security measures
Cheaper cost of device
Understanding the benefits
Training

42
Spotlight on Age Aged 60+
Keeping connected is the key reason those aged 60+ are onlineFigure 41 shows that a large proportion of this age group are reaping the rewards of being online; nearly two-thirds say it makes it easier to organise their lives, save time and save money. Notably, since 2017, those over 60 are 36% more likely to agree that the internet helps them to improve and manage their health.
‘ This year’s report indicates that older people are still facing the same barriers. These can be overcome but we are unlikely to see dramatic changes without significant investment.In our experience, older people are most likely to want to get online when they have easy access to ongoing, one-to-one support tailored to their interests, circumstances and current digital skills. However, as a significant proportion of older people and other groups remain offline, essential services like banking, must remain easily accessible in other ways.The Age UK Network supports older people to gain the skills and confidence to use the internet in a variety of ways, such as drop-in sessions, classes and peer support programmes. ’Caroline Abrahams, Charity Director of Age UK
Figure 41: Here are some things people sometimes say about going online. Do you agree with any of the following? 2018 vs. 2017. Source 3
Over 60 2017
Over 60 2018
% difference
Helps me connect better with friends and family 64% 71% 11%
Easier to organise life 58% 62% 7%
Helps me save time, so I can enjoy myself more 58% 57% -2%
Helps me save money 61% 62% 2%
Manage and improve health (e. g. use a Fitbit, manage prescriptions online or source healthy recipes)
25% 34% 36%
It helps me feel less alone – 32% –
Key: -9% to -1% 0% to 9% 10% to 19% > 20%
One in three of those aged 60+ say the internet helps them feel less alone
³

43
100%
90%
80%
70%
60%
50%
40%
30%
20%
10%
0%18-24 25-29 30-39 40-49 50-59 60-69 70-79 80+
Age
Figure 43: Comparison of digital and financial capability between age groups. Sources 2b and 3
There are double the number of 18-24 year olds than those aged 60+, who say that their financial situation leaves them stressed and anxious29
18-24 year olds are 41% more likely than those aged 60+ to think that their digital skills have improved in the past year30
Those aged 60+ are 18% more likely to feel on top of their budgets compared to 18-24 year olds (66% vs. 56%)29
dd Almost two-thirds (61%) of 18-29 year olds are concerned about using their personal details online31
¢¢ 65 year olds are 35% less daunted than the UK average when it comes to receiving financial advice (15% vs. 23%)32
d
Spotlight on Age
18-24 60+
18-29
Figure 42: Percentage of people with Segment 5 digital and financial capability. Split by age. Source 1
30%38% 40%
45%49%
59%62% 63%
72%
58%
44%
30%
16%8%
Age is an important factor when looking at digital and financial capability
LIFESTAGE LINKED TO CAPABILITY
Key: Digital capability Segment 5 Financial capability Segment 5
80% 79%

44
Case study
UK Financial Capability
‘Normally I am pretty terrible at managing my finances, but thanks to my banking app I stay on track. I’m always using the app to keep a real-time track of my money to see what I can spend for the rest of the month. I keep on top of my direct debits and standing orders, and if a bill is more expensive than I thought, I can plan based around that. I always check it before I go on a night out to see how much I can spend while socialising – I can also really easily transfer money on the spot to a friend if needed. Adam, 29, Teignmouth, South West
’

45
UK Financial Capability
44% of the UK are able to cope for more than three months if their income were to stop immediately The 2018 data shows a two percentage point increase in the number of UK citizens able to cope for more than three months in the event of a financial shock (figure 44); this is 1.3 million more people since 2017.
However, for almost one in five people (17%), the financial implications would be immediate; this is also an additional 1.1 million people (2%) compared with last year. Both of these groups have increased in size year on year, demonstrating the increasing divide in the financial safety net.
As age increases so does financial resilienceIn line with the results of the 2018 financial capability segmentation, those over 50 years old are most likely to cope for more than three months. However, data from figure 44 indicates that the increased UK average of those who could cope for more than three months, is driven primarily by the 18-24 age group; they are 24% more likely than in 2017 to have financial reserves in place.
INCREASING DIVIDE IN THE FINANCIAL SAFETY NET
Figure 44: Imagine now that you suffered a financial shock and you suddenly lost your regular income. Based on reserves you have in place, for how many months could you cope? Split by age. Source 3
UK average 18-24 25-29 30-39 40-49 50-59 60-69 70-79
2017
Could cope for more than three months 42% 24% 32% 38% 40% 51% 61% 68%
Would struggle immediately 15% 23% 16% 13% 19% 13% 12% 5%
2018
Could cope for more than three months 44% 30% 31% 34% 43% 56% 65% 77%
Would struggle immediately 17% 18% 19% 20% 18% 15% 14% 7%
% ch
ange
18
vs. 1
7 Could cope for more than three months +5% +24% -3% -9% +8% +10% +7% +13%
Would struggle immediately +13% -23% +20% +57% -6% +17% +18% +51%

46
UK Financial Capability Increasing divide in the financial safety net
1.1mmore people would struggle
immediately if they had a financial shock
5%of the population think
a payday loan is the answer to a financial shock33
To undertake a money health check and receive helpful advice, visit the
new Lloyds Bank Money Health Check at:
https://www.lloydsbank.com/ help-guidance/
managing-your-money/moneyworries/
money-health-check-landing.asp
£Figure 45: Savings balances of those aged under 30. 2018 vs.
2017. Source 1
£144.5m
£159.1m+£14.6m
Key: 2017 2018 2018 vs. 2017
Those under 30 – savers are saving more than ever before While savings levels may not be the only factor driving this, the 1 million customer sample (source 1) shows that those who are already saving, are saving more. Since 2017 there has been a 10% increase in the value being saved annually by those aged under 30 (figure 45).
As explored on pages 47-49, with mental and financial health being linked, work by organisations such as Mental Health UK and the Money Advice Service is incredibly important to help alleviate the pressures placed by financial situations.
10%increase in the value of annual savings of the under 30 savers, in the past year
Ç
×
I

47
UK Financial Capability
39% of people have suffered from financial anxiety56% of people in the UK have reported that they are not anxious about their finances and are on top of their budget (figure 47). For many people, there have been times in the past where money worries have really affected them (31%), they have had financial stress and anxiety (16%), or worrying about money has affected their sleep (12%). Further analysis shows that 39% have agreed with all three of these statements34.
Women are more likely to report being impacted by financial anxietyComparing men’s and women’s attitudes, the the data in figure 46 shows that women have a greater likelihood to have experienced anxiety due to their financial situation.
The less financially capable are almost twice as likely to experience money worriesThose with low financial capability are almost twice as likely to say that their financial situation causes them stress and anxiety compared to those with high financial capability35.
Split by region, the data reveals that there are large regional differences. Less than half (45%) of Londoners report being on top of their budget compared to 64% of Scottish consumers, and 65% of people from Yorkshire & Humberside who say they feel in control of their finances (figure 47).
Further regional information can be found in our regional factsheets at www.lloydsbank.com/consumerdigitalindex
For more information, tools and resources, visit:
mentalhealthandmoneyadvice.org
MENTAL HEALTH AND FINANCIAL ADVICE
East England
52%South East
57%London
45%South West
56%North West
55%N. Ireland
33%
Scotland
64%East Midlands
58%North East
59%Wales
61%West Midlands
58%Yorkshire &
Humberside
65%
UK average Women Men
% difference men vs. women
Financial situation causes stress and anxiety 16% 18% 13% 36%
I’m not financially prepared for the future 19% 21% 17% 23%
Not anxious – on top of budget 56% 55% 58% -5%
Times in life when money worries have really affected me 31% 34% 29% 18%
Worrying about money often affects my sleep 12% 14% 11% 31%
Figure 46: Which of the following statements do you agree with? Split by gender. Source 3
Figure 47: Percentage of people who agree with the statement ‘I don’t feel anxious about money because I am on top of my budget’. Split by region. Source 3

48
UK Financial Capability Mental health and financial advice
For those without a bank account, financial anxiety is heightenedThe Toynbee Hall research shows that for 58% of the financially excluded, just thinking about money causes anxiety36 and 44% struggle to cope with their finances (figure 48). This is compared to 14% of the rest of the UK who are not in control of their finances37.
Low income pressures are a factor to consider for those without a bank account – almost all respondents have an annual income of less than £15,000 and 52% of interviewees take home less than £5,000 per year38.
By comparison, 54% of low income individuals with a bank account struggle to cope, and this reduces further to 36% when considering the total UK population39. This suggests that financial anxiety affects all, but is further amplified by the pressures of a low income.
Conversely, over half of those with low income and without a bank account either feel they cope very well with their money, or that some months are better than others (figure 48).
Research from the Prince’s Trust* shows that for 16-25 year olds, wellbeing has decreased since 2017; three out of five young people regularly feel stressed amid concerns over jobs and money, and one in four ‘feel hopeless’.
Building on the findings from page 26, digital banking can provide a range of benefits for younger people, 73% say that 24/7 access to internet banking helps reduce money worries 40.
While wellbeing has a number of different factors, for the younger people without a bank account, the benefits to mental wellbeing that digital banking may provide are unattainable. However, the Toynbee Hall research highlights that 11% of young financially excluded people are using alternative digital money management tools (11%)41.
*Youth Index 2018, Prince’s Trust
73%of young people say 24/7 access to online banking helps reduce
their financial anxiety
É
I struggle to cope with moneySome months are better than others
I cope very well with money
Key:
I struggle to cope with money I cope very well with money
44%
28%
28%
Ç
Figure 48: How well do you cope financially? Source 4
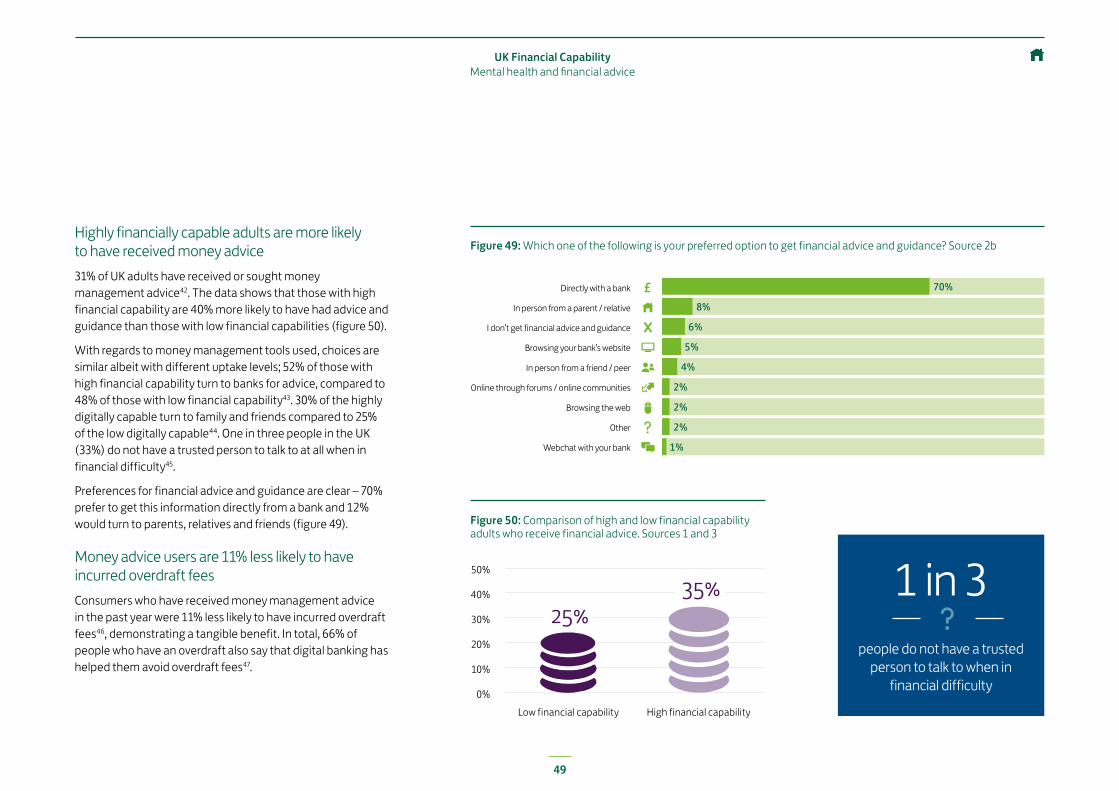
49
UK Financial Capability Mental health and financial advice
Highly financially capable adults are more likely to have received money advice31% of UK adults have received or sought money management advice42. The data shows that those with high financial capability are 40% more likely to have had advice and guidance than those with low financial capabilities (figure 50).
With regards to money management tools used, choices are similar albeit with different uptake levels; 52% of those with high financial capability turn to banks for advice, compared to 48% of those with low financial capability43. 30% of the highly digitally capable turn to family and friends compared to 25% of the low digitally capable44. One in three people in the UK (33%) do not have a trusted person to talk to at all when in financial difficulty45.
Preferences for financial advice and guidance are clear – 70% prefer to get this information directly from a bank and 12% would turn to parents, relatives and friends (figure 49).
Money advice users are 11% less likely to have incurred overdraft feesConsumers who have received money management advice in the past year were 11% less likely to have incurred overdraft fees46, demonstrating a tangible benefit. In total, 66% of people who have an overdraft also say that digital banking has helped them avoid overdraft fees47.
Figure 50: Comparison of high and low financial capability adults who receive financial advice. Sources 1 and 3
2%
2%
1%
2%
5%
4%
6%
8%
70%
50%
40%
30%
20%
10%
0%Low financial capability High financial capability
1 in 3people do not have a trusted
person to talk to when in financial difficulty
s
Figure 49: Which one of the following is your preferred option to get financial advice and guidance? Source 2b
Browsing the web
Other
Webchat with your bank
Online through forums / online communities
Browsing your bank’s website
In person from a friend / peer
I don’t get financial advice and guidance
In person from a parent / relative
Directly with a bank
25%35%

50
UK Financial Capability
The data shows that there is a real opportunity to help people with a registered disability with their financial capability:
• They are 28% more likely to be financially constrained than those without a registered disability48
• In the event of a financial shock, one-quarter (24%) would face immediate financial hardship compared to the 15% UK average49
Registered disabled people are 50% more likely to not feel in control of their financesPerhaps due to lower financial capability, as figure 51 shows, when asked how in control of their finances they feel, a greater proportion of registered disabled respondents reported not feeling in control.
Link between having a registered disability and financial anxietyOne in four registered disabled people feel stressed and anxious due to their financial situation (figure 52). Compared to individuals without a disability, there is a greater percentage of people reporting that they do not feel prepared for the future, and are more likely to have times in life where their money worries deeply affect them.
This may be because registered disabled people are twice as likely to be low-income earners compared with the rest of the UK50, and are less likely to be using tools that the data shows can mitigate some of this anxiety.
Without a registered disability Percentage difference with/without a disabilityWith a registered disabilityKey:
REGISTERED DISABLED PEOPLE HAVE LOWER FINANCIAL CAPABILITY
44%of people with a registered disability
use digital tools to manage their money, compared with 75%
of those without a disability51
£
+50% +8%
With a registered disability
Without a registered disability
% difference with disability
vs. without disability
Do not plan and deal with at the time 37% 31% 19%
Financial situation causes stress and anxiety 25% 15% 67%
I’m not financially prepared for the future 26% 19% 37%
Not anxious – on top of budget 55% 58% -5%
Times in life when money worries have really affected me 39% 31% 26%
Worrying about money often affects my sleep 19% 12% 58%
1 to 5 (not in control) 6 to 10 (in control)
Figure 51: On a scale of 1 to 10, how in control of your finances do you feel? Source 3
Figure 52: Percentage of those who agree to the following statements. Split by those with and without a registered disability. Source 3
21%
79%
14%
86%

51
* Financial Inclusion Annual Monitoring Report (2017): https://www.birmingham.ac.uk/Documents/ news/15518-CHASM-Report-Stage-4.pdf
50%
40%
30%
20%
10%
0%
Figure 53: Main barriers to having a bank account. 2018 vs. 2017. Source 4
Key: 2017 2018
41% of people without a bank account see identification challenges as a barrier 41% of people without a bank account either currently do not have the right ID to open one, or they do not feel like they have the right form of verification (i.e. banks only accept photographic identification).
In 2018, 1.5 million adults do not have access to a bank account;* 190,000 fewer than last year.
For the first time, there is year-on-year data outlining the main barriers to having a bank account. The main reason provided relates to not having valid identification (figure 53). For 16%, the costs of driving licences and passports are a key factor. The data also shows that 6% of individuals are seeking alternative solutions to traditional bank accounts.
Figure 53 shows that reasons for not having a bank account fall into two groups. One group is defined by respondents who are not motivated to obtain a bank account, stating that they ‘don’t need one’ and ‘they primarily use other services instead’. The other group is unable to obtain an account due to particular circumstances, such as being blocked by the issue of identification.
There are a number of reasons why people may not have the correct ID, they may have tried to open an account with the ID they have and been turned down, cannot afford the correct form of photo ID, or do not realise they already have sufficient verification.
NEW FOR 2018
41%
7%
3% 3% 3%
10%
15%
5% 6%
16%
8% 7% 6%3% 3% 2% 1%
I do not c
urrently
have the
correct fo
rm of ID
needed to
open a bank accountI d
o not like to
use banks because
I have had previous n
egative
experiences u
sing them
I am paid in
cash so I only
use cash
I’m barre
d from having an
accountI’m
overdrawn and my
account is in
operable
I cannot a
fford to
access the corre
ct form
of ID needed to
open a bank accountI p
rimarily
use other services in
stead
e.g. Credit U
nion and Post Offic
e accounts
I do not li
ke to use banks b
ecause I
know they are not fo
r me
Fraud
Credit score
I do not n
eed one
Worry of o
nline banking and
charges – no contro
lOverdraft f
ees are to
o high
PEOPLE WITHOUT A BANK ACCOUNT
UK Financial Capability
29%

52
UK Financial Capability Financially excluded population
Just over half (56%) of the financially excluded population have Basic Digital Skills* – they are 29% less likely to have all five skills compared with the UK averageWhile the data is not wholly comparable due to very different sample sizes, surveying the financially excluded respondents shows a clear gap between people without a bank account and the UK averages for Basic Digital Skills; the most significant of which being on ‘Transacting’ where the financially excluded are 25% less able (figure 54).
Although there are other ways to transact online and manage money, not having a bank account is a factor influencing this trend. The Toynbee Hall research also shows that only 6% of respondents are using non-bank alternatives, such as Credit Unions and the Post Office, to transact and manage money (figure 53).
Another factor appears to be confidence in mobile payments. Despite tools such as Pockit and the Change Account, 64% say that they would not feel comfortable making payments with their smartphones52. This suggests that even if they were aware of such opportunities, they may not have the confidence or skills to use them.
‘ I go online to search for a job and to use Facebook, Snapchat and Instagram. I think it’s all secure and I have passwords that people can’t guess. ’Shane, 21
‘ I’ve tried with the internet but it’s so complicated. I can email on my phone using free Wi-Fi. My kids have tried to show me how to use it, but my illness makes me forget things and I’m worried I’ll get my passwords wrong. ’Jane, 60
*Financially excluded Basic Digital Skills data was calculated based on responses to identical questions asked through a survey conducted by Toynbee Hall
Managing information85%
91%
Communicating76%
89%
Transacting87%
65%
Problem solving81%
67%
Creating74%
85%
Have Basic Digital Skills56%
79%
Figure 54: Basic Digital Skills. Those without bank accounts vs. the rest of the UK. Sources 2a and 4
Lighter colour shows financially excluded percentageDarker colour shows UK average percentage (not including financially excluded)
Key:

5353
“I was originally self-taught as I built up my digital skills, but then signed up for a ‘learn my way’ course at the local library to improve my knowledge. Since completing the course I feel much more confident and now use my online skills on a daily basis to manage my finances, go shopping and to help with my hobbies and interests. I now volunteer at the library to support new learners and the disadvantaged in the local community as I believe digital inclusion massively supports social inclusion as the library and courses bring residents together.David, 55, Newcastle upon Tyne, North East
”
Case study

54
“For us in HMRC, digital capability isn’t about being a technical expert, but rather about understanding what digital tools are available and how to get the most out of them. To help our people gain this understanding, we’ve used The Tech Partnership’s Basic Digital Skills framework in a number of areas in our organisation to help assess digital skills levels. We welcome the revised framework and its focus on the workplace, and plan to continue to use it as we invest in the digital skills of our people.Lily Lewis MBE, People Experience Programme, HMRC
”
“Digital transformation is not easy and the pressure of fast-changing technology and disruptive competition means that we rely heavily on data to help us make smart decisions at speed. At Digital Leaders, we recognise the value of analytical data and we welcome the Lloyds Bank Consumer Digital Index as a pathway to making progress on digital inclusion and skills for the country. Improving digital skills for all is crucial for the UK’s future prosperity, productivity and for society – it is heartening to see organisations such as Lloyds Banking Group working with partners to bridge the digital skills gap. Jacqueline de Rojas CBE, Chair of Digital Leaders and President of techUK
”
Lloyds Bank UK Consumer Digital Index 2018
“Everyone needs new skills to thrive in today’s digital world, whether at home or at work, and the Consumer Digital Index provides a very valuable insight into the current environment and the digital skills gaps that exist. We have been pleased to work with Lloyds Banking Group and our partners on the new Basic Digital Skills Framework launching May 2018, and have built on the current measure to identify the skills needed in life and at work. This is with the aim of driving action that will help; whether for an individual wanting to understand what skills to learn, or for a policy maker needing to decide on priorities for skills development. Working together, we can make a real difference to digital skills, to the benefit of individuals and to the nation. Karen Price OBE, Chief Executive, The Tech Partnership
”
“The commentary around ‘digital access does not guarantee digital adoption’ really struck a chord for Cisco, where real drivers for change come from adoption. At Cisco we build adoption practices to ensure our customers successes and we are very much looking forward to sharing this with Lloyds Banking Group to support the UK on helping to drive digital skills and awareness, but also crucially in adopting these skills for life. Amanda Price, SMB Digital Acceleration and Inclusion Lead, Cisco
”
Improving lives through digital
“We’re pleased to see that this year, over 470,000 people have moved up the scale, gaining at least one Basic Digital Skill, whereas they had none before. These people are amongst the hardest to reach, and will have the most to benefit from the skills they gain. With 11.3 million adults still lacking all five Basic Digital Skills, there is a hard task ahead, and one that will only get harder as those who are offline now are among the most excluded in our society. By focussing on continuing what works, working in partnership and co-ordinating effectively, I think we can make a huge impact not just on reducing this number, but on improving people’s lives.Helen Milner, Chief Executive, Good Things Foundation
”
“Although 99% of young people have access to the internet, there are hundreds of thousands of young people who are digitally excluded and have a lack of Basic Digital Skills. There’s an urgent need to embed these skills in activities outside traditional education, leveraging the expertise and relationships of trusted adults in youth organisations across the UK. That’s why our Money for Life financial education programme offers both online training and face-to-face masterclasses in local youth services – so it’s accessible for all young people.Patrick Shaw-Brown, Director of National Programmes, UK Youth
”

55
Lloyds Bank UK Consumer Digital Index 2018
In an increasingly digital world, Lloyds Banking Group is building its business and strategy with customer needs firmly at the centre. Responding to the changing pace of the digital landscape, we are working to build the bank of the future with colleagues, customers and communities in mind.
In order to truly understand customer needs and attitudes, the Capability and Inclusion team strive to use data for good. In partnership with academics, large corporates, social enterprises, charities and government agencies, we work to understand the UK’s digital capabilities so that we can partner with organisations and implement initiatives that will make a real difference.
In 2017 alone, working with our telephony and branch colleagues, we helped 700,000 people face to face. As part of our Helping Britain Prosper plan*, we will train a further 1.8 million individuals, small businesses and charities in digital skills by 2020.
We are always looking for partners who are as passionate about the agenda
and data-driven change, as we are. Please get in touch at:
* Lloyds Banking Group Helping Britain Prosper Plan: http://www.lloydsbankinggroup.com/Our-Group/responsible-business/prosper-plan/
ABOUT US
Underpins the Lloyds Banking Group Helping Britain Prosper plan to support digital capability across the UK
The insight informs financial wellbeing and digital skills programmes, including our Digital Workshops, helping
small businesses, charities and our network of 25,000 Digital Champions to support their local communities
Provides the insight that underpins the UK Government’s Digital Skills Partnership initiative with cross-sector partners
Used by corporates and practitioners to inform training provision – study has underpinned the Google Garage
proposition and informed HMRC’s colleague digital skills training
The Basic Digital Skills framework is shaping the Department for Education’s Digital Skills Entitlement policy, providing free
digital skills training for UK adults from 2020
¥
S
³
8
ă
THE INDEX REPORT
THE IMPACT
We speak to 2,700 consumers directly on the phone and data-match their behaviours with their attitudes
In total we speak to 9,000 consumers face to face or on the phone to understand how they feel and what they think
¹ 0
At Lloyds Banking Group we work with partners and policymakers to enhance the UK’s digital skills capability to Help Britain Prosper
Annual behavioural study of 1 million consumersÉ

Find out more
Join the conversation:
£ The full report and other content can be found online: www.lloydsbank.com/consumerdigitalindex
Join the conversation: #DigitalIndex18
y Please refer to our website for appendices, regional data and helpful links and resources
a Please get in touch at: [email protected]
Please contact us if you would like this information in an alternative format such as Braille, large print or audio.Great care has been taken to ensure that the information used here cannot be in any way traced to a specific individual. This report has used aggregated data across social and demographic groups to highlight the trends and insights that will help consumers, charities and UK Government to understand more about our nation’s digital and financial inclusion landscape.
Lloyds Banking Group includes companies using brands including Lloyds Bank, Halifax and Bank of Scotland and their associated companies. More information on the Lloyds Banking Group can be found at lloydsbankinggroup.com
Important informationWhilst Lloyds Bank has exercised reasonable care in preparing this document and any views or information expressed or presented are based on sources it believes to be accurate and reliable, no representation or warranty, expressed or implied, is made as to the accuracy, reliability or completeness of the information contained herein. This material has been prepared for information purposes only and Lloyds Bank, its directors, officers and employees are not responsible for any consequences arising from any reliance upon such information. Lloyds Bank plc Registered Office: 25 Gresham Street, London EC2V 7HN. Registered in England and Wales no. 2065. Telephone: 0207 626 1500.
Issue date: May 2018


