www.pwc.co.uk/economics UK Economic Outlook March 2017 Special features on: • Consumer spending prospects after Brexit • Will robots steal our jobs? The potential impact of automation on the UK and other major economies Visit our blog for periodic updates at: pwc.blogs.com/economics_in_business
Transcript
www.pwc.co.uk/economics
UK Economic Outlook
March 2017
Special features on:
• Consumer spending prospects after Brexit
• Will robots steal our jobs? The potential impact of automation on the UK and other major economies
Visit our blog for periodic updates at: pwc.blogs.com/economics_in_business
2 UK Economic Outlook March 2017
ContentsSection
1. Summary 4
2. UK economic prospects 8
• 2.1 Recent developments and the immediate impact of Brexit 9
• 2.2 Economic growth prospects after Brexit: national, sectoral and regional 11
• 2.3 Outlookforinflationandrealearningsgrowth 16
• 2.4 Monetaryandfiscalpolicyoptions 17
• 2.5 Summary and conclusions 17
3. Consumer spending prospects after Brexit 18
• Key points and introduction 18
• 3.1 Recent trends in household disposable income 19
• 3.2 Future trends in household disposable income 21
• 3.3 Household savings ratio: trends and projections 22
• 3.4 Alternative scenarios for consumer spending growth to 2030 23
• 3.5 Projected consumer spending growth by category 24
• 3.6 Potential impact of Brexit on key consumer-focused sectors 26
• 3.7 Summary and conclusions 29
4. Will robots steal our jobs? The potential impact of automation on the UK 30 and other major economies
• Key points and introduction 30
• 4.1 What proportion of jobs are potentially at high risk of automation? 32
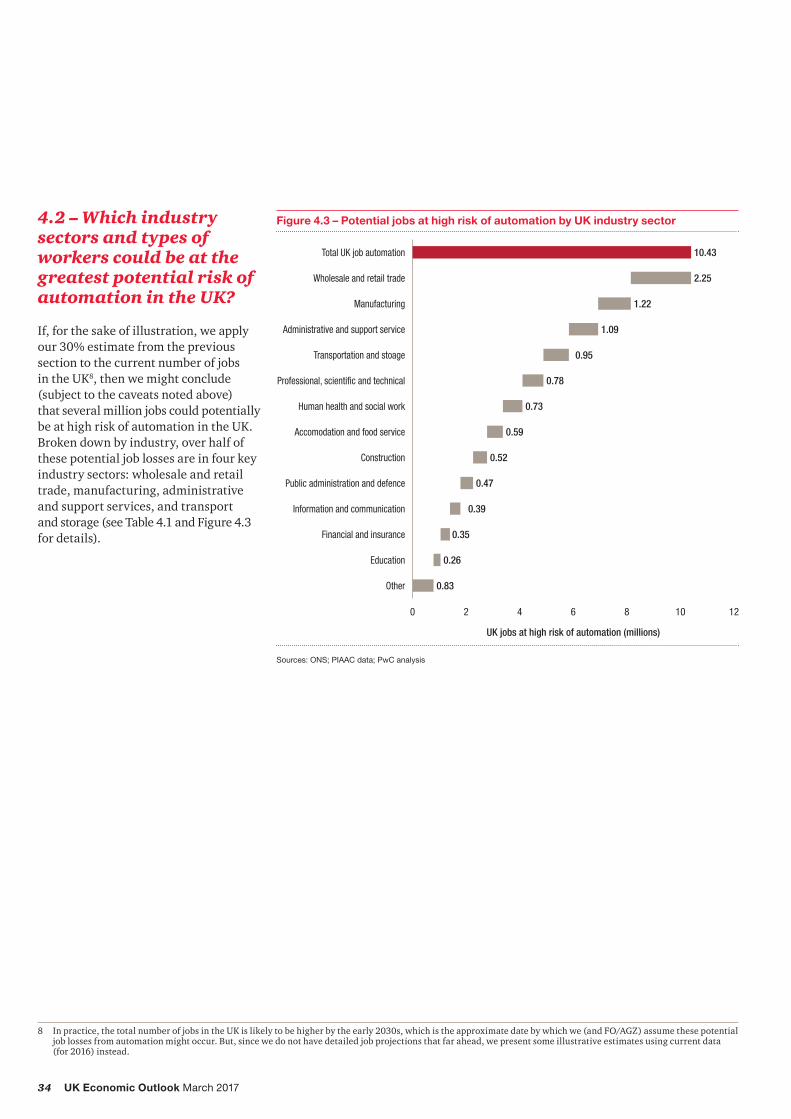
• 4.2 Which industry sectors and types of workers could be at the greatest 34 potential risk of automation in the UK?
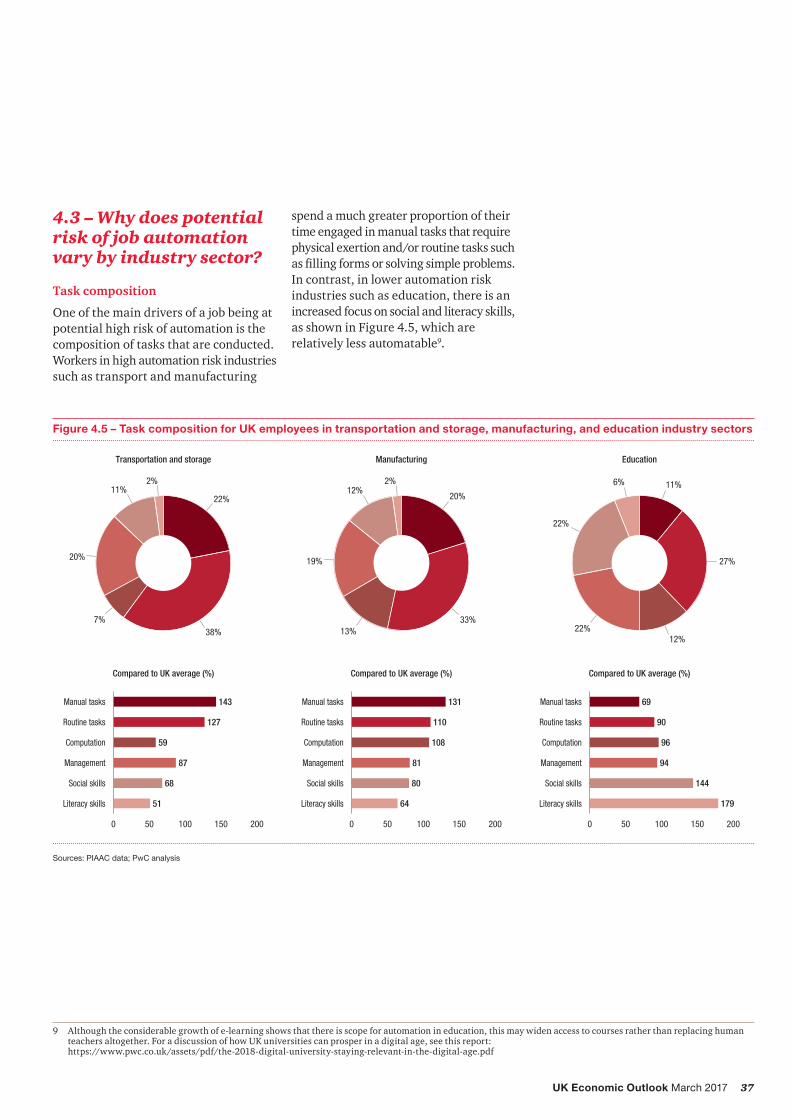
• 4.3 Why does the potential risk of automation vary by industry sector? 37
• 4.4 How does the UK compare to other major economies? 39
• 4.5 What economic, legal and regulatory constraints might restrict automation 43 in practice?
• 4.6 What offsetting job and income gains might automation generate? 44
• 4.7 What implications might these trends have for public policy? 44
• 4.8 Summary and conclusions 45
• Annex – Technical details of our methodology and references 46
Appendices
A Outlook for the global economy 48
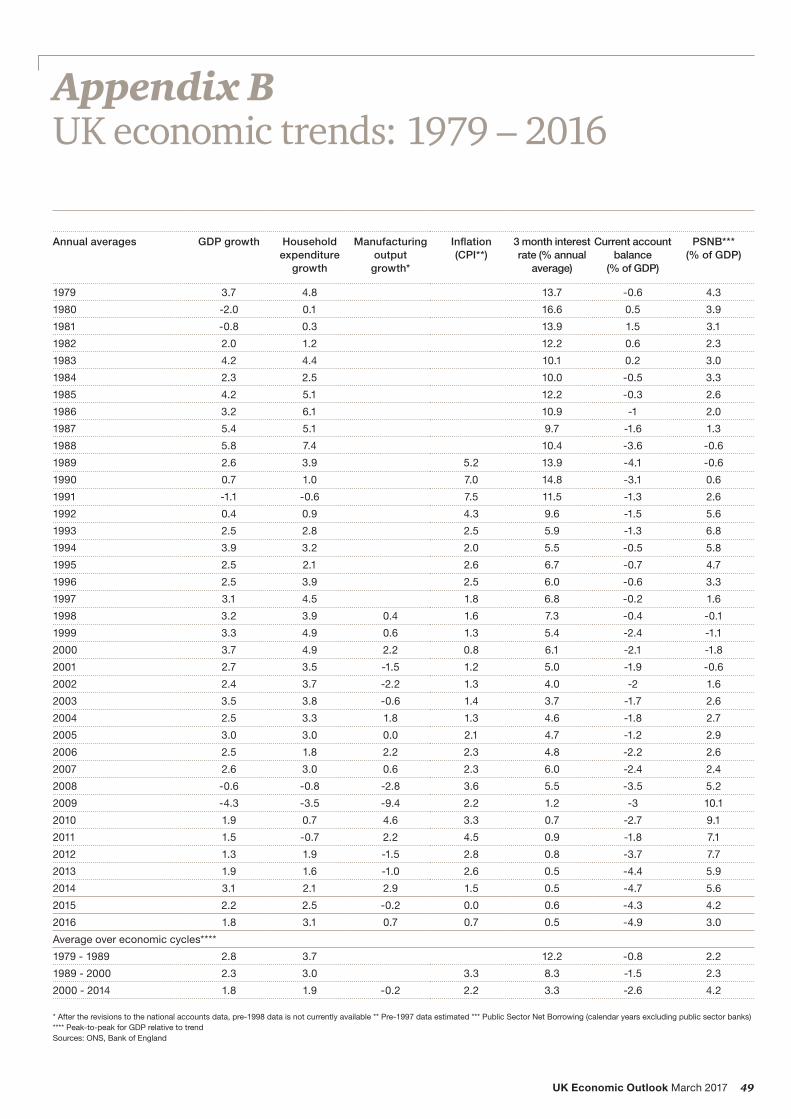
B UK economic trends: 1979-2016 49
Contacts and services 50
3UK Economic Outlook March 2017
Highlights and key messages for business and public policy
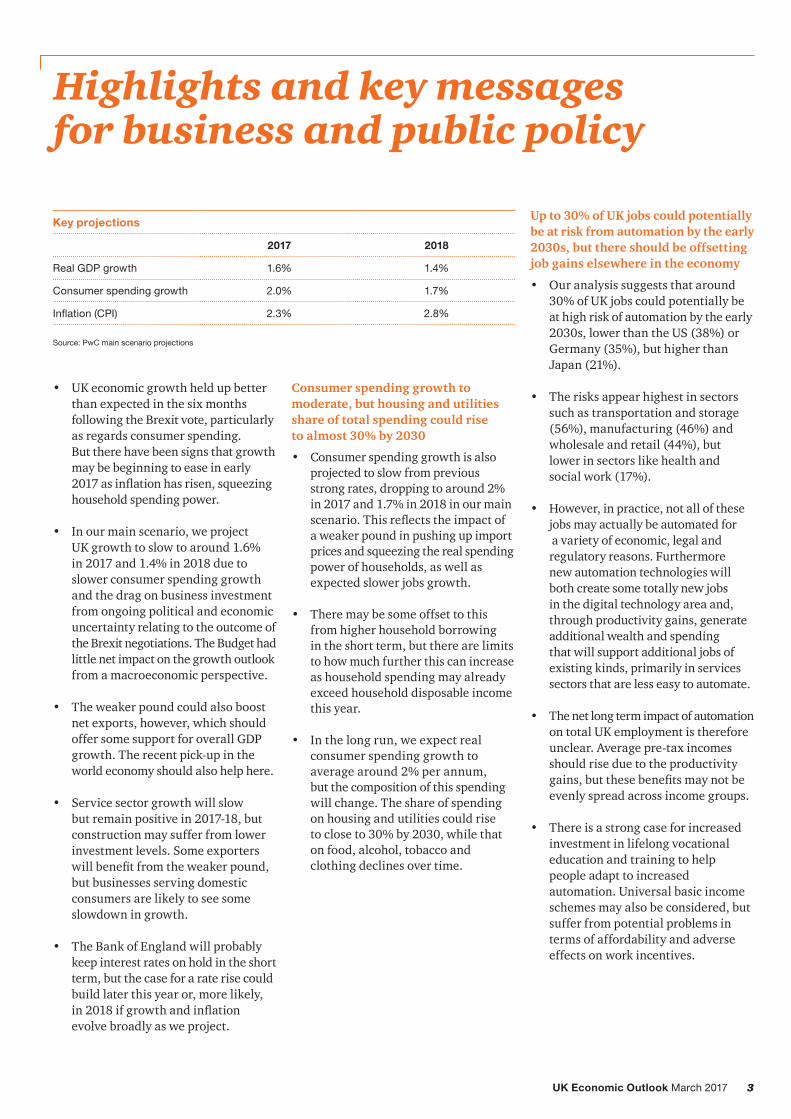
• UK economic growth held up better than expected in the six months following the Brexit vote, particularly as regards consumer spending. But there have been signs that growth may be beginning to ease in early 2017asinflationhasrisen,squeezinghousehold spending power.
• In our main scenario, we project UK growth to slow to around 1.6% in 2017 and 1.4% in 2018 due to slower consumer spending growth and the drag on business investment from ongoing political and economic uncertainty relating to the outcome of the Brexit negotiations. The Budget had little net impact on the growth outlook from a macroeconomic perspective.
• The weaker pound could also boost net exports, however, which should offer some support for overall GDP growth. The recent pick-up in the world economy should also help here.
• Service sector growth will slow but remain positive in 2017-18, but construction may suffer from lower investment levels. Some exporters willbenefitfromtheweakerpound,but businesses serving domestic consumers are likely to see some slowdown in growth.
• The Bank of England will probably keep interest rates on hold in the short term, but the case for a rate rise could build later this year or, more likely, in2018ifgrowthandinflationevolve broadly as we project.
Consumer spending growth to moderate, but housing and utilities share of total spending could rise to almost 30% by 2030
• Consumer spending growth is also projected to slow from previous strong rates, dropping to around 2% in 2017 and 1.7% in 2018 in our main scenario.Thisreflectstheimpactof a weaker pound in pushing up import pricesandsqueezingtherealspendingpower of households, as well as expected slower jobs growth.
• There may be some offset to this from higher household borrowing in the short term, but there are limits to how much further this can increase as household spending may already exceed household disposable income this year.
• In the long run, we expect real consumer spending growth to average around 2% per annum, but the composition of this spending will change. The share of spending on housing and utilities could rise to close to 30% by 2030, while that on food, alcohol, tobacco and clothing declines over time.
Up to 30% of UK jobs could potentially be at risk from automation by the early 2030s, but there should be offsetting job gains elsewhere in the economy
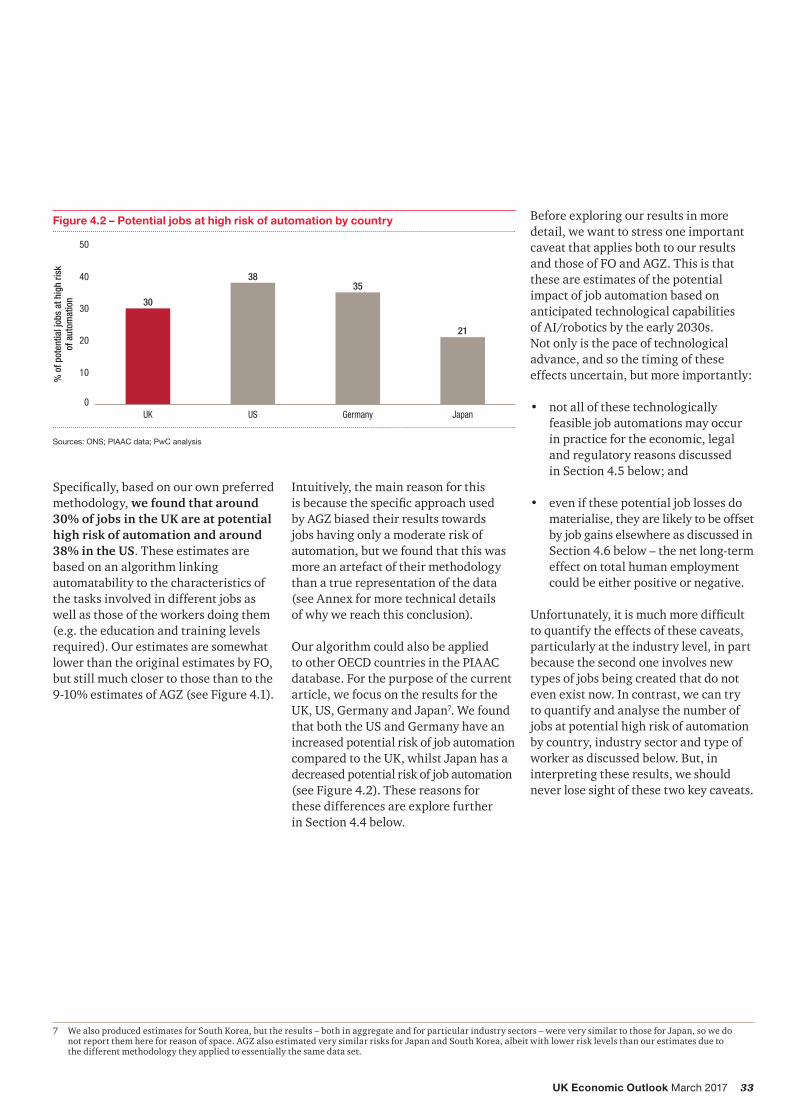
• Our analysis suggests that around 30% of UK jobs could potentially be at high risk of automation by the early 2030s, lower than the US (38%) or Germany (35%), but higher than Japan (21%).
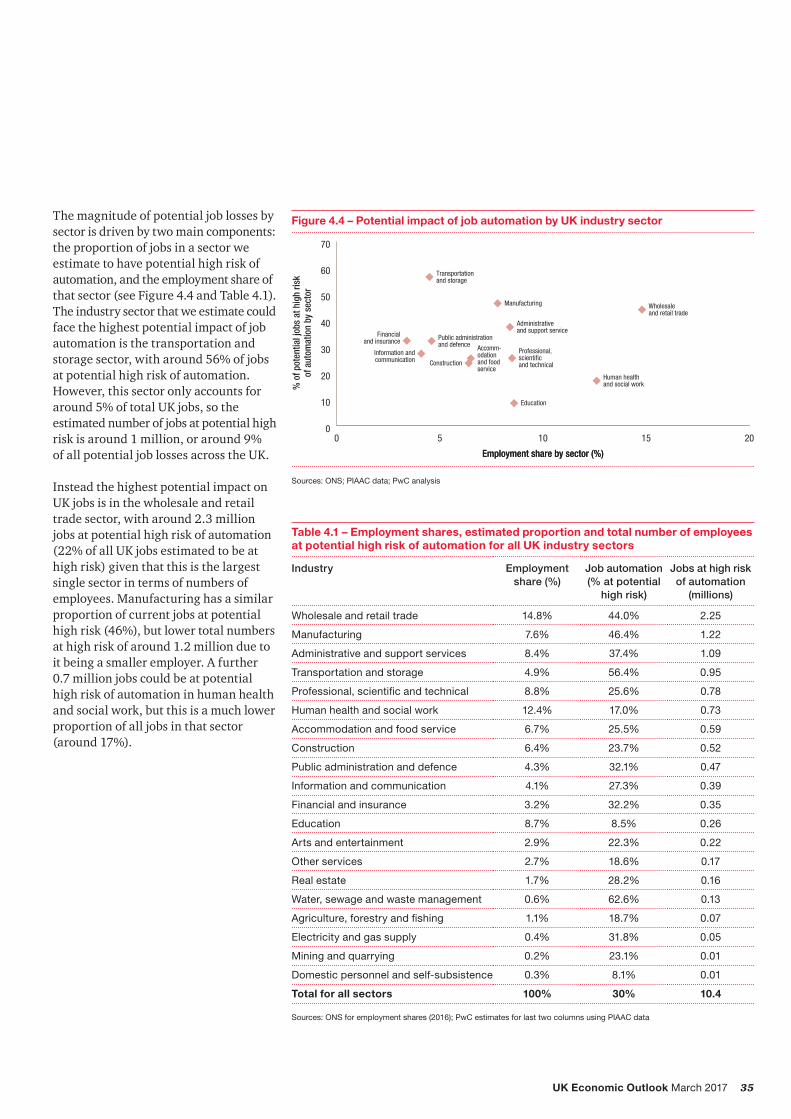
• The risks appear highest in sectors such as transportation and storage (56%), manufacturing (46%) and wholesale and retail (44%), but lower in sectors like health and social work (17%).
• However, in practice, not all of these jobs may actually be automated for a variety of economic, legal and regulatory reasons. Furthermore new automation technologies will both create some totally new jobs in the digital technology area and, through productivity gains, generate additional wealth and spending that will support additional jobs of existing kinds, primarily in services sectors that are less easy to automate.
• The net long term impact of automation on total UK employment is therefore unclear. Average pre-tax incomes should rise due to the productivity gains,butthesebenefitsmaynotbeevenly spread across income groups.
• There is a strong case for increased investment in lifelong vocational education and training to help people adapt to increased automation. Universal basic income schemes may also be considered, but suffer from potential problems in terms of affordability and adverse effects on work incentives.
3
Key projections
2017 2018
Real GDP growth 1.6% 1.4%
Consumer spending growth 2.0% 1.7%
Inflation (CPI) 2.3% 2.8%
Source: PwC main scenario projections
4 UK Economic Outlook March 2017
1 – Summary
Recent developmentsThe UK economy held up well in the six months after the EU referendum, particularly as regards consumer spending. Growth was close to trend at2%intheyeartothefourthquarter of 2016.
UK growth continues to be driven by services, with manufacturing and construction seeing more volatile trends through the last year. There have, however, been signs from both retail sales data and business surveys that the resilience of consumer spending and services has started to falter in early 2017.
A key factor behind this recent moderation in retail spending has been an increase the rateofconsumerpriceinflation(CPI)fromaroundzeroonaveragein2015to2.3%in the year to February 2017, as global commodity prices have picked up from lows in early 2016 and the effects of the weak pound after the Brexit vote have fed through supply chains.
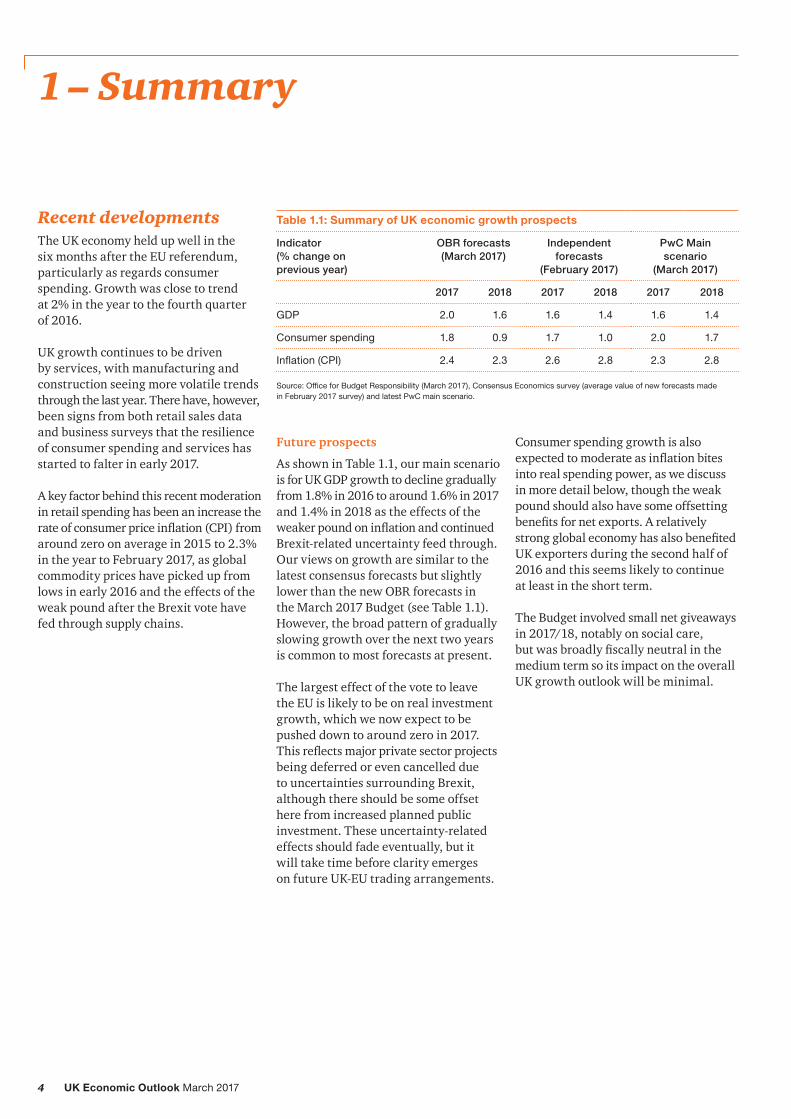
Table 1.1: Summary of UK economic growth prospects
Indicator (% change on previous year)
OBR forecasts (March 2017)
Independent forecasts
(February 2017)
PwC Main scenario
(March 2017)
2017 2018 2017 2018 2017 2018
GDP 2.0 1.6 1.6 1.4 1.6 1.4
Consumer spending 1.8 0.9 1.7 1.0 2.0 1.7
Inflation (CPI) 2.4 2.3 2.6 2.8 2.3 2.8
Source: Office for Budget Responsibility (March 2017), Consensus Economics survey (average value of new forecasts made in February 2017 survey) and latest PwC main scenario.
Future prospects
As shown in Table 1.1, our main scenario is for UK GDP growth to decline gradually from 1.8% in 2016 to around 1.6% in 2017 and 1.4% in 2018 as the effects of the weakerpoundoninflationandcontinuedBrexit-related uncertainty feed through. Our views on growth are similar to the latest consensus forecasts but slightly lower than the new OBR forecasts in the March 2017 Budget (see Table 1.1). However, the broad pattern of gradually slowing growth over the next two years is common to most forecasts at present.
The largest effect of the vote to leave the EU is likely to be on real investment growth, which we now expect to be pusheddowntoaroundzeroin2017.Thisreflectsmajorprivatesectorprojectsbeing deferred or even cancelled due to uncertainties surrounding Brexit, although there should be some offset here from increased planned public investment. These uncertainty-related effects should fade eventually, but it will take time before clarity emerges on future UK-EU trading arrangements.
Consumer spending growth is also expectedtomoderateasinflationbitesinto real spending power, as we discuss in more detail below, though the weak pound should also have some offsetting benefitsfornetexports.ArelativelystrongglobaleconomyhasalsobenefitedUK exporters during the second half of 2016 and this seems likely to continue at least in the short term.
The Budget involved small net giveaways in 2017/18, notably on social care, butwasbroadlyfiscallyneutralinthemedium term so its impact on the overall UK growth outlook will be minimal.
5UK Economic Outlook March 2017
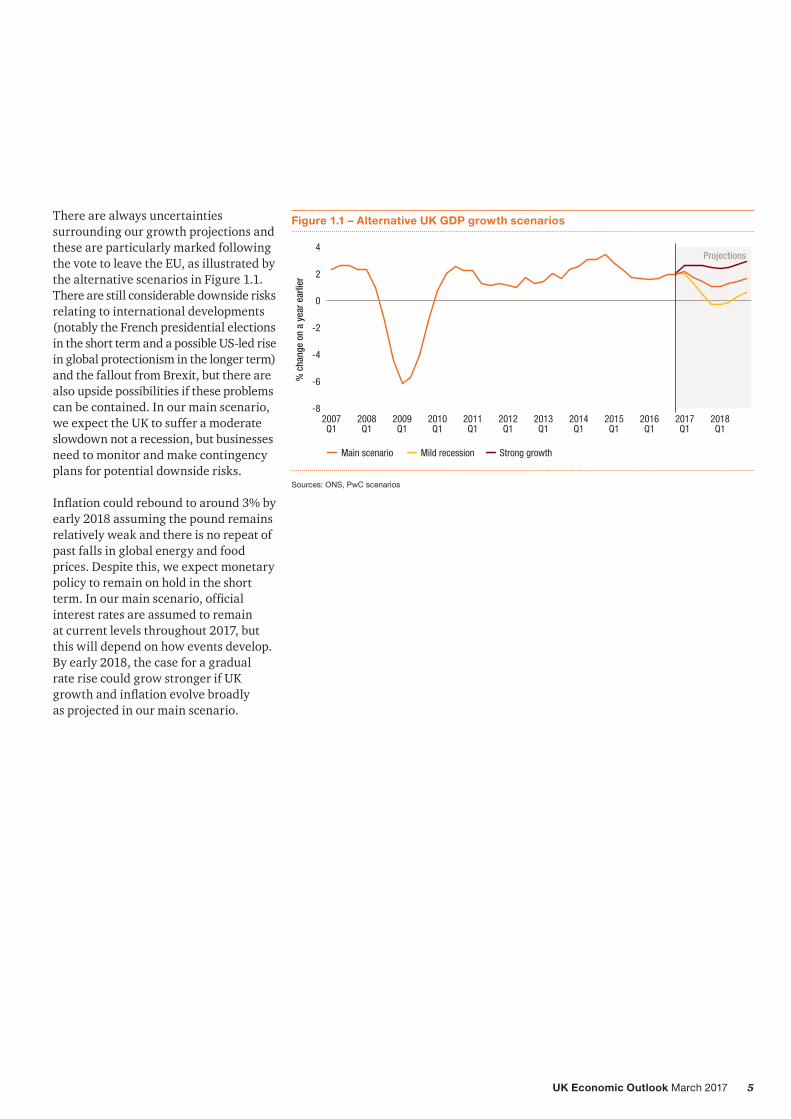
There are always uncertainties surrounding our growth projections and these are particularly marked following the vote to leave the EU, as illustrated by the alternative scenarios in Figure 1.1. There are still considerable downside risks relating to international developments (notably the French presidential elections in the short term and a possible US-led rise in global protectionism in the longer term) and the fallout from Brexit, but there are also upside possibilities if these problems can be contained. In our main scenario, we expect the UK to suffer a moderate slowdown not a recession, but businesses need to monitor and make contingency plans for potential downside risks.
Inflationcouldreboundtoaround3%byearly 2018 assuming the pound remains relatively weak and there is no repeat of past falls in global energy and food prices. Despite this, we expect monetary policy to remain on hold in the short term.Inourmainscenario,officialinterest rates are assumed to remain at current levels throughout 2017, but this will depend on how events develop. By early 2018, the case for a gradual rate rise could grow stronger if UK growthandinflationevolvebroadly as projected in our main scenario.
Figure 1.1 – Alternative UK GDP growth scenarios
-8
-6
-4
-2
0
2
4
2018Q1
2017Q1
2016Q1
2015Q1
2014Q1
2013Q1
2012Q1
2011Q1
2010Q1
2009Q1
2008Q1
2007Q1
Projections
% c
hang
e on
a y
ear e
arlie
r
Main scenario Mild recession Strong growth
Sources: ONS, PwC scenarios
6 UK Economic Outlook March 2017
Consumer spending prospects after Brexit
Consumer spending has grown by an average of 2.4% per annum faster than inflationoverthepastfouryears,drivingthe overall UK economic recovery both before and after the Brexit vote.
As we discuss in detail in Section 3 of this report,thisreflectsrisingemploymentlevels, continued historically low interest rates, and a declining household savings ratio driven by higher borrowing and a strong housing market.
Looking ahead, we expect real household income growth to slow in 2017-18 as risinginflationsqueezeshouseholdspending power and employment growth softens. Increased borrowing may help fillthegap,buttherearelimitstohow far this can go on a sustainable basis.
As a result, in our main scenario we expect real consumer spending growth to moderate from around 3% in 2016 to around 2% in 2017 and 1.7% in 2018, although it could then pick up again to around 2% in 2020 and beyond assuming the Brexit negotiations go reasonably smoothly.
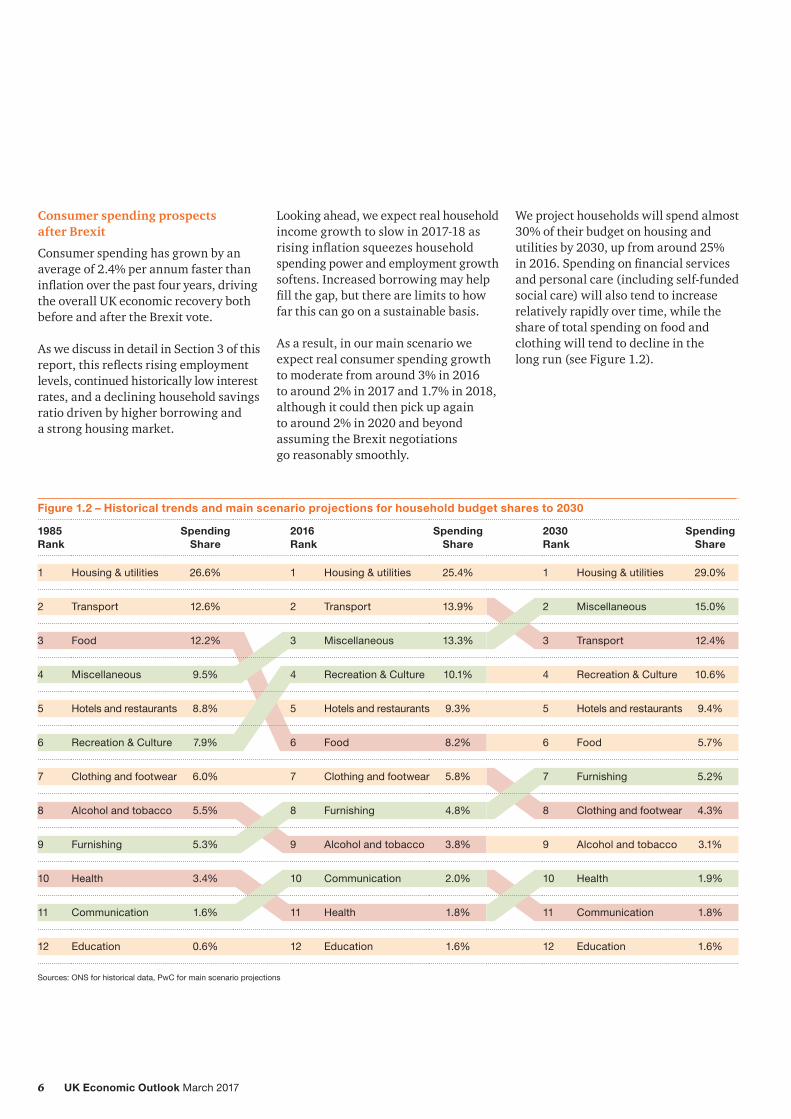
We project households will spend almost 30% of their budget on housing and utilities by 2030, up from around 25% in2016.Spendingonfinancialservicesand personal care (including self-funded social care) will also tend to increase relatively rapidly over time, while the share of total spending on food and clothing will tend to decline in the long run (see Figure 1.2).
Figure 1.2 – Historical trends and main scenario projections for household budget shares to 2030
Sources: ONS for historical data, PwC for main scenario projections
7UK Economic Outlook March 2017
The impact of Brexit on the consumer will vary by category of spending. Our analysis shows that the food and clothing sectors are most exposed to the fall in the value of sterling since the Brexit vote due to a high reliance on imports. The hotel, restaurant, manufacturing and agricultural sectors are also heavily reliant on EU labour and so could be subject to disruption in the longer term if migration from the EUissignificantlyreducedafterBrexit.Businesses need to prepare for these and other aspects of Brexit and make appropriate contingency plans.
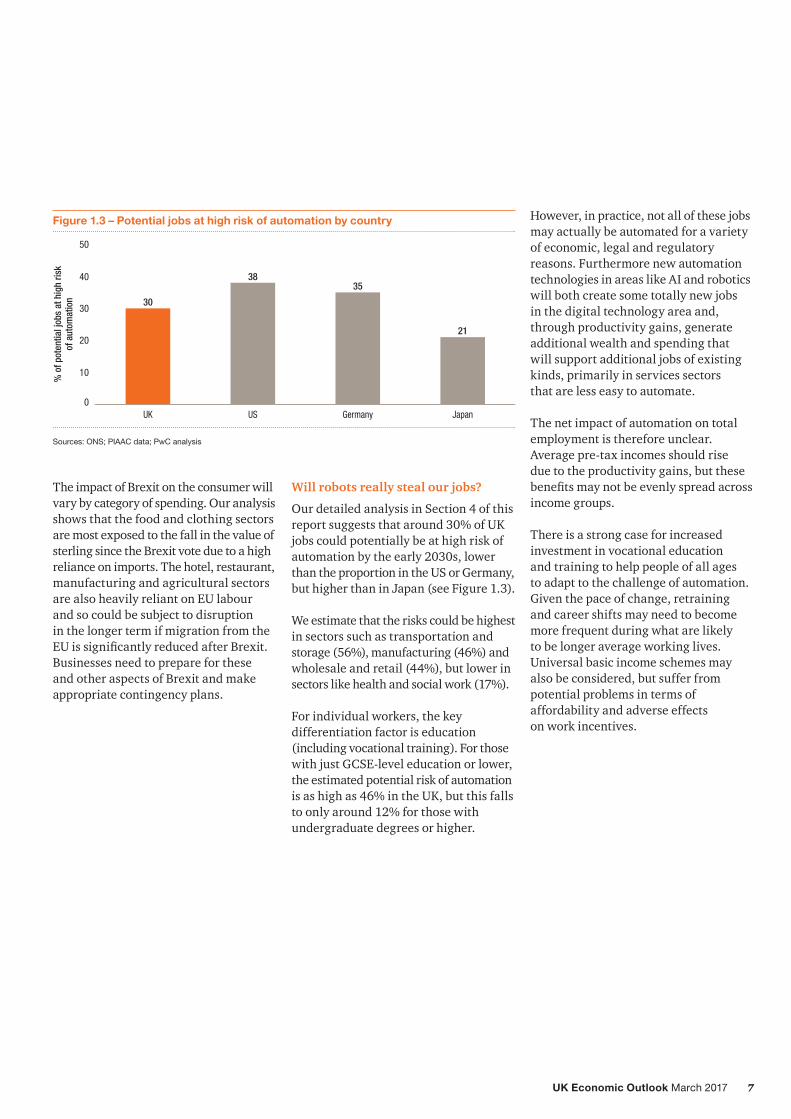
Figure 1.3 – Potential jobs at high risk of automation by country
0
10
20
30
40
50
JapanGermanyUSUK
% o
f pot
entia
l job
s at
hig
h ris
kof
aut
omat
ion 30
3835
21
Sources: ONS; PIAAC data; PwC analysis
Will robots really steal our jobs?
Our detailed analysis in Section 4 of this report suggests that around 30% of UK jobs could potentially be at high risk of automation by the early 2030s, lower than the proportion in the US or Germany, but higher than in Japan (see Figure 1.3).
We estimate that the risks could be highest in sectors such as transportation and storage (56%), manufacturing (46%) and wholesale and retail (44%), but lower in sectors like health and social work (17%).
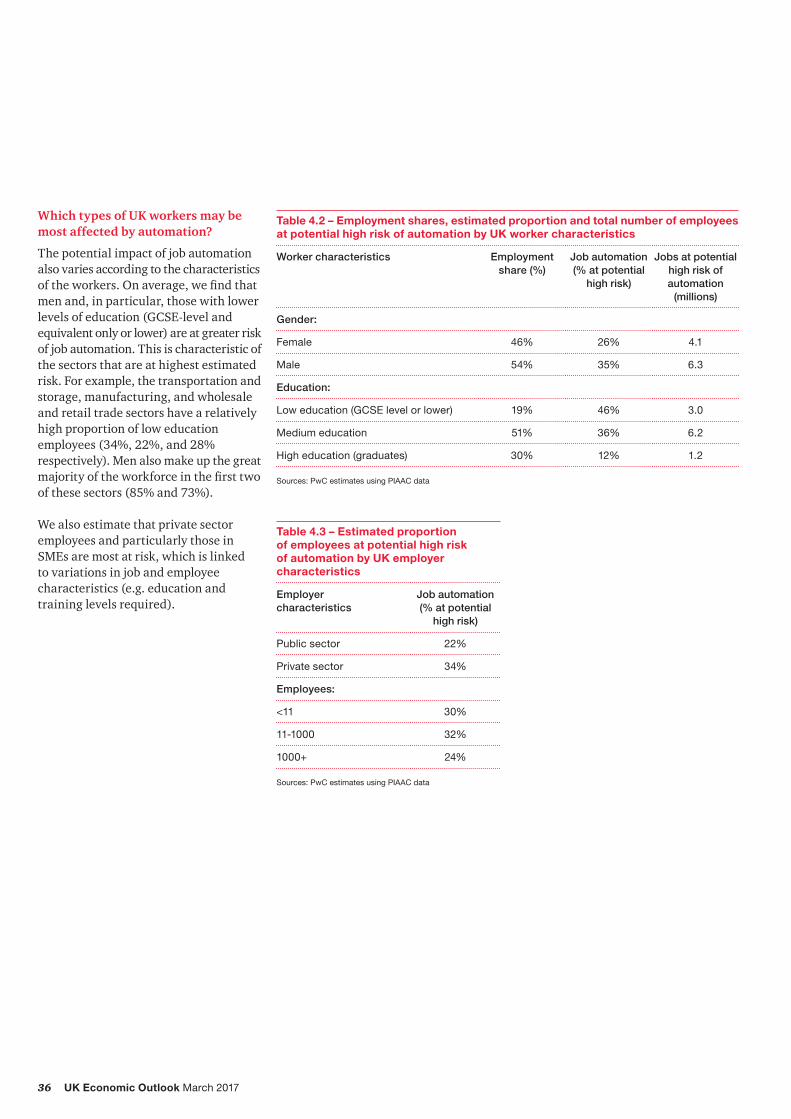
For individual workers, the key differentiation factor is education (including vocational training). For those with just GCSE-level education or lower, the estimated potential risk of automation is as high as 46% in the UK, but this falls to only around 12% for those with undergraduate degrees or higher.
However, in practice, not all of these jobs may actually be automated for a variety of economic, legal and regulatory reasons. Furthermore new automation technologies in areas like AI and robotics will both create some totally new jobs in the digital technology area and, through productivity gains, generate additional wealth and spending that will support additional jobs of existing kinds, primarily in services sectors that are less easy to automate.
The net impact of automation on total employment is therefore unclear. Average pre-tax incomes should rise due to the productivity gains, but these benefitsmaynotbeevenlyspreadacrossincome groups.
There is a strong case for increased investment in vocational education and training to help people of all ages to adapt to the challenge of automation. Given the pace of change, retraining and career shifts may need to become morefrequentduringwhatarelikely to be longer average working lives. Universal basic income schemes may also be considered, but suffer from potential problems in terms of affordability and adverse effects on work incentives.
8 UK Economic Outlook March 2017
2 – UK economic prospects
Key points• UK economic growth remained
relatively strong at around 2% in the year to Q4 2016, with no immediate deceleration after the ‘Brexit’ vote.
• In our main scenario, we now project UK growth to slow from 1.8% in 2016 to around 1.6% in 2017 and 1.4% in 2018. The UK would avoid recession in this scenario, although risks to growth are still weighted somewhat to the downside given the uncertainties surrounding the Brexit negotiation process. Businesses need to make contingency plans for alternative outcomes to this process.
• Consumer spending growth is projected to slow from previous strong rates, dropping from 3% in 2016 to only around 2% in 2017 and 1.7% in 2018 in our main scenario. Thisreflectsasqueezeonhouseholdspendingpowerfromhigherinflationas well as slower jobs growth.
• We also expect business investment growth to remain relatively subdued in 2017-18 due to uncertainty about the UK’s future trading relationships with the EU and other geopolitical uncertainties.
• The weaker pound should boost net exports, however, together with the gradual strengthening of the world economy we have seen over the past year.
• We expect growth in the services sector to slow but remain positive in 2016-17. The construction sector will suffer the most from lower investment levels, but some manufacturing exporterswillbenefitfromtheweaker pound.
• We project that London will remain the fastest growing region, but its pace of expansion could slow from around 2.5% in 2015 to an average of just under 2% in 2017-18. Other regions are projected to see average growth in 2017-18 of around 1-1.5%, and we do not predict negative growth in any region in either 2017 or 2018 in our main scenario.
• The Bank of England is likely to keep monetary policy on hold in the short term, but rate rises could come back on to the agenda next year in our main scenario.
• The Budget saw small net giveaways in 2017/18, but the overall stance of fiscalpolicywillcontinuetotightengradually over the following years based on previously announced tax and spending plans.
IntroductionIn this section of the report we describe recent developments in the UK economy and review future prospects. The discussion covers:
Section 2.1 Recent developments and the initial impact of Brexit
Section 2.2 Economic growth prospects after Brexit: national, sectoral and regional
Figure 2.2 – Purchasing Managers’ Indices of business activity
30
35
40
45
50
55
60
65
2017Jan
2016Jan
2015Jan
2014Jan
2013Jan
2012Jan
2011Jan
2010Jan
2009Jan
2008Jan
2007Jan
Services Manufacturing
Services
Manufacturing
Above 50 indicates rising activity levels
Downward blipafter Brexit vote
Sources: Markit/CIPS
2.1 – Recent developments and the immediate impact of Brexit
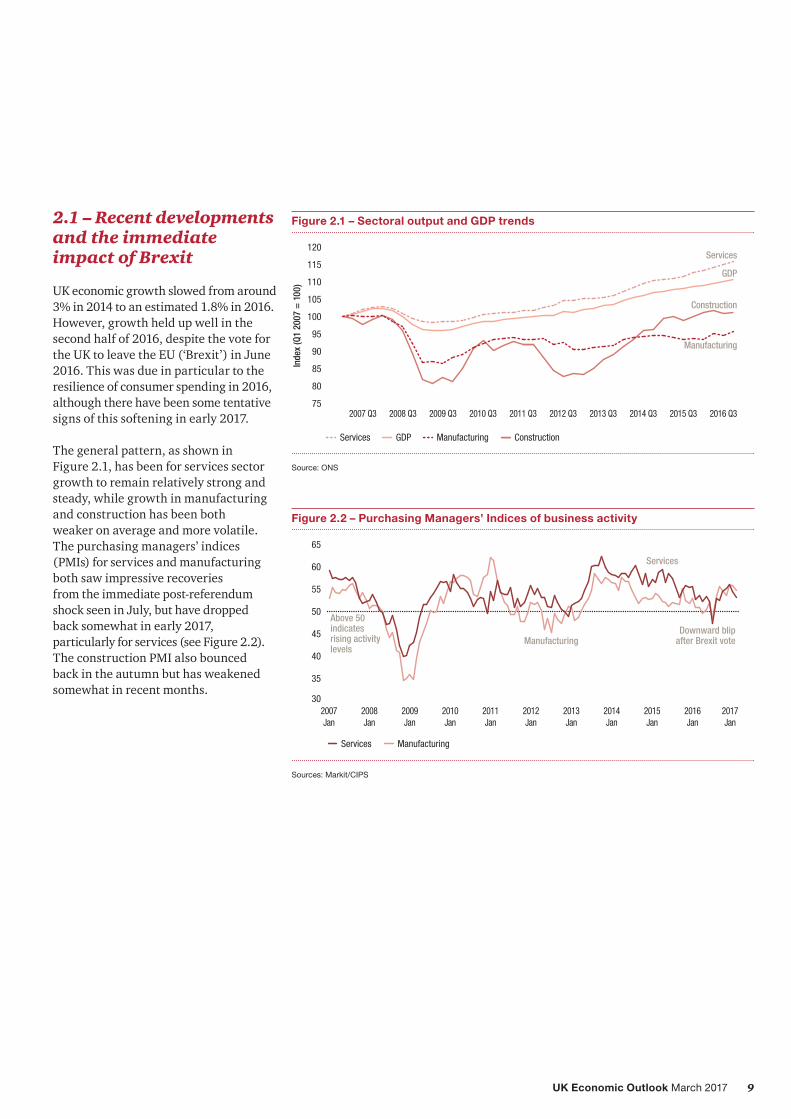
UK economic growth slowed from around 3% in 2014 to an estimated 1.8% in 2016. However, growth held up well in the second half of 2016, despite the vote for the UK to leave the EU (‘Brexit’) in June 2016. This was due in particular to the resilience of consumer spending in 2016, although there have been some tentative signs of this softening in early 2017.
The general pattern, as shown in Figure 2.1, has been for services sector growth to remain relatively strong and steady, while growth in manufacturing and construction has been both weaker on average and more volatile. The purchasing managers’ indices (PMIs) for services and manufacturing both saw impressive recoveries from the immediate post-referendum shock seen in July, but have dropped back somewhat in early 2017, particularly for services (see Figure 2.2). The construction PMI also bounced back in the autumn but has weakened somewhat in recent months.
Figure 2.3 – Consumer confidence: net balance expecting rising household disposable income over next 12 months
Balance of opinion
-60%
-50%
-40%
-30%
-20%
-10%
0%
10%
Sep16
Mar16
Nov15
Apr15
Nov14
Jan14
May13
Sept12
Dec11
May11
Dec10
Jul10
Jan10
May09
Nov08
Aug08
Apr08
Sources: PwC Consumer Survey
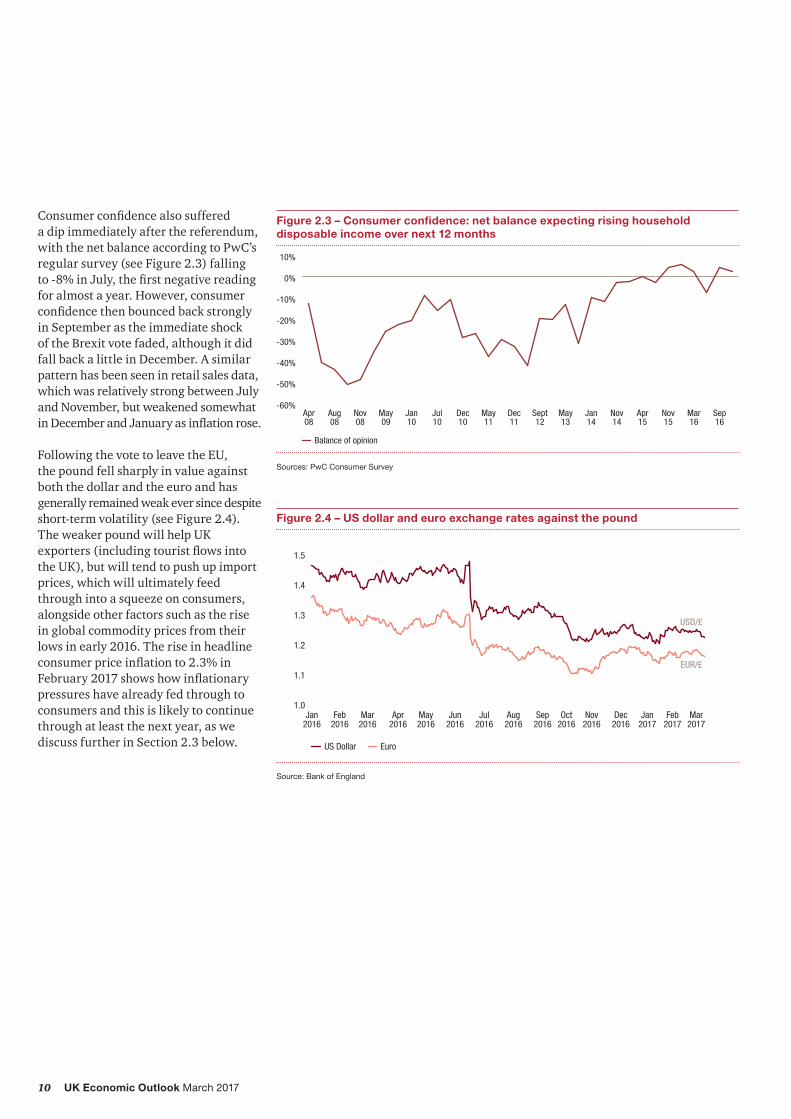
Consumerconfidencealsosuffered a dip immediately after the referendum, with the net balance according to PwC’s regular survey (see Figure 2.3) falling to-8%inJuly,thefirstnegativereadingfor almost a year. However, consumer confidencethenbouncedbackstronglyin September as the immediate shock of the Brexit vote faded, although it did fall back a little in December. A similar pattern has been seen in retail sales data, which was relatively strong between July and November, but weakened somewhat inDecemberandJanuaryasinflationrose.
Following the vote to leave the EU, the pound fell sharply in value against both the dollar and the euro and has generally remained weak ever since despite short-term volatility (see Figure 2.4). The weaker pound will help UK exporters(includingtouristflowsintothe UK), but will tend to push up import prices, which will ultimately feed throughintoasqueezeonconsumers,alongside other factors such as the rise in global commodity prices from their lows in early 2016. The rise in headline consumerpriceinflationto2.3%inFebruary2017showshowinflationarypressures have already fed through to consumers and this is likely to continue through at least the next year, as we discuss further in Section 2.3 below.
Figure 2.4 – US dollar and euro exchange rates against the pound
1.0
1.1
1.2
1.3
1.4
1.5
Mar2017
Feb2017
Jan2017
Dec2016
Nov2016
Oct2016
Sep2016
Aug2016
Jul2016
Jun2016
May2016
Apr2016
Mar2016
Feb2016
Jan2016
US Dollar Euro
EUR/£
USD/£
Source: Bank of England
11UK Economic Outlook March 2017
Table 2.1: PwC main scenario for UK growth and inflation
% real annual growth unless otherwise stated
2016 2017 2018
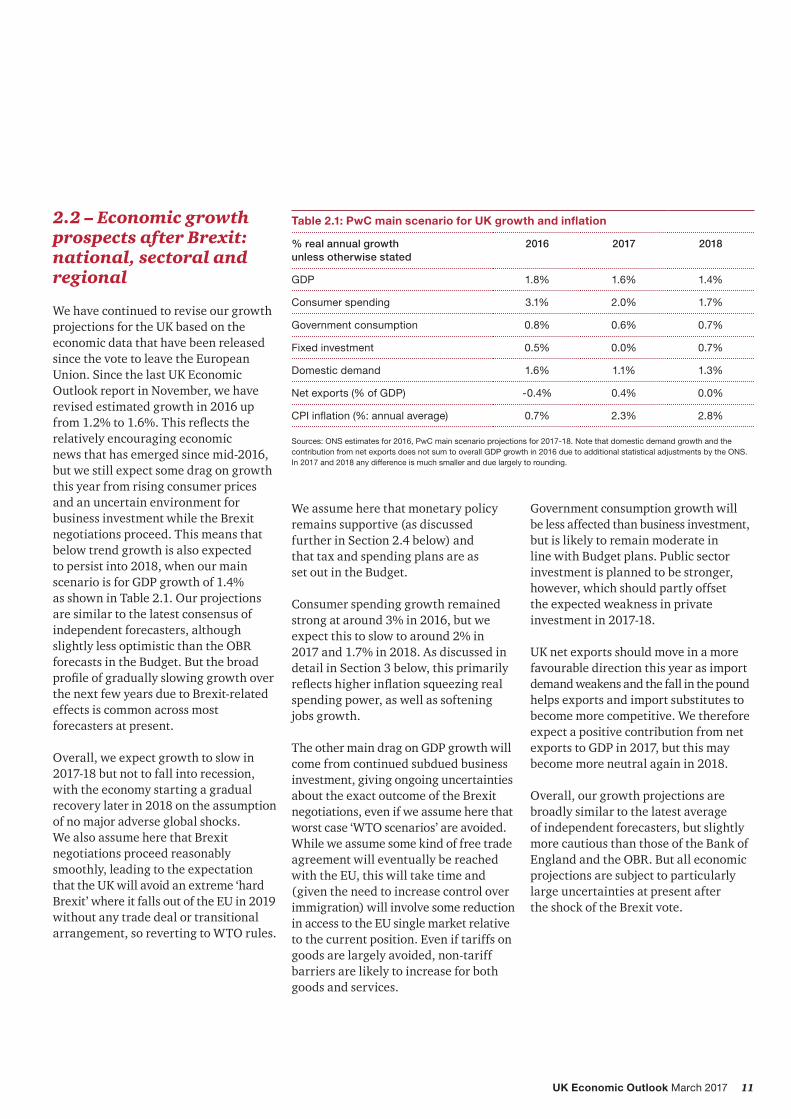
GDP 1.8% 1.6% 1.4%
Consumer spending 3.1% 2.0% 1.7%
Government consumption 0.8% 0.6% 0.7%
Fixed investment 0.5% 0.0% 0.7%
Domestic demand 1.6% 1.1% 1.3%
Net exports (% of GDP) -0.4% 0.4% 0.0%
CPI inflation (%: annual average) 0.7% 2.3% 2.8%
Sources: ONS estimates for 2016, PwC main scenario projections for 2017-18. Note that domestic demand growth and the contribution from net exports does not sum to overall GDP growth in 2016 due to additional statistical adjustments by the ONS. In 2017 and 2018 any difference is much smaller and due largely to rounding.
2.2 – Economic growth prospects after Brexit: national, sectoral and regional
We have continued to revise our growth projections for the UK based on the economic data that have been released since the vote to leave the European Union. Since the last UK Economic Outlook report in November, we have revised estimated growth in 2016 up from1.2%to1.6%.Thisreflectstherelatively encouraging economic news that has emerged since mid-2016, but we still expect some drag on growth this year from rising consumer prices and an uncertain environment for business investment while the Brexit negotiations proceed. This means that below trend growth is also expected to persist into 2018, when our main scenario is for GDP growth of 1.4% as shown in Table 2.1. Our projections are similar to the latest consensus of independent forecasters, although slightly less optimistic than the OBR forecasts in the Budget. But the broad profileofgraduallyslowinggrowthoverthe next few years due to Brexit-related effects is common across most forecasters at present.
Overall, we expect growth to slow in 2017-18 but not to fall into recession, with the economy starting a gradual recovery later in 2018 on the assumption of no major adverse global shocks. We also assume here that Brexit negotiations proceed reasonably smoothly, leading to the expectation that the UK will avoid an extreme ‘hard Brexit’ where it falls out of the EU in 2019 without any trade deal or transitional arrangement, so reverting to WTO rules.
We assume here that monetary policy remains supportive (as discussed further in Section 2.4 below) and that tax and spending plans are as set out in the Budget.
Consumer spending growth remained strong at around 3% in 2016, but we expect this to slow to around 2% in 2017 and 1.7% in 2018. As discussed in detail in Section 3 below, this primarily reflectshigherinflationsqueezingrealspending power, as well as softening jobs growth.
The other main drag on GDP growth will come from continued subdued business investment, giving ongoing uncertainties about the exact outcome of the Brexit negotiations, even if we assume here that worst case ‘WTO scenarios’ are avoided. While we assume some kind of free trade agreement will eventually be reached with the EU, this will take time and (given the need to increase control over immigration) will involve some reduction in access to the EU single market relative to the current position. Even if tariffs on goods are largely avoided, non-tariff barriers are likely to increase for both goods and services.
Government consumption growth will be less affected than business investment, but is likely to remain moderate in line with Budget plans. Public sector investment is planned to be stronger, however, which should partly offset the expected weakness in private investment in 2017-18.
UK net exports should move in a more favourable direction this year as import demand weakens and the fall in the pound helps exports and import substitutes to become more competitive. We therefore expect a positive contribution from net exports to GDP in 2017, but this may become more neutral again in 2018.
Overall, our growth projections are broadly similar to the latest average of independent forecasters, but slightly more cautious than those of the Bank of England and the OBR. But all economic projections are subject to particularly large uncertainties at present after the shock of the Brexit vote.
12 UK Economic Outlook March 2017
Alternative growth scenarios – businesses need to make contingency plans
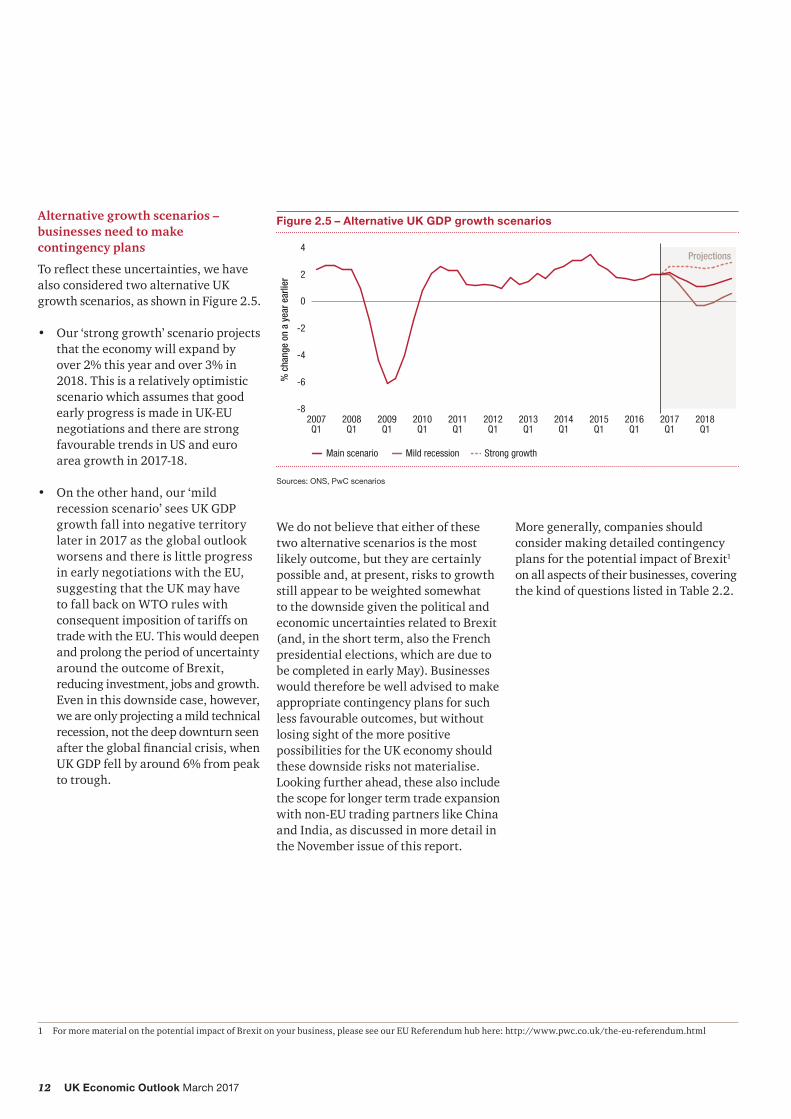
Toreflecttheseuncertainties,wehavealso considered two alternative UK growth scenarios, as shown in Figure 2.5.
• Our ‘strong growth’ scenario projects that the economy will expand by over 2% this year and over 3% in 2018. This is a relatively optimistic scenario which assumes that good early progress is made in UK-EU negotiations and there are strong favourable trends in US and euro area growth in 2017-18.
• On the other hand, our ‘mild recession scenario’ sees UK GDP growth fall into negative territory later in 2017 as the global outlook worsens and there is little progress in early negotiations with the EU, suggesting that the UK may have to fall back on WTO rules with consequentimpositionoftariffsontrade with the EU. This would deepen and prolong the period of uncertainty around the outcome of Brexit, reducing investment, jobs and growth. Even in this downside case, however, we are only projecting a mild technical recession, not the deep downturn seen aftertheglobalfinancialcrisis,whenUK GDP fell by around 6% from peak to trough.
Figure 2.5 – Alternative UK GDP growth scenarios
-8
-6
-4
-2
0
2
4
2018Q1
2017Q1
2016Q1
2015Q1
2014Q1
2013Q1
2012Q1
2011Q1
2010Q1
2009Q1
2008Q1
2007Q1
Projections
% c
hang
e on
a y
ear e
arlie
r
Main scenario Mild recession Strong growth
Sources: ONS, PwC scenarios
We do not believe that either of these two alternative scenarios is the most likely outcome, but they are certainly possible and, at present, risks to growth still appear to be weighted somewhat to the downside given the political and economic uncertainties related to Brexit (and, in the short term, also the French presidential elections, which are due to be completed in early May). Businesses would therefore be well advised to make appropriate contingency plans for such less favourable outcomes, but without losing sight of the more positive possibilities for the UK economy should these downside risks not materialise. Looking further ahead, these also include the scope for longer term trade expansion with non-EU trading partners like China and India, as discussed in more detail in the November issue of this report.
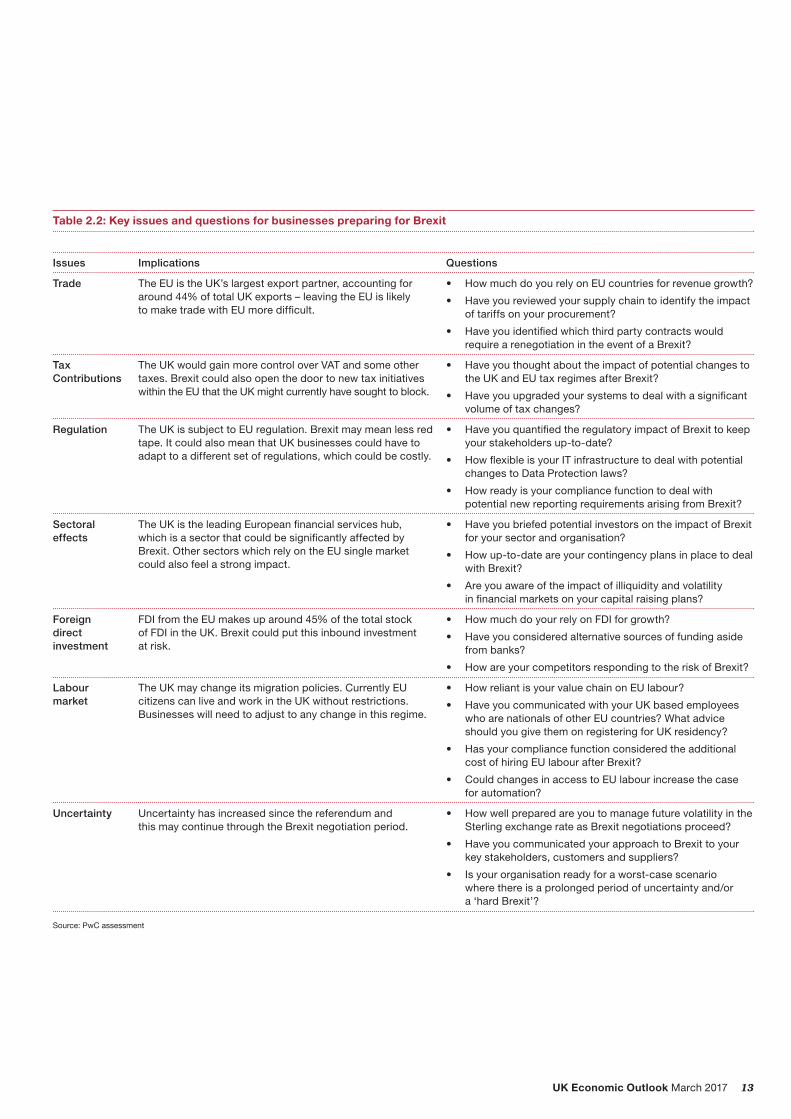
More generally, companies should consider making detailed contingency plans for the potential impact of Brexit1 on all aspects of their businesses, covering thekindofquestionslistedinTable2.2.
1 For more material on the potential impact of Brexit on your business, please see our EU Referendum hub here: http://www.pwc.co.uk/the-eu-referendum.html
13UK Economic Outlook March 2017
Table 2.2: Key issues and questions for businesses preparing for Brexit
Issues Implications Questions
Trade The EU is the UK’s largest export partner, accounting for around 44% of total UK exports – leaving the EU is likely to make trade with EU more difficult.
• How much do you rely on EU countries for revenue growth?
• Have you reviewed your supply chain to identify the impact of tariffs on your procurement?
• Have you identified which third party contracts would require a renegotiation in the event of a Brexit?
Tax Contributions
The UK would gain more control over VAT and some other taxes. Brexit could also open the door to new tax initiatives within the EU that the UK might currently have sought to block.
• Have you thought about the impact of potential changes to the UK and EU tax regimes after Brexit?
• Have you upgraded your systems to deal with a significant volume of tax changes?
Regulation The UK is subject to EU regulation. Brexit may mean less red tape. It could also mean that UK businesses could have to adapt to a different set of regulations, which could be costly.
• Have you quantified the regulatory impact of Brexit to keep your stakeholders up-to-date?
• How flexible is your IT infrastructure to deal with potential changes to Data Protection laws?
• How ready is your compliance function to deal with potential new reporting requirements arising from Brexit?
Sectoral effects
The UK is the leading European financial services hub, which is a sector that could be significantly affected by Brexit. Other sectors which rely on the EU single market could also feel a strong impact.
• Have you briefed potential investors on the impact of Brexit for your sector and organisation?
• How up-to-date are your contingency plans in place to deal with Brexit?
• Are you aware of the impact of illiquidity and volatility in financial markets on your capital raising plans?
Foreign direct investment
FDI from the EU makes up around 45% of the total stock of FDI in the UK. Brexit could put this inbound investment at risk.
• How much do your rely on FDI for growth?
• Have you considered alternative sources of funding aside from banks?
• How are your competitors responding to the risk of Brexit?
Labour market
The UK may change its migration policies. Currently EU citizens can live and work in the UK without restrictions. Businesses will need to adjust to any change in this regime.
• How reliant is your value chain on EU labour?
• Have you communicated with your UK based employees who are nationals of other EU countries? What advice should you give them on registering for UK residency?
• Has your compliance function considered the additional cost of hiring EU labour after Brexit?
• Could changes in access to EU labour increase the case for automation?
Uncertainty Uncertainty has increased since the referendum and this may continue through the Brexit negotiation period.
• How well prepared are you to manage future volatility in the Sterling exchange rate as Brexit negotiations proceed?
• Have you communicated your approach to Brexit to your key stakeholders, customers and suppliers?
• Is your organisation ready for a worst-case scenario where there is a prolonged period of uncertainty and/or a ‘hard Brexit’?
Source: PwC assessment
14 UK Economic Outlook March 2017
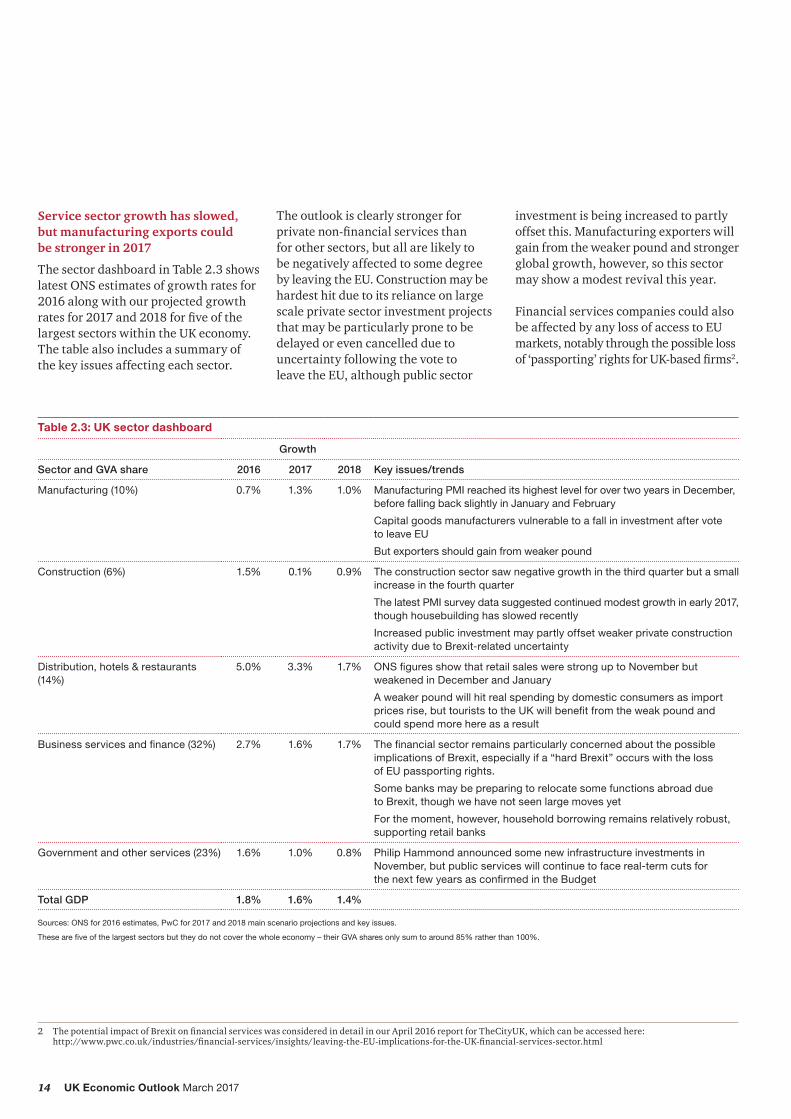
Table 2.3: UK sector dashboard
Growth
Sector and GVA share 2016 2017 2018 Key issues/trends
Manufacturing (10%) 0.7% 1.3% 1.0% Manufacturing PMI reached its highest level for over two years in December, before falling back slightly in January and February
Capital goods manufacturers vulnerable to a fall in investment after vote to leave EU
But exporters should gain from weaker pound
Construction (6%) 1.5% 0.1% 0.9% The construction sector saw negative growth in the third quarter but a small increase in the fourth quarter
The latest PMI survey data suggested continued modest growth in early 2017, though housebuilding has slowed recently
Increased public investment may partly offset weaker private construction activity due to Brexit-related uncertainty
Distribution, hotels & restaurants (14%)
5.0% 3.3% 1.7% ONS figures show that retail sales were strong up to November but weakened in December and January
A weaker pound will hit real spending by domestic consumers as import prices rise, but tourists to the UK will benefit from the weak pound and could spend more here as a result
Business services and finance (32%) 2.7% 1.6% 1.7% The financial sector remains particularly concerned about the possible implications of Brexit, especially if a “hard Brexit” occurs with the loss of EU passporting rights.
Some banks may be preparing to relocate some functions abroad due to Brexit, though we have not seen large moves yet
For the moment, however, household borrowing remains relatively robust, supporting retail banks
Government and other services (23%) 1.6% 1.0% 0.8% Philip Hammond announced some new infrastructure investments in November, but public services will continue to face real-term cuts for the next few years as confirmed in the Budget
Total GDP 1.8% 1.6% 1.4%
Sources: ONS for 2016 estimates, PwC for 2017 and 2018 main scenario projections and key issues.
These are five of the largest sectors but they do not cover the whole economy – their GVA shares only sum to around 85% rather than 100%.
Service sector growth has slowed, but manufacturing exports could be stronger in 2017
The sector dashboard in Table 2.3 shows latest ONS estimates of growth rates for 2016 along with our projected growth ratesfor2017and2018forfiveofthelargest sectors within the UK economy. The table also includes a summary of the key issues affecting each sector.
The outlook is clearly stronger for privatenon-financialservicesthan for other sectors, but all are likely to be negatively affected to some degree by leaving the EU. Construction may be hardest hit due to its reliance on large scale private sector investment projects that may be particularly prone to be delayed or even cancelled due to uncertainty following the vote to leave the EU, although public sector
investment is being increased to partly offset this. Manufacturing exporters will gain from the weaker pound and stronger global growth, however, so this sector may show a modest revival this year.
Financial services companies could also be affected by any loss of access to EU markets, notably through the possible loss of‘passporting’rightsforUK-basedfirms2.
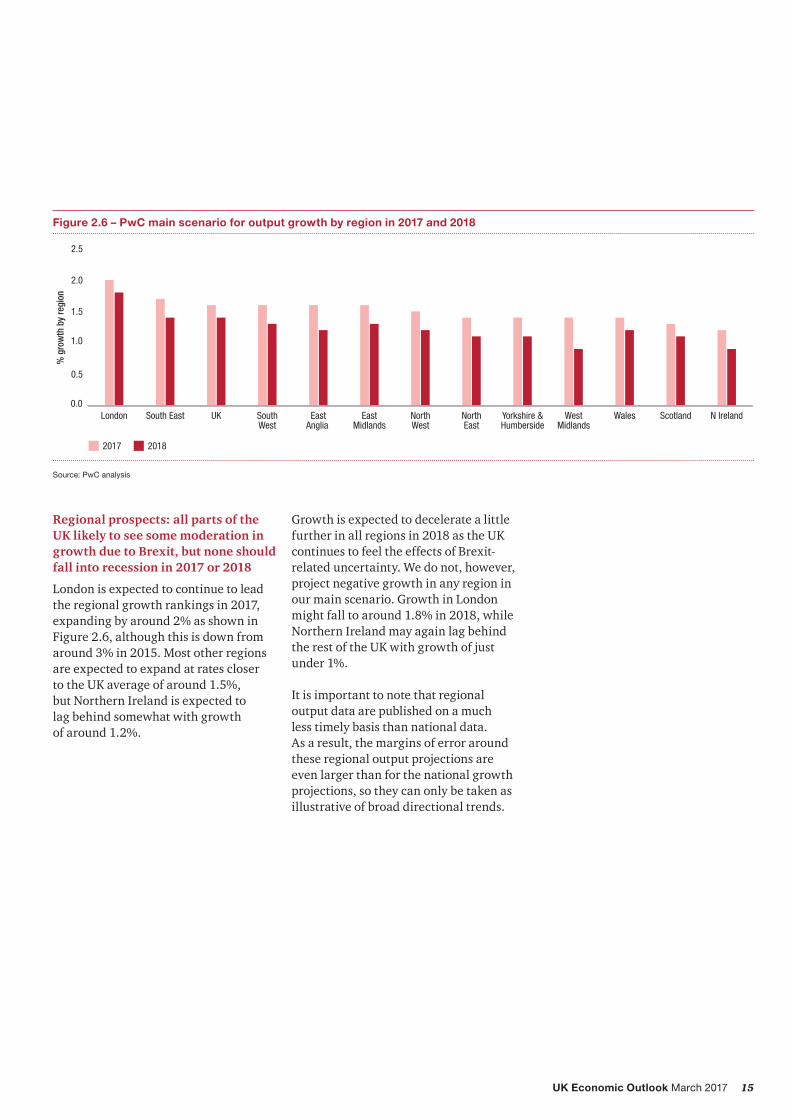
Figure 2.6 – PwC main scenario for output growth by region in 2017 and 2018
0.0
0.5
1.0
1.5
2.0
2.5
N IrelandScotlandWalesWestMidlands
Yorkshire &Humberside
NorthEast
NorthWest
EastMidlands
EastAnglia
SouthWest
UKSouth EastLondon
% g
row
th b
y re
gion
2017 2018
Source: PwC analysis
Regional prospects: all parts of the UK likely to see some moderation in growth due to Brexit, but none should fall into recession in 2017 or 2018
London is expected to continue to lead the regional growth rankings in 2017, expanding by around 2% as shown in Figure 2.6, although this is down from around 3% in 2015. Most other regions are expected to expand at rates closer to the UK average of around 1.5%, but Northern Ireland is expected to lag behind somewhat with growth of around 1.2%.
Growth is expected to decelerate a little further in all regions in 2018 as the UK continues to feel the effects of Brexit-related uncertainty. We do not, however, project negative growth in any region in our main scenario. Growth in London might fall to around 1.8% in 2018, while Northern Ireland may again lag behind the rest of the UK with growth of just under 1%.
It is important to note that regional output data are published on a much less timely basis than national data. As a result, the margins of error around these regional output projections are even larger than for the national growth projections, so they can only be taken as illustrative of broad directional trends.
16 UK Economic Outlook March 2017
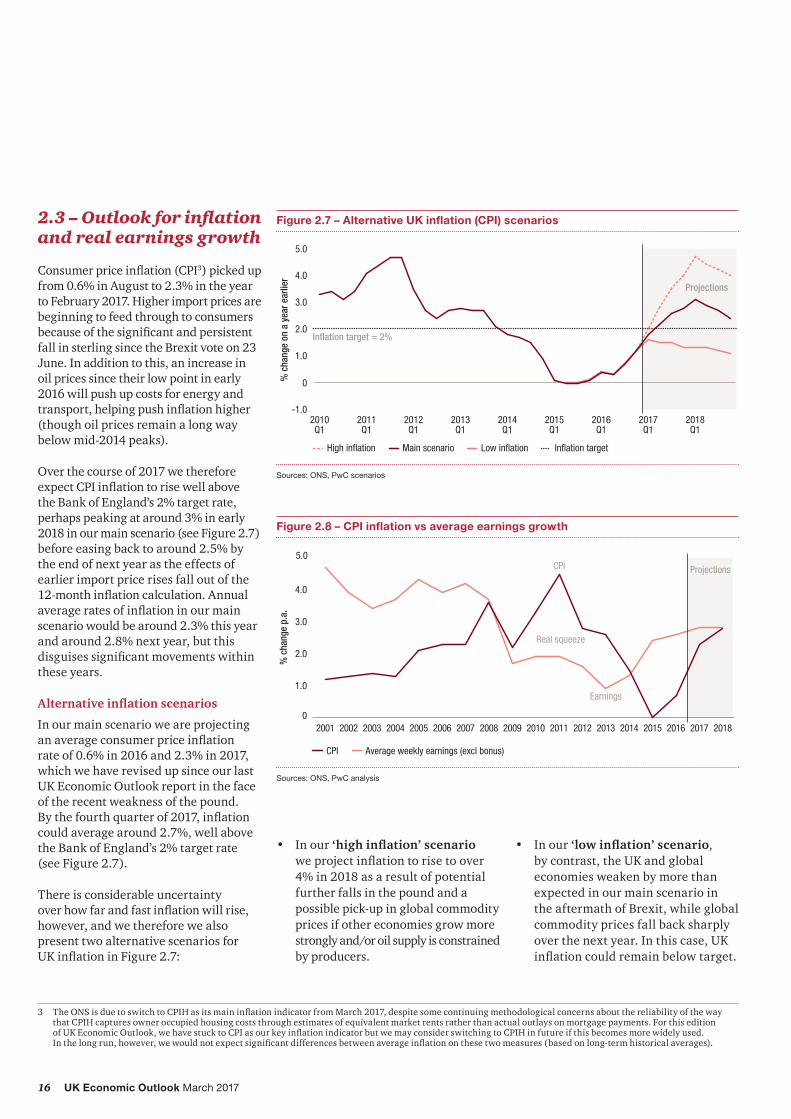
2.3 – Outlook for inflation and real earnings growth
Consumerpriceinflation(CPI3) picked up from 0.6% in August to 2.3% in the year to February 2017. Higher import prices are beginning to feed through to consumers becauseofthesignificantandpersistentfall in sterling since the Brexit vote on 23 June. In addition to this, an increase in oil prices since their low point in early 2016 will push up costs for energy and transport,helpingpushinflationhigher(though oil prices remain a long way below mid-2014 peaks).
Over the course of 2017 we therefore expectCPIinflationtorisewellabove the Bank of England’s 2% target rate, perhaps peaking at around 3% in early 2018 in our main scenario (see Figure 2.7) before easing back to around 2.5% by the end of next year as the effects of earlier import price rises fall out of the 12-monthinflationcalculation.Annualaverageratesofinflationinourmainscenario would be around 2.3% this year and around 2.8% next year, but this disguisessignificantmovementswithinthese years.
Alternative inflation scenarios
In our main scenario we are projecting anaverageconsumerpriceinflation rate of 0.6% in 2016 and 2.3% in 2017, which we have revised up since our last UK Economic Outlook report in the face of the recent weakness of the pound. Bythefourthquarterof2017,inflationcould average around 2.7%, well above the Bank of England’s 2% target rate (see Figure 2.7).
There is considerable uncertainty overhowfarandfastinflationwillrise,however, and we therefore we also present two alternative scenarios for UKinflationinFigure2.7:
• In our ‘high inflation’ scenario weprojectinflationtorisetoover4% in 2018 as a result of potential further falls in the pound and a possible pick-up in global commodity prices if other economies grow more strongly and/or oil supply is constrained by producers.
• In our ‘low inflation’ scenario, by contrast, the UK and global economies weaken by more than expected in our main scenario in the aftermath of Brexit, while global commodity prices fall back sharply over the next year. In this case, UK inflationcouldremainbelowtarget.
17UK Economic Outlook March 2017
As with our GDP growth scenarios, neither of these two alternative variants is as likely as our main scenario. But given recent volatility and uncertainty, businesses should plan for a broad range of outcomes after Brexit and risks to UK inflationdoseemtobeweightedtotheupside at present (in contrast to risks to real GDP growth, which we think are still weighted somewhat to the downside).
Consumerpriceinflationexceededearnings growth for six consecutive years following the onset of the 2008-9 recession, which was in marked contrast to pre-crisis norms. Positive real earnings growth resumed in 2015 and 2016 as consumerpriceinflationfelltoclosetozero,butnominalearningsgrowthincashterms was still only just over 2%, which remains weak by historical standards.
There might be a gradual pick-up in earnings growth in 2017-18, but this is less clear after the vote to leave the EU. On the one hand, higher consumer priceinflationduetotheweakerpoundcould feed through into higher nominal earnings growth, but on the other hand this could be offset by weaker economic growth and so labour demand in 2017-18. Balancing these two effects, our preliminary projection is that earnings growth remains at moderate levels in 2017-18, with real earnings growth falling back to around zeroin2018,asshowninFigure2.8. But there are considerable uncertainties around any such projections at present.
2.4 – Monetary and fiscal policy options
The Monetary Policy Committee (MPC) cut interest rates in August and announced anexpansionofitsquantitativeeasing(QE) asset purchase scheme, by £60bn for UK government bonds and up to £10bnforhighqualitycorporatebonds.
Monetary policy has remained on hold since then and we would expect this to continue for at least the next few months as the MPC waits for more data on growthandinflation,aswellasseeinghow the Brexit negotiations develop. If the data evolve broadly in line with our main scenario, however, we might expectaverygradualriseinofficialinterest rates to begin sometime in 2018.
The OBR revised down its 2016/17 public borrowingforecastsignificantly,butthiswas mostly due to one-off factors and shifts in the timing of revenues and spending that pushed some borrowing forward into 2017/18. The OBR’s medium term view on both growth and borrowing was little changed from its last forecast in November. Accordingly, there was littlechangeintheoverallstanceoffiscalpolicy, although the Chancellor did use some of the short-term borrowing undershoot to pay for an increase in social care and NHS spending to ease short term pressures in these areas.
Looking beyond the next two years, however, the Budget actually involved small net tax rises, but the macroeconomic impact of the changes will be minimal. Previous plans to cut current spending as a share of GDP were left broadly unchanged, with austerity set to continue well into the early 2020s, albeit proceeding at a markedly slower rate than planned by George Osborne in his 2015-16 Budgets.
2.5 – Summary and conclusions
UK economic growth remained relatively strong in the second half of 2016, increasing by around 2% intheyeartothefourthquarterasconsumer spending in particular remained resilient. But business investment was less strong last year (albeitvolatilefromquartertoquarter)and there have been some signs in early 2017thathigherinflationisstarting to take its toll on retail sales growth. These less favourable trends seem likely to continue for the rest of 2017 and into 2018 assuming the outcome of the Brexit negotiations remains unclear and the pound continues to be relatively weak.
In our main scenario, we therefore project UK growth to slow gradually from around 1.8% in 2016 to around 1.6% in 2017 and 1.4% in 2018. This assumes no major new adverse shocks to the global or EU economies (e.g. from the French presidential election results in early May).
Themainreasonforthissignificantslowdown in UK growth is projected to be a downturn in business investment driven by continued uncertainty surrounding the negotiations to leave the EU, and a squeezeonrealhouseholdspendingpowerfromrisinginflation,whichcouldreach around 3% by early 2018 in our main scenario, and a softening of jobs growth. But somewhat stronger net exports, helped by the weaker pound, should dampen the scale of the fall in overall GDP growth this year.
There are considerable uncertainties around any such projections at present, however, so businesses should stress test their business and investment plans against alternative economic scenarios and also review the potential wider implications of Brexit for all aspects of their operations.
18 UK Economic Outlook March 2017
3 – Consumer spending prospects after Brexit
Key points• Consumer spending has grown by an
average of 2.4% per annum faster than inflationoverthepastfouryears,drivingthe overall UK economic recovery both before and after the Brexit vote.
• Thishasreflectedrisingemploymentlevels, continued historically low interest rates, and a declining household savings ratio driven by higher borrowing and a strong housing market.
• Looking ahead, we expect real household income growth to slow in 2017-18asrisinginflationsqueezeshousehold spending power and employment growth softens. Increasedborrowingmayhelpfillthe gap, but there are limits to how far this can go on a sustainable basis.
• As a result, in our main scenario we expect real consumer spending growth to moderate from around 3% in 2016 to around 2% in 2017 and 1.7% in 2018.
• We project households will spend just under 30% of their budget on housing and utilities by 2030, up from around 25%in2016.Spendingonfinancialservices and personal care will also tend to increase relatively rapidly over time, while the share of total spending on food and clothing will tend to decline in the long run.
• The impact of Brexit on the consumer will vary by category of spending. Our analysis shows that the food and clothing sectors are most exposed to the fall in the value of sterling since the Brexit vote due to a high reliance on imports. The hotel, restaurant, manufacturing and agricultural sectors are also heavily reliant on EU labour and so could be subject to disruption in the longer term if net migrationfromtheEUissignificantlyreduced after Brexit (without a fully offsetting rise in non-EU net migration). Businesses need to prepare for these and other aspects of Brexit and make appropriate contingency plans.
IntroductionConsumer spending accounts for more than two thirds of UK GDP and is therefore the most important driver of UK economic growth. More recently, strong consumer spending has played a central role in the resilience of the UK economy both before and after the EU referendum, but will this robust growth continue in 2017 and beyond? Which areas of consumer spending might grow the fastest over the next decade? And how is Brexit expected to affect key consumer sectors?
Toanswerthesequestions,wehavelooked at past tends and future prospects for the two key determinants of household spending growth:
• real household disposable income (RHDI) growth, which in turn is driven by trends in real income fromemployment,statebenefits and pensions and other private income; and
• changes in the household savings ratio, which are particularly influencedbytherelativeindebtednessof households and wealth effects (e.g. from house price changes).
The discussion is structured as follows:
Section 3.1 Recent trends in household disposable income
Section 3.2 Future trends in household disposable income
Section 3.3 Household savings ratio: trends and projections
Section 3.4 Alternative scenarios for consumer spending growth to 2030
Section 3.5 Projected consumer spending growth by category
Section 3.6 Potential impact of Brexit on key consumer-focused sectors
Section 3.7 Summary and conclusions.
1 This article was written by Barret Kupelian, Duncan Mckellar and John Hawksworth of PwC’s economics practice.
19UK Economic Outlook March 2017
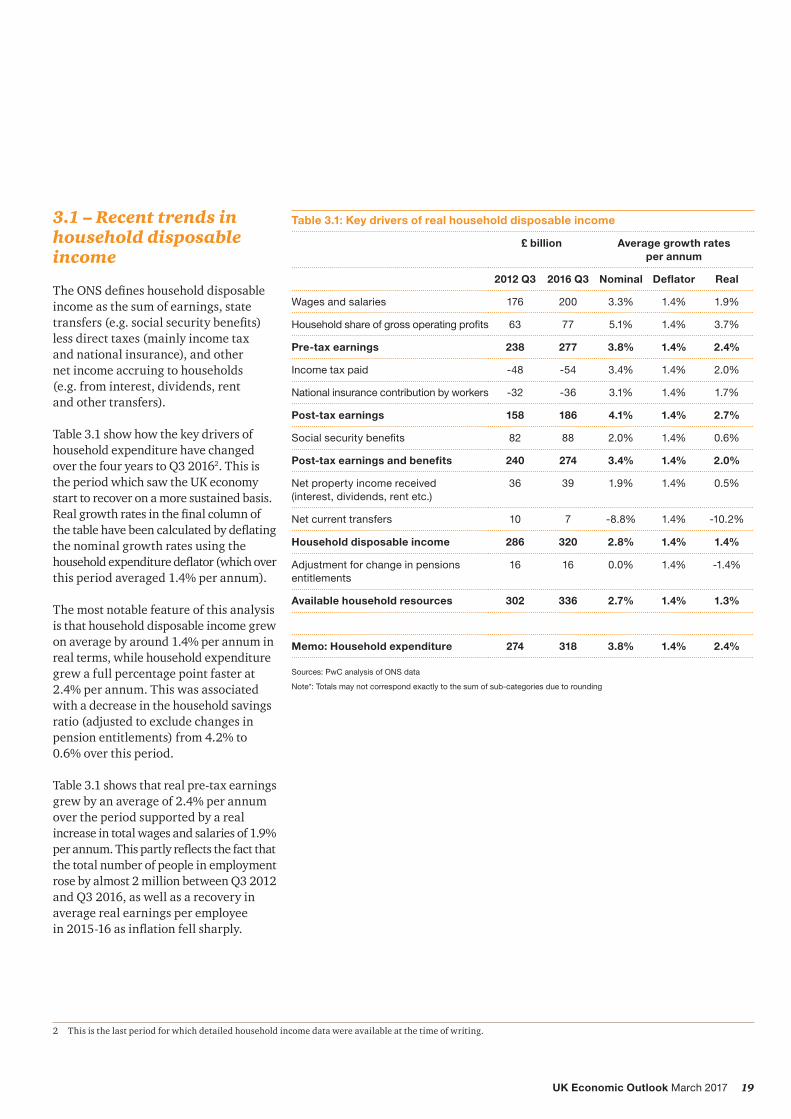
3.1 – Recent trends in household disposable income
TheONSdefineshouseholddisposableincome as the sum of earnings, state transfers(e.g.socialsecuritybenefits)less direct taxes (mainly income tax and national insurance), and other net income accruing to households (e.g. from interest, dividends, rent and other transfers).
Table 3.1 show how the key drivers of household expenditure have changed over the four years to Q3 20162. This is the period which saw the UK economy start to recover on a more sustained basis. Realgrowthratesinthefinalcolumnofthetablehavebeencalculatedbydeflatingthe nominal growth rates using the householdexpendituredeflator(whichoverthis period averaged 1.4% per annum).
The most notable feature of this analysis is that household disposable income grew on average by around 1.4% per annum in real terms, while household expenditure grew a full percentage point faster at 2.4% per annum. This was associated with a decrease in the household savings ratio (adjusted to exclude changes in pension entitlements) from 4.2% to 0.6% over this period.
Table 3.1 shows that real pre-tax earnings grew by an average of 2.4% per annum over the period supported by a real increase in total wages and salaries of 1.9% perannum.Thispartlyreflectsthefactthatthe total number of people in employment rose by almost 2 million between Q3 2012 and Q3 2016, as well as a recovery in average real earnings per employee in2015-16asinflationfellsharply.
2 This is the last period for which detailed household income data were available at the time of writing.
Table 3.1: Key drivers of real household disposable income
Note*: Totals may not correspond exactly to the sum of sub-categories due to rounding
20 UK Economic Outlook March 2017
Profitsearnedbytheself-employedandowners of small businesses grew even more strongly, at an average real rate of around 3.7% per annum over the four years.Thisreflectsashifttowardsself-employment and small business start-ups since around 2010.
However, Table 3.1 also shows that there are three areas that have dampened growth in real household disposable income over the period:
• Social security benefits: the modest overall real average rate of growth of 0.6% per annum for this item disguises the divergence between benefitspaidtothoseofworkingageandthosetotheretired.Specifically,total state pensions have grown at a real annual average rate of 3.3% during the 2012-2016 period contrasting with an average real decrease in total personal tax credits andequivalentsofaround3%perannum over the same period3. In part the latter trend is explained by the improving employment situation in the UK since 2012, which has reduced the number of people receivingworkingagebenefits.
• Net property income: this category of income has also seen relatively slow real growth (0.5% per annum), due in particular to the fact that that interest rates on savings have remained at record lows, although of course this also applies to loan interest rates.
• Net current transfers: this income category includes transfers to consumersintheformoffinancialgifts, and some insurance claims, but excludes government transfers. These transfers have decreased sharply since Q3 2012 largely as a result of falling insurance claims over the period (from a high of £6.4bn in 2013 to just under £5bn in 2015 in nominal terms). However, this is a comparatively small element of household income (around 2% of the total) so the effect on overall household income growth is not that great.
3 Department for Work & Pensions Expenditure Caseload forecasts (2016).
ThefinalrowinTable3.1showsthattotal real household resources grew by 1.3% per annum after taking into account the change in the adjustment of pension fund entitlements. However, such changes in pension values are unlikely to be perceived by most households as usable income, so we prefer to exclude this from the analysis by focusing on an ‘adjusted household savingsratio’definedasthedifferencebetween household disposable income and expenditure as a % of disposable income. This is lower than the standard ONSdefinitionbasedonhouseholdresources rather than disposable income, but gives a more realistic indication of the extent to which the household sector in aggregate is saving or borrowing.
21UK Economic Outlook March 2017
3.2 – Future trends in household disposable income
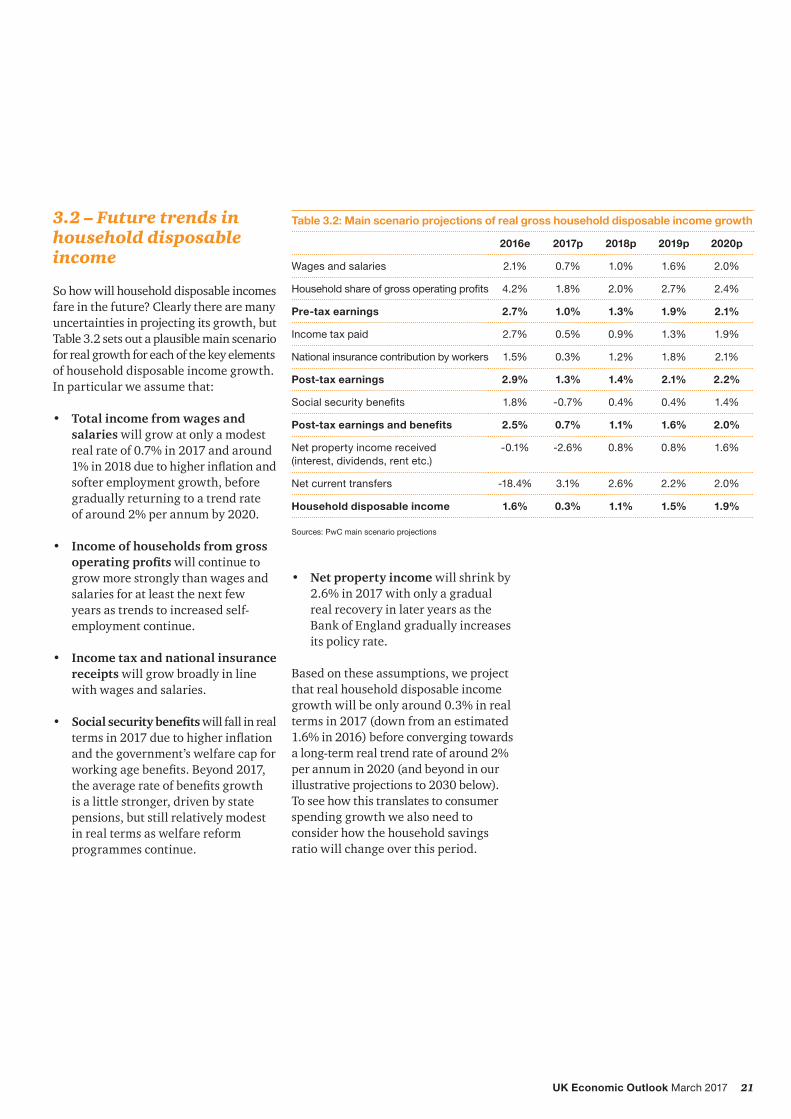
So how will household disposable incomes fare in the future? Clearly there are many uncertainties in projecting its growth, but Table 3.2 sets out a plausible main scenario for real growth for each of the key elements of household disposable income growth. In particular we assume that:
• Total income from wages and salaries will grow at only a modest real rate of 0.7% in 2017 and around 1%in2018duetohigherinflationandsofter employment growth, before gradually returning to a trend rate of around 2% per annum by 2020.
• Income of households from gross operating profits will continue to grow more strongly than wages and salaries for at least the next few years as trends to increased self-employment continue.
• Income tax and national insurance receipts will grow broadly in line with wages and salaries.
• Social security benefits will fall in real termsin2017duetohigherinflationand the government’s welfare cap for workingagebenefits.Beyond2017,theaveragerateofbenefitsgrowth is a little stronger, driven by state pensions, but still relatively modest in real terms as welfare reform programmes continue.
Table 3.2: Main scenario projections of real gross household disposable income growth
National insurance contribution by workers 1.5% 0.3% 1.2% 1.8% 2.1%
Post-tax earnings 2.9% 1.3% 1.4% 2.1% 2.2%
Social security benefits 1.8% -0.7% 0.4% 0.4% 1.4%
Post-tax earnings and benefits 2.5% 0.7% 1.1% 1.6% 2.0%
Net property income received (interest, dividends, rent etc.)
-0.1% -2.6% 0.8% 0.8% 1.6%
Net current transfers -18.4% 3.1% 2.6% 2.2% 2.0%
Household disposable income 1.6% 0.3% 1.1% 1.5% 1.9%
Sources: PwC main scenario projections
• Net property income will shrink by 2.6% in 2017 with only a gradual real recovery in later years as the Bank of England gradually increases its policy rate.
Based on these assumptions, we project that real household disposable income growth will be only around 0.3% in real terms in 2017 (down from an estimated 1.6% in 2016) before converging towards a long-term real trend rate of around 2% per annum in 2020 (and beyond in our illustrative projections to 2030 below). To see how this translates to consumer spending growth we also need to consider how the household savings ratio will change over this period.
22 UK Economic Outlook March 2017
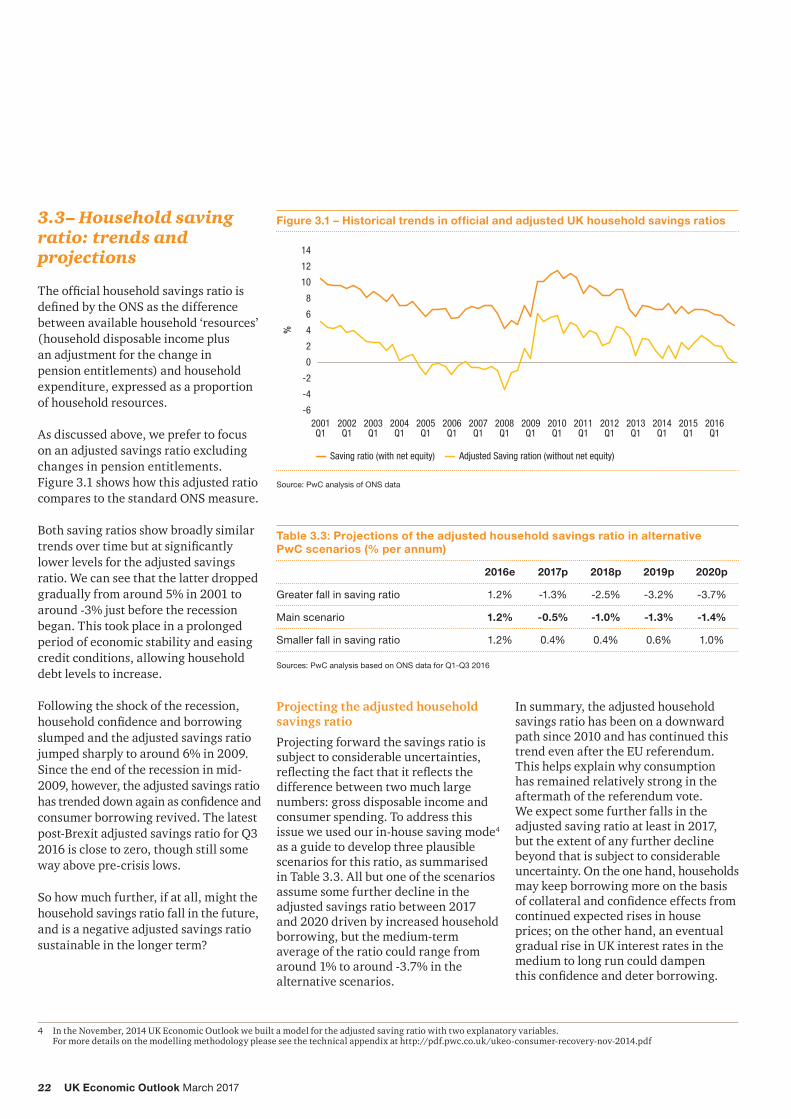
3.3– Household saving ratio: trends and projections
TheofficialhouseholdsavingsratioisdefinedbytheONSasthedifferencebetween available household ‘resources’ (household disposable income plus an adjustment for the change in pension entitlements) and household expenditure, expressed as a proportion of household resources.
As discussed above, we prefer to focus on an adjusted savings ratio excluding changes in pension entitlements. Figure 3.1 shows how this adjusted ratio compares to the standard ONS measure.
Both saving ratios show broadly similar trendsovertimebutatsignificantlylower levels for the adjusted savings ratio. We can see that the latter dropped gradually from around 5% in 2001 to around -3% just before the recession began. This took place in a prolonged period of economic stability and easing credit conditions, allowing household debt levels to increase.
Following the shock of the recession, householdconfidenceandborrowingslumped and the adjusted savings ratio jumped sharply to around 6% in 2009. Since the end of the recession in mid-2009, however, the adjusted savings ratio hastrendeddownagainasconfidenceandconsumer borrowing revived. The latest post-Brexit adjusted savings ratio for Q3 2016isclosetozero,thoughstillsomeway above pre-crisis lows.
So how much further, if at all, might the household savings ratio fall in the future, and is a negative adjusted savings ratio sustainable in the longer term?
Figure 3.1 – Historical trends in official and adjusted UK household savings ratios
Source: PwC analysis of ONS data
-6
-4
-2
0
2
4
6
8
10
12
14
2016Q1
2015Q1
2014Q1
2013Q1
2012Q1
2011Q1
2010Q1
2009Q1
2008Q1
2007Q1
2006Q1
2005Q1
2004Q1
2003Q1
2002Q1
2001Q1
Adjusted Saving ration (without net equity)Saving ratio (with net equity)
%
Projecting the adjusted household savings ratio
Projecting forward the savings ratio is subject to considerable uncertainties, reflectingthefactthatitreflectsthedifference between two much large numbers: gross disposable income and consumer spending. To address this issue we used our in-house saving mode4 as a guide to develop three plausible scenarios for this ratio, as summarised in Table 3.3. All but one of the scenarios assume some further decline in the adjusted savings ratio between 2017 and 2020 driven by increased household borrowing, but the medium-term average of the ratio could range from around 1% to around -3.7% in the alternative scenarios.
4 In the November, 2014 UK Economic Outlook we built a model for the adjusted saving ratio with two explanatory variables. For more details on the modelling methodology please see the technical appendix at http://pdf.pwc.co.uk/ukeo-consumer-recovery-nov-2014.pdf
In summary, the adjusted household savings ratio has been on a downward path since 2010 and has continued this trend even after the EU referendum. This helps explain why consumption has remained relatively strong in the aftermath of the referendum vote. We expect some further falls in the adjusted saving ratio at least in 2017, but the extent of any further decline beyond that is subject to considerable uncertainty. On the one hand, households may keep borrowing more on the basis ofcollateralandconfidenceeffectsfromcontinued expected rises in house prices; on the other hand, an eventual gradual rise in UK interest rates in the medium to long run could dampen thisconfidenceanddeterborrowing.
Table 3.3: Projections of the adjusted household savings ratio in alternative PwC scenarios (% per annum)
2016e 2017p 2018p 2019p 2020p
Greater fall in saving ratio 1.2% -1.3% -2.5% -3.2% -3.7%
Main scenario 1.2% -0.5% -1.0% -1.3% -1.4%
Smaller fall in saving ratio 1.2% 0.4% 0.4% 0.6% 1.0%
Sources: PwC analysis based on ONS data for Q1-Q3 2016
23UK Economic Outlook March 2017
3.4 – Alternative scenarios for consumer spending growth to 2030
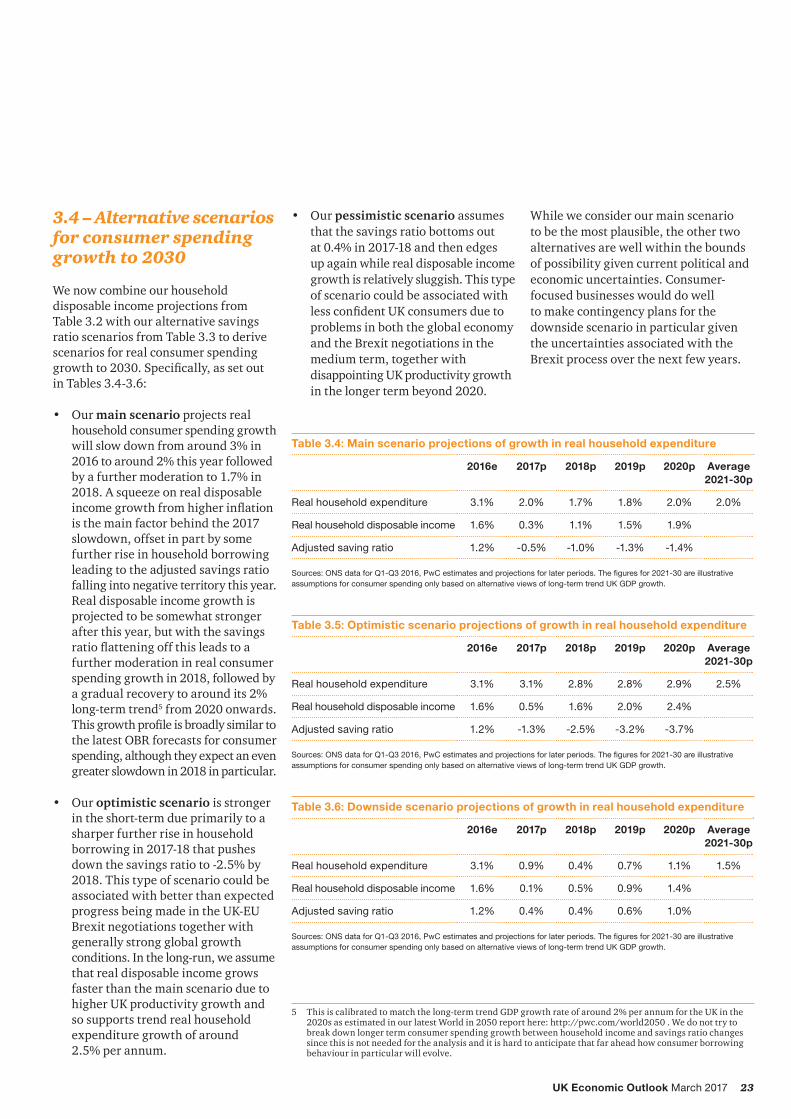
We now combine our household disposable income projections from Table 3.2 with our alternative savings ratio scenarios from Table 3.3 to derive scenarios for real consumer spending growthto2030.Specifically,assetoutin Tables 3.4-3.6:
• Our main scenario projects real household consumer spending growth will slow down from around 3% in 2016 to around 2% this year followed by a further moderation to 1.7% in 2018.Asqueezeonrealdisposableincomegrowthfromhigherinflation is the main factor behind the 2017 slowdown, offset in part by some further rise in household borrowing leading to the adjusted savings ratio falling into negative territory this year. Real disposable income growth is projected to be somewhat stronger after this year, but with the savings ratioflatteningoffthisleadstoafurther moderation in real consumer spending growth in 2018, followed by a gradual recovery to around its 2% long-term trend5 from 2020 onwards. Thisgrowthprofileisbroadlysimilartothe latest OBR forecasts for consumer spending, although they expect an even greater slowdown in 2018 in particular.
• Our optimistic scenario is stronger in the short-term due primarily to a sharper further rise in household borrowing in 2017-18 that pushes down the savings ratio to -2.5% by 2018. This type of scenario could be associated with better than expected progress being made in the UK-EU Brexit negotiations together with generally strong global growth conditions. In the long-run, we assume that real disposable income grows faster than the main scenario due to higher UK productivity growth and so supports trend real household expenditure growth of around 2.5% per annum.
• Our pessimistic scenario assumes that the savings ratio bottoms out at 0.4% in 2017-18 and then edges up again while real disposable income growth is relatively sluggish. This type of scenario could be associated with lessconfidentUKconsumersduetoproblems in both the global economy and the Brexit negotiations in the medium term, together with disappointing UK productivity growth in the longer term beyond 2020.
Table 3.4: Main scenario projections of growth in real household expenditure
2016e 2017p 2018p 2019p 2020p Average 2021-30p
Real household expenditure 3.1% 2.0% 1.7% 1.8% 2.0% 2.0%
Real household disposable income 1.6% 0.3% 1.1% 1.5% 1.9%
Adjusted saving ratio 1.2% -0.5% -1.0% -1.3% -1.4%
Sources: ONS data for Q1-Q3 2016, PwC estimates and projections for later periods. The figures for 2021-30 are illustrative assumptions for consumer spending only based on alternative views of long-term trend UK GDP growth.
While we consider our main scenario to be the most plausible, the other two alternatives are well within the bounds of possibility given current political and economic uncertainties. Consumer-focused businesses would do well to make contingency plans for the downside scenario in particular given the uncertainties associated with the Brexit process over the next few years.
Table 3.5: Optimistic scenario projections of growth in real household expenditure
2016e 2017p 2018p 2019p 2020p Average 2021-30p
Real household expenditure 3.1% 3.1% 2.8% 2.8% 2.9% 2.5%
Real household disposable income 1.6% 0.5% 1.6% 2.0% 2.4%
Adjusted saving ratio 1.2% -1.3% -2.5% -3.2% -3.7%
Sources: ONS data for Q1-Q3 2016, PwC estimates and projections for later periods. The figures for 2021-30 are illustrative assumptions for consumer spending only based on alternative views of long-term trend UK GDP growth.
Table 3.6: Downside scenario projections of growth in real household expenditure
2016e 2017p 2018p 2019p 2020p Average 2021-30p
Real household expenditure 3.1% 0.9% 0.4% 0.7% 1.1% 1.5%
Real household disposable income 1.6% 0.1% 0.5% 0.9% 1.4%
Adjusted saving ratio 1.2% 0.4% 0.4% 0.6% 1.0%
Sources: ONS data for Q1-Q3 2016, PwC estimates and projections for later periods. The figures for 2021-30 are illustrative assumptions for consumer spending only based on alternative views of long-term trend UK GDP growth.
5 This is calibrated to match the long-term trend GDP growth rate of around 2% per annum for the UK in the 2020s as estimated in our latest World in 2050 report here: http://pwc.com/world2050 . We do not try to break down longer term consumer spending growth between household income and savings ratio changes since this is not needed for the analysis and it is hard to anticipate that far ahead how consumer borrowing behaviour in particular will evolve.
24 UK Economic Outlook March 2017
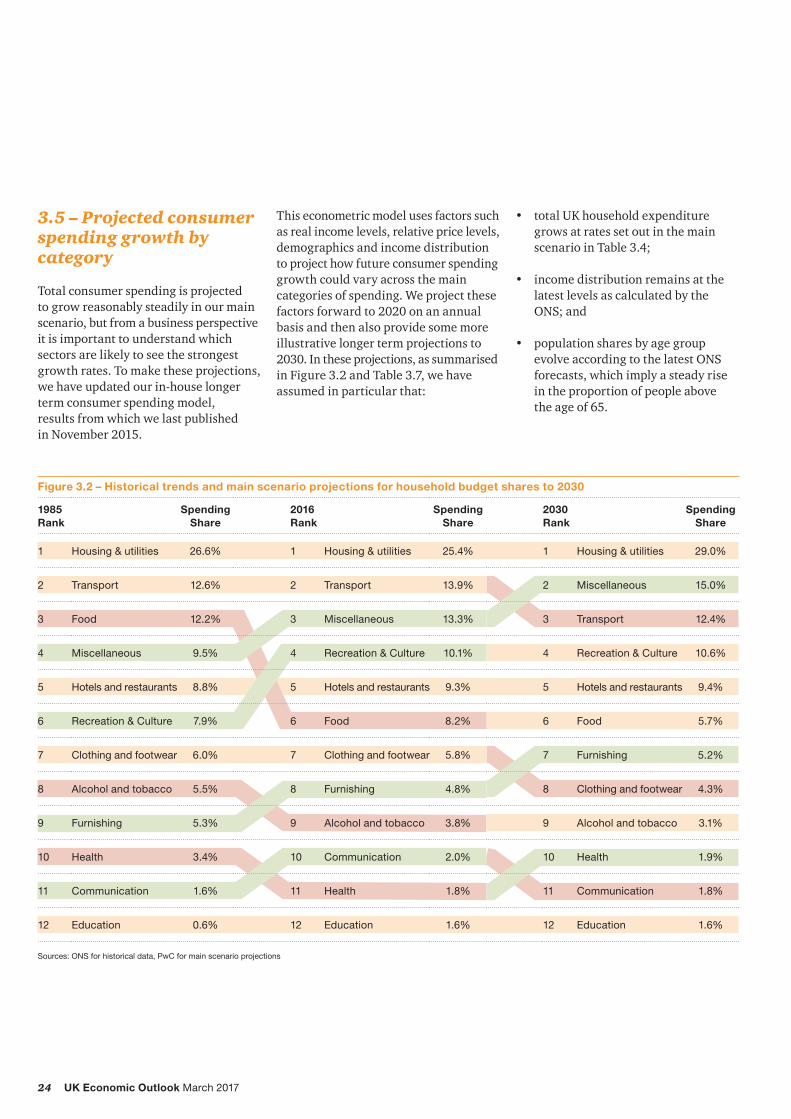
3.5 – Projected consumer spending growth by category
Total consumer spending is projected to grow reasonably steadily in our main scenario, but from a business perspective it is important to understand which sectors are likely to see the strongest growth rates. To make these projections, we have updated our in-house longer term consumer spending model, results from which we last published in November 2015.
This econometric model uses factors such as real income levels, relative price levels, demographics and income distribution to project how future consumer spending growth could vary across the main categories of spending. We project these factors forward to 2020 on an annual basis and then also provide some more illustrative longer term projections to 2030. In these projections, as summarised in Figure 3.2 and Table 3.7, we have assumed in particular that:
• total UK household expenditure grows at rates set out in the main scenario in Table 3.4;
• income distribution remains at the latest levels as calculated by the ONS; and
• population shares by age group evolve according to the latest ONS forecasts, which imply a steady rise in the proportion of people above the age of 65.
Figure 3.2 – Historical trends and main scenario projections for household budget shares to 2030
Recreation and culture 10.1% 10.3% 10.6% 2.2% 2.4%
Hotels and restaurants 9.3% 9.3% 9.4% 1.8% 2.2%
Transport 13.9% 13.7% 12.4% 1.4% 1.1%
Total spending 100% 100% 100% 2.1% 2.0%
Sources: ONS data for Q1-Q3 2016 and PwC estimates and main scenario projections for later periods.
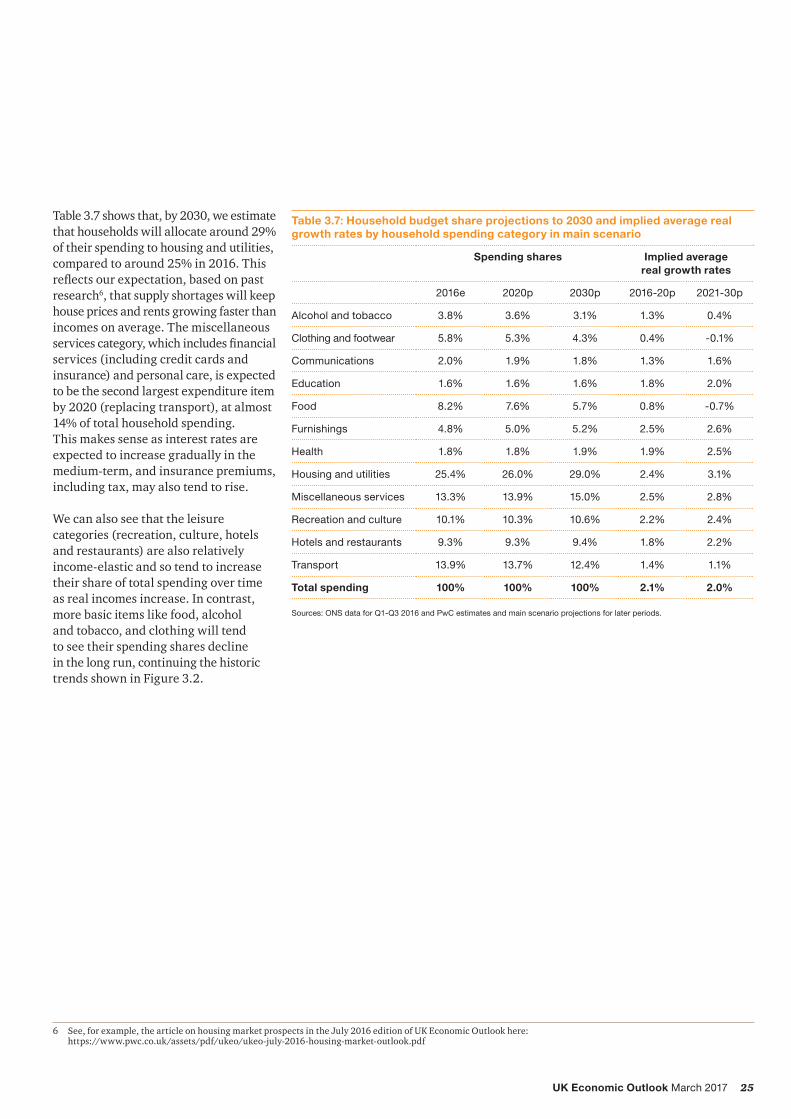
Table 3.7 shows that, by 2030, we estimate that households will allocate around 29% of their spending to housing and utilities, compared to around 25% in 2016. This reflectsourexpectation,basedonpastresearch6, that supply shortages will keep house prices and rents growing faster than incomes on average. The miscellaneous servicescategory,whichincludesfinancialservices (including credit cards and insurance) and personal care, is expected to be the second largest expenditure item by 2020 (replacing transport), at almost 14% of total household spending. This makes sense as interest rates are expected to increase gradually in the medium-term, and insurance premiums, including tax, may also tend to rise.
We can also see that the leisure categories (recreation, culture, hotels and restaurants) are also relatively income-elastic and so tend to increase their share of total spending over time as real incomes increase. In contrast, more basic items like food, alcohol and tobacco, and clothing will tend to see their spending shares decline in the long run, continuing the historic trends shown in Figure 3.2.
6 See, for example, the article on housing market prospects in the July 2016 edition of UK Economic Outlook here: https://www.pwc.co.uk/assets/pdf/ukeo/ukeo-july-2016-housing-market-outlook.pdf
26 UK Economic Outlook March 2017
3.6 – Potential impact of Brexit on key consumer-focused sectors
The future relationship between the UK and the EU is clearly subject to considerable uncertainties and could have many different types of effects on UK businesses (e.g.reconfigurationofsupplychainsacross Europe for some consumer goods). Many of these impacts may be hard to predict in advance given the uncertainties involved and the complexities of the large multinational businesses operating in consumer-related sectors.
However, there are two Brexit-related factors where we can most readily use hard data to try to assess, at least in broad terms, which industry sectors may be more or less exposed to possible adverse effects:
• Foreign exchange rate: the fall in the pound has been the most immediate economic effect of the Brexit vote and we can consider how far different sectors rely on imports to evaluate how exposed they may be to this change (exporters may gain, of course, be this is less relevant for those businesses targeting domestic consumer spending, which is our focus in this article).
Health Communication Miscellaneousgoods andservices
Food andnon-alcoholic
beverages
Furnishings Alcoholand
tobacco
Restaurantsand
hotels
EducationHousing, water,electricity gasand other fuels
Recreationand
culture
Transport
Sources: PwC analysis of ONS data
• Reliance on EU migrant labour: looking further ahead to after the UK actuallyleavetheEU,anysignificantchange in the current freedom of movement of workers between the UK and the EU could have important implications for businesses in sectors that are more reliant on EU migrant labour (assuming this is not offset fully by higher net immigration of non-EU workers, which is not current government policy).
We analyse these two effects in turn below.
27UK Economic Outlook March 2017
Impact of Brexit through the foreign exchange rate channel
The most immediate impact of the referendum vote was felt in the depreciation of sterling by around 10%7 against its major trading partners. In general, this means that the “imported” element of the products and services households buy becomes more expensive.
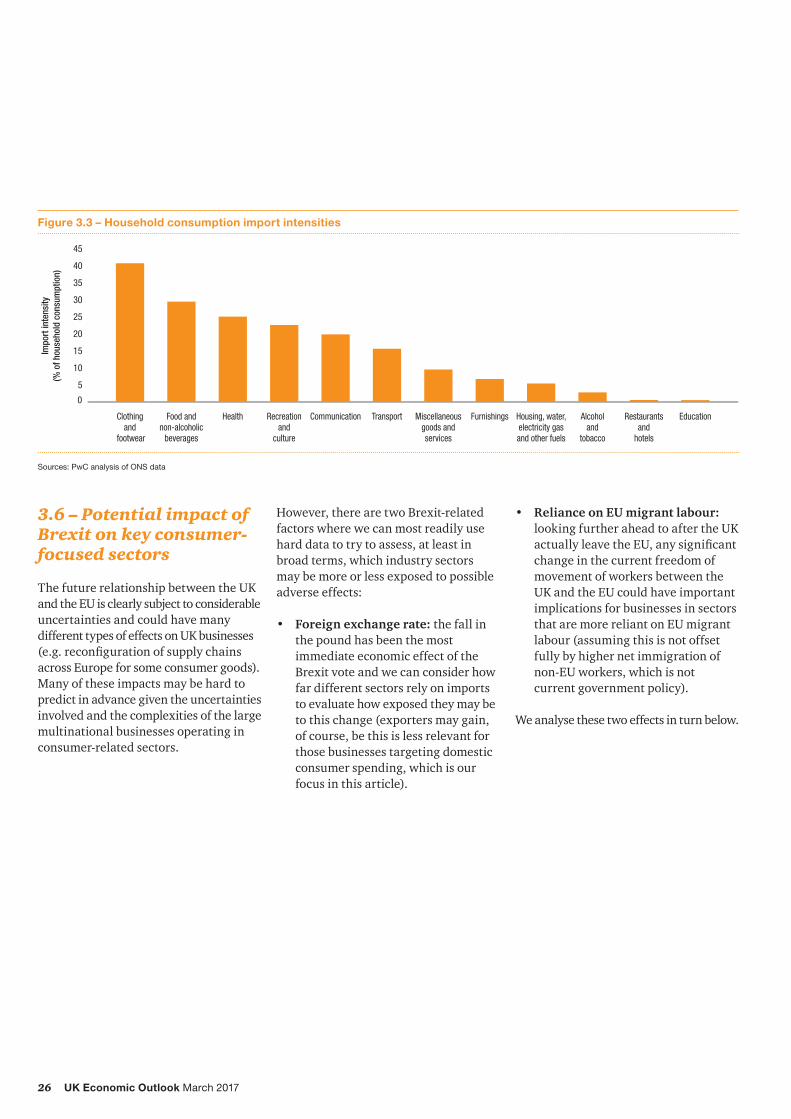
Figure 3.3 shows the reliance of household consumption on imports (so-called “import intensities”) using latest available data from the ONS8. This shows that clothing and footwear has the highest import intensity, followed by food and non-alcoholic beverages. These are also two sectors facing many other cost pressures, particularly for traditional high street retailers (e.g. relating to the national living wage, business rates and rents, particularly in London and the South East). Such retailers are also facing increasing competition from online retailers and discounters. Whether the full costs of a weaker pound (once short-term hedges run out) will be passed on to consumers is therefore unclear, but in any case such retailers will suffer from some combination of squeezedmarginsor,iftheytrytopasson cost increases, reduces sales volumes.
7 We calculated the change in sterling’s effective exchange rate since June 2016 based on monthly average data to February 2017 from the Bank of England.8 TheONSproducethe“importintensity”offinalhouseholdconsumptionforeachclassificationofindividualconsumptionbypurpose(COICOP).“Importintensity”referstothepercentageoffinalhouseholdconsumptionwhichisdirectlysatisfiedbyimports.UsingsensibleassumptionswemappedthedifferentCOICOPcategoriesto the household expenditure budget share categories. We then estimated the import intensity for each budget share category by calculating the unweighted, arithmetic average import intensity.
9 For more detailed analysis of London in particular, see PwC's recent report with London First here: http://www.pwc.co.uk/services/legal-services/services/immigration/facing-facts--the-impact-of-migrants-on-london--its-workforce-an.html
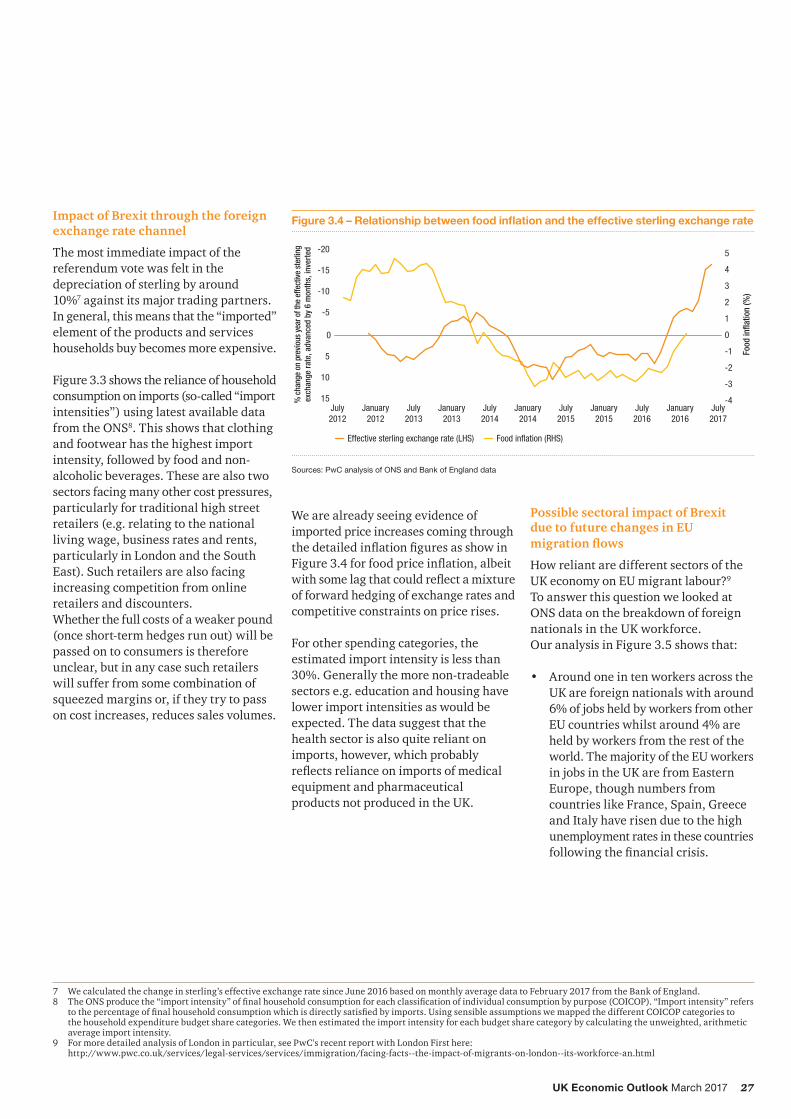
We are already seeing evidence of imported price increases coming through thedetailedinflationfiguresasshowinFigure3.4forfoodpriceinflation,albeitwithsomelagthatcouldreflectamixtureof forward hedging of exchange rates and competitive constraints on price rises.
For other spending categories, the estimated import intensity is less than 30%. Generally the more non-tradeable sectors e.g. education and housing have lower import intensities as would be expected. The data suggest that the healthsectorisalsoquitereliantonimports, however, which probably reflectsrelianceonimportsofmedicalequipmentandpharmaceutical products not produced in the UK.
Figure 3.4 – Relationship between food inflation and the effective sterling exchange rate
Sources: PwC analysis of ONS and Bank of England data
Possible sectoral impact of Brexit due to future changes in EU migration flows
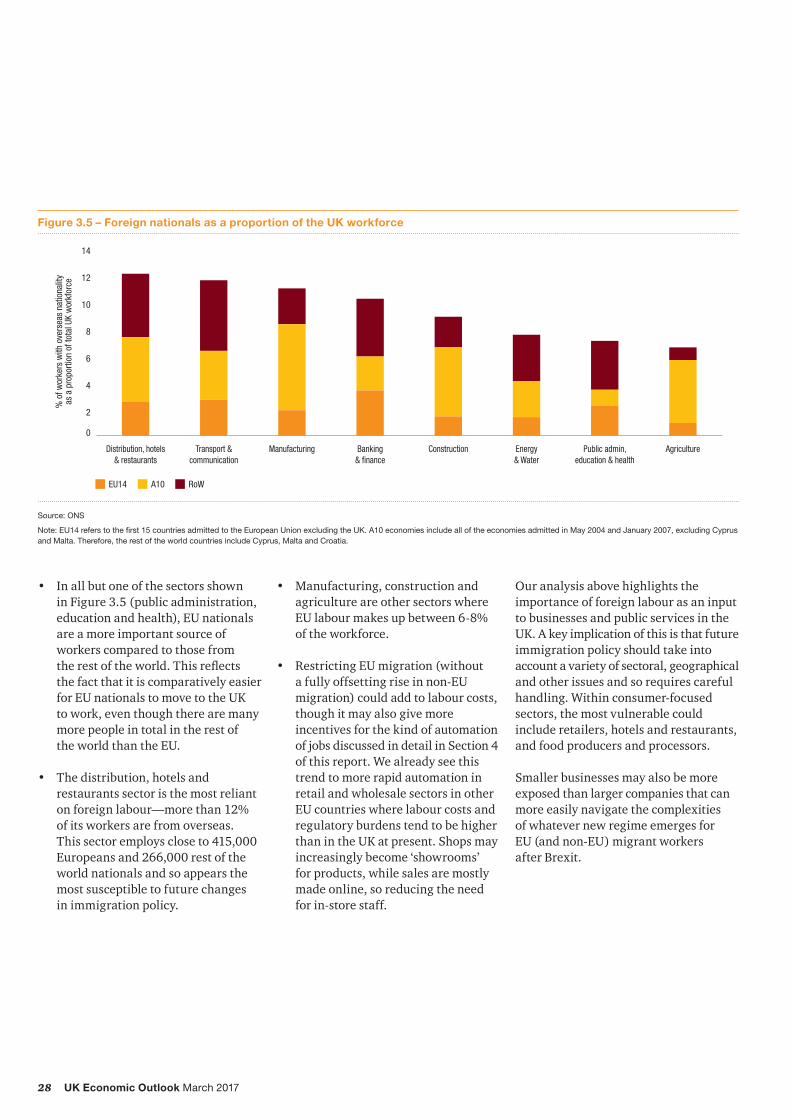
How reliant are different sectors of the UK economy on EU migrant labour?9 ToanswerthisquestionwelookedatONS data on the breakdown of foreign nationals in the UK workforce. Our analysis in Figure 3.5 shows that:
• Around one in ten workers across the UK are foreign nationals with around 6% of jobs held by workers from other EU countries whilst around 4% are held by workers from the rest of the world. The majority of the EU workers in jobs in the UK are from Eastern Europe, though numbers from countries like France, Spain, Greece and Italy have risen due to the high unemployment rates in these countries followingthefinancialcrisis.
28 UK Economic Outlook March 2017
• In all but one of the sectors shown in Figure 3.5 (public administration, education and health), EU nationals are a more important source of workers compared to those from therestoftheworld.Thisreflects the fact that it is comparatively easier for EU nationals to move to the UK to work, even though there are many more people in total in the rest of the world than the EU.
• The distribution, hotels and restaurants sector is the most reliant on foreign labour—more than 12% of its workers are from overseas. This sector employs close to 415,000 Europeans and 266,000 rest of the world nationals and so appears the most susceptible to future changes in immigration policy.
• Manufacturing, construction and agriculture are other sectors where EU labour makes up between 6-8% of the workforce.
• Restricting EU migration (without a fully offsetting rise in non-EU migration) could add to labour costs, though it may also give more incentives for the kind of automation of jobs discussed in detail in Section 4 of this report. We already see this trend to more rapid automation in retail and wholesale sectors in other EU countries where labour costs and regulatory burdens tend to be higher than in the UK at present. Shops may increasingly become ‘showrooms’ for products, while sales are mostly made online, so reducing the need for in-store staff.
Figure 3.5 – Foreign nationals as a proportion of the UK workforce
Source: ONS
Note: EU14 refers to the first 15 countries admitted to the European Union excluding the UK. A10 economies include all of the economies admitted in May 2004 and January 2007, excluding Cyprus and Malta. Therefore, the rest of the world countries include Cyprus, Malta and Croatia.
EU14 A10
% o
f wor
kers
with
ove
rsea
s na
tiona
lity
as a
pro
porti
on o
f tot
al U
K w
orkf
orce
RoW
0
2
4
6
8
10
12
14
AgriculturePublic admin,education & health
Energy& Water
ConstructionBanking& finance
ManufacturingTransport &communication
Distribution, hotels& restaurants
Our analysis above highlights the importance of foreign labour as an input to businesses and public services in the UK. A key implication of this is that future immigration policy should take into account a variety of sectoral, geographical andotherissuesandsorequirescarefulhandling. Within consumer-focused sectors, the most vulnerable could include retailers, hotels and restaurants, and food producers and processors.
Smaller businesses may also be more exposed than larger companies that can more easily navigate the complexities of whatever new regime emerges for EU (and non-EU) migrant workers after Brexit.
29UK Economic Outlook March 2017
3.7 – Summary and conclusions
Consumer spending has been growing relatively strongly in the past four years on the back of robust employment growth,lowinflation(particularlyin2015-16) and continued very low interest rates. In addition, increased consumer confidence,despiterecenteconomic and political uncertainties, has been reflectedinadeclininghouseholdsavings ratio driven primarily by increased consumer borrowing.
Looking ahead our analysis suggests that a downward trajectory in the adjusted savings ratio is expected to continue for a year or two before levelling off. But the exactprofileofthisratioremainshighlyuncertain. Meanwhile, real disposable incomegrowthwillbesqueezedbyrisinginflationandsofteningemploymentgrowth this year and next.
In our main scenario, we therefore project that real consumer spending growth will ease from around 3% in 2016 to around 2% in 2017 and 1.7% in 2018, before returning to around 2% trend growth in 2020 and beyond. Other scenarios show medium-term real consumer spending growth rates in the range of around 1-3% per annum up to 2020, however, so businesses need to plan for alternative outcomes.
We project that housing and utilities will continue to make up a rising share of total consumer spending, reaching around 29% by 2030 compared to around 25% in 2016. We also expect thatfinancialservicesandpersonalcarewill take a rising share of total consumer spending, while clothing, food, alcohol and tobacco will continue their relative long-term decline.
Brexit adds an additional layer of uncertainty to our consumer spending projections, but we can analyse some potential impacts relating to the weaker pound and possibly future changes in migration policy after the UK leaves the EU. Onthefirsttopic,ouranalysisshowsthatthe clothing and food sectors are potentially most exposed to the fall in sterling due to their high reliance on imports.
Meanwhile, our analysis of sectors which are most reliant on migrant EU labour shows that the retail, hotel and restaurants sectors could prove to be mostvulnerabletoanysignificantrestrictions on EU workers coming to the UK after Brexit, together with food production and processing and construction. Such sectors need to start making plans now both to help existing EU workers to register as UK residents where possible, and to consider other options like expanding recruitment and training of UK nationals (or non-EU nationals if migration regimes for these are relaxed after Brexit, though this is not current government policy).
Possible reduced availability of relatively low cost labour from other EU countries after Brexit might also increase the incentive for automation in the most affected sectors, as discussed further in the next section of this report.
In summary, while total consumer spending growth is likely to moderate in 2017-18, the aggregate picture does not look too bad. But some consumer-focused sub-sectors are likely to see relatively slower long term spending growth and this will be combined with possible adverse effects from the weaker pound, other cost pressures and potential future migration constraints after Brexit. Businesses in these sectors therefore need to start making appropriate plans now to adjust to alternative post-Brexit scenarios as and when they arise.
30 UK Economic Outlook March 2017
4 – Will robots steal our jobs? The potential impact of automation on the UK and other major economies1
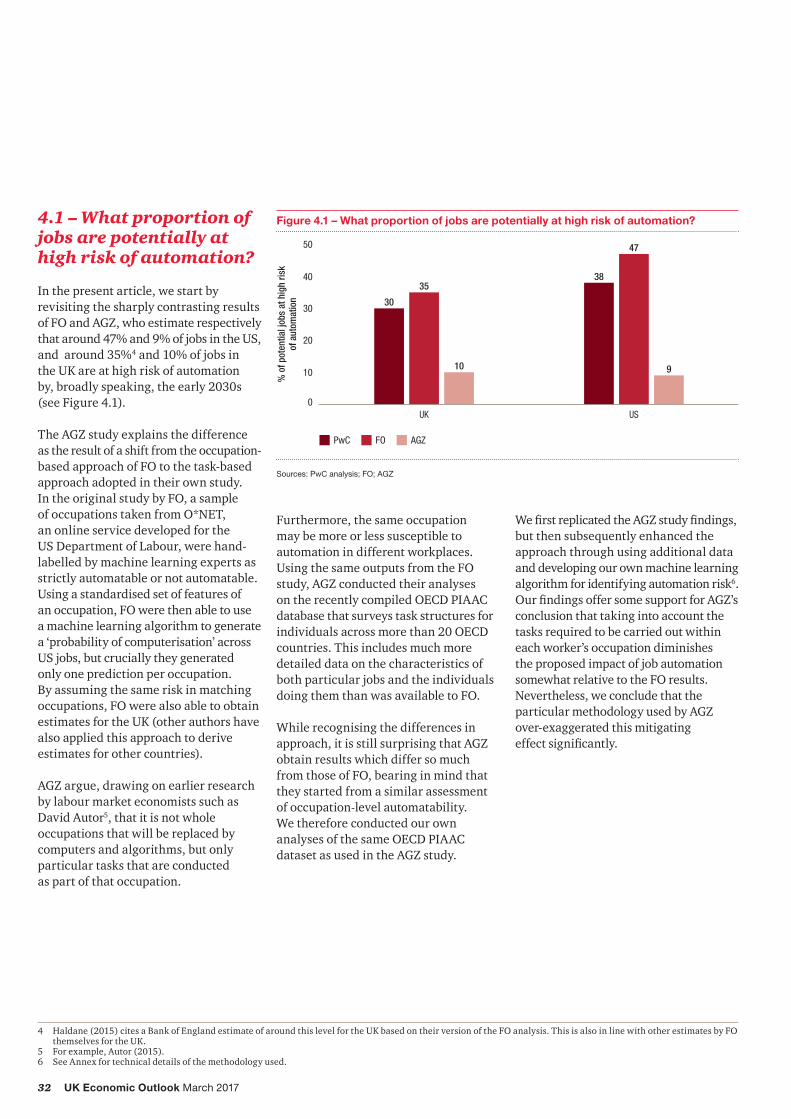
Key points• Our analysis suggests that up to 30%
of UK jobs could potentially be at high risk of automation by the early 2030s, lower than the US (38%) or Germany (35%), but higher than Japan (21%).
• The risks appear highest in sectors such as transportation and storage (56%), manufacturing (46%) and wholesale and retail (44%), but lower in sectors like health and social work (17%).
• For individual workers, the key differentiating factor is education. For those with just GCSE-level education or lower, the estimated potential risk of automation is as high as 46% in the UK, but this falls to only around 12% for those with undergraduate degrees or higher.
• However, in practice, not all of these jobs may actually be automated for a variety of economic, legal and regulatory reasons.
IntroductionThe potential for job losses due to advances in technology is not a new phenomenon. Most famously, the Luddite protest movement of the early 19th century was a backlash by skilled handloom weavers against the mechanisation of the British textile industry that emerged as part of the Industrial Revolution (including the Jacquardloom,whichwithitspunchcard system was in some respects a forerunner of the modern computer). But, in the long run, not only were there still many (if, on average, less skilled) jobs in the new textile factories but, more importantly, the productivity gains from mechanisation created huge new wealth. This in turn generated many more jobs across the UK economy in the long run than were initially lost in the traditional handloom weaving industry.
The standard economic view for most of the last two centuries has therefore been that the Luddites were wrong aboutthelong-termbenefitsofthe new technologies, even if they were right about the short-term impact on their personal livelihoods. Anyone putting such arguments against new technologies has generally been dismissed as believing in the ‘Luddite fallacy’.
• Furthermore new automation technologies in areas like AI and robotics will both create some totally new jobs in the digital technology area and, through productivity gains, generate additional wealth and spending that will support additional jobs of existing kinds, primarily in services sectors that are less easy to automate.
• The net impact of automation on total employment is therefore unclear. Average pre-tax incomes should rise due to the productivity gains,butthesebenefitsmaynotbeevenly spread across income groups.
• There is therefore a case for some form of government intervention to ensure that the potential gains from automation are shared more widely across society through policies like increased investment in vocational education and training. Universal basic income schemes may also be considered, though these suffer from potential problems in terms of affordability and adverse effects on the incentives to work and generate wealth.
1 This article was written by Richard Berriman, a machine learning specialist and senior consultant in PwC’s Data Analytics practice, and John Hawksworth, chief economist at PwC. Additional research assistance was provided by Christopher Kelly and Robyn Foyster.
31UK Economic Outlook March 2017
However, over the past few years, fears of technology-driven job losses have re-emerged with advances in ‘smart automation’ – the combination of AI, robotics and other digital technologies that is already producing innovations like driverless cars and trucks, intelligent virtual assistants like Siri, Alexa and Cortana, and Japanese healthcare robots.
While traditional machines, including fixedlocationindustrialrobots,replacedour muscles (and those of other animals like horses and oxen), these new smart machines have the potential to replace our minds and to move around freely in the world driven by a combination of advanced sensors, GPS tracking systems and deep learning, if not now then probably within the next decade or two. Will this just have the same effects as past technological leaps – short term disruption more than offset by long term economic gains – or is this something more fundamental in terms of taking humans out of the loop not just in manufacturing and routine service sector jobs, but more broadly across the economy? What exactly will humans have to offer employers if smart machines can perform all or most of their essential tasks better in the future2? In short, has the Luddite fallacyfinallycometrue?
2 Martin Ford, The Rise of the Robots(OneworldPublications,2015)isoneparticularlyinfluentialexampleofanauthorsettingoutthisargumentindetail.3 Inbothstudies,thisisdefinedasanestimatedprobabilityof70%ormore.Forcomparability,weadoptthesamedefinitionof‘highrisk’inthisarticle.
This debate was given added urgency in 2013 when researchers at Oxford University (Frey and Osborne, 2013) estimated that around 47% of total US employment had a “high risk of computerisation” over the next couple of decades – i.e. by the early 2030s.
However, there are also dissenting voices. Notably,Arntz,GregoryandZierahn(OECD, 2016) last year re-examined the research by Frey and Osborne and, using an extensive new OECD data set, came up with a much lower estimate that only around 10% of jobs were under a “high risk3 of computerisation”. This is based on the reasoning that any predictions of job automationshouldconsiderthespecifictasks that are involved in each job rather than the occupation as a whole.
Inthisarticlewepresentthefindingsfrom our own analysis of this topic, which builds on the research of both Frey and Osborne (hereafter ‘FO’) andArntz,GregoryandZierahn(hereafter‘AGZ’).Wethengoontodiscuss caveats to these results in terms of non-technological constraints on automation and potential offsetting job creation elsewhere in the economy (thoughthisismuchhardertoquantify).
The discussion is structured as follows:
Section 4.1 What proportion of jobs are potentially at high risk of automation?
Section 4.2 Which industry sectors and types of workers could be at the greatest risk of automation in the UK?
Section 4.3 Why does the potential risk of job automation vary by industry sector?
Section 4.4 How does the UK compare to other major economies?
Section 4.5 What economic, legal and regulatory constraints might reduce automation in practice?
Section 4.6 What offsetting job and income gains might automation generate?
Section 4.7 What implications might these trends have for public policy?
Section 4.8 Summary and conclusions.
Further details of the methodology behind our analysis in Sections 4.1-4.4 are contained in a technical annex at the end of this article, together with references to the other books and studies cited.
32 UK Economic Outlook March 2017
4.1 – What proportion of jobs are potentially at high risk of automation?
In the present article, we start by revisiting the sharply contrasting results ofFOandAGZ,whoestimaterespectivelythat around 47% and 9% of jobs in the US, and around 35%4 and 10% of jobs in the UK are at high risk of automation by, broadly speaking, the early 2030s (see Figure 4.1).
TheAGZstudyexplainsthedifferenceas the result of a shift from the occupation-based approach of FO to the task-based approach adopted in their own study. In the original study by FO, a sample of occupations taken from O*NET, an online service developed for the US Department of Labour, were hand-labelled by machine learning experts as strictly automatable or not automatable. Using a standardised set of features of an occupation, FO were then able to use a machine learning algorithm to generate a ‘probability of computerisation’ across US jobs, but crucially they generated only one prediction per occupation. By assuming the same risk in matching occupations, FO were also able to obtain estimates for the UK (other authors have also applied this approach to derive estimates for other countries).
AGZargue,drawingonearlierresearchby labour market economists such as David Autor5, that it is not whole occupations that will be replaced by computers and algorithms, but only particular tasks that are conducted as part of that occupation.
Figure 4.1 – What proportion of jobs are potentially at high risk of automation?
0
10
20
30
40
50
USUK
PwC FO AGZ
% o
f pot
entia
l job
s at
hig
h ris
kof
aut
omat
ion 30
35
10
38
47
9
Sources: PwC analysis; FO; AGZ
4 Haldane (2015) cites a Bank of England estimate of around this level for the UK based on their version of the FO analysis. This is also in line with other estimates by FO themselves for the UK.
5 For example, Autor (2015).6 See Annex for technical details of the methodology used.
Furthermore, the same occupation may be more or less susceptible to automation in different workplaces. Using the same outputs from the FO study,AGZconductedtheiranalyses on the recently compiled OECD PIAAC database that surveys task structures for individuals across more than 20 OECD countries. This includes much more detailed data on the characteristics of both particular jobs and the individuals doing them than was available to FO.
While recognising the differences in approach,itisstillsurprisingthatAGZobtain results which differ so much from those of FO, bearing in mind that they started from a similar assessment of occupation-level automatability. We therefore conducted our own analyses of the same OECD PIAAC datasetasusedintheAGZstudy.
WefirstreplicatedtheAGZstudyfindings,butthensubsequentlyenhancedtheapproach through using additional data and developing our own machine learning algorithm for identifying automation risk6. OurfindingsoffersomesupportforAGZ’sconclusion that taking into account the tasksrequiredtobecarriedoutwithineach worker’s occupation diminishes the proposed impact of job automation somewhat relative to the FO results. Nevertheless, we conclude that the particularmethodologyusedbyAGZover-exaggerated this mitigating effectsignificantly.
33UK Economic Outlook March 2017
Specifically,basedonourownpreferredmethodology, we found that around 30% of jobs in the UK are at potential high risk of automation and around 38% in the US. These estimates are based on an algorithm linking automatability to the characteristics of the tasks involved in different jobs as well as those of the workers doing them (e.g. the education and training levels required).Ourestimatesaresomewhatlower than the original estimates by FO, but still much closer to those than to the 9-10%estimatesofAGZ(seeFigure4.1).
Figure 4.2 – Potential jobs at high risk of automation by country
0
10
20
30
40
50
JapanGermanyUSUK
% o
f pot
entia
l job
s at
hig
h ris
kof
aut
omat
ion 30
3835
21
Sources: ONS; PIAAC data; PwC analysis
7 We also produced estimates for South Korea, but the results – both in aggregate and for particular industry sectors – were very similar to those for Japan, so we do notreportthemhereforreasonofspace.AGZalsoestimatedverysimilarrisksforJapanandSouthKorea,albeitwithlowerrisklevelsthanourestimatesdueto the different methodology they applied to essentially the same data set.
Before exploring our results in more detail, we want to stress one important caveat that applies both to our results andthoseofFOandAGZ.Thisisthatthese are estimates of the potential impact of job automation based on anticipated technological capabilities of AI/robotics by the early 2030s. Not only is the pace of technological advance, and so the timing of these effects uncertain, but more importantly:
• not all of these technologically feasible job automations may occur in practice for the economic, legal and regulatory reasons discussed in Section 4.5 below; and
• even if these potential job losses do materialise, they are likely to be offset by job gains elsewhere as discussed in Section 4.6 below – the net long-term effect on total human employment could be either positive or negative.
Unfortunately,itismuchmoredifficulttoquantifytheeffectsofthesecaveats,particularly at the industry level, in part because the second one involves new types of jobs being created that do not even exist now. In contrast, we can try toquantifyandanalysethenumberofjobs at potential high risk of automation by country, industry sector and type of worker as discussed below. But, in interpreting these results, we should never lose sight of these two key caveats.
Intuitively, the main reason for this isbecausethespecificapproachused byAGZbiasedtheirresultstowards jobs having only a moderate risk of automation, but we found that this was more an artefact of their methodology than a true representation of the data (see Annex for more technical details of why we reach this conclusion).
Our algorithm could also be applied to other OECD countries in the PIAAC database. For the purpose of the current article, we focus on the results for the UK, US, Germany and Japan7. We found that both the US and Germany have an increased potential risk of job automation compared to the UK, whilst Japan has a decreased potential risk of job automation (see Figure 4.2). These reasons for these differences are explore further in Section 4.4 below.
34 UK Economic Outlook March 2017
4.2 – Which industry sectors and types of workers could be at the greatest potential risk of automation in the UK?
If, for the sake of illustration, we apply our 30% estimate from the previous section to the current number of jobs in the UK8, then we might conclude (subject to the caveats noted above) that several million jobs could potentially be at high risk of automation in the UK. Broken down by industry, over half of these potential job losses are in four key industry sectors: wholesale and retail trade, manufacturing, administrative and support services, and transport and storage (see Table 4.1 and Figure 4.3 for details).
Figure 4.3 – Potential jobs at high risk of automation by UK industry sector
0 2 4 6 8 10 12
Total UK job automation
Wholesale and retail trade
Manufacturing
Administrative and support service
Transportation and stoage
Professional, scientific and technical
Human health and social work
Accomodation and food service
Construction
Public administration and defence
Information and communication
Financial and insurance
Education
Other
UK jobs at high risk of automation (millions)
10.43
2.25
1.22
1.09
0.95
0.78
0.73
0.59
0.52
0.47
0.39
0.35
0.26
0.83
Sources: ONS; PIAAC data; PwC analysis
8 Inpractice,thetotalnumberofjobsintheUKislikelytobehigherbytheearly2030s,whichistheapproximatedatebywhichwe(andFO/AGZ)assumethesepotentialjob losses from automation might occur. But, since we do not have detailed job projections that far ahead, we present some illustrative estimates using current data (for 2016) instead.
35UK Economic Outlook March 2017
The magnitude of potential job losses by sector is driven by two main components: the proportion of jobs in a sector we estimate to have potential high risk of automation, and the employment share of that sector (see Figure 4.4 and Table 4.1). The industry sector that we estimate could face the highest potential impact of job automation is the transportation and storage sector, with around 56% of jobs at potential high risk of automation. However, this sector only accounts for around 5% of total UK jobs, so the estimated number of jobs at potential high risk is around 1 million, or around 9% of all potential job losses across the UK.
Instead the highest potential impact on UK jobs is in the wholesale and retail trade sector, with around 2.3 million jobs at potential high risk of automation (22% of all UK jobs estimated to be at high risk) given that this is the largest single sector in terms of numbers of employees. Manufacturing has a similar proportion of current jobs at potential high risk (46%), but lower total numbers at high risk of around 1.2 million due to it being a smaller employer. A further 0.7 million jobs could be at potential high risk of automation in human health and social work, but this is a much lower proportion of all jobs in that sector (around 17%).
Figure 4.4 – Potential impact of job automation by UK industry sector
0 5 10 15 200
10
20
30
40
50
60
70
% o
f pot
entia
l job
s at
hig
h ris
kof
aut
omat
ion
by s
ecto
r
Employment share by sector (%)Employment share by sector (%)
Wholesaleand retail trade
Human healthand social work
Professional,scientificand technical
Education
Administrativeand support service
Manufacturing
Accomm-odationand foodservice
Construction
Public administrationand defence
Information andcommunication
Financialand insurance
Transportationand storage
Sources: ONS; PIAAC data; PwC analysis
Table 4.1 – Employment shares, estimated proportion and total number of employees at potential high risk of automation for all UK industry sectors
Industry Employment share (%)
Job automation (% at potential
high risk)
Jobs at high risk of automation
(millions)
Wholesale and retail trade 14.8% 44.0% 2.25
Manufacturing 7.6% 46.4% 1.22
Administrative and support services 8.4% 37.4% 1.09
Transportation and storage 4.9% 56.4% 0.95
Professional, scientific and technical 8.8% 25.6% 0.78
Human health and social work 12.4% 17.0% 0.73
Accommodation and food service 6.7% 25.5% 0.59
Construction 6.4% 23.7% 0.52
Public administration and defence 4.3% 32.1% 0.47
Information and communication 4.1% 27.3% 0.39
Financial and insurance 3.2% 32.2% 0.35
Education 8.7% 8.5% 0.26
Arts and entertainment 2.9% 22.3% 0.22
Other services 2.7% 18.6% 0.17
Real estate 1.7% 28.2% 0.16
Water, sewage and waste management 0.6% 62.6% 0.13
Agriculture, forestry and fishing 1.1% 18.7% 0.07
Electricity and gas supply 0.4% 31.8% 0.05
Mining and quarrying 0.2% 23.1% 0.01
Domestic personnel and self-subsistence 0.3% 8.1% 0.01
Total for all sectors 100% 30% 10.4
Sources: ONS for employment shares (2016); PwC estimates for last two columns using PIAAC data
36 UK Economic Outlook March 2017
Which types of UK workers may be most affected by automation?
The potential impact of job automation also varies according to the characteristics oftheworkers.Onaverage,wefindthatmen and, in particular, those with lower levels of education (GCSE-level and equivalentonlyorlower)areatgreaterriskof job automation. This is characteristic of the sectors that are at highest estimated risk. For example, the transportation and storage, manufacturing, and wholesale and retail trade sectors have a relatively high proportion of low education employees (34%, 22%, and 28% respectively). Men also make up the great majorityoftheworkforceinthefirsttwoof these sectors (85% and 73%).
We also estimate that private sector employees and particularly those in SMEs are most at risk, which is linked to variations in job and employee characteristics (e.g. education and traininglevelsrequired).
Table 4.2 – Employment shares, estimated proportion and total number of employees at potential high risk of automation by UK worker characteristics
Worker characteristics Employment share (%)
Job automation (% at potential
high risk)
Jobs at potential high risk of automation
(millions)
Gender:
Female 46% 26% 4.1
Male 54% 35% 6.3
Education:
Low education (GCSE level or lower) 19% 46% 3.0
Medium education 51% 36% 6.2
High education (graduates) 30% 12% 1.2
Sources: PwC estimates using PIAAC data
Table 4.3 – Estimated proportion of employees at potential high risk of automation by UK employer characteristics
Employer characteristics
Job automation (% at potential
high risk)
Public sector 22%
Private sector 34%
Employees:
<11 30%
11-1000 32%
1000+ 24%
Sources: PwC estimates using PIAAC data
37UK Economic Outlook March 2017
9 Although the considerable growth of e-learning shows that there is scope for automation in education, this may widen access to courses rather than replacing human teachers altogether. For a discussion of how UK universities can prosper in a digital age, see this report: https://www.pwc.co.uk/assets/pdf/the-2018-digital-university-staying-relevant-in-the-digital-age.pdf
4.3 – Why does potential risk of job automation vary by industry sector?
Task composition
One of the main drivers of a job being at potential high risk of automation is the composition of tasks that are conducted. Workers in high automation risk industries such as transport and manufacturing
Figure 4.5 – Task composition for UK employees in transportation and storage, manufacturing, and education industry sectors
Sources: PIAAC data; PwC analysis
0 50 100 150 200
Manual tasks
Routine tasks
Computation
Management
Social skills
Literacy skills
0 50 100 150 200
Transportation and storage Manufacturing Education
22%
38%7%
20%
11%2% 2%
12%
19%
13%
20%
33%
11%
27%
12%22%
22%
6%
Compared to UK average (%) Compared to UK average (%) Compared to UK average (%)
Manual tasks
Routine tasks
Computation
Management
Social skills
Literacy skills
0 50 100 150 200
143
51
68
87
59
127
131
64
80
81
108
110
69
179
144
94
96
90
Manual tasks
Routine tasks
Computation
Management
Social skills
Literacy skills
spend a much greater proportion of their timeengagedinmanualtasksthatrequirephysical exertion and/or routine tasks such asfillingformsorsolvingsimpleproblems.In contrast, in lower automation risk industries such as education, there is an increased focus on social and literacy skills, as shown in Figure 4.5, which are relatively less automatable9.
38 UK Economic Outlook March 2017
Figure 4.6 – Task composition comparison for UK employees in wholesale and retail trade, and human health and social work industry sectors
Sources: PIAAC data; PwC analysis
-10 -5 0 5 10
Wholesale and retail trade Increased task share in humanhealth vs wholesale
Human health and social work
18%
31%
10%
26%
14%2%
14%
31%
10%
22%
18%
4%
-3
3
4
-4
0
0
Manual tasks
Routine tasks
Computation
Management
Social skills
Literacy skills
Worker and job characteristics
Task composition of jobs is not, however, the only driver of high automation risk. In the two largest sectors by employment share - wholesale and retail trade and human health and social work - there are broadly comparable task compositions (see Figure 4.6). However, the proportion of jobs at potential high risk of automation is over 2.5x greater in the wholesale and retail trade (44%) than for health and social work (17%).
Insteaddifferencesinjobrequirementsare the main factors that cause the risk of automation to differ between these twosectors,mostlysignificantlyasregards education.
Onthewhole,educationrequirementsare higher in the human health and social work sector, with more than twice the proportion of employees having high education levels (i.e. degree level or higher): 33% compared with 15% in wholesale and retail. Health and social work also has much lower proportions of low education workers (i.e. GCSE level or lower): 11% compared with 28% in wholesale and retail (see Figure 4.7).
Figure 4.7 – Potential impact of job automation by education level for UK employees in wholesale and retail trade, and human health and social work industry sectors
0
10
20
30
40
50
60
High education(graduates)
Medium EducationLow education(GCSE level or lower)
Wholesale and retail trade Human health and social work
% o
f pot
entia
l job
s at
high
risk
of a
utom
atio
n
28
11
57 56
15
33
Sources: PIAAC data; PwC analysis
39UK Economic Outlook March 2017
Table 4.4 – Job characteristics for UK employees in wholesale and retail trade, and human health and social work industry sectors
Wholesale and retail trade
Human health and social work
National average
Required >1 year work experience 32% 48% 47%
High educational job requirements 14% 44% 33%
More training required at work 14% 29% 21%
Moderate/complex computer use at work 51% 61% 68%
Feel challenged at work 11% 15% 12%
Responsible for staff 30% 41% 35%
Co-operate with others > 25% of the time 73% 77% 70%
Sources: PIAAC data; PwC analysis
4.4 – How does the UK compare to other major economies?
As shown in Figure 4.2 earlier in this article, we estimate that there is a greater potential impact of job automation in the US (38%) and Germany (35%) compared to the UK (30%), but a decreased potential impact in Japan (21%). As with the UK, the potential impact of job automation in other countries is driven by the industry composition of the country (i.e. the employment shares across sectors) and the relative proportion of jobs at high risk of automation in each of those sectors. However, a greater proportion of the variation between countries is explained by differences in the automatability of jobs within sectors.
The difference in education levels is also reflectedinthejobcharacteristicsforemployees in the health and social work sector. There is a much higher proportion of employees that need work experience prior to employment, have higher educationalrequirementsintheircurrent role, and are engaged in more training at work (see Table 4.4).
A more detailed examination of the occupations in both sectors also reveals that a higher proportion of occupations in health and social work are jobs that are far less automatable than in wholesale and retail trade. In particular, sales workers that comprise the majority of employment share in the wholesale and retail trade sector have twice the job automation potential (38%) compared with personal care workers in the human health and social work sector (18%).
The human health and social work sector also has a high proportion of employees (23%) in health professional or health associate professional occupations, which have particularly low automation potential according to our methodology. Advances we have seen in recent years in Japan in healthcare robots might suggest some of these model estimates could prove too low as this technology develops further and spreads to the UK, although some of these may be working with rather than replacing human workers. Similarly surgeons may be able to conduct operations remotely now using digitally-controlled robotics, but (at least for the moment) we are some way from robot surgeons carrying out operations unaided.
40 UK Economic Outlook March 2017
Why is the estimated risk of job automation higher in the US than the UK?
Wefindthatthelargerproportionofjobs at potential high risk of automation in the US is almost exclusively driven by differences in the automatability of jobs for given industry sectors. The US has a similarly service-dominated economy to the UK with relatively little difference in employment shares by industry sector (see middle panel of Figure 4.8). However, several important industry sectors showsignificantlyhigherpotentialjobautomation risks in the US than in the UK (see bottom panel in Figure 4.8).
Themostsignificantexamplehere isthefinancialandinsurancesector,where automatability is assessed to be much higher in the US (61%) than the UK (32%). Further analysis of the data suggests that the key difference is related totheaverageeducationlevelsoffinanceprofessionalsbeingsignificantlyhigherintheUKthantheUS.Thismayreflectthe greater weight in the UK of City of Londonfinanceprofessionalsworkingininternational markets, whereas in the US there is more focus on the domestic retail market and many more workers who do not need to have the same educational levels. The jobs of these US retail financialworkersareassessedbyourmethodologyasbeingsignificantlymoreroutine – and so more automatable – then theaveragefinancesectorjobintheUK,with its greater weight on international financeandinvestmentbanking.
Figure 4.8 – Comparison of potential jobs at high risk of automation between UK and US
Sources: PIAAC data; PwC analysis
% o
f pot
entia
l job
s at
high
risk
of a
utom
atio
n
0
10
20
30
40
50
US jobautomation
Impact ofautomation
Impact of industrycomposition
UK jobautomation
30 0
8 38
UK vs US
Wholesale and retail trade
Manufacturing
Administrative and support service
Professional, scientific and technical
Human health and social work
Accommodation and food service
Construction
Public administration and defence
Transportation and storage
Information and communication
Financial and insurance
Education
Arts and entertainment
-40 -30 -20 -10 0 10 20 30 40
US employment share relative to UK (%)
-1
0
1
-2
-2
1
2
0
0
0
1
-1
0
Wholesale and retail trade
Manufacturing
Administrative and support service
Professional, scientific and technical
Human health and social work
Accommodation and food service
Construction
Public administration and defence
Transportation and storage
Information and communication
Financial and insurance
Education
Arts and entertainment
-40 -30 -20 -10 0 10 20 30 40
US job automatability relative to UK (%)
3
6
-2
20
7
8
19
11
1
18
29
3
-5
41UK Economic Outlook March 2017
Why is the estimated risk of job automation higher in Germany than the UK?
In Germany, by contrast, the greater proportion of jobs at potential high risk of automation is driven by broadly similarsizedimpactsfrombothindustrycomposition and job automatability by sector (see Figure 4.9). In particular, Germany has a higher share of employment in the manufacturing sector than the UK, and manufacturing has a relatively large proportion of jobs at high risk of automation. At the individual sector level, relative automatability levels are varied, but on average higher in Germany.
This is most marked for construction, where the proportion of jobs at high risk of automation is estimated at 41% in Germany but only 24% in the UK. The main difference is that for those working in building and related trades in Germany, 60% of all tasks are either manual or routine, while in the UK these account for only 48% of tasks. Instead there is a greater proportion of time spent on management tasks in the UK, such as planning and consulting others, andthosethatrequiresocialskillssuchas negotiating.
UK construction workers are therefore classifiedasbeinglessautomatableonaverage than their German counterparts. Any automation in the construction sectorwillrequiremajoradvancesinmobile robotics by the early 2030s if our estimates are to prove reliable. It is also unclear here, as in many other sectors, how far these kind of construction robots will work alongside human workers, complementing and enhancing their productivity, rather than replacing them totally. At the very least, there may be a long-lasting intermediate stage in the use of robots in construction and other sectors involving manual tasks outside tightly controlled factory or warehouse conditions.
Figure 4.9 – Comparison of potential jobs at high risk of automation between UK and Germany
Sources: PIAAC data; PwC analysis
% o
f pot
entia
l job
s at
high
risk
of a
utom
atio
n
0
10
20
30
40
50
German jobautomation
Impact ofautomation
Impact of industrycomposition
UK jobautomation
30 23 35
UK vs Germany
Wholesale and retail trade
Manufacturing
Administrative and support service
Professional, scientific and technical
Human health and social work
Accommodation and food service
Construction
Public administration and defence
Transportation and storage
Information and communication
Financial and insurance
Education
Arts and entertainment
-40 -30 -20 -10 0 10 20 30 40
German employment share relative to UK (%)
0
11
0
-1
-2
1
-2
-1
-2
-1
0
-3
-1
Wholesale and retail trade
Manufacturing
Administrative and support service
Professional, scientific and technical
Human health and social work
Accommodation and food service
Construction
Public administration and defence
Transportation and storage
Information and communication
Financial and insurance
Education
Arts and entertainment
-40 -30 -20 -10 0 10 20 30 40
German job automatability relative to UK (%)
-2
2
-7
8
-4
7
5
17
-3
2
8
0
-7
42 UK Economic Outlook March 2017
Why is the estimated risk of job automation lower in Japan than the UK?
In Japan there is a lower proportion of jobs at high risk of automation than the UK, despite having an industry composition that (like Germany) is more focused on manufacturing, which is one of the most automatable sectors. However, this industry mix effect is more than offset by the lower average automatability of most individual sectors in Japan relative to the UK, as shown in Figure 4.10.
One sector of particular interest because of its high total employment level is the wholesale and retail trade. In Japan, the proportion of jobs at high risk of automation in this sector is estimated at only around 25% as compared to around 44% in the UK
For retail sales workers, we found that the lower proportion of jobs at high risk of automation in Japan is partly due to a lower proportion of time conducting manual tasks compared with management tasks, such as planning or organising. Perhaps linked to this, sales workers in Japan are far more likely to need further training at work (60% comparedwith10%)andasignificantlyhigher proportion feel challenged at work (65% compared with 8%).
Whether these projections hold true in the longer run depends on whether there are moves in Japan to change the nature of retailing, making it less labour-intensive on the US or UK model. This might involve customers doing more self-service in Japan than they do now, so reducing the need for skilled sales staff and increasing the need and scope for automation.
Figure 4.10 – Comparison of potential jobs at high risk of automation between UK and Japan
Sources: PIAAC data; PwC analysis
% o
f pot
entia
l job
s at
high
risk
of a
utom
atio
n
0
10
20
30
40
50
Japan jobautomation
Impact of automation
Impact of industrycomposition
UK jobautomation
304 -13
21
UK vs Japan
Wholesale and retail trade
Manufacturing
Administrative and support service
Professional, scientific and technical
Human health and social work
Accommodation and food service
Construction
Public administration and defence
Transportation and storage
Information and communication
Financial and insurance
Education
Arts and entertainment
-40 -30 -20 -10 0 10 20 30 40
Japan employment share relative to UK (%)
2
10
0
0
-4
-2
0
0
-1
0
-1
-4
0
Wholesale and retail trade
Manufacturing
Administrative and support service
Professional, scientific and technical
Human health and social work
Accommodation and food service
Construction
Public administration and defence
Transportation and storage
Information and communication
Financial and insurance
Education
Arts and entertainment
-40 -30 -20 -10 0 10 20 30 40
Japan job automatability relative to UK (%)
-19
-16
-17
-23
-1
-6
-7
2
-16
-8
-19
-5
-1
43UK Economic Outlook March 2017
4.5 – What economic, legal and regulatory constraints might restrict automation in practice?
So far the analysis has focused on the technical feasibility of automation based on the characteristics of the jobs (e.g.thetasksrequiredtobedone)andtheir typical workers (e.g. education levels). But, in practice, we recognise that actual future levels of job automation may fall below these levels – or at least take longer to reach them than we might expect on purely technological grounds.
Economic constraints
Thefirstimportantconstrainthereiseconomic – just because it is technically feasible to replace a human worker with a robot, for example, does not mean that it would be economically attractive to do so. This will depend on the relative costs of robots (including energy inputs, maintenance and repairs) relative to human workers, as well as their relative productivity.
In recent years, we have seen rapid total employment growth in the UK, driven in part by relatively subdued (or negative) real wage growth.
Furthermore,arelativelyflexibleUKlabour market that has been open to migration from the EU in particular has made it a comparatively attractive option for companies in many sectors to expand by hiring more people, rather than incurring potentially large up-front costs by investing in new technologies such as AI and mobile robots, which will also seem relatively risky as they may not have been widely tested in practice.
Why take the risk of such investments when there is a low risk, low cost human alternative? Such considerations would apply in sectors like transport, retail and wholesale, hotels and restaurants, and food processing.
Over time, however, we would expect these economic factors to become less significantasthecostofthenewdigitaltechnologiesfalls(quitepossiblyveryrapidly if a robotic version of Moore’s Law turns out to apply) and they become more widely adopted, leading them to seem less risky and untested by companies that were not early adopters. But it remains highly uncertain in many sectors with low current adoption of robots when the ‘tipping point’ to much higher adoption will be reached. Organisational inertia and legacy systems may push back the timing of any such shifts towards automation even if they become technically and economically feasible.
Legal and regulatory constraints
Even if economic barriers to adopting automation can eventually be overcome, however,therecouldalsobesignificantlegal and regulatory hurdles to negotiate.
In the case of driverless vehicles10, for example, the issue of who bears the liabilityforaccidentsisadifficultone to resolve – is it the car manufacturer, the manufacturer of the sensors on the car, the provider of the computer software that makes driving decisions, or some combination of these and other suppliers? What about the liability of the human passenger if he or she is expected to take manual control of the vehicle when signalled to do so by the vehicle’s computer but failed to do so? And should driverless cars be expected to satisfy higher safety standards then human drivers if that is one of their key selling points?
In the long run, we would expect these kind of legal and regulatory barriers to be overcome in those industries where automation makes economic sense and is technically feasible. But there may often be powerful vested interests arguing against too rapid an advance in automation, so it may well be that realisation of the full potential automation mayoccursignificantlylaterthantheearly 2030s timescale we assume in this report (in line with the original FO study).
10 For a more detailed discussion of these issues, see PwC Strategy&’s 2016 Connected Car report here: http://www.strategyand.pwc.com/reports/connected-car-2016-study
44 UK Economic Outlook March 2017
4.6 – What offsetting job and income gains might automation generate?
Another key caveat noted earlier in this article is that we have focused so far on estimating the potential job losses from automation. In practice, however, there shouldalsobesignificantgainsfromthese technologies in terms of:
• completely new types of jobs being created related to these new digital technologies; and
• moresignificantlyinquantitativeterms, the wealth from these innovations being recycled into additional spending, so generating demand for extra jobs in less automatable sectors where humans retain a comparative advantage over smart machines.
These offsetting gains are not easy to quantify,butinanearlierPwCstudy11 with Carl Frey, we estimated that around 6% of all UK jobs in 2013 were of a kind that did not exist at all in 1990. Moreover, in London, this proportion rose to around 10% of all jobs. These were mostly related to new digital technologies such as computing and communications. Similarly, by the 2030s, 5% or more of UK jobs may be in areas related to new robotics/AI of a kind that do not even existnow.Itisverydifficulttoknow what these new types of jobs will be in advance, but past experience suggests that there will be some job gains from thissource,albeitprobablysignificantlyless than the around 30% potential job losses from automation discussed above.
Themoresignificantoffsettingfactoristhat these new automated technologies will boost productivity considerably over time12 (if not, they will not be adopted on economic grounds). This will generate extra incomes, initially for the owners oftheintellectualandfinancialcapitalbehind the new technologies, but feeding into the wider economy as this income is spent or invested in other areas. This additional demand will generate increased jobs and incomes in sectors that are less automatable, including healthcare and other personal services where robots may not be able to totally replace, as opposed to complement and enhance, workers with the human touch for the foreseeable future13.
The historical evidence suggests that this will eventually lead to:
• broadly similar overall rates of employment for human workers, although with different distributions across industry sectors and types of jobs than now;
• higher average real income levels across the country as a whole due to higher overall productivity;
• butquitepossiblyalsoamoreskewedincome distribution with a greater proportion going to those with the skills to thrive in an ever more digital economy – this would put a premium not just on education levels when entering the workforce, but also the ability to adapt over time and reskill throughout a working life.
11 C. Frey and J. Hawksworth (PwC, 2015): http://www.pwc.co.uk/assets/pdf/ukeo-regional-march-2015.pdf12 See,forexample,this2015PwCreportonthepotentialproductivitybenefitsofservicerobots:
14 An area where the UK lags well behind countries like Germany as highlighted in our 2016 Young Workers Index report here: http://www.pwc.co.uk/services/economics-policy/insights/young-workers-index.html
4.7 – What implications might these trends have for public policy?
The latter point raises important public policy issues. The less controversial one is that the government, working with employers and education providers, should invest more in the types of education and training that will be most useful to people in this increasingly automated world. Exactly how to identify theskillsthatwillberequiredanddevelopthe training is much more complex of course – for many people, this will involve an increased focus on vocational training14 that is constantly updated to stay one stepaheadoftherobots.Italsorequiresbetter matching of workers to the new opportunities that will arise in an increasingly digital economy. But the principle of investing more in education, skills and retraining seems widely accepted.
Central and local government bodies also needs to support digital sectors that can generate new jobs, for example through place-based strategies centred around university research centres, science parks and other enablers of business growth. This place-based approach is one of the key themes in the government’s new industrial strategy and its wider devolution agenda. It also involves extending the latest digital infrastructure beyond the major urban centres to facilitate small digital start-ups in other parts of the country.
45UK Economic Outlook March 2017
More controversial is whether governments should intervene more directly to redistribute income15. In particular, the idea of a universal basic income (UBI) has gained traction in Silicon Valley and elsewhere as a potential way to maintain the incomes of those who lose out from automation and (to be hard headed about it) whose consumption is important to keep the economy going. The problem with UBI schemes, however, is that they involve paying a lot of public money to many people who do not need it, as well as those that do. As such the danger is that such schemes are either unaffordable or destroy incentives to work and generate wealth, or they need to be set too low to provide an effective safety net.
Nonetheless, we are now seeing practical trials of UBI schemes in a number of countries around the world including Finland, the Netherlands, some US andCanadianstates,IndiaandBrazil.The details of these schemes vary considerably, and it is beyond the scope of this article to review them in depth, but it seems likely that more pilot schemes of this kind will emerge around the world and that they will come on to the policy agenda in the UK as well. For the moment, theneedtoreducetheUKbudgetdeficitmaybeasignificantbarriertoanysuchscheme on a national level, as well as concerns about the social acceptability of giving people ‘money for nothing’. Butthewiderquestionofhowtodealwith possible widening income gaps arising from increased automation seems unlikely to go away.
15 AnotherideahereistherecentsuggestionofBillGatestotaxrobotswherethesedisplacehumanlabour.However,itisnotclearthatsuchaspecifictaxoninvestmentinrobotswouldbeeconomicallyefficient.Otherlabour-savingtechnologiesdonotfacesuchspecifictaxes,sowhysinglerobotsoutforsuchtreatmentandpotentiallyloseproductivity gains from such innovation and investment?
4.8 – Summary and conclusions
Our analysis suggests that around 30% of UK jobs could potentially be at high risk of automation by the early 2030s, lower than the US (38%) or Germany (35%), but higher than Japan (21%).
The risks appear highest in sectors such as transportation and storage (56%), manufacturing (46%) and wholesale and retail (44%), but lower in sectors like health and social work (17%).
For individual workers, the key differentiating factor is education. For those with just GCSE-level education or lower, the estimated potential risk of automation is as high as 46% in the UK, but this falls to only around 12% for those with undergraduate degrees or higher.
However, in practice, not all of these jobs may actually be automated for a variety of economic, legal and regulatory reasons.
Furthermore new technologies in areas like AI and robotics will both create some totally new jobs in the digital technology area and, through productivity gains, generate additional wealth and spending that will support additional jobs of existing kinds, primarily in services sectors that are less easy to automate.
The net impact of automation on total employment is therefore unclear. Average pre-tax incomes should rise due to the productivitygains,butthesebenefitswillprobably not be evenly spread across income groups. The pay premium for higher education and non-automatable skills will also probably rise ever higher.
There is therefore a case for some form of government intervention to ensure that the potential gains from automation are shared more widely across society through policies in areas like education, vocational training and job matching. Some form of universal basic income scheme might also be considered though this does face problems relating to affordability and potential adverse incentive effects that would need to be addressed.
46 UK Economic Outlook March 2017
Inthepresentstudy,wefirstrecreatedthedatasetfromArntz,GregoryandZieharn(AGZ,2016).Thiscomprised US data from the Programme for the International Assessment of Adult Competencies (PIAAC) database, merged with automatability data from FO. However, these sources use different occupationclassifications:the702O*NEToccupationsfromFOwereclassifiedusingtheStandardOccupationalClassification(SOC) 2010 codes, whilst the PIAAC databasecontainedoccupationsclassifiedusingthefirst2-digitsfromInternationalStandardClassificationofOccupations(ISCO-08) codes.
To map the FO data with SOC codes to the PIAAC data with ISCO-08 codes we used cross-walks from the US Census Bureau. This results in an expanded dataset with many-to-one relationships from the FO data to PIAAC data. As per AGZ,eachduplicatedcaseintheexpandeddataset was assigned a weight that sums to unity for each individual.
We then replicated the Expectation-Maximisation(EM)algorithmbyAGZthat iteratively: predicts the ‘probability of computerisation’ scores from FO using a fractional logit model, and thenre-calculatesthefirstweightsproportionally to the prediction residuals(seeAGZforfurtherdetails).Through this procedure we replicated the distribution of automatability in theUSfromAGZfortheoccupation- based and task-based approaches (see Figures 4.A1 and 4.A2 respectively).
Annex Technical details of our methodology
Figure 4.A2 – Replication of the AGZ task-based approach
However, we consider that the low proportion of jobs with ‘high automatability’ (i.e.>70%riskofautomation)inAGZ’stask-based approach is an artefact of their predictive model. To illustrate this we re-simulatedtheEMalgorithmfromAGZusing different sets of predictive features (see Figure 4.A3).
As the feature set increases from ‘feature set 1’ to ‘feature set 3’ and performance metricsoftheclassifierimprove,thetask-based approach curve shifts from the centre to more closely match the occupation-based approach distribution. Accordingly, the proportion of jobs estimated to have high automatability also increases. In other words, the more predictive the model the higher the estimation of high automatability jobs.
To improve the methodology we split the analytics into two parts: an initial application of the EM algorithm to only re-weight the cross-walked dataset, and a second phase of building an enhanced classifieralgorithm.Are-simulation of the task-based approach with the EM method for weights only is shown in Figure 4.A4.
The algorithm developed using the US extended dataset was then applied to the original US dataset and recalibrated accordingly. This enhanced and recalibrated model could then be applied to each of the other OECD countries. The present report contains results for the US, UK, Germany and Japan.
Figure 4.A3 – Re-simulated task-based approach
0.0
0.005
0.010
0.015
0.020
0.025
0.030
100806040200
Occupation-based approach Feature set 1 Feature set 2 Feature set 3
Arntz,M.,T.GregoryandU.Zierahn(2016),‘TheriskofautomationforjobsinOECDcountries:acomparativeanalysis’,OECDSocial,EmploymentandMigrationWorkingPapersNo189Autor, D. H. (2015), “Why are there still so many jobs? The history and future of workplace automation”, Journal of Economic Perspectives, 29(3), pp.3-30.Ford, M. (2015), The Rise of the Robots, Oneworld Publications.Frey, C.B. and M.A. Osborne (2013), The Future of Employment: How Susceptible are Jobs to Computerization?, University of Oxford.Frey, C.B. and J. Hawksworth (2015), ‘New job creation in the UK: which regions will gain the most from the digital revolution?’, PwC UK Economic Outlook, March 2015. Available from: http://www.pwc.co.uk/assets/pdf/ukeo-regional-march-2015.pdf Haldane, A. (2015) ‘Labour’s share’, speech to the TUC, London, 15 November 2015. Available from: http://www.bankofengland.co.uk/publications/Pages/speeches/2015/864.aspx PwC Strategy& Connected Car Report (2016). Available from: http://www.strategyand.pwc.com/reports/connected-car-2016-study PwC Technology Forecast (2015), ‘Service robots: the next big productivity platform’. Available from: http://www.pwc.com/us/en/technology-forecast/2015/robotics/features/service-robots-big-productivity-platform.html PwC (2016), The 2018 digital university: staying relevant in a digital age. Available here: https://www.pwc.co.uk/assets/pdf/the-2018-digital-university-staying-relevant-in-the-digital-age.pdf PwC (2016), Young Workers Index: Empowering a new generation. Available here: http://www.pwc.co.uk/services/economics-policy/insights/young-workers-index.html
48 UK Economic Outlook March 2017
Appendix A Outlook for the global economy
Table A.1 presents our latest main scenario projections for a selection of economies across the world.
World economic growth strengthened through 2016 and this is expected to continue, increasing the global weighted average real growth rate to 2.9% in 2017 and 3% in 2018 (using GDP at market exchange rates as weights). This growth is expected to be driven by the large emerging economies with continued strong growth of around 7-8% in India and around 6-6.5% in China projected for 2017 and 2018. The outlook for emerging markets has also improved as a result of improving economic conditions in RussiaandBrazil,whicharenowmoving out of recession.
Steady but moderate growth of around 1.6%isprojectedfortheEurozonein2017-18 although this is subject to potential political volatility due to upcoming elections in France and Germany. Relative to the rest of the G7, quitestronggrowthisprojectedfortheUSeconomyin2017-18asfiscalstimulusstrengthens an already recovering economy. But this could be offset by further gradual rises in US interest ratestokeepinflationundercontrol.
These projections are updated monthly in our Global Economy Watch publication, which can be found at www.pwc.com/gew
Table A.1: Global economic growth and inflation prospects
Share of world GDP
Real GDP growth (%) Inflation (%)
2016 at MERs 2017 2018 2017 2018
US 24.5% 2.2 2.4 2.3 2.5
China 15.2% 6.5 6.1 1.8 2.5
Japan 5.6% 0.5 0.7 1.3 1.5
UK 3.9% 1.6 1.4 2.3 2.8
France 3.3% 1.4 1.6 1.2 1.1
Germany 4.6% 1.6 1.5 1.8 1.9
Greece 0.3% 1.6 2.0 0.5 0.7
Ireland 0.4% 3.2 3.0 0.8 1.3
Italy 2.5% 1.0 1.1 1.1 0.8
Netherlands 1.0% 1.6 1.8 1.5 1.1
Portugal 0.3% 1.1 1.2 1.0 1.0
Spain 1.6% 2.3 1.9 1.3 1.1
Poland 0.6% 3.4 3.2 1.2 1.7
Russia 1.8% 1.0 1.1 5.6 4.8
Turkey 1.0% 2.9 3.2 8.1 8.4
Australia 1.7% 2.7 2.9 2.5 2.4
India 2.8% 7.3 7.7 5.0 5.3
Indonesia 1.2% 5.1 5.5 4.5 4.4
South Korea 1.9% 2.6 2.8 1.6 2.8
Argentina 0.9% 1.9 2.4 25 n/a
Brazil 2.4% 0.4 1.5 5.0 4.5
Canada 2.1% 1.9 2.1 1.9 2.0
Mexico 1.6% 1.8 2.1 3.4 3.0
South Africa 0.4% 1.0 1.7 6.0 5.7
Nigeria 0.7% 0.9 2.4 14.2 12.0
Saudi Arabia 0.9% 1.2 2.0 3.2 3.0
World (PPP) 3.4 3.5 3.1 3.0
World (Market Exchange Rates) 100% 2.9 3.0 2.7 2.6
Eurozone 15.8% 1.6 1.6 1.3 1.3
Source: PwC main scenario for 2017 and 2018; IMF for GDP shares in 2016 at market exchange rates (MERs).
49UK Economic Outlook March 2017
Appendix B UK economic trends: 1979 – 2016
Annual averages GDP growth Household expenditure
growth
Manufacturing output
growth*
Inflation (CPI**)
3 month interest rate (% annual
average)
Current account balance
(% of GDP)
PSNB*** (% of GDP)
1979 3.7 4.8 13.7 -0.6 4.3
1980 -2.0 0.1 16.6 0.5 3.9
1981 -0.8 0.3 13.9 1.5 3.1
1982 2.0 1.2 12.2 0.6 2.3
1983 4.2 4.4 10.1 0.2 3.0
1984 2.3 2.5 10.0 -0.5 3.3
1985 4.2 5.1 12.2 -0.3 2.6
1986 3.2 6.1 10.9 -1 2.0
1987 5.4 5.1 9.7 -1.6 1.3
1988 5.8 7.4 10.4 -3.6 -0.6
1989 2.6 3.9 5.2 13.9 -4.1 -0.6
1990 0.7 1.0 7.0 14.8 -3.1 0.6
1991 -1.1 -0.6 7.5 11.5 -1.3 2.6
1992 0.4 0.9 4.3 9.6 -1.5 5.6
1993 2.5 2.8 2.5 5.9 -1.3 6.8
1994 3.9 3.2 2.0 5.5 -0.5 5.8
1995 2.5 2.1 2.6 6.7 -0.7 4.7
1996 2.5 3.9 2.5 6.0 -0.6 3.3
1997 3.1 4.5 1.8 6.8 -0.2 1.6
1998 3.2 3.9 0.4 1.6 7.3 -0.4 -0.1
1999 3.3 4.9 0.6 1.3 5.4 -2.4 -1.1
2000 3.7 4.9 2.2 0.8 6.1 -2.1 -1.8
2001 2.7 3.5 -1.5 1.2 5.0 -1.9 -0.6
2002 2.4 3.7 -2.2 1.3 4.0 -2 1.6
2003 3.5 3.8 -0.6 1.4 3.7 -1.7 2.6
2004 2.5 3.3 1.8 1.3 4.6 -1.8 2.7
2005 3.0 3.0 0.0 2.1 4.7 -1.2 2.9
2006 2.5 1.8 2.2 2.3 4.8 -2.2 2.6
2007 2.6 3.0 0.6 2.3 6.0 -2.4 2.4
2008 -0.6 -0.8 -2.8 3.6 5.5 -3.5 5.2
2009 -4.3 -3.5 -9.4 2.2 1.2 -3 10.1
2010 1.9 0.7 4.6 3.3 0.7 -2.7 9.1
2011 1.5 -0.7 2.2 4.5 0.9 -1.8 7.1
2012 1.3 1.9 -1.5 2.8 0.8 -3.7 7.7
2013 1.9 1.6 -1.0 2.6 0.5 -4.4 5.9
2014 3.1 2.1 2.9 1.5 0.5 -4.7 5.6
2015 2.2 2.5 -0.2 0.0 0.6 -4.3 4.2
2016 1.8 3.1 0.7 0.7 0.5 -4.9 3.0
Average over economic cycles****
1979 - 1989 2.8 3.7 12.2 -0.8 2.2
1989 - 2000 2.3 3.0 3.3 8.3 -1.5 2.3
2000 - 2014 1.8 1.9 -0.2 2.2 3.3 -2.6 4.2
* After the revisions to the national accounts data, pre-1998 data is not currently available ** Pre-1997 data estimated *** Public Sector Net Borrowing (calendar years excluding public sector banks) **** Peak-to-peak for GDP relative to trend Sources: ONS, Bank of England
50 UK Economic Outlook March 201750
Contacts and services
EconomicsOur macroeconomics team produce the UK Economic Outlook three times a year.
The present report was written by John Hawksworth, Barret Kupelian, Richard Berriman and Duncan Mckellar.
For more information about the technical content of this report please contact:
In addition, we provide a range of macroeconomic consulting services for clients, including:
• Revenue forecasting
• Stress testing
• Economic impact analysis (including Brexit)
Forenquiriesconcerningthese services, please contact Jonathan Gillham on 07714 567 297 or Richard Snook on 020 7212 1195.
Our UK economics team is part of Strategy& PwC’s strategy consulting practice. Strategy& is a global team of practical strategists committed to helping youseizeessentialadvantage.
Our economics practice offers a wide range of services, covering competition and regulation issues, litigation support, bids and business cases, public policy and projectappraisals,financialeconomics,the economics of sustainability and macroeconomics.
For more information about these services please visit our website (www.pwc.co.uk/economics) or contact the relevant person from the list to the right.
Competition Economics Tim Ogier +44 (0)20 7804 5207
Daniel Hanson +44 (0)20 7804 5774
Luisa Affuso +44 (0)20 7212 1832
Economic Regulation David Armstrong +44 (0)28 9041 5716
Dan Burke +44 (0)20 7212 6494
Alastair Macpherson +44 (0)20 7213 4463
Stuart Cook +44 (0)20 7804 7167
Economic Appraisal Nick Forrest +44 (0)20 7804 5695
Jonathan Gillham +44 (0)7714 567 297
Andrew Sentance +44 (0)20 7213 2068
Total impact measurement and management Mark Ambler +44 (0)20 7213 1591
Health industries Kalee Talvite-Brown +44 (0)20 7213 4372
Dan Burke +44 (0)20 7212 6494
Andy Statham +44 (0)20 7213 1486
Education and skills Michael Kane +44 (0)28 9041 5303
Peter Norriss +44 (0)7525 298 726
Sean Hughes +44 (0)20 7212 4194
International development David Armstrong +44 (0)28 9041 5716
Sheetal Vyas +44 (0)7730 146 352
Zlatina Loudjeva +44 (0)20 7213 4815
Financial services Nick Forrest +44 (0)20 7804 5695
Media and entertainment David Lancefield +44 (0)20 7213 2263
Water Richard Laikin +44 (0)20 7212 1204
Power and utilities Stuart Cook +44 (0)20 7804 7167
Transport Daniel Hanson +44 (0)20 7804 5774
To receive future editions by e-mail please sign up on our website www.pwc.co.uk/economy or e-mail [email protected]
51UK Economic Outlook March 2017
www.pwc.co.uk/economics
At PwC, our purpose is to build trust in society and solve important problems. PwC is a network of firms in 157 countries with more than 223,000 people who are committed to delivering quality in assurance, advisory and tax services. Find out more and tell us what matters to you by visiting us at www.pwc.com/UK.
This publication has been prepared for general guidance on matters of interest only, and does not constitute professional advice. You should not act upon the information contained in this publication without obtaining specific professional advice. No representation or warranty (express or implied) is given as to the accuracy or completeness of the information contained in this publication, and, to the extent permitted by law, PricewaterhouseCoopers LLP, its members, employees and agents do not accept or assume any liability, responsibility or duty of care for any consequences of you or anyone else acting, or refraining to act, in reliance on the information contained in this publication or for any decision based on it.