Unclassified TAD/TC/WP(2016)18/FINAL Organisation de Coopération et de Développement Économiques Organisation for Economic Co-operation and Development 13-Jan-2017 ___________________________________________________________________________________________ _____________ English - Or. English TRADE AND AGRICULTURE DIRECTORATE TRADE COMMITTEE Working Party of the Trade Committee SERVICES AND PERFORMANCE OF THE INDIAN ECONOMY: ANALYSIS AND POLICY OPTIONS The report analyses the importance of services for India’s economy, including supporting the development of a stronger industrial base as envisaged in the Make in India initiative, and suggests areas for policy reform. The study was prepared thanks to funding from the United Kingdom and undertaken jointly with Anupam Khanna, independent consultant (former chief economist of NASSCOM). Program of Work and Budget (PWB): This work falls under output result “STRI Expanding Country C overage and Consolidating the STRI” (3.1.2.1.2) in the 2015-2016 PWB. Hildegunn Kyvik Nordås, Tel +33 (0) 1 45 24 88 90, E-mail: [email protected]Sebastian Benz, Tel +33 (0) 1 85 55 68 21, E-mail: [email protected]JT03407733 Complete document available on OLIS in its original format This document and any map included herein are without prejudice to the status of or sovereignty over any territory, to the delimitation of international frontiers and boundaries and to the name of any territory, city or area. TAD/TC/WP(2016)18/FINAL Unclassified English - Or. English
Transcript
Unclassified TAD/TC/WP(2016)18/FINAL Organisation de Coopération et de Développement Économiques Organisation for Economic Co-operation and Development 13-Jan-2017
1. Introduction .............................................................................................................................................. 6 2. The role of services in India’s economy .................................................................................................. 7 3. Services trade and investment in India .................................................................................................. 10
Patterns of services trade and foreign investment .................................................................................. 10 4. The role of services for trade in goods ................................................................................................... 13 5. Indian services trade policy in comparative perspective ....................................................................... 16
6. Impact of services sector reform on trade and on domestic competition ............................................... 28 Services exports and imports .................................................................................................................. 28 Domestic competition ............................................................................................................................ 32
7. Impact of services reforms on downstream sectors ............................................................................... 34 Services and trade in manufactured goods ............................................................................................. 34 Services and prices obtained in export markets for manufacturing........................................................ 39 Key services sector performance and services trade policy ................................................................... 43
8. Conclusions and policy recommendations ............................................................................................. 45
Figure 16. Unit prices obtained by India’s exports relative to the average, 2014 ................................... 40
Boxes
Box 1. The STRI ........................................................................................................................................ 17 Box 2. The gravity model .......................................................................................................................... 28 Box 3. Determinants of the extensive and intensive margin of trade ........................................................ 37
TAD/TC/WP(2016)18/FINAL
4
EXECUTIVE SUMMARY
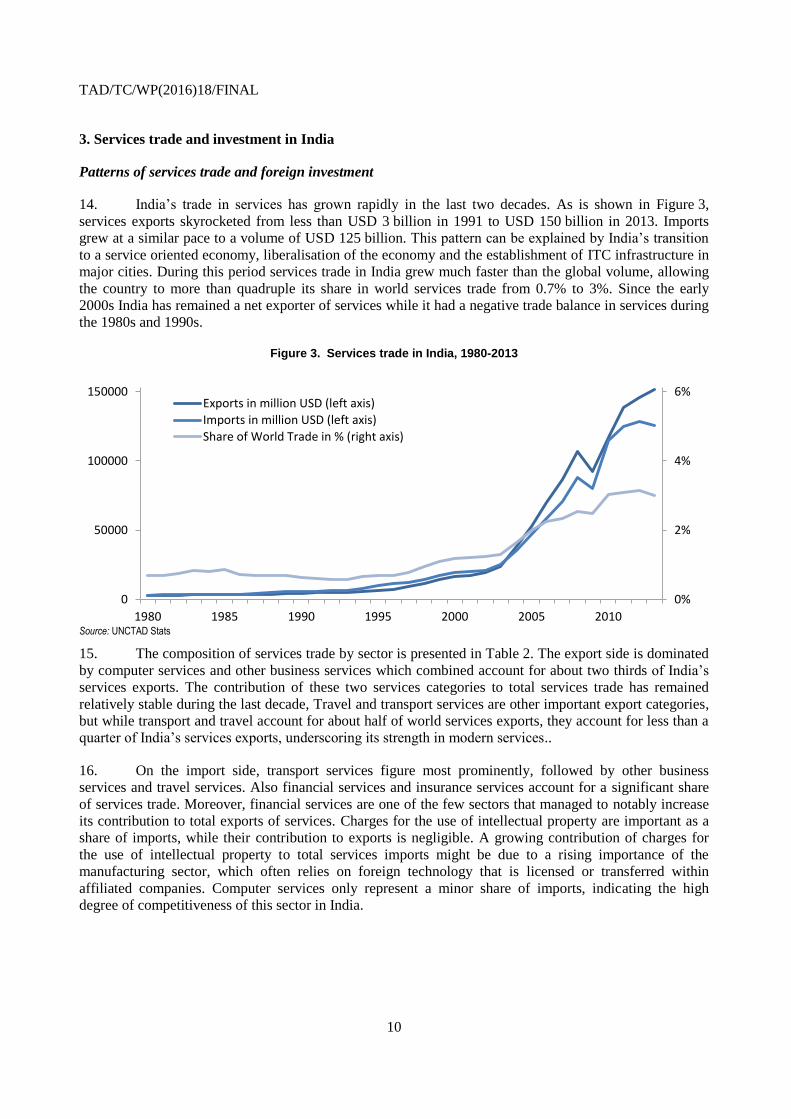
India’s services export led growth since the 1990s is unprecedented. India exhibits a comparative
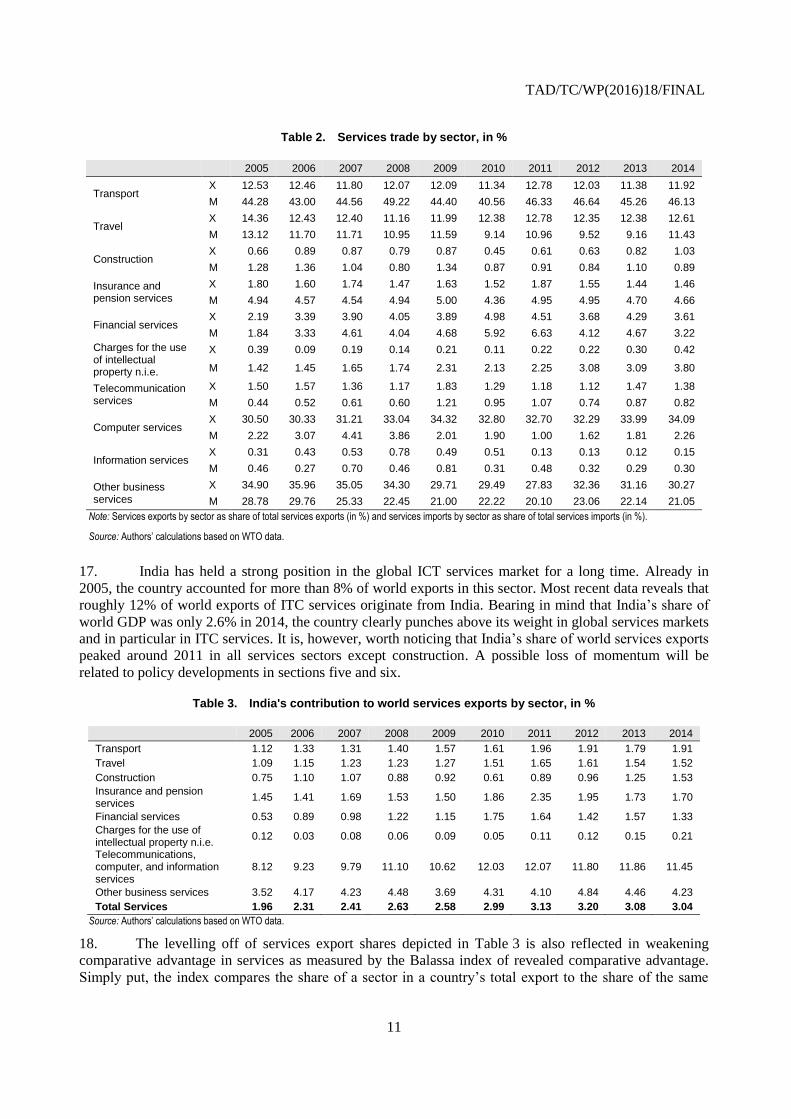
advantage and has run a trade surplus in services since the early 2000s. Its export-oriented services sector
is dominated by ICT, where India is among the world’s leading exporters. ICT is an important source of
employment for skilled workers, but cannot absorb the millions of unskilled workers that enter the labour
force every year. Therefore, India is looking to develop its industrial base and attract export-oriented
manufacturing investment. This report goes beyond a mere description of India’s services trade, towards a
holistic analysis of key services sectors and their importance for growth and job creation in India.
The Make in India initiative seeks to develop the industrial base, create jobs and diversify exports.
Competitive services markets are essential for meeting the objectives of this initiative. First, India is well
placed to seize the opportunities that digitisation and globalisation of the professional services bring.
Second, services are crucial inputs to product development, supply chain management, production process
support, distribution and marketing of manufactured products. With better internal connectivity of
transport, logistics and telecommunications, state-of-the-art Indian business services providers may help
local manufacturers improve their products and productivity in the same manner as they have done for
countless clients around the world before. By the same token, a more developed Indian industrial base
constitutes a new and fast-growing source of demand for sophisticated business services such as
engineering, design and R&D. At the same time more open services markets allow local industries to
access foreign business services and distribution channels.
India tends to have more restrictive regulation than most other countries covered by the OECD
Services Trade Restrictiveness Indices (STRI). A detailed exploration of the services trade policy
framework reveals that the general regulatory framework imposes a number of burdensome administrative
procedures and time consuming licensing and permit requirements. Foreign investment is permitted in
most sectors, but foreign companies cannot have direct ownership in Indian firms. Natural persons who
seek to provide services on a temporary basis must obtain a work and residence permit which is subject to
economic needs tests. These economy-wide regulations establish a floor on the value of the STRI before
sector-specific measures are added.
The STRI scores are particularly high in the services sectors most important for supporting the
objectives of the Make in India initiative. Communications services, professional services, financial
services and distribution provide important inputs and supply chain support for manufacturers. India has a
relatively liberal trade and foreign investment policy in road transport and engineering services but for the
other sectors a number of sector-specific limitations and conditions on foreign investment are imposed,
which explains elevated scores on the STRI indices. In the case of regulated professions the requirements
for obtaining a license is difficult to meet for people with a foreign degree and practice, particularly in
legal services and auditing where it is nigh impossible for a foreign supplier to satisfy the conditions.
Services trade barriers hamper services exports at least as much as services imports. A first estimate
of the costs of trade restricting regulations facing businesses, calculated as a tax equivalent on the sector’s
output, range from about 15% for courier services to about 60% in auditing and accounting. In the
protected domestic market such costs can be recuperated from consumers and downstream business
customers. In more competitive export markets this may not be possible, which is one of the reasons why
trade restrictions have an anti-export bias. Model simulations suggest that if India brought its services trade
policy stance more in line with the average for the 44 countries covered by the STRI database, services
exports could over time increase by between 15% and 200% depending on the sector, with the largest
predicted effect in telecommunications and commercial banking. Being the backbone of the digital
TAD/TC/WP(2016)18/FINAL
5
economy, telecommunications are essential for trade in all services that can be digitised, and the simulated
reforms in the telecommunications sector could over time boost total services exports by 85% and
potentially double the exports of business services, compared to a status quo scenario.
Indian manufactured products are ubiquitous globally, but thinly spread mainly at the low-end
price range. India’s manufacturing exports are highly diversified geographically and in terms of the
number of products being exported. However, the total export volume is relatively small, indicating that
exports are thinly spread across markets. Furthermore, the unit prices Indian exporters obtain are
significantly lower than the average for the same product and market for all exporters. The policy
challenge of meeting the Make in India objectives is therefore not so much diversification of manufactured
exports, but rather of scaling up existing export links and moving beyond niches and bridgeheads. For this,
delivery reliability is essential. Modern manufacturing markets require the right volume at the right time
with close to zero faults, which in turn relies on a strong chain of supporting services.
Connectivity is a key to scaling up manufacturing production and exports. Broadband internet
connections have become a necessity for managing supply chains and access knowledge in modern
manufacturing. Globally a 10% increase in broadband connections from the mean is associated with about
4% higher manufacturing export volumes at about 1% higher unit prices. Broadband connections are
particularly important for exports to developed markets such as Germany, Korea and the US. Entering
high-end markets in the apparel, electrical machinery and pharmaceutical industries also relies on access to
the Internet. These are all sectors where India has already established pockets of excellence in well-
connected clusters of industrial activities. In labour-intensive and price sensitive lower end markets,
physical connectivity is crucial. Finally, 10% better logistics performance would reduce the cost of
exporting by about 2%.
Modern retailers connect manufacturers of consumer goods to export markets. Retailers
increasingly enter contractual relationships with manufacturers and help them tailor products to consumer
tastes and comply with product standards set by the retailers themselves and by governments. In a more
open policy regime, modern retailers could connect local manufacturers, including SMEs, both to the vast
and fast-growing Indian market and beyond. Caps on foreign ownership and restrictions on combining
bricks and mortar and e-retailing may help ‘mom and pop stores’ stay in business for longer, but at the
same time they prevent retailers from offering SMEs a channel for marketing their produce beyond the
local village.
Simultaneous policy reforms in the communications and distribution sectors could unleash India’s
export potential in manufactured goods and higher-end professional services. To scale up export
linkages, better physical and virtual connectivity inside India’s vast market as well as to external markets is
needed. Reforms in the transport sectors, particularly railways, ports and maritime transport could
significantly reduce the cost of sourcing inputs and reaching customers both inside India and beyond.
Removing remaining restrictions on foreign entry and pro-competitive regulation in fixed line broadband
telecommunications would enable manufacturers to better integrate in global value chains and to expand
exports in higher-end market segments. The telecommunications regulator has recently initiated a
consultation process to improve pro-competitive regulation. This is a timely and important step to
modernise regulation. Finally, lifting some of the restrictions in commercial banking, particularly measures
such as directed credit schemes, could improve access to credit for innovative firms both in manufacturing
and services.
TAD/TC/WP(2016)18/FINAL
6
1. Introduction
1. India has pursued a services-led development path and has become one of the major global
exporters of business services, notably in the ICT sector. Today India is the fastest growing large economy
in the world and possibly one of the economies with the greatest potential for sustained growth and
development in the medium term. Indeed, the sheer size of the economy and its young and increasingly
skilled labour force suggest that it could also become a driver of global growth.
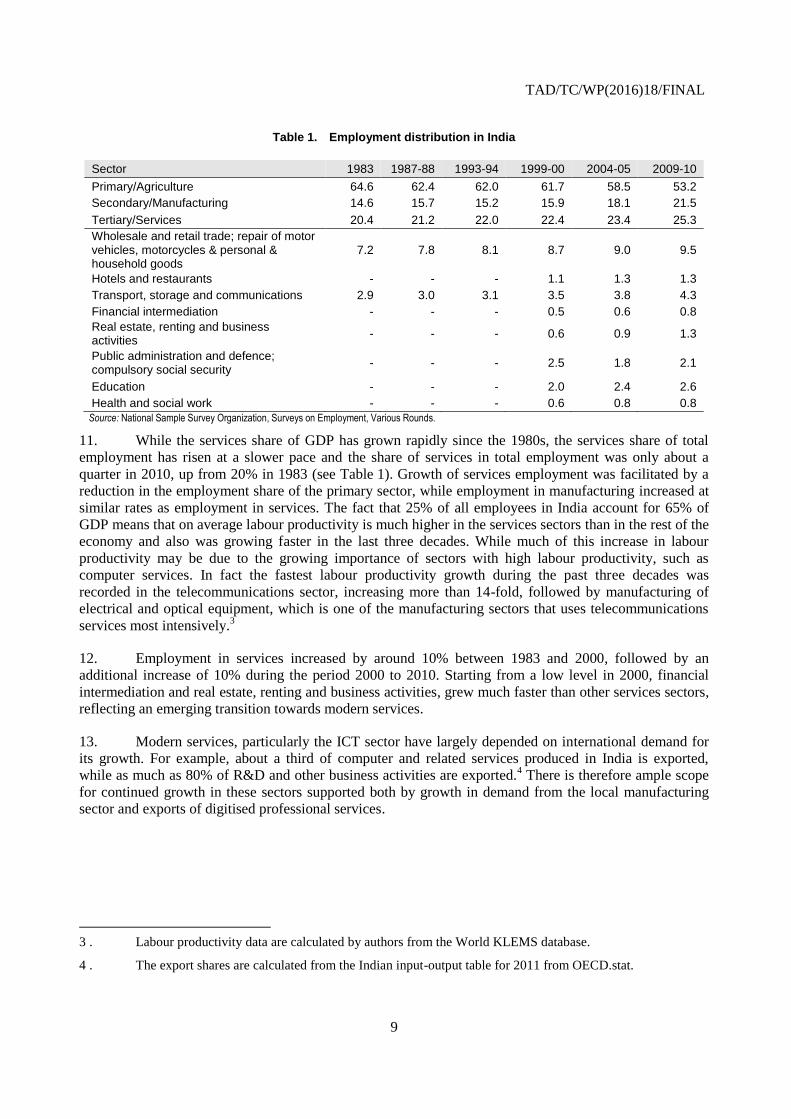
2. India’s reliance on services as the engine of growth during the transition from a low to a middle
income country is unprecedented. Whether this is a benefit or a disadvantage going forward is subject to
debate. On the one hand there is concern that India may lose momentum if it misses out on
industrialisation. Manufacturing is also seen as the most reliable source of job creation for low and medium
skilled workers. Recent economic policies such as the Make in India initiative have therefore focussed on
strengthening manufacturing. On the other hand services are essential for the competitiveness of
manufacturing as product differentiation, speed to market and responsiveness to changing consumer
preferences gain prominence even for low-end manufactured products.
3. Indian business services exporters have helped improve clients’ competitiveness around the
world. This study asks under which circumstances they, and other key services providers, could do the
same for local clients. It starts by describing shifts in industrial structure over the past decades,
documenting the prominent role of services since the mid-1990s. India’s strength in global services
markets is highly concentrated in ICT and other business services. These use telecommunications networks
intensively. India’s mobile telecommunications sector is highly competitive and in major cities also fixed
line internet connections are available for businesses. Nevertheless, the fixed internet coverage is poor for
most of the country. Improving this is one of the key factors that would help India build on its strengths
and expand the benefits to new sectors and regions of the country.
4. The virtual connectivity that telecommunications provide is a necessary but not sufficient
condition for India to build on its existing strengths. Better physical connectivity is also required to move
parts, components and final products along the value chain in a timely and efficient manner. Investments in
infrastructure are of course needed to support growth and development. Such investments take time and
considerable resources, but progress can still be made in the short to medium term by better utilization of
existing infrastructure. This study focuses on services related trade, investment and competition policies
that could support India’s objectives of sustainable and inclusive growth and job creation. It shows that
open and well-regulated services markets not only improve physical connectivity in the short run, but
could potentially also raise the return to infrastructure investment in the long run.
5. India has a strong comparative advantage in ICT-related services. Business process outsourcing
and business process management have been the most important services sectors in the past and still
account for the bulk of India’s IT-enabled services exports. However, with better telecommunications
connectivity, design and engineering could potentially become a new source of services exports.
Furthermore, local demand for such services from the manufacturing sector could provide the scale that a
diversified and competitive engineering sector needs.
6. The rest of the study is organised as follows: The next section sets the stage by describing the
role of services in the Indian economy going back several decades. Section three presents patterns of
services trade and investment while section four focuses on the role of services in trade in value added.
Section five provides an in depth comparative analysis of India’s service trade policy relative to nine other
large countries. The analysis focuses on the services that play the most important role in supporting
manufacturing production, marketing and trade, i.e. communication, distribution, finance and business
TAD/TC/WP(2016)18/FINAL
7
services. The policy analysis is followed by impact analysis of services sector reforms for services trade
and domestic competition in services in section six and downstream manufacturing sectors in section
seven. Section eight offers concluding remarks and draws some tentative policy conclusions.
2. The role of services in India’s economy
7. Services have played a more important role in India’s economic development than in any other
major economy. The literature describes economic development as a shift from an agrarian economy
dominated by subsistence farming to an industrialised economy with a rising share of services in GDP.
This is a virtuous cycle starting with rising productivity in farming, which releases labour to urban
manufacturing and services. The services sector begins to gain ground as a share of GDP first during the
early phase of industrialisation, where traditional services such as transport, distribution and public
administration support and drive urbanisation and complement the rise of manufacturing. A second wave
of services growth tends to follow when the economy reaches a per capita income level around USD 2000,
when demand for modern services such as finance, business services and telecommunications start rising
faster than GDP (Eichengreen and Gupta, 2011; 2013a).
Figure 1. GDP by major sector
Source: Central Statistics Office (CSO). Note that services include construction, while utilities are recorded under industry.
8. Figure 1 shows the structural changes in the Indian economy from 1950 to the present. After a
brief spurt during the mid-1950s, the services share of GDP was pretty much constant at around 43% for
more than two decades. In the 1980s the services share started to increase at an accelerating pace, reaching
64.4% in 2013-14.1
9. At any point in time, the services share of GDP tends to be higher the richer is the country. The
services share of GDP also tends to increase over time for any level of GDP per capita. For instance a
country with a real GDP per capita of USD 2000 in 1980 tended to have a lower services share of GDP
1 . Construction is defined as a services sector in this study. In the literature it is sometimes classified under
the industry sectors, which is one of the reasons why the services share of GDP may differ across data
sources. The construction sector accounts for roughly 9% of value added in India.
0
10
20
30
40
50
60
70
80
90
100
19
50
-51
19
52
-53
19
54
-55
19
56
-57
19
58
-59
19
60
-61
19
62
-63
19
64
-65
19
66
-67
19
68
-69
19
70
-71
19
72
-73
19
74
-75
19
76
-77
19
78
-79
19
80
-81
19
82
-83
19
84
-85
19
86
-87
19
88
-89
19
90
-91
19
92
-93
19
94
-95
19
96
-97
19
98
-99
20
00
-01
20
02
-03
20
04
-05
20
06
-07
20
08
-09
20
10
-11
20
12
-13
% o
f G
DP
Agriculture
Industry
Manufacturing
Services
TAD/TC/WP(2016)18/FINAL
8
than a country with the same real GDP per capita in 2014. Estimates of the relationship between the
services share of GDP, GDP per capita and a time trend suggest that India’s services sector
underperformed for most of the period from 1960 to the mid-1990s, as illustrated in Figure 2.2 The rising
share of service in GDP since the 1980s thus started with a catch-up towards the international norm, while
remaining above its predicted level ever since.
Figure 2. Deviation from predicted services share of GDP in India
Note: Predicted services share of GDP has been estimated using the methodology of Eichengreen and Gupta (2013).
10. The structural changes as far as the services sector is concerned fit into the stylized facts
described by Eichengreen and Gupta (2011; 2013a; 2013b), with two caveats. First, the rising share of
traditional services came much later than expected, possibly due to protection of small and medium sized
enterprises (SMEs) in the retail sector and the dominance of the state in the transport sectors. Second, the
expansion of modern services has been faster and started at an earlier level of per capita income than the
international norm.
2 . The regression equation predicting the services share of GDP reads as follows: 𝑆
𝐺𝐷𝑃= 𝑎0 + 𝑎1𝑙𝑛𝐺𝐷𝑃 +
𝑎2𝑙𝑛𝐺𝐷𝑃𝑐𝑎𝑝𝑖𝑡𝑎 + 𝑎3𝑙𝑛𝐺𝐷𝑃𝑐𝑎𝑝𝑖𝑡𝑎2+ 𝑎4𝑙𝑛𝐺𝐷𝑃𝑐𝑎𝑝𝑖𝑡𝑎3 + 𝑎5𝑙𝑛𝐺𝐷𝑃𝑐𝑎𝑝𝑖𝑡𝑎4 + 𝑑𝑢𝑚70−89 +𝑑𝑢𝑚90−04 + 𝑑𝑢𝑚05−14 + 𝛾𝑖 . The last four terms are period dummies and country fixed effects.
Charges for the use of intellectual property n.i.e.
0.06 0.01 0.03 0.02 0.03 0.02 0.03 0.04 0.05 0.07
Telecommunications, computer, and information services
4.13 4.00 4.06 4.22 4.12 4.02 3.86 3.69 3.85 3.76
Other business services 1.79 1.80 1.75 1.70 1.43 1.44 1.31 1.51 1.45 1.39
Source: Authors’ calculations based on WTO data.
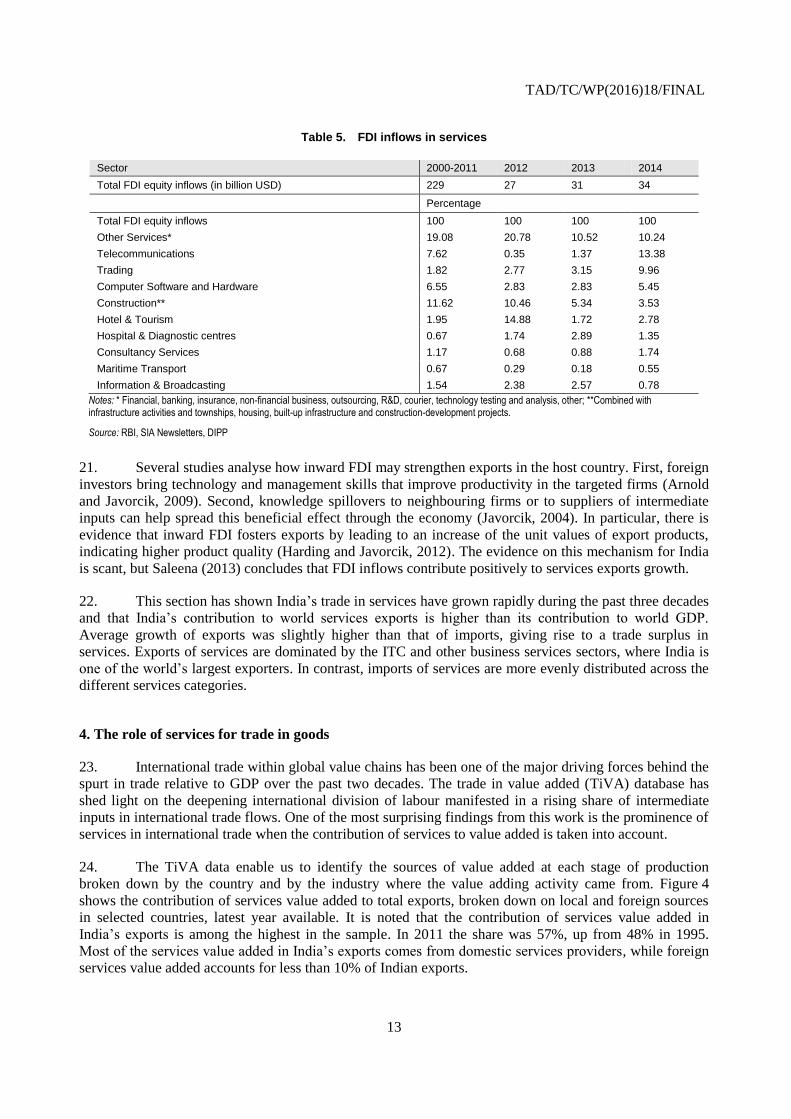
19. Growth of India’s services sector is backed by inflows of foreign direct investment (FDI) which
have increased from USD 4 billion in 2000 to USD 34 billion in 2014. Bearing in mind the size and growth
rate of the Indian economy this is quite modest.6 Around 40% are invested in services in recent years while
the distribution of FDI inflows across the services sectors differs substantially from year to year. High
volatility is a general attribute of FDI inflows, however, and not specific to India.
20. For example, the other services category, which comprises financial services and the outsourcing
business, absorbed around 20% of all FDI inflows into India between 2000 and 2012, whereas in 2014 it
only accounted for around 10% of FDI inflows. In contrast, the telecommunications sector experienced
large inflows in 2014 while FDI activity in this sector was low during the immediately preceding years.
This can be explained by a policy change in 2014, allowing for 100% foreign equity in telecommunication
services, including telecommunication infrastructure providers. The trading (wholesale and retail
distribution) sector absorbed 10% of FDI inflows in 2014, up from less than 2% in the period from 2000 to
2011. Construction was one of the most important recipients of FDI inflows during the first decade of the
21st century but has lost importance since then. The hotel and tourism sector experienced a surge in inflows
in 2012 but only very little foreign direct investment in all other years.
5 . The index is calculated as 𝑅𝐶𝐴𝑖𝑗 =𝑥𝑖𝑗/𝑋𝑖𝑡
𝑥𝑤𝑗/𝑋𝑤𝑡, where xij stands for exports of services j in country i (India),
Xit stands for total service exports of country i (India), xwj refers to world exports of services j and Xwt are
total world exports of services (Balassa, 1965).
6 . For comparison FDI inflows to China and Brazil stood at USD 250 billion and USD 65 billion respectively
in 2015.
TAD/TC/WP(2016)18/FINAL
13
Table 5. FDI inflows in services
Sector 2000-2011 2012 2013 2014
Total FDI equity inflows (in billion USD) 229 27 31 34
Percentage
Total FDI equity inflows 100 100 100 100
Other Services* 19.08 20.78 10.52 10.24
Telecommunications 7.62 0.35 1.37 13.38
Trading 1.82 2.77 3.15 9.96
Computer Software and Hardware 6.55 2.83 2.83 5.45
Construction** 11.62 10.46 5.34 3.53
Hotel & Tourism 1.95 14.88 1.72 2.78
Hospital & Diagnostic centres 0.67 1.74 2.89 1.35
Consultancy Services 1.17 0.68 0.88 1.74
Maritime Transport 0.67 0.29 0.18 0.55
Information & Broadcasting 1.54 2.38 2.57 0.78
Notes: * Financial, banking, insurance, non-financial business, outsourcing, R&D, courier, technology testing and analysis, other; **Combined with infrastructure activities and townships, housing, built-up infrastructure and construction-development projects.
Source: RBI, SIA Newsletters, DIPP
21. Several studies analyse how inward FDI may strengthen exports in the host country. First, foreign
investors bring technology and management skills that improve productivity in the targeted firms (Arnold
and Javorcik, 2009). Second, knowledge spillovers to neighbouring firms or to suppliers of intermediate
inputs can help spread this beneficial effect through the economy (Javorcik, 2004). In particular, there is
evidence that inward FDI fosters exports by leading to an increase of the unit values of export products,
indicating higher product quality (Harding and Javorcik, 2012). The evidence on this mechanism for India
is scant, but Saleena (2013) concludes that FDI inflows contribute positively to services exports growth.
22. This section has shown India’s trade in services have grown rapidly during the past three decades
and that India’s contribution to world services exports is higher than its contribution to world GDP.
Average growth of exports was slightly higher than that of imports, giving rise to a trade surplus in
services. Exports of services are dominated by the ITC and other business services sectors, where India is
one of the world’s largest exporters. In contrast, imports of services are more evenly distributed across the
different services categories.
4. The role of services for trade in goods
23. International trade within global value chains has been one of the major driving forces behind the
spurt in trade relative to GDP over the past two decades. The trade in value added (TiVA) database has
shed light on the deepening international division of labour manifested in a rising share of intermediate
inputs in international trade flows. One of the most surprising findings from this work is the prominence of
services in international trade when the contribution of services to value added is taken into account.
24. The TiVA data enable us to identify the sources of value added at each stage of production
broken down by the country and by the industry where the value adding activity came from. Figure 4
shows the contribution of services value added to total exports, broken down on local and foreign sources
in selected countries, latest year available. It is noted that the contribution of services value added in
India’s exports is among the highest in the sample. In 2011 the share was 57%, up from 48% in 1995.
Most of the services value added in India’s exports comes from domestic services providers, while foreign
services value added accounts for less than 10% of Indian exports.
TAD/TC/WP(2016)18/FINAL
14
Figure 4. Services value added in exports, 2011, in %
Source: Authors’ calculation based on OECD-TiVA database
25. Figure 5 takes a closer look at the services value added in manufacturing exports for the same
countries and year. At 33%, the services intensity of Indian manufacturing exports is at a similar level as
the other countries in the sample. Also the foreign services share, at around 12% of the value added in
manufacturing exports, is around the average. The higher share of services in total value added exports
(Figure 4) than in manufacturing exports (Figure 5) reflects direct exports of services, as discussed in the
previous section. By the same token the low foreign share in Figure 4 reflects that foreign value added in
services exports is very low in India, only 7% in 2011.
26. The next step in describing the role of services for trade in goods focuses on 16 manufacturing
sectors in more detail.7 A break-down of services value added on services categories in various
manufacturing sectors is presented in Figure 6. The contribution of different types of services into different
manufacturing sectors is surprisingly similar. While some sectors rely less on services inputs (Coke,
refined petroleum products, electricity) than others, the differences seem to be in terms of a scale
parameter rather structural differences. In all sectors, wholesale and retail trade is the most important
services input, followed by transport and storage and financial intermediation.
7 . The share of services value-added in India’s exports of agriculture and mining is negligible.
0
10
20
30
40
50
60
70 Domestic Value Added Foreign Value Added
TAD/TC/WP(2016)18/FINAL
15
Figure 5. Services value added in manufacturing exports, 2011, in %
Source: Authors’ calculation based on OECD-TiVA database
27. The similarity in the importance of different services inputs across manufacturing exports may
indicate that services constitute a bundle of not easily substitutable components, while only the importance
of this bundle for manufacturing output varies across sectors. It is, however, also a possibility that the
constant proportions reflect a statistical artefact that we observe in the TiVA data due to the lack of precise
input-output information for the Indian economy. There is for instance evidence that some sectors use
financial services more intensively than others (Guerrieri and Meliciani, 2005), and it is unlikely that they
are also proportionally more intensive in all other services. Be that as it may, it is clear that services play
an important role as inputs in most manufacturing sectors. In particular, the contribution of value added
from distribution services, transport services and financial intermediation for exports of manufactured
products is notable.
28. The relative importance of an input does not always correspond to its share of value added. Some
inputs, for instance electricity, telecommunications or rental of machinery may account for a small share of
value added, but production would not be possible without them. By the same token, manufactured
products cannot be exported without the inputs from transport services. If such essential services account
for a higher share in a countries’ value added exports relative to other countries, there is the possibility that
the services inputs are more expensive, less efficient or both. Furthermore, the cost of inefficient and
expensive transport, energy or telecommunications may have to be borne by the exporter, rather than the
final consumer, when suppliers from several countries compete intensively in export markets.
0
10
20
30
40
50Foreign Value Added Domestic Value Added
TAD/TC/WP(2016)18/FINAL
16
Figure 6. Services value added in exports by industry, India, 2011, in %
Source: Authors’ calculation based on OECD-TiVA database
29. The input of R&D services, engineering, design and other business services on the other hand
typically contributes to improving the quality of the product so that it may obtain a higher price in the
export market. A practical way of looking at the role of services in manufacturing and exports of
manufactured products is to distinguish between services that affect the cost of production and
transactions, and services that mainly affect the quality of the product. The literature distinguishes between
cost services and value services (e.g. Arbache et al., 2016). Of course transporting a good to the consumers
that value it the most adds value to it, so there is no sharp distinction between cost and value services.
Nevertheless, the distinction is useful bearing in mind that in competitive markets exporters must absorb
excessive transport cost and costs of other services that do not change the quality of the product, and
thereby reducing their margins at best and prevent them for entering markets outside their region at worst.
5. Indian services trade policy in comparative perspective
30. This section analyses India’s services policy stance in a comparative perspective using the
Services Trade Restrictiveness Index (STRI) developed by the OECD. The STRI database records and
updates the provisions in laws and regulation of relevance to international services trade through cross-
border trade, consumption abroad, movement of natural persons and commercial establishment for 22
sectors and 44 countries, but also captures restrictions only indirectly related to international services trade
such as competition policy and regulatory transparency (see Box 1).
31. The STRI database records regulations actually in force and does not take into account
preferential agreements. India is party to four regional trade agreements that cover services and that are
notified to the WTO (with ASEAN, Japan, Malaysia and Singapore). In addition there is an agreement with
Korea. These do not seem to provide market access or national treatment beyond regulations currently in
force as far as access to the Indian market is concerned.
0
20
40
60Community, social and personal services Real estate, renting and business activities
Financial intermediation Transport and storage, post and telecommunication
Wholesale and retail trade; Hotels and restaurants Construction
TAD/TC/WP(2016)18/FINAL
17
Box 4. The STRI
The STRI database contains a standardised set of measures covering 44 countries and 22 sectors. It can be used for obtaining specific information on a regulation in a particular country and sector as well as comparison across countries or sectors. This information forms the basis for the calculation of composite indices, Services Trade Restrictiveness Indices (STRIs), that take values from zero (completely open) to one (completely closed), and gives a snapshot of the trade restrictiveness of regulation in a country and sector at given point in time. The policy measures in the STRI regulatory database are organised under five policy areas:
Restrictions on foreign entry include information on foreign equity limitations, requirements that management or board of directors must be nationals or residents, foreign investment screening, restrictions on cross-border mergers and acquisitions, capital controls and a number of sector-specific measures.
Restrictions on movement of people include information on quotas, economic needs tests and duration of stay
for foreign natural persons providing services as intra-corporate transferees, contractual services suppliers or independent service suppliers. These categories are covered by the GATS and have in common that the natural persons are not supposed to seek employment in the host country. This policy area also contains information on recognition of foreign qualifications in regulated professions.
Other discriminatory measures include discrimination of foreign services suppliers as far as taxes, subsidies
and public procurement are concerned; and instances where national standards differ from international standards where relevant.
Barriers to competition include information on anti-trust policy, government ownership of major firms and the extent to which government owned enterprises enjoy privileges and are exempted from competition laws and regulations. Sector-specific pro-competitive regulation in network industries also falls under this category.
Regulatory transparency includes information on consultations and publications prior to entering into force of laws and regulations. It also records information on administrative procedures related to establishing a company, obtaining a license or a visa.
TAD/TC/WP(2016)18/FINAL
18
Figure 7. STRI score by sector and policy area, India, 2016
Note: The STRI indices take values between zero and one, one being the most restrictive. They are calculated on the basis of the STRI regulatory database which contains information on regulation for the 35 OECD Members, Brazil, China, Colombia, Costa Rica India, Indonesia, Lithuania, Russia and South Africa. The STRI database records measures on a Most Favoured Nations basis. Preferential trade agreements are not taken into account. Air transport and road freight cover only commercial establishment (with accompanying movement of people).
32. India’s score on the STRI index for 2016 is presented in Figure 7 along with the average among
the 44 countries included in the STRI database, and the score in 2014 and 2015. India has a STRI score
above average in all sectors. The chart shows a large variation in trade restrictiveness across sectors, and
also as far as the relative importance of the five policy areas is concerned.
33. Some of the regulations recorded in the STRI database apply to all sectors in the economy, while
others apply to specific services sectors. The analysis of India’s services trade-relevant policy starts with
the measures that apply to all sectors, which are referred to as horizontal measures.
Horizontal measures
34. Foreign investment is governed by the “Consolidated FDI Policy” released annually by the
Department of Industrial Policy and Promotion (DIPP), Ministry of Commerce and Industry.8 This
document contains a positive list of sectors subject to limitations on establishment and operations in the
Indian market. Sectors are categorised into two groups: prohibited and permitted sectors. In the permitted
sectors investment can take place either through the government route through which prior approval is
needed, or the automatic route where no approval is required. In some sectors the automatic route applies
8 . The current version is effective from 7 June 2016.
0
0.1
0.2
0.3
0.4
0.5
0.6
0.7
0.8
0.9
1
Restrictions on foreign entry Restrictions to movement of people Other discriminatory measures Barriers to competition Regulatory transparency Average Minimum stri2014 stri2015
TAD/TC/WP(2016)18/FINAL
19
up to a certain threshold beyond which approval is needed. Sectors that are not listed in the document are
not subject to restrictions on establishment other than those that follow from general provisions and the
regulation that applies to the sector in question. With the exception of rail operations, all services sectors
covered by the STRI falls under the permitted category.
35. Foreign investment is subject to horizontal limitations on the manner in which foreign investors
may buy and sell shares in Indian companies. First, foreign companies cannot directly own assets or carry
out business in India. They must establish a branch office, project office or liaison office to do so. Buying
shares from local residents is also subject to pricing guidelines issued by the Security and Exchange Board
of India (SEBI). Repatriation of dividends is permitted through authorised foreign exchange dealers only.
There are also different procedures depending on the nature of the investor and the investment. Eligible
investors are Foreign Institutional Investors, Foreign Portfolio Investors, Foreign Venture Capital Investor
and Non-Resident Indians.
36. Trade through the temporary movement of natural persons is regulated through the Foreigners
Act and related regulation.9 These establish which documents and permits are needed for the different
categories of natural persons and the criteria for obtaining the permits. India applies a relatively liberal
regime for business visitors, defined as those coming to India to make sales, establish contacts, participate
in meetings, exhibitions, and similar on behalf of a company established abroad. Multi-entry business visas
for up to five years validity are available. Each entry can last a maximum of six months. Foreigners who
seek to provide a service in India need an employment visa. Such visas are available to highly skilled or
qualified professionals if the work they are to perform cannot be undertaken by a qualified Indian citizen.
The minimum salary or fee is USD 25,000 per year. Employment visas are issued for one year and can be
extended for up to five years.
37. Foreign services suppliers have access to the public procurement market, provided that they
register with the appropriate body. India does not yet have national procurement legislation. A public
procurement bill (Bill No 58 of 2012) was introduced in 2012, but did not pass the parliament. It was
revived in 2015 and at the point of writing it is pending introduction to the parliament. Government
procurement procedures are subject to the General Financial Rules of 2005 (GFR) and regulations and
procedures at a state level. In addition the Ministry of Finance has developed three manuals for public
procurement, for goods, public works and services respectively, which provide detailed guidelines for the
tendering process and awarding of contracts. The rules and guidelines do not discriminate against foreign
suppliers. It is, however, required that 20% of annual value of goods or services be awarded to micro,
small and medium sized enterprises (MSMEs).
38. Taxes and subsidies are in principle non-discriminatory, although there are some sector-specific
deviations from this principle. India has also recently introduced a tax that can be seen as an import tax on
certain advertising services. A so-called equalisation levy on on-line advertising was introduced in the
2016/17 budget. From 1 of June 2016 Indian businesses that buy on-line advertising from companies not
established in India must deduct 6% of the payment and deposit it to the Indian government. This
arrangement applies to business to business transactions exceeding INR 100,000 per year.10
39. Most business operations and functions have become digitised. In addition, a host of business
services are offered by specialised international services providers that help run integrated and effective
9 . The STRI covers regulations affecting intra-corporate transferees, contractual services suppliers and
independent service suppliers as defined in the General Agreement of Trade in Services (GATS).
10 . See the budget speech (http://indiabudget.nic.in/ub2016-17/bs/bs.pdf), paragraph 151.The purpose of this
levy is “…to tap tax on income accruing to foreign e-commerce companies from India”.
are significant at a 1% level with robust standard errors. The R2 is 0.452.
TAD/TC/WP(2016)18/FINAL
21
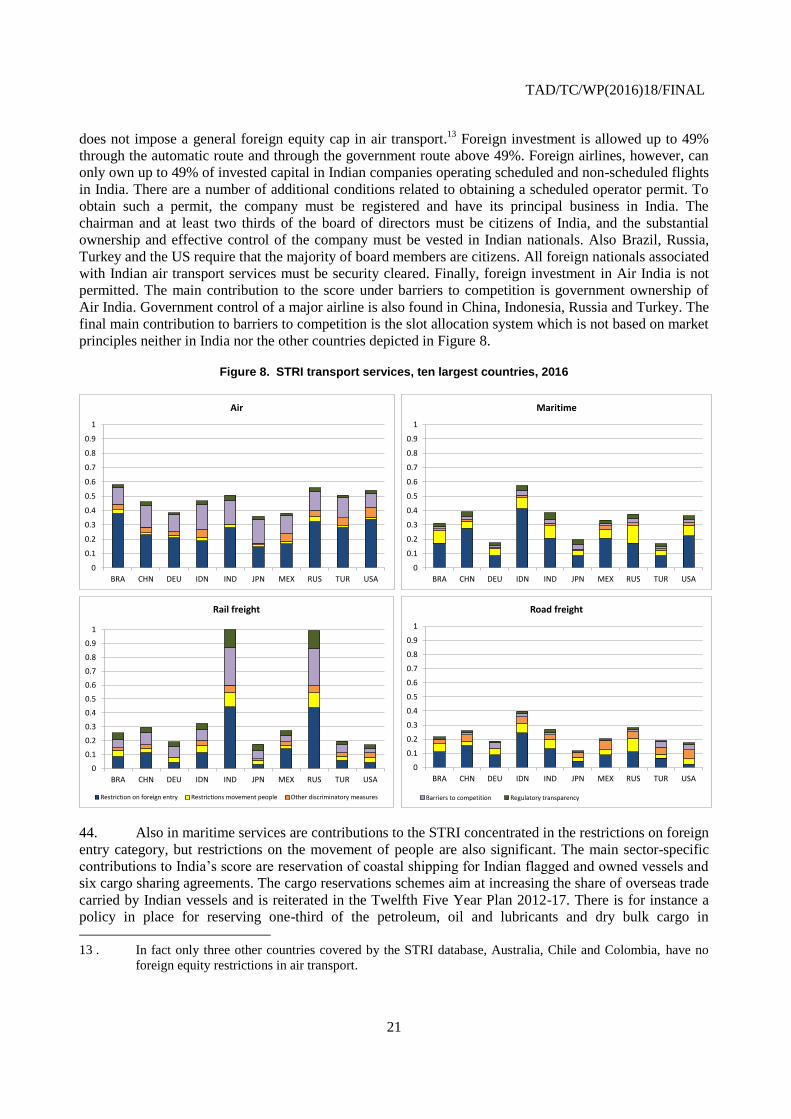
does not impose a general foreign equity cap in air transport.13
Foreign investment is allowed up to 49%
through the automatic route and through the government route above 49%. Foreign airlines, however, can
only own up to 49% of invested capital in Indian companies operating scheduled and non-scheduled flights
in India. There are a number of additional conditions related to obtaining a scheduled operator permit. To
obtain such a permit, the company must be registered and have its principal business in India. The
chairman and at least two thirds of the board of directors must be citizens of India, and the substantial
ownership and effective control of the company must be vested in Indian nationals. Also Brazil, Russia,
Turkey and the US require that the majority of board members are citizens. All foreign nationals associated
with Indian air transport services must be security cleared. Finally, foreign investment in Air India is not
permitted. The main contribution to the score under barriers to competition is government ownership of
Air India. Government control of a major airline is also found in China, Indonesia, Russia and Turkey. The
final main contribution to barriers to competition is the slot allocation system which is not based on market
principles neither in India nor the other countries depicted in Figure 8.
Figure 8. STRI transport services, ten largest countries, 2016
44. Also in maritime services are contributions to the STRI concentrated in the restrictions on foreign
entry category, but restrictions on the movement of people are also significant. The main sector-specific
contributions to India’s score are reservation of coastal shipping for Indian flagged and owned vessels and
six cargo sharing agreements. The cargo reservations schemes aim at increasing the share of overseas trade
carried by Indian vessels and is reiterated in the Twelfth Five Year Plan 2012-17. There is for instance a
policy in place for reserving one-third of the petroleum, oil and lubricants and dry bulk cargo in
13 . In fact only three other countries covered by the STRI database, Australia, Chile and Colombia, have no
foreign equity restrictions in air transport.
0
0.1
0.2
0.3
0.4
0.5
0.6
0.7
0.8
0.9
1
BRA CHN DEU IDN IND JPN MEX RUS TUR USA
Air
0
0.1
0.2
0.3
0.4
0.5
0.6
0.7
0.8
0.9
1
BRA CHN DEU IDN IND JPN MEX RUS TUR USA
Maritime
0
0.1
0.2
0.3
0.4
0.5
0.6
0.7
0.8
0.9
1
BRA CHN DEU IDN IND JPN MEX RUS TUR USA
Road freight
Barriers to competition Regulatory transparency
0
0.1
0.2
0.3
0.4
0.5
0.6
0.7
0.8
0.9
1
BRA CHN DEU IDN IND JPN MEX RUS TUR USA
Rail freight
Restriction on foreign entry Restrictions movement people Other discriminatory measures
TAD/TC/WP(2016)18/FINAL
22
international trade for Indian vessels. The other countries in the sample have similar restrictions on coastal
shipping, but cargo sharing agreements are no longer common.
Figure 9. STRI logistics services, ten largest countries, 2016
45. India’s railway sector is subject to quite complex regulations. According to the Consolidated FDI
Policy effective from 7 June 2016, railway operations are on the list of prohibited sectors and reserved for
Indian Railways, a state-owned enterprise. On the other hand, 100% foreign equity is permitted through the
automatic route for construction, operation and maintenance of railway infrastructure. The Ministry of
Railways’ publications and guidelines (Ministry of Railways, 2014) explain that there are five models
through which private, including foreign participation can take place. These are i) Non-Government
Private Line Model, ii) Joint Venture Model, iii) Build, Operate and Transfer model, iv) Capacity
augmentation with funding provided by customers, v) Capacity augmentation through annuity model. All
five models require that the freight operations over the infrastructure are undertaken by Indian Railways,
which will pay a user fee to the owner. All five models specify Reserved Services to be provided by Indian
Railways. It thus appears that the activities covered by the STRI are reserved for Indian Railways. Transit
rights are also very limited rendering the sector closed to foreign trade and investment. Container transport
by rail, which accounts for roughly 5% of Indian rail transport has been liberalised recently.14
46. Road transport is fully open to foreign investment and only subject to the general regulatory
framework related to foreign investors and movement of natural persons. The same goes for logistics
services which are depicted in Figure 9. India is among the most restrictive in customs brokerage and
freight forwarding, and in the middle for storage and warehousing and cargo handling. A major state-
14 . Two other countries in the STRI database, Israel and Korea, have a score of one on the STRI for railways.
0
0.1
0.2
0.3
0.4
0.5
0.6
0.7
0.8
0.9
1
BRA CHN DEU IDN IND JPN MEX RUS TUR USA
Cargo handling
0
0.1
0.2
0.3
0.4
0.5
0.6
0.7
0.8
0.9
1
BRA CHN DEU IDN IND JPN MEX RUS TUR USA
Storage and warehousing
0
0.1
0.2
0.3
0.4
0.5
0.6
0.7
0.8
0.9
1
BRA CHN DEU IDN IND JPN MEX RUS TUR USA
Freight forwarding
Barriers to competition Regulatory transparency
0
0.1
0.2
0.3
0.4
0.5
0.6
0.7
0.8
0.9
1
BRA CHN DEU IDN IND JPN MEX RUS TUR USA
Customs brokerage
Restriction on foreign entry Restrictions movement people Other discriminatory measures
TAD/TC/WP(2016)18/FINAL
23
owned enterprise contributes to the score under barriers to competition in storage and warehousing and
cargo handling.
Distribution services
47. Distribution services are essential for bringing goods from the producer to the consumer, for job
creation and for demand-driven economic growth. In India the sector has been subject to intense policy
debate and a host of recent reforms. Nevertheless, as indicated in Figure 10, India has the second highest
score and together with Indonesia it is the only country in the sample that maintains a foreign equity cap in
this sector. Furthermore, the conditions related to foreign participation in the sector are complex, detailed
and may force retailers to employ a different business model than they would have done in the absence of
such rules. Thus, retailers have met the opportunities and challenges emerging from e-commerce and the
proliferation of platforms on smart-phones by restructuring and combining bricks and mortar and digital
commerce in a manner that keeps them in business. Such combinations are not permitted for foreign-
owned retailers in India.
Figure 10. STRI distribution services, ten largest countries, 2016
48. The policy framework distinguishes between cash and carry wholesale trading, e-commerce
activities, single-brand product retailing and multi-brand product retailing, for which different access
conditions apply. Cash and Carry Wholesale is the most liberal segment with no foreign ownership
restrictions throughout India. However, if the retailer has a foreign owner, e-commerce is allowed only for
business to business (B2B) transactions, and only for so-called marketplace e-commerce, where the trader
does not hold inventory. B2B marketplace e-commerce traders may not source more than 25% of sales
from one vendor. FDI is not permitted in inventory-based e-commerce, where a vendor sells on his own
account.
49. Turning to retail distribution there is a distinction between single-brand and multi-brand retailers.
FDI up to 49% through the automatic route and up to 100% through the government route is allowed for
single-brand retailers. There are several conditions attached, however. For investment under the automatic
route, the brand has to be sold in other countries as well, and the branding must be made at the
manufacturing stage of the value chain. For FDI exceeding 49% additional conditions apply. These are
local sourcing of 30% of the value of goods purchased, preferably from micro, small and medium sized
0
0.1
0.2
0.3
0.4
0.5
0.6
0.7
0.8
0.9
1
BRA CHN DEU IDN IND JPN MEX RUS TUR USA
Regulatorytransparency
Barriers tocompetition
Other discriminatorymeasures
Restrictionsmovement people
Restriction onforeign entry
TAD/TC/WP(2016)18/FINAL
24
enterprises (MSME). The permit is given for a specific product category. Any addition of new product
categories requires a fresh approval. The local content requirement combined with the branding at the
manufacturing stage appears to imply that FDI beyond 51% requires upstream investment in
manufacturing as well. Nevertheless the government has discretionary power to allow for higher shares of
foreign sourcing for high technology products. This flexibility was used in June 2016 with the decision to
“relax local sourcing norms up to three years and a relaxed sourcing regime for another five years for
entities undertaking Single Brand Retail Trading of products having ‘state-of-art’ and ‘cutting edge’
technology.” (Prime Minister's Office, Government of India, 2016).
50. FDI in multi-brand retailing is allowed up to 51% through the government route in states that
decide to implement the policy.15
A minimum investment of USD 100 million is required of which half
must be made in back-end infrastructure such as processing, manufacturing, design, quality control and
logistics. At least 30% of the value of procurement must be made from Indian MSMEs, and government
has first right to procurement of agricultural products. Finally retail sales outlets must be set up only in
cities with a population of more than 1 million inhabitants and the retailers are not permitted to engage in
e-commerce. Regulations on the retail sector are also found in other countries. Regulation on sales periods
and opening hours are not uncommon in OECD Members and both China and Indonesia impose
restrictions on the distribution of certain products, the number of sales outlets per firm, restrictions on e-
commerce and the permission to offer consumer credit.
Professional services
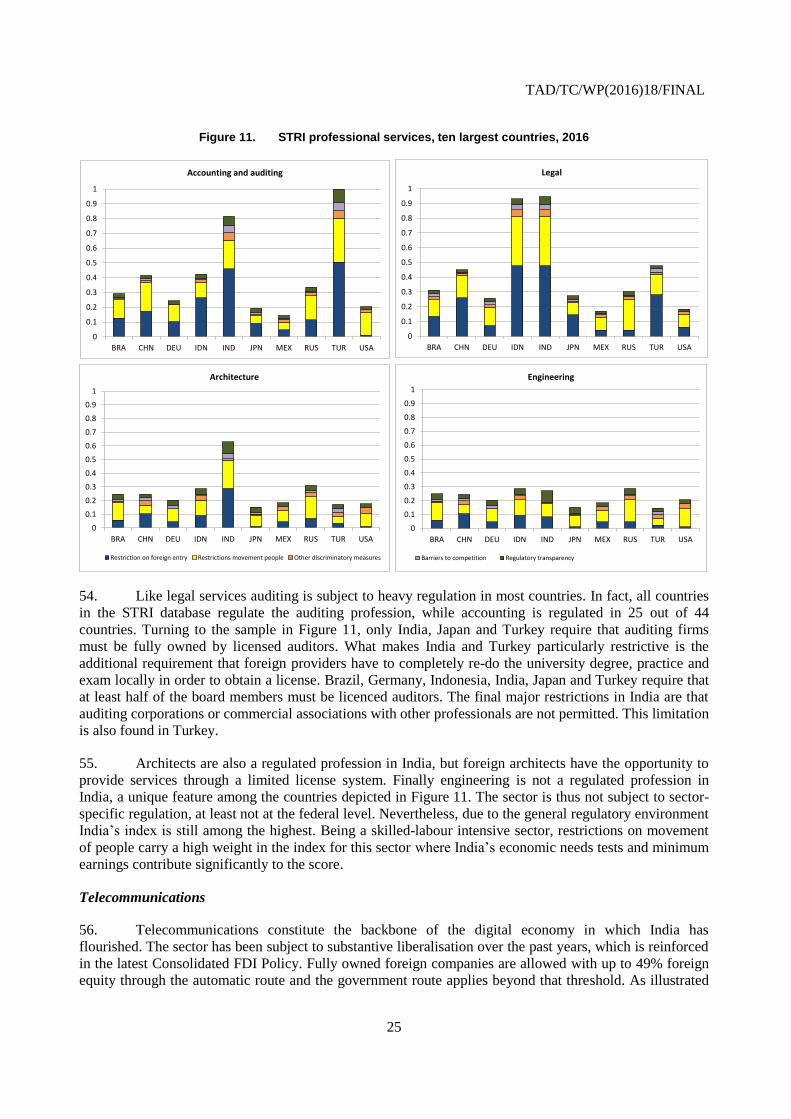
51. The STRI covers four professional services (accounting, architecture, engineering, legal services)
and the scores on the STRI are depicted in Figure 11. Professional services are typically highly regulated
through professional bodies that issue licenses, monitor conduct of professionals and set and uphold
professional standards.
52. India regulates accounting, auditing, legal services and architecture. Starting with legal services,
India reserves both national and international law for licensed Indian lawyers. Furthermore, the license can
only be obtained by Indian nationals or citizens. Only licenced lawyers may form and own law firms.
Corporations are not permitted in the sector and lawyers may not enter into partnerships or otherwise
associate with other professions or foreign lawyers. The only opportunity for foreign legal services
providers to do business in India is through business visits to provide legal advice to their clients (fly-in
fly-out), which is a small share of the total market for legal services, hence the score of 0.95 on the STRI
index. All countries in the STRI database have elements of this type of regulation for domestic law. But
what makes India stand out is lack of liberalisation of foreign and international law, which is open to trade
in all the other countries depicted in Figure 11.
53. Auditors and chartered accountants are regulated professions in India. As for legal services, the
major restrictions relate to the criteria and procedures to obtain a license. Degrees from Indian higher
education institutions or institutions in countries with which India has a mutual recognition agreement are
required. In addition, only licenced auditors or chartered accountants may form and own accounting or
auditing firms. Foreign auditors or accountants may provide services in India on a short-term basis through
limited licensing.
15 . Hitherto 12 states have chosen to do so (see Consolidated FDI Policy, effective 7 June 2016, pp 40-41).
TAD/TC/WP(2016)18/FINAL
25
Figure 11. STRI professional services, ten largest countries, 2016
54. Like legal services auditing is subject to heavy regulation in most countries. In fact, all countries
in the STRI database regulate the auditing profession, while accounting is regulated in 25 out of 44
countries. Turning to the sample in Figure 11, only India, Japan and Turkey require that auditing firms
must be fully owned by licensed auditors. What makes India and Turkey particularly restrictive is the
additional requirement that foreign providers have to completely re-do the university degree, practice and
exam locally in order to obtain a license. Brazil, Germany, Indonesia, India, Japan and Turkey require that
at least half of the board members must be licenced auditors. The final major restrictions in India are that
auditing corporations or commercial associations with other professionals are not permitted. This limitation
is also found in Turkey.
55. Architects are also a regulated profession in India, but foreign architects have the opportunity to
provide services through a limited license system. Finally engineering is not a regulated profession in
India, a unique feature among the countries depicted in Figure 11. The sector is thus not subject to sector-
specific regulation, at least not at the federal level. Nevertheless, due to the general regulatory environment
India’s index is still among the highest. Being a skilled-labour intensive sector, restrictions on movement
of people carry a high weight in the index for this sector where India’s economic needs tests and minimum
earnings contribute significantly to the score.
Telecommunications
56. Telecommunications constitute the backbone of the digital economy in which India has
flourished. The sector has been subject to substantive liberalisation over the past years, which is reinforced
in the latest Consolidated FDI Policy. Fully owned foreign companies are allowed with up to 49% foreign
equity through the automatic route and the government route applies beyond that threshold. As illustrated
0
0.1
0.2
0.3
0.4
0.5
0.6
0.7
0.8
0.9
1
BRA CHN DEU IDN IND JPN MEX RUS TUR USA
Legal
0
0.1
0.2
0.3
0.4
0.5
0.6
0.7
0.8
0.9
1
BRA CHN DEU IDN IND JPN MEX RUS TUR USA
Accounting and auditing
0
0.1
0.2
0.3
0.4
0.5
0.6
0.7
0.8
0.9
1
BRA CHN DEU IDN IND JPN MEX RUS TUR USA
Architecture
Restriction on foreign entry Restrictions movement people Other discriminatory measures
0
0.1
0.2
0.3
0.4
0.5
0.6
0.7
0.8
0.9
1
BRA CHN DEU IDN IND JPN MEX RUS TUR USA
Engineering
Barriers to competition Regulatory transparency
TAD/TC/WP(2016)18/FINAL
26
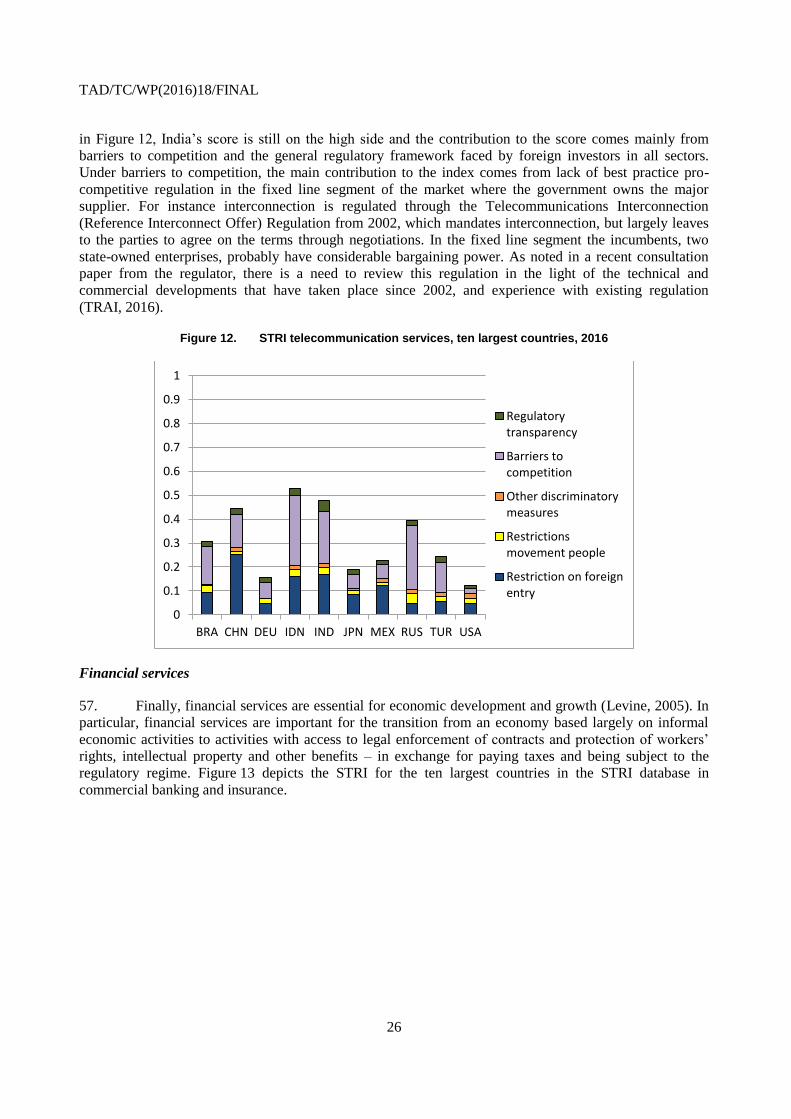
in Figure 12, India’s score is still on the high side and the contribution to the score comes mainly from
barriers to competition and the general regulatory framework faced by foreign investors in all sectors.
Under barriers to competition, the main contribution to the index comes from lack of best practice pro-
competitive regulation in the fixed line segment of the market where the government owns the major
supplier. For instance interconnection is regulated through the Telecommunications Interconnection
(Reference Interconnect Offer) Regulation from 2002, which mandates interconnection, but largely leaves
to the parties to agree on the terms through negotiations. In the fixed line segment the incumbents, two
state-owned enterprises, probably have considerable bargaining power. As noted in a recent consultation
paper from the regulator, there is a need to review this regulation in the light of the technical and
commercial developments that have taken place since 2002, and experience with existing regulation
(TRAI, 2016).
Figure 12. STRI telecommunication services, ten largest countries, 2016
Financial services
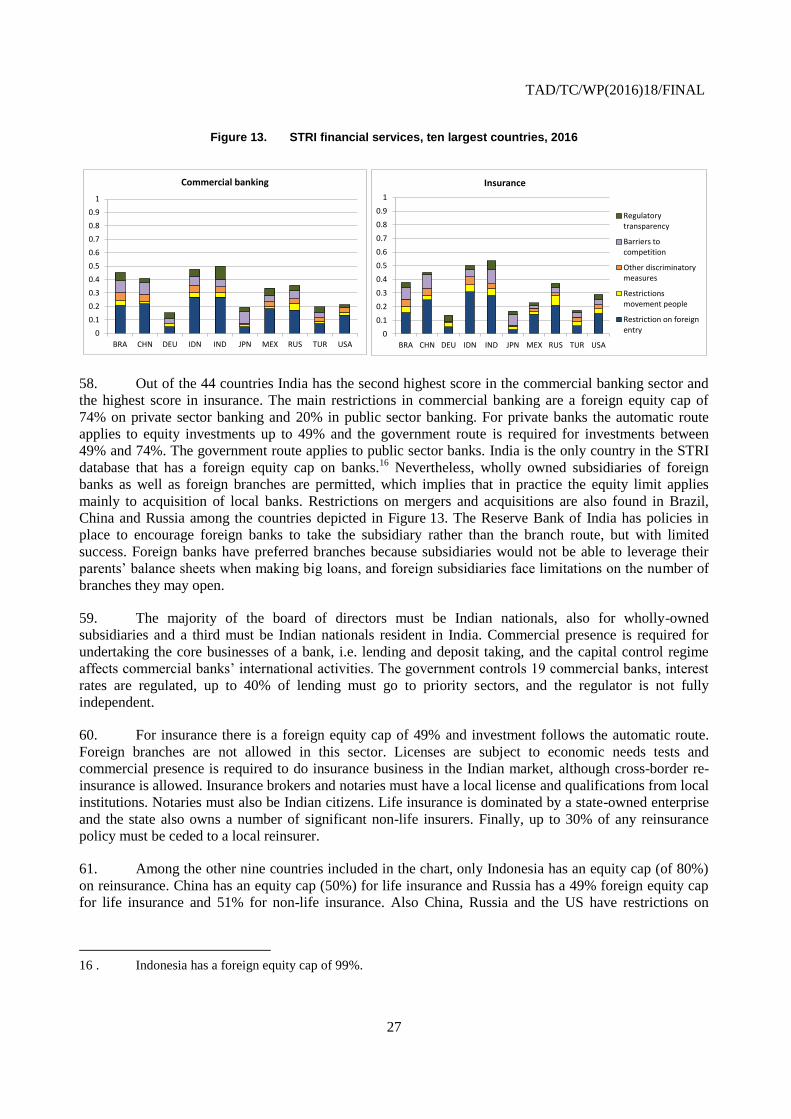
57. Finally, financial services are essential for economic development and growth (Levine, 2005). In
particular, financial services are important for the transition from an economy based largely on informal
economic activities to activities with access to legal enforcement of contracts and protection of workers’
rights, intellectual property and other benefits – in exchange for paying taxes and being subject to the
regulatory regime. Figure 13 depicts the STRI for the ten largest countries in the STRI database in
commercial banking and insurance.
0
0.1
0.2
0.3
0.4
0.5
0.6
0.7
0.8
0.9
1
BRA CHN DEU IDN IND JPN MEX RUS TUR USA
Regulatorytransparency
Barriers tocompetition
Other discriminatorymeasures
Restrictionsmovement people
Restriction on foreignentry
TAD/TC/WP(2016)18/FINAL
27
Figure 13. STRI financial services, ten largest countries, 2016
58. Out of the 44 countries India has the second highest score in the commercial banking sector and
the highest score in insurance. The main restrictions in commercial banking are a foreign equity cap of
74% on private sector banking and 20% in public sector banking. For private banks the automatic route
applies to equity investments up to 49% and the government route is required for investments between
49% and 74%. The government route applies to public sector banks. India is the only country in the STRI
database that has a foreign equity cap on banks.16
Nevertheless, wholly owned subsidiaries of foreign
banks as well as foreign branches are permitted, which implies that in practice the equity limit applies
mainly to acquisition of local banks. Restrictions on mergers and acquisitions are also found in Brazil,
China and Russia among the countries depicted in Figure 13. The Reserve Bank of India has policies in
place to encourage foreign banks to take the subsidiary rather than the branch route, but with limited
success. Foreign banks have preferred branches because subsidiaries would not be able to leverage their
parents’ balance sheets when making big loans, and foreign subsidiaries face limitations on the number of
branches they may open.
59. The majority of the board of directors must be Indian nationals, also for wholly-owned
subsidiaries and a third must be Indian nationals resident in India. Commercial presence is required for
undertaking the core businesses of a bank, i.e. lending and deposit taking, and the capital control regime
affects commercial banks’ international activities. The government controls 19 commercial banks, interest
rates are regulated, up to 40% of lending must go to priority sectors, and the regulator is not fully
independent.
60. For insurance there is a foreign equity cap of 49% and investment follows the automatic route.
Foreign branches are not allowed in this sector. Licenses are subject to economic needs tests and
commercial presence is required to do insurance business in the Indian market, although cross-border re-
insurance is allowed. Insurance brokers and notaries must have a local license and qualifications from local
institutions. Notaries must also be Indian citizens. Life insurance is dominated by a state-owned enterprise
and the state also owns a number of significant non-life insurers. Finally, up to 30% of any reinsurance
policy must be ceded to a local reinsurer.
61. Among the other nine countries included in the chart, only Indonesia has an equity cap (of 80%)
on reinsurance. China has an equity cap (50%) for life insurance and Russia has a 49% foreign equity cap
for life insurance and 51% for non-life insurance. Also China, Russia and the US have restrictions on
16 . Indonesia has a foreign equity cap of 99%.
0
0.1
0.2
0.3
0.4
0.5
0.6
0.7
0.8
0.9
1
BRA CHN DEU IDN IND JPN MEX RUS TUR USA
Commercial banking
0
0.1
0.2
0.3
0.4
0.5
0.6
0.7
0.8
0.9
1
BRA CHN DEU IDN IND JPN MEX RUS TUR USA
Insurance
Regulatorytransparency
Barriers tocompetition
Other discriminatorymeasures
Restrictionsmovement people
Restriction on foreignentry
TAD/TC/WP(2016)18/FINAL
28
cross-border mergers and acquisitions in the insurance sector. All ten countries in the chart require a
commercial presence to provide life insurance services in their country.
62. To summarize this section, India has relatively high scores on the STRI largely because of a
general regulatory framework which controls the flow of capital and natural persons. The general
framework amounts to a floor for the STRI score in all sectors before sector-specific restrictions are added.
The sector-specific requirements are mainly related to licensing, foreign equity caps and prior approval of
FDI. It is important to note that very few of the restrictions are unique to India. Indeed most of them are
found in some shape or form in OECD countries as well. Thus, rather than being qualitatively different
from the OECD Member countries, it is the accumulated number of trade restricting regulations that
explain the somewhat elevated scores on the STRI for India.
6. Impact of services sector reform on trade and on domestic competition
Services exports and imports
63. Even though the STRI is a relatively new source of information it already has been used in
several studies to analyse the relationship of services trade restrictions and cross-border trade in services.17
By now there exists ample evidence for a statistically robust negative effect of the barriers captured in the
STRI on services trade flows and a positive effect on services trade costs. Similar to the existing literature,
all results in this section are derived from gravity estimations on sector-level data. The gravity estimation is
a standard model in the empirical analysis of trade flows and trade barriers (see Box 2).
Box 5. The gravity model
The gravity model, pioneered by Tinbergen (1962), is the most widely used model in the analysis of international trade. Bilateral trade flows are explained by the size of the trading partners and trade costs between them. In that sense, it resembles the gravity forces between two objects, determined by their respective masses and the distance between them. Formally, the relationship can be written as
𝑒𝑥𝑝𝑜𝑟𝑡𝑠𝑖𝑗 =𝑌𝑖𝐸𝑗
𝑌𝑊 (𝑃𝑖𝑃𝑗
𝑇𝑖𝑗)
𝜎−1
so that exports from country i to country j depend on the output of country i, expenditure of country j, world GDP, the price levels in countries i and j and trade costs between i and j. This theoretical foundation of the gravity model was laid out by Anderson and van Wincoop (2003), based on differentiated products and homothetic preferences. Since then, a very large group of models has been identified which yield a gravity-like pattern for the volume of bilateral trade flows. However, not only the solid theoretical underpinning, but mostly the high explanatory power of the model has contributed to its success.
One shortcoming of the gravity model is the prediction of strictly positive trade flows between all country-pairs. This prediction is clearly refuted by the data. To deal with the existence of zero-trade in our dataset, we use the Poisson pseudo-maximum likelihood technique introduced by Santos Silva and Tenreyro (2006).
In order to obtain consistent estimates it is crucial to control for a country’s multilateral resistance to trade. This multilateral resistance represents unobservable country-specific trade costs which determine the price levels in the equation specified above. Since the multilateral resistance is unobservable, a straightforward strategy is the use of country fixed effects to control for this term. These fixed effects capture all variation in trade flows which systematically differs across countries. This raises the problem that the impact of country-specific trade barriers, such as the STRI,
17 . Nordås and Rouzet (2015; 2016) show the negative impact of the STRI on services trade and
manufacturing trade, while Nordås (2016) presents evidence that not only the level of the STRI but also the
regulatory heterogeneity captured in the STRI has a negative effect on bilateral trade.
TAD/TC/WP(2016)18/FINAL
29
cannot be identified anymore. A solution to this problem is described in the main text below.
Due to the missing overlap of time series data on trade flows and STRI scores, all regression coefficients are identified from different levels of bilateral trade between countries with different degrees of services trade restrictions, measured by the STRI score in 2014, not from actual changes of bilateral trade following a change of the STRI. Therefore, all results must be understood as potential for additional trade in services in the long run. There exists some evidence that trade liberalisation takes quite some time before coming into effect, even though most evidence is based on data of trade in goods. For example, Baier and Bergstrand (2007) identify a 10 year “phase-in” period for the effect of free trade agreements on trade flows. Such a time horizon also seems plausible for the required time until a regulatory reform fully translates into additional trade in services.
64. This chapter extends existing research by constructing within-country trade flows which are
included in the gravity regression in addition to the observed international bilateral trade flows.
Technically, these are calculated by subtracting the aggregate value of exports in a sector from the value of
production in this sector. To include internal trade flows in a gravity analysis, an otherwise standard
gravity equation is augmented by a binary variable indicating international trade, i.e. the variable is zero
when the services-producing country is equal to the services-consuming country and one in all other cases.
65. More intuitively, any firm has a choice between selling a service domestically and exporting,
with the transaction costs of selling locally being lower. If it wishes to export it faces restrictions to
services trade which are measured by the importing country’s STRI score. The estimation technique
exploits information on the difference between local sales and exports to derive the trade costs.
66. Consequently, the impact of services trade restrictions on trade flows can be identified from the
interaction of the STRI score with the border variable in this setup. The coefficient on this interaction
identifies whether services trade restrictions - as measured by the STRI - increase the frictions of trading
services across borders relative to consumption of domestic services. In other words, there is a negative
impact of services trade restrictions on cross-border flows, if more restrictive countries trade less with
other countries relative to what they consume domestically than countries with low restriction levels. This
allows including country fixed effects which control for all the country-specific variation of trade flows.
67. The estimation strategy is implemented on data on services trade flows that cover all years from
2010 to 2013 and come from three different sources: The OECD Trade in Services by Partner Country
(TISP) data; the WTO-UNCTAD-ITC trade in services database; and the United Nations Service Trade
database from UNSD, of which TISP is the preferred data source. When no information on the export
volume is available, imports reported by the partner country are used to fill the gaps wherever possible.
Information on the production value of services comes from the OECD national accounts data, while
gravity control variables come from CEPII.
68. The same strategy and dataset is used in Benz (2016) in order to calculate the tariff equivalents of
services trade restrictions, using import demand elasticities in the range from -1.5 to -5. An import demand
elasticity of -1.5 indicates specialised services that cannot easily be substituted for, whereas an import
demand elasticity of -5 indicates standardised services for which substitution between services of domestic
and foreign suppliers is relatively easier. The ad valorem tariff equivalents correspond to the hypothetical
tariffs that would generate the observed pattern of services trade in countries with different levels of
services trade restrictions. The results from that study indicate tariff equivalents for services trade differ
substantially across sectors. Two sectors, namely courier services and commercial banking are
characterised by services trade restrictions that correspond to very high tariff equivalents between 150%
and 2000% in the courier services sector and between about 120% and 1250% in the commercial banking
sector. In two further sectors, the STRI is equivalent to a tariff of intermediate size. In the
telecommunications sector the tariff equivalent is between about 50% and 300% and in the construction
services sector between 33% and 160%. In all cases, the upper threshold of the estimate corresponds to the
TAD/TC/WP(2016)18/FINAL
30
case where the service is relatively specialised while the lower threshold corresponds to the case where the
service is more standardised.
69. In addition to the calculation of average tariff equivalents the approach can be used to show the
trade potential of services trade liberalisation in India. Results are available for seven sectors. Five sectors
for which information on services trade barriers is summarised in the STRI: Computer services,
construction, courier services, telecommunication services, commercial banking. In addition the
availability of high-quality telecommunications services is paramount for trade in business services.
Hence, the information from the STRI in the telecommunications sector is used to evaluate the trade
potential in the business services sector and the overall potential for trade in services in India. The
regression coefficients are reported in Table A.1 in the annex.18
Computer services
70. India’s STRI score in computer services is 0.34 compared to an average of 0.23 as depicted in
Figure 7. The regression analysis shows that a reduction of the STRI score leads to a significant increase
of cross-border trade in this sector. So what would happen if India was to reduce its trade barriers in the
computer services sector to the average level of other STRI countries?
71. An example of reforms that would bring India’s index down to the mean is to eliminate
restrictions on movement of people providing computer services in India on a temporary basis (mode 4).
Such a reform is associated with an increase in cross-border trade in computer services of about 16% in the
medium to long run.
Construction services
72. India’s STRI score in the construction services industry is 0.31, as can be seen in Figure 7, while
the average STRI score of all countries is 0.23 and the median country has a score of 0.18. If India reduced
its STRI score to the mean, trade in construction services is predicted to increase by about 7%, while a
reduction to the median is associated with a close to 20% increase in construction services trade.
73. Such a liberalisation would require abolishing sector-specific as well as horizontal restrictions.
For example, opening the public procurement market to international competition and harmonising
national building design standards and construction product standards with international standards would
close half the gap to the mean STRI. The remaining gap would be closed by introducing administrative
reforms that improve the efficiency and reduce the cost of the regulatory process related to obtaining a
construction permit and by extending the initial duration of stay for inter-corporate transferees, contractual
services suppliers and independent services suppliers to three years.
Courier services
74. As can be seen from the representation of the STRI in India by sector in Figure 7, the courier
services sector is one of the country’s most restrictive services sectors with an STRI score of 0.55, almost
twice the mean, which is 0.29. The most restrictive countries in this sector reserve a large share of the
18 . This description of the results is based on point estimates of regression coefficients. It should be taken into
account that confidence intervals around these point estimates can be relatively large in some cases.
TAD/TC/WP(2016)18/FINAL
31
market for the designated postal services, while the more liberal countries have introduced competition in
the markets for delivery of letters and parcels.
75. One single regulatory reform – opening the postal services to competition - would bring India’s
STRI down to the mean. Currently, India Post maintains the exclusive privilege of carrying and delivering
letters in India. The abolishment of this monopoly would bring India into line with the sample average. Our
estimates suggest that this reform could boost cross-border trade in courier services by around 25%.
Liberalisation of cross-border e-commerce could further boost trade in courier services because
international shipments necessarily imply either imports or exports of courier services. The restrictions to
e-commerce are captured in the STRI for the distribution sector. While these cross-linkages are intuitively
evident, econometric identification is difficult and will not be pursued in this study.
Commercial banking
76. Trade in commercial banking services is relatively restrictive in India, indicated by an STRI
score of 0.50, whereas this sector already has been substantially liberalised in many other economies. The
mean score of all economies in the STRI database is 0.24. This implies that roughly half of all barriers to
trade in commercial banking need to be lifted to bring the regulatory environment into line with the
average of countries in the sample.
77. More than half of India’s current STRI score comes from restrictions on foreign entry. As noted
above, there exist restrictions on the establishment of foreign branches and limits on the number of
branches. Furthermore, the majority of the board members must be Indian nationals, there are quotas or
economic needs tests to receive a banking licence and the criteria to obtain a licence are more stringent for
foreign companies. There exist limitations on the cross-border transfer by customers as well as restrictions
on internet banking. An important regulation in the area of barriers competition is the directed credit
schemes, which require banks to allocate 40% of their net credit to priority sectors and business forms.
Amongst others, these include agriculture, education, renewable energy, and small and medium
enterprises. Bringing the STRI down to the average would require the lifting of all these restrictions, but
the reforms could drive up trade in banking services by around 75%.
Telecommunication services
78. Figure 7 shows that telecommunication services trade policies are relatively restrictive in India,
with a score of 0.48 which is more than twice the mean at 0.23. According to our estimates, a reduction of
India’s STRI score to the mean could more than double trade in telecommunication services. Such a
reduction would require full liberalisation of FDI through the automatic route and stronger pro-competitive
ex ante regulation on suppliers with significant market power, particularly in the fixed line and fixed
broadband markets. Thus, privatisation of the incumbents, stronger enforcement of interconnection and
access regulation by a fully independent regulator would bring the STRI score of India down towards the
average.
79. Trade in telecommunication services is also driven by the dynamics of international trade in
general, as well as by the number of business travellers and international tourists. Our results suggest that a
pro-competitive regulation in the telecommunications sector facilitates international communication and
can have important repercussions in the economy as will be elaborated below.
TAD/TC/WP(2016)18/FINAL
32
Business services
80. The quality of a country’s telecommunications network is an important determinant of the
general business environment. As shown in Table 10 below, the STRI in the telecommunications sector is
significantly correlated with the availability of broadband internet services.19
Since a fast and reliable
internet connection is paramount for many of today’s business transactions, in particular transactions
across international borders, we use the telecommunications STRI to assess the potential for growth in
cross-border business services in India.20
81. The regressions show that services trade restrictions in the telecommunications sector are indeed
significantly correlated with the volume of trade in business services. Reforms that reduce India’s
telecommunications STRI score to the mean could boost trade in business services by more than 100%.
This large effect becomes even more impressive when taking into account that business services account
for roughly 25% of total trade in services in India, as shown in Table 2. However, business services are not
the only sector of an economy that can benefit from high-quality telecommunications services. Evidence
on the importance of telecommunication services for exports of manufactured products is presented below
in Section 7.
Total services
82. Not only do business services rely on the availability of high-speed telecommunications services.
Computer services providers use broadband to connect with clients. For providers of transport and travel
services, it is crucial to be in contact with counterparts located in different regions or different countries.
Audio-visual services can be consumed online through streaming platforms. Brick and mortar structures
become less and less relevant for banking and distribution services, while the importance of electronic
exchange is increasing.
83. Due to this pivotal role of virtual connectivity for a high number of services it is not surprising
that we identify a significant relationship between total trade in services and a country’s STRI in the
telecommunications sector. While the magnitude of the effect is slightly smaller than for business services
only, the results still emphasise the importance of adequate regulation in this industry. A reduction of
India’s STRI from the current level of 0.48 to the sample mean is associated with an increase in services
trade by 85%.
Domestic competition
84. Restrictive regulation of services does not only affect imports and exports of services but it can
also have an impact on the level of competition in the domestic market. One commonly used indicator of
the strength of competition in a market is the price-cost mark-ups that firms obtain. The less competitive
pressure, the easier it is for companies to raise the prices that consumers or down-stream industrial
customers need to pay. Figure 14 depicts the protection that local firms enjoy from the services trade
restrictions covered by the STRI. Since a mark-up is similar to a sales tax from the customer point of view,
19 . See also Nordås and Rouzet (2015).
20 . According to the EBOPS 2002 classification these business services include: merchanting and other trade-
related services; operational leasing services; legal, accounting, management consulting, and public
relations; advertising, market research, and public opinion polling; research and development;
architectural, engineering, and other technical services; agricultural, mining, and on-site processing
services; other business services; and services between related enterprises not included elsewhere.
TAD/TC/WP(2016)18/FINAL
33
it is presented as the tax equivalent of the mark-ups that can be attributed to the level of the STRI score
(Rouzet and Spinelli, 2016).21
As in the previous section, India is compared to the largest countries in the
STRI sample.
Figure 14. Estimated tax equivalents of the STRI, selected sectors and countries
Source: Rouzet and Spinelli (2016). The vertical axis depicts percentage points.
85. The variation of tax equivalents across countries and sectors is determined by both the STRI and
the estimated mark-up, which is explained by market size and a number of structural factors other than the
STRI. Therefore, the ranking of countries in terms of the size of the tax equivalent and the STRIs may
differ. In the accounting sector, for instance, the United States has the lowest STRI in the sample, but the
smallest tax equivalent is in Germany. On average for these countries the tax equivalent of services trade
restrictiveness is the highest in accounting services and storage (one of the logistics subsectors) and the
lowest in courier services and distribution.
86. Bearing in mind statistical uncertainties, the result implies that the trade restrictions that India has
in place for e.g. distribution services cost consumers a sales tax equivalent of about 16%. By the same
token, the regulations captured in the STRI database for India on accounting services is equivalent to a tax
on businesses who must use local accounting firms of 60%. Finally the tax equivalent of trade restrictions
in telecommunications is about 27%. The mobile sector is highly competitive in India and mobile prices
21 . The study used the Orbis firm-level database to calculate mark-ups by firm, sector and country and
estimated the contribution of services trade restrictiveness measured by the STRI to the mark-up.
TAD/TC/WP(2016)18/FINAL
34
are among the lowest in the world.22
Businesses rely on landlines and fixed broadband to a much larger
extent than consumers, and this sector is less competitive with a low density and low average speed of data
flows, and these are the most likely to bear the cost of regulation or lack thereof.
7. Impact of services reforms on downstream sectors
Services and trade in manufactured goods
87. The Make in India initiative aims at attracting foreign direct investment to create jobs in export
oriented manufacturing. This section describes India’s trade performance in five of the priority sectors:
Automobile and components; Chemicals; Electrical machinery; Pharmaceuticals and Apparel. The analysis
is based on trade data at the 2-digit harmonised system (HS) classification, which breaks chemicals into
two categories (organic and non-organic) and apparel into knitted and crocheted and not knitted or
crocheted. Thus, seven 2-digit HS industries are included in the analysis.23
Export performance in these
sectors is analysed and related to access to credit, internet and logistics services which are essential
services inputs in product development, production, marketing and exports of manufactured products. The
analysis is conducted along three dimensions. First, it looks at the pattern of geographical and product
diversification of Indian exports. Second, prices obtained in major export markets are described and the
determinants of export prises analysed. Finally, a possible relationship between access to services and
services trade policy and regulation is explored.
88. Figure 15 shows exports in the selected sectors over the past decade and also the combined share
of these sectors in India’s total merchandise exports.24
The fastest growing exports depicted in the chart are
clearly motor vehicles, while growth in exports of electrical machinery has levelled off and even reversed
in recent years. It is also noted that the share of these sectors in total merchandise exports has fluctuated
between 20% and 25% over the decade. India’s exports are largely oriented towards United States and the
European Union. The exception among the sectors depicted in Figure 15 is inorganic chemicals for which
China constitutes the largest export market and also Russia, Iran and Bangladesh feature prominently. Sri
Lanka and Bangladesh are important markets for the Indian car industry.
89. Table 6 reports the details on the geographical and product diversification of Indian exports. It
shows the number of export markets for each 2-digit category, and then the number of 6-digit products
under each category exported to major markets. The geographical distribution ranges from 165 export
markets for inorganic chemicals to 201 in pharmaceuticals. Thus, Indian products are available almost
universally. It is also interesting to note that India exports a broad range of 6-digit products and that the
diversification on product lines is most prominent in the US market. India exports more than 60% of all
possible 6-digit products covered by these seven sectors to the US. For comparison, China exports about
70% of all HS categories to the US.
22 . Price data from International Telecommunications Union (ITU) show that in India the price of mobile-
cellular prepaid one-minute local call (peak, off-net) is the second lowest in the world. The lowest is in
Bangladesh.
23 . See the OECD Economic Survey of India, 2014 for a more in depth analysis of the manufacturing sector,
and Arnold et al. (2014) for a study relating services sector reforms to the performance of manufacturing in
India.
24 . The by far largest export categories ‘mineral fuels, mineral oils and products of their distillation’ and
‘precious metals, precious stones and jewellery’ are not included in the analysis.
TAD/TC/WP(2016)18/FINAL
35
Figure 15. Exports, selected industries
Source: COMTRADE
Table 6. India’s export diversification, selected countries and sectors 2014
Number of 6-digit categories exported by partner and number of export markets
Inorganic chemicals
Organic chemicals
Pharma-ceuticals
Apparel Electrical machinery
Motor vehicles
HS 28 HS 29 HS 30 HS 61 HS 62 HS 85 HS87
Export markets 165 182 201 186 195 196 195
Number of 6-digit products exported to selected markets:
USA 104 209 58 86 92 184 45
United Arab Emirates 106 186 67 86 88 186 55
Germany 62 187 55 90 80 151 41
China 46 175 53 58 59 139 32
South Africa 66 139 29 62 71 146 44
Memo: 6-digit prod. in HS Chapter
182 333 125 116 119 286 76
Source: WITS. The countries included are the five largest export markets for the seven categories combined. EU is the largest market, and Germany is chosen as the representative EU market.
90. Having a highly diversified manufacturing export base is a policy objective that many countries
strive for. A first glance at the data suggests that India has a dynamic manufacturing sector willing to
venture into new markets. However, a closer look reveals that exports are thinly distributed across a large
number of products and markets and that the average export volume for each product-destination pair is
small.25
25 . Comparing to the countries that come closest to India in market size, which is an important determinant of
export volume, the skewness of India’s exports is 40.7 compared to 11.2 for Brazil, 32.3 for Canada, and
21.7 for Italy. Roughly speaking, the higher the skewness the more observations are found at the low end
Chemicals Pharmaceuticals Apparel Electronics Motor vehicles Share of total
TAD/TC/WP(2016)18/FINAL
36
91. It is well documented that entering a new market is a risky business and most new entrants fail
after the first couple of years. Access to credit encourages market entry and a well-developed financial
market absorbs the risk that each individual investor and exporter faces (Besedes et al, 2014). Furthermore,
access to timely, accurate and relevant information helps exporters select the markets that best match their
products, thereby reducing risk. A large and dispersed diaspora has been an important source of market
information and external demand for great trading nations in the past and even today there is evidence that
the diaspora can be important for trade linkages (Gould, 1994; Head and Ries, 1998 and Aleksynska and
Peri, 2014). A recent study focussing on the Indian diaspora found that Indian migrants are an important
driver of exports from India to their new home country, and more so than for instance the Chinese diaspora
(Giovannetti and Lanati, 2015).26
92. It appears that the main challenge for meeting the Make in India objectives may be strengthening
and scaling up existing trade linkages beyond the relatively small niches currently characterising Indian
exports. Policies supporting the scaling up of activities may be quite different from those that aim at
assisting firms to enter new markets. A standard tool that makes the distinction between barriers to entry
and barriers to operations and to scaling up is the gravity model (see Box 2). It not only explains the
volume of trade between partners that already trade with each other (the intensive margin of trade), but
also the likelihood that countries will trade with each other in the first place (the extensive margin of
trade).
93. The role of access to services, particularly services that connect markets both physically and
virtually takes centre stage in the analysis. Virtual connectivity is provided by telecommunications
operators. Thus, manufacturers rely on access to broadband internet services and secure servers to use
process and store the information they need to compete in modern, largely digitised markets. Physical
connectivity increasingly relies on logistics which connect different modes of transport and ease the flow
of goods and the related processing of required documents. Finally, financial services have already been
mentioned as a service that helps spread the risk of entering new markets.
26 . United Arab Emirates (UAE) is India’s second largest trading partner. About 30% of the population in
UAE is of Indian origin. According to UN Population Division Migration Statistics, there were 2.8 million
Indian migrants in UAE out of a total population of 9.3 million in 2013.
TAD/TC/WP(2016)18/FINAL
37
Box 6. Determinants of the extensive and intensive margin of trade
Entering into a new market is associated with a number of activities such as market research, establishing a contract with a distributer, complying with local regulations and establishing after-sales services to mention but a few. Such activities cost money and a firm, unless it is very big, is not able to deploy the necessary resources in all countries in the world. As a result, most firms export to only a few countries. Furthermore firms from a given country in a given industry have a tendency to export to the same countries. In the detailed trade statistics this is reflected in a large number of country pairs that do not trade with each other in certain products.
Zero inflated Poisson is an econometric technique used for count data with excessive zero observations. It builds on the underlying assumption that with a probability p the only possible outcome is zero and with a probability (1-p) a Poisson random variable is observed. In the context of bilateral trade at a very detailed product level, bar re-exports, zero is the only possible outcome for exports if there is no production of the item in question in the country, or if the market price is lower than bilateral trade costs. If there is local production and trade costs are not prohibitive, on the other hand, bilateral exports are a random variable (including zero) depending on the characteristics of the exporting and importing countries and relative trade costs. The result of regressing exports from all countries in the world to ten selected markets at a 6-digit HS level for selected industries is reported in Table 7.
Table 7. Determinants of entry and export values, pooled manufacturing
Baseline With services
Exports Inflate Exports Inflate
Ln distance -0.654*** 0.276*** -0.628*** 0.157***
(0.053) (0.005) (0.063) (0.005)
Ln GDP per capita 0.502*** -0.895*** 0.744*** 0.245***
(0.068) (0.009) (0.215) (0.016)
Ln population 0.927*** -0.812*** 0.932*** -0.381***
(0.062) (0.011) (0.087) (0.011)
Ln Area -0.283*** 0.114*** -0.337*** -0.036***
(0.064) (0.005) (0.092) (0.005)
Credit -0.325** -0.232***
(0.145) (0.017)
Logistics 0.486 -8.617***
(1.386) (0.103)
Broadband 0.418*** -0.503***
(0.073) (0.014)
Server -0.307*** 0.174***
(0.102) (0.007)
chi2 4822.251 5446.859
N 1627020 1080540
Note: Pooled zero inflated Poisson regressions for the exports of seven HS 2-digit sectors (28, 29, 30, 61, 62, 85, 87) run at 6-digit level for all countries in the world to UAE, China, Germany, India, Japan, Korea, Malaysia, South Africa United Kingdom and the United States. Robust standard errors clustered on 6-digit products are reported in parentheses. ***, **, * signify statistical significance at 1%, 5% and 10% levels respectively. The probability of zero trade is estimated using logit. The Vuong test strongly supports using zero inflated Poisson rather than simple Poisson.
The columns labelled “Exports” report the contribution of each variable to explaining export flows, while the column labelled “Inflate” report the contribution of each variable to explaining the probability that countries will not
trade with each other. Thus, a negative coefficient on the services indicators in the inflate columns mean that the services indicators increase the likelihood of entering new markets.
Comparing the baseline and the regressions adding the services performance indices reveals that more than a third of the observations are lost, since, as Table 8 below suggests, information on one or more of the services indicators are missing for many countries. The services indices are also correlated with each other and with GDP per capita. For these reasons, the services performance indices were also entered into the regressions one by one for robustness checks. The result is essentially the same for each index (see Annex Table A2).
TAD/TC/WP(2016)18/FINAL
38
94. The services indicators selected for further empirical analysis are fixed broadband subscribers per
100 inhabitants and secure services per 1 million people.27
Financial services are represented by bank
credit to the private sector as share of GDP. Finally the World Bank overall logistics performance index
which takes values between one and five, with five representing best performance is used as a measure of
physical connectivity. The summary statistics for these variables for all exporting countries included in our
analysis are reported in Table 8. India’s performance on the services-related development indicators is
about the sample average for logistics and bank credit to the private sector. For the internet indicators,
however, India lags far behind the sample average of almost 240 countries and territories.
Logistics performance index 192 3.05 0.53 2.08 4.12 3.08
Bank credit to private sector 116 52.64 33.28 4.84 179 51.5
Fixed broadband density 188 14.34 12.89 0.007 46 1.24
Secure internet servers per 1 million people 238 419.38 837.14 0.157 6490 5.54
Source: WDI. Bank credit to private sector is supplemented with information from Bank of International Settlement when missing in WDI.
95. These four services indicators are added to the specification of the gravity model that
simultaneously features both the extensive and intensive margin of trade. The model is estimated on pooled
export data from all the countries in the world to ten selected countries. These are United States, UAE,
Germany, China and South Africa as reported in Table 6, and in addition the United Kingdom, Japan,
Korea, Malaysia and India are included. Export data is at a 6-digit level of detail for the seven 2-digit
sectors. Importantly, the trade data records both positive trade flows and the zero values of trade between
country pairs that do not trade a specific 6-digit product. Technical details and the regression results are
reported in Box 3, while estimations by 2-digit sector and destination are reported in annex tables A2 to
A4.
96. For all services indicators except secure server density the results mean that the better the
performance of the services the more diversified are exports. Thus, better services performance is
associated with exporting a larger number of HS-6 category products to a larger number of destinations.
The relationship between services and the volume of manufactured exports per product-destination is,
however, more mixed. Logistics do not have a statistically significant impact on manufacturing export
volumes; broadband density is positively associated with export volumes; and secure server density is
negatively associated with both export volumes and the number of export markets. The aggregate results
thus suggest that access to credit and logistics is important for entering a market, but not necessarily for
staying and expanding the volume in existing markets. Access to broadband helps expanding trade both at
the extensive and the intensive margin, while a higher density of secure servers is associated with less
manufacturing exports. These findings are true on average for all sectors and countries included in the
analysis. However, the average conceals some interesting differences both across export markets and
across sectors.
27 . For each of these variables the natural logarithm of the number provided in the WDI database is included
in the regressions.
TAD/TC/WP(2016)18/FINAL
39
97. While access to credit is negatively associated with export volumes in the aggregate, it is
positively associated with exports to India and to exports of apparel.28
A possible explanation could be that
a well-developed market for credit is important for succeeding in markets with high risks. The Indian
market may be perceived by foreign exporters as relatively risky. The apparel sector where fashions
change quickly in unpredictable ways may also be subject to high risk.
98. A higher score on the logistics performance index is insignificant for export volumes in the
aggregate. However, a detailed analysis by country reveals that better scores on logistics are associated
with both higher volumes and more diversified exports to UAE, Germany, the United Kingdom, Korea and
South Africa. A detailed analysis at the sector level shows that in the apparel and electrical machinery
industries, better logistics is associated with more diversified exports and smaller volumes of each 6-digit
product to each market.
99. Better access to broadband is associated with more diversified exports and higher trade volumes
in the aggregate. However, broadband appears to be significantly related to export volumes only for
exports to the OECD countries and to South Africa. For exports to UAE, China, India and Malaysia, a
higher broadband density affects the extensive margin only. Turning to a detailed analysis by sector, they
mainly follow the aggregate pattern, but for pharmaceuticals, a higher broadband density is associated with
exporting a smaller volume to a larger number of countries. This pattern – spreading a given volume on a
larger number of 6-digit products to a larger number of export markets – is also found for secure server
density in the apparel and electrical machinery industries.
100. To summarize these findings, the services that help spreading or reducing the risks related to
exporting are consistently associated with more diversified exports of manufactured products. In some
cases export diversification goes together with higher volumes of each category on average, while in other
cases export diversification is associated with lower volumes of each product on average. As noted India’s
exports are highly diversified with relatively low volumes for each market. This pattern is consistent with
the results reported in Box 3, bearing in mind that India’s logistics performance index and credit to private
sector are both around average for all countries, while it lags quite far behind in broadband and secure
server density. To get the full picture of how the trade patterns relate to competitiveness, prices obtained in
the export market should also be taken into account. A high rate of diversification in up-market niches is an
indicator of industrial sophistication, while a high rate of diversification combined with low export prices
could reflect a competitiveness problem and constraints on scaling up production and exports.
Services and prices obtained in export markets for manufacturing
101. Having established that India’s exports in the sectors that feature prominently under the Make in
India initiative are highly diversified, but thinly spread both geographically and in terms of product lines, it
is interesting to look at unit prices as a next step in the analysis. Figure 16 plots the average unit price for
Indian exports that each 6-digit product obtains across all markets, compared to the average unit price
obtained by all exporters. The horizontal axis depicts the deviation from average (calculated as (India’s
unit price)/(average unit price) -1)) and can take values between (but not including) minus one and infinity.
Zero represents the case when India’s average unit price is the same as the average price obtained by all
exporters.
28 . Access to credit is weakly related to export volumes. The coefficient is negative and statistically significant
at a 5% level when controlling for the other services indicators (Table 7) but not statistically significant
when introduced in the regression on its own (Table A2).
TAD/TC/WP(2016)18/FINAL
40
102. It is noted that for India’s exports of chemicals and electrical machinery the largest fraction of the
6-digit product categories obtains a lower price than average in export markets. For the other industries
most of India’s exported products obtain a price around the average, while unit prices are skewed towards
the low end for all sectors. A long tail of relatively high prices is however observed for electrical
machinery (85) and chemicals (28 and 29). The only industry where Indian exporters obtain a unit price
above the (unweighted) average for all exporters is inorganic chemicals where the unit price is about 5%
above average. For the other industries unit prices are between 6% and 15% below the average for all
exporters. For comparison, China obtains about the same prices as India for chemicals and
pharmaceuticals, but for all other sectors China obtains higher export prices.
Figure 16. Unit prices obtained by India’s exports relative to the average, 2014
Estimated at 6-digit HS 2002 level
Note: The sectors depicted are HS 2002 classification: inorganic chemicals (28) organic chemicals (29) pharmaceuticals (30); apparel, knitted or crocheted (61); apparel not knitted or crocheted (62); electrical machinery (85); and transport equipment (87). The graphs show the fraction of HS 6-digit products that obtains a price that deviate from the average by the amount indicated on the horizontal axis. Source: estimated by authors from CEPII unit value database.
103. Does India obtain lower prices than average in export markets because its exports are highly cost-
competitive, or is it because exports mainly target the low-end market – or both? A casual look at Table 6
suggests that it is not because India’s exports target markets with low purchasing power. To answer the
question more precisely, one first needs to obtain clarity on the determinants of export prices. Of course
product characteristics are the most important, but there is significant variation both across suppliers within
a market for a narrowly defined product category and across markets for the same supplier and the same
product category. A relatively small literature has looked at this question and found that the unit prices
obtained in a foreign market are positively correlated with GDP per capita in the exporting country as well
TAD/TC/WP(2016)18/FINAL
41
as the importing country and with the distance between the two markets (Fontagné et al., 2008; Berthou
and Emlinger, 2011). The latter reflects the “shipping the good apples out” effect where countries tend to
ship the best quality and up-market products to distant markets since these are the products that can best
absorb the extra cost of long-distance shipping.29
104. These variables are all factors to which exporters have no choice but to adjust. But surely there
are opportunities for exporters to invest in higher quality and for policy makers to reduce the cost of
exporting. The importance of intermediate inputs for the quality of the final product and the price it obtains
in the market has mainly been studied for intermediate goods (Bas and Strauss-Kahn, 2015), but there is
every reason to believe that raising the quality and cost effectiveness of services inputs would have a
similar effect. Evidence on this link can be drawn from a positive relationship between the quality,
diversity and cost of services inputs and productivity in manufacturing. For instance, offshoring of ICT-
related services to India has been found to raise productivity in U.S. manufacturing (Amiti and Wei, 2009).
Table 9. Determinants of unit export prices, pooled manufacturing
Pooled regressions, 2014
Baseline With services
Ln distance 0.218*** 0.207*** (0.007) (0.007) Ln GDP per capita 0.313*** 0.150*** (0.012) (0.019) Ln population -0.131*** -0.007 (0.013) (0.012) Ln area km
Note: OLS regressions of unit price obtained in export markets pooled over seven industries (HS2002 28, 29, 30, 61, 62, 85, 87) and ten countries (China, Germany India, Japan, Korea, Malaysia, South Africa, UAE, the United Kingdom and United States), with robust standard errors clustered on 6-digit HS categories. ***, **, * signify statistical significance at a 1%, 5% and 10% level respectively.
105. Access to credit, logistics services and internet services are likely to affect export prices as well
as export volumes and diversification as demonstrated in the previous section. Services may affect prices
29 . See Hummels and Skiba (2004). In addition some recent papers distinguish between productivity and cost
effectiveness on the one hand and product quality on the other as determinants of export prices. They find
that products for which price competition dominates, export prices decline with distance, while products
for which quality dominates export prices increase with distance and in the middle are some products for
which export prices are not affected by distance. In the aggregate, it appears that a positive relationship
applies to both income levels and distance. See Benedetti Fasil and Borota (2013) for a recent contribution
and survey.
TAD/TC/WP(2016)18/FINAL
42
through lower costs or higher quality or both. We expect that logistics first and foremost reduce costs,
while access to broadband services may help improving quality through better access to information and
information-intensive business services such as engineering, design, R&D and market intelligence. Access
to credit could affect both cost and quality. This is an empirical question which we explore by introducing
the four services performance indicators from the previous section into export unit price regressions. We
include the same ten export markets and the same seven sectors as in the previous section, broken down to
the 6-digit level of detail. We follow previous studies and control for GDP per capita and distance and add
exporter population size to capture possible scale effects; and land area of the exporter to capture possible
internal distance that could add to the impact of bilateral distance. Table 9 presents the results for a pooled
regression using importer and industry fixed effects to control for unobserved industry and export market
characteristics. Detailed analysis by export market and sector is reported in annex table A6.30
It is noted
that internal distance, approximated by area, has a similar impact on export unit prices as bilateral distance,
although the coefficient is much smaller. Population size is negatively associated with unit export prices,
suggesting that economies of scale may be significant and improve the price competitiveness of exports.
106. As expected, the first two services indicators are associated with lower export prices, while the
internet related services indices are associated with higher export unit prices. These results are consistent
with other studies that distinguish between cost and value services (e.g. Arbache et al, 2016), suggesting
that high-speed internet services belong to the value services category. The channels through which these
could add to quality are many. First, internet services facilitate using information for monitoring markets
and differentiating products so that they better match consumer tastes at any point in time (Nordås, 2011).
Second, internet services open for new possibilities for bundling goods and services, including after-sales
services, establishing customer communities on social media and the like (Lee et al., 2016). Finally, access
to broadband internet services and secure servers facilitates computer assisted design and manufacturing
(CAD/CAM) which are standard in many industries, as well as 3-D printing which is also gaining a
foothold in manufacturing. Thus, reliable and cost-effective broadband allows manufacturers to source
state of the art digital engineering and design globally, while secured servers ensures that the designers can
protect the intellectual property embodied in the digital designs. The results suggest that a 10% increase in
the density of broadband raises export prices by 1.2% and a 10% increase in the server density raises prices
by about 2% on average. The logistics performance index is associated with lower export prices. A 10%
increase in this index is associated with about 20% lower export prices on average. Also bank credit is
associated with lower export prices. Thus, 10% more bank credit relative to GDP is associated with about
1.4% lower export prices.
107. The impact of services performance on export prices varies somewhat across export markets and
sectors (see annex Table A6). The German and Indian markets appear to be the most sensitive to cost-
related services, while Korea seems to be the market where export prices are most sensitive to internet-
related services. Export prices obtained in the UAE, India’s second largest export market, are more than
average sensitive to all four services indicators. South Africa is the market where prices are the least
sensitive to the services performance in the exporting country.
108. Turning to industries, there are quite interesting differences. First, the results for the two apparel
sectors and electronics are consistent with the aggregate pattern and export prices obtained for electronic
products are more sensitive to services performance in the exporting country than average. Bank credit and
logistics do not seem to matter for prices obtained in export market for pharmaceuticals, but access to
internet services is strongly and positively related to prices obtained in export markets. Bearing in mind
that pharmaceuticals have a very low weight to value ratio and strongly rely on R&D inputs, the result is
30 . Annex table A5 reports the result of regressions using the core explanatory variables reported in the
literature to make sure that our sample of products exhibit the properties documented in previous studies.
TAD/TC/WP(2016)18/FINAL
43
not surprising. Export prices obtained for chemicals are strongly related to logistics performance, but not
so much the other services. Finally export prices in the motor vehicle industry are the least sensitive to
services performance among the sectors included in the analysis.
109. The results on the impact of services on export prices are particularly interesting for the cases
where services are associated with a higher degree of diversification and smaller volumes for each product
in each market. We recall from the previous section that this was the case for secure server density in the
electronics and apparel industries. The positive association with export prices thus suggest that access to
secure services is important for developing high-end niche markets, particularly in India and the US. A
similar combination of effects is found for access to broadband services in the pharmaceutical industry.
However, the finding that logistics services are associated with a higher degree of diversification and
smaller volumes for inorganic chemicals is not associated with higher prices. In this sector it appears that
diversification may be a strategy for spreading risk across many products and markets in a highly cyclical
sector.
110. The findings regarding the relationship between services and manufacturing competitiveness can
be summarised as follows:
Access to credit is important for cost competitiveness and supports manufacturers’ entry into
new markets. Access to credit is particularly important in the apparel and electrical machinery
industries, which tend to be subject to a great deal of uncertainty related to rapidly changing
consumer tastes.
Well performing logistics is very important for cost competitiveness and strongly supports
manufacturers’ entry into new markets in all sectors; underscoring that reliability with respect
to timely delivery has become a universal requirement.
Access to broadband supports manufacturers’ entry into new markets while increasing the
total volume of exports, and is thus associated with trade expansion both at the extensive and
intensive margin. This effect is particularly strong for exports of apparel, electrical machinery
and motor vehicles. For apparel and electrical machinery, better access to broadband also
helps shift exports towards the higher end of the market.
The presence of secure servers is associated with a greater ability to export into high-end
niches.
111. If it is indeed the case that Indian manufacturers face constraints mainly related to scaling up
exports in existing markets, it appears that improvements in fixed broadband services should be a priority
area of reform.
Key services sector performance and services trade policy
112. Having documented that trade performance in manufacturing sectors targeted by the Make in
India initiative is strongly related to key services sector performance, we now turn to the relationship
between services sector performance and services trade policy. For this purpose we use the STRI indices
discussed in Section 5. The STRI indexes that capture the policy environment facing credit markets,
logistics services suppliers and broadband services suppliers respectively are the index for commercial
banking, the four indices for logistics services and the index for telecommunications.
TAD/TC/WP(2016)18/FINAL
44
113. A simple OLS regression relating the STRI for commercial banking, telecommunications and the
four logistics sectors respectively, controlling for GDP per capita and GDP is presented in Table 10.31
Clearly, services sector performance is strongly related to the scores on the STRI in logistics and
telecommunications respectively, although bank credit to the private sector cannot be explained by this
simple relationship.32
Therefore banking reforms alone may not contribute significantly to raising domestic
credit in the short to medium run. The relationship between the logistics performance index and the STRI
in freight forwarding could also not be precisely estimated.
Table 10. Services performance and services regulation
Logistics performance index Credit Broadband Server
STRI LScar LScus LSfgt LSstg FSbnk TC TC
Ln GDP per capita 0.244*** 0.280*** 0.281*** 0.262*** 0.438*** 0.616*** 1.500***
Note: The services performance indicators are related to the STRI for the sector in question using OLS. Robust standard errors are reported in parenthesis and ***, **, and * signify statistical significance at a 1%, 5% and 10% level respectively. The STRI indices entered in the regressions are logistics cargo handling (LScar), logistics, customs brokerage (LScus), freight forwarding (LSftg), logistics storage and warehousing (LSstg), commercial banking (FSbnk) and telecommunications (TC). The row entitled STRI reports the coefficient on the STRI index reported in the column subheading.
114. Correlation does not mean causation, and it takes time for policy reforms of take full effect in the
economy. With this caveat in mind, we now undertake a simple experiment analysing what could be the
impact of reforms that would bring India’s STRI closer to the average. Starting with logistics, policy
reforms that would bring India’s score down to the average could result in an increase in the logistics
performance index from 3.08 to about 3.6, which could move India up the ranking from 54th place to 25
th;
between Malaysia at 3.59 and Finland at 3.62. Such advancement in the logistics performance ranking is in
turn associated with cost competitiveness improvement of about 25% on average across products and
export markets. Examples of reforms that would bring the index down to the average are raising foreign
equity limits to allow majority ownership for cargo handling; introducing pro-competitive reforms such as
prohibiting cross-subsidization in cargo handling, storage and warehousing; removing the nationality
requirement for obtaining a license as a customs broker and privatising cargo handling at air ports and rail
terminals.
31 . Rich countries tend to have larger and more diversified services sectors, as suggested in Section 2. In the
presence of economies of scale the overall size of the economy could also play a role for the performance
of services.
32. However, as reported in Nordås and Rouzet, (2015; 2016), credit to the private sector is significantly lower
in countries with a high score on the STRI for commercial banking than countries with a low score on the
STRI. That analysis classifies countries into three categories of services trade restrictiveness (low, medium
and high).
TAD/TC/WP(2016)18/FINAL
45
115. As Table 8 shows, India lags behind as far as broadband and secure server penetration is
concerned. Reforms that would lower India’s score on the STRI in telecommunications to the sample
average are associated with an increase of broadband penetration and secure servers penetration by about
50%. This change is in turn associated with 15% higher export prices on average across markets and
sectors and the long-run effect on exports value could be an increase of as much as 30%. Reforms that
would bring the STRI down to the average could be full liberalisation through the automatic route of FDI
in the sector, lifting the nationality requirement for board of directors and the introduction of a fully
independent regulator overseeing pro-competitive regulation of suppliers with significant market power.
116. To summarize this section, it has shown that India’s performance in logistics is about average for
all countries in the world. Nevertheless, there is ample scope for improvement towards best practice.
Reforms to the effect of making the markets for cost services more open to competition both from foreign
services providers and for local start-ups would over time help improve India’s performance in cost related
services sectors which in turn would significantly improve the cost competitiveness of India’s
manufacturing. We have also shown that India lags behind when it comes to rolling out internet services.
Such services are very important for modern manufacturing and competitiveness in markets for
differentiated products that obtain a premium in export markets. Reforms in the telecommunications sector
that bring the score on the STRI index down to the sample average could over time significantly improve
broadband and secure server penetration rates. This could in turn help raise export prices by 15% and
export value by 30%.
8. Conclusions and policy recommendations
117. This study has emphasised that India’s services-led growth over the past couple of decades has
been partly a catch-up process of bringing traditional services such as transport and distribution up to speed
with what could be expected from India’s level of development and partly an unprecedented boom in
modern ICT-related services and other business services. Services have stimulated growth in the Indian
economy and generated numerous skilled and semi-skilled jobs. Furthermore, offshoring of ICT services to
India has improved productivity in countless companies around the world.
118. Nevertheless, modern services account for only 6% of total employment in India. With a large
and growing labour force, jobs for less skilled workers are needed as well. The manufacturing sector is
seen as an important source of future employment and growth. Against this backdrop the Make in India
initiative aims at developing a competitive manufacturing sector through a number of policy initiatives
designed to attract investment and create jobs.
119. This study finds that services have an important role to play in generating jobs and growth in its
own right, but also for supporting the development of the industrial base. In the current industrial
environment speed to market and customisation of products even at the low end of the product spectrum
are essential for competitiveness. Speed to market and customisation in turn are associated with efficient
and effective logistics services and access to fast and high capacity broadband internet connections.
Manufacturing also relies on business services some of which India has ample experience in exporting.
With a fast growing local manufacturing sector, a virtuous cycle of growing domestic demand for business
services and diversification of local business services, including the professional services, could sustain
India’s growth and broaden its export base both in manufactured goods and business services.
120. To set in motion such a virtuous cycle, services sector reforms are needed. India scores well
above the average on the STRI in most sectors and among the highest of all countries in some sectors. The
scores stem partly from a general business environment that imposes significant costs of establishing and
conducting business. Among these are restrictions on the movement of people for the purpose of providing
services, restrictions on access to land and real estate, rules and regulations related to establishing a branch
TAD/TC/WP(2016)18/FINAL
46
or subsidiary and relatively burdensome administrative procedures for obtaining the permits and licenses
needed to conduct business. Thus, liberalising international trade and FDI alone would not make a
sufficient dent in the cost of establishing and conducting business to obtain the objectives of the Make in
India initiative.
121. Retailers play an increasingly important role in connecting manufacturers of consumer goods and
consumers at home and abroad. Furthermore, retailers have been among the sectors the most affected by
the digital revolution. Successful retailers have created new business models combining bricks and mortar
and bytes, giving them flexibility to monitor and respond to shifts in consumer demand. Retailers
increasingly enter into contractual relationships with manufacturers and help them produce the products
that consumers want and comply with product standards set by the retailers themselves as well as by
governments. The production of consumer goods, including apparel, is labour-intensive and demand-
driven. Modern retailers could connect local manufacturers, including SMEs, both to the vast Indian
market and beyond. However, India’s policy for the retail sector not only limits market access through caps
on foreign ownership, it also imposes certain business models on the retailers that may prevent them from
innovating and seizing the opportunities in the digital economy.
122. Railways have played an important role for the industrialisation of large countries such as the US,
China and Canada in the past. Although container transport on roads have taken much traffic from railways
in recent years in most countries, rail freight still has a role to play, particularly in bringing bulky raw
materials to the manufacturer and industrial products such as chemicals to the markets. Indian rail freight is
completely dominated by a state-owned enterprise with close to monopoly on freight operations. Reforms
to attract more investment in capacity have been introduced, but it is important that the reforms also extend
to introducing competition in freight operations. This could significantly improve the cost competitiveness
in international markets for industries such as chemicals.
123. Other transport and logistics sectors also have a relatively high score on the STRI. In air and
maritime transport a number of sector-specific regulations contribute to raising costs for manufacturers
which engage in external and internal trade. In maritime transport the regulations currently in place are
estimated to be equivalent to a tax of about 20%. These are costs borne by the users of the services,
including manufacturers. Clearly such high tax equivalents of regulations and trade restrictions are a drag
on manufacturers’ international competitiveness and their ability to create jobs in the local economy. One
policy measure that could be particularly problematic for the competitiveness of manufacturing is cargo
reservation schemes. Most countries have rolled back such schemes and India could consider the benefits
of lifting this regulation as well. In addition ports play a key role for the seamless flow of goods. Bearing
in mind that a chain is as strong as its weakest link, burdensome regulation and barriers to enter cargo
handling services in ports could have repercussions along the transport chain and impose considerable
costs on manufacturers.
124. This study has found that India’s manufacturing exports are highly diversified across countries
and products. Although ubiquitous, Indian exports are thinly spread with relatively small volumes in each
market. This does not appear to reflect a focus in high-end niche products as prices obtained in export
markets with few exceptions tend to be low. The study has identified access to broadband services and
secured servers as an important driver of exports to high-end and less price sensitive markets.
125. Indian consumers and businesses enjoy a vibrant and competitive market for mobile
telecommunications. Mobile telephony may satisfy consumers’ demand for connectivity, but for businesses
fixed broadband remains crucial for thriving in the digital economy. In this area India lags far behind the
global average. India could draw lessons from its own mobile market to motivate pro-competitive
regulatory reforms on fixed broadband related activities. The recent initiative by the regulator (TRAI) to
review regulations is promising and deserves support. Over time pro-competitive regulatory reforms could
TAD/TC/WP(2016)18/FINAL
47
significantly improve Indian manufacturers’ access to broadband and extending the reach of business
services to domestic as well as foreign customers.
126. The professional services are particularly well positioned to gain from better broadband access.
Many of their activities can be digitised and traded over the internet both over vast distances within India
and abroad. Thus, better connectivity could give local manufacturing plants access to Indian business
services that tend to be clustered in hubs such as Bangalore as well as to foreign business services. As
noted Indian business services have contributed to the competitiveness and productivity of firms globally.
Better access to internet could allow them to do the same for local firms throughout India.
127. Nevertheless, face to face interaction with clients is also needed when professionals help clients
solve problems related to entering new markets, innovating, restructuring or adjusting to new regulations.
In a business environment where clients have multi-country operations and knowledge intensive business
services providers form international teams, openness to temporary movement of people is essential. For
India liberalisation of mode four at home is equally important as pursuing openness to mode four in the
WTO and in trade agreements. Only then will local manufacturers be able to enjoy full access to business
services that support their innovation and internationalisation efforts.
128. To summarise, introducing a business-model neutral and more open trade and investment policy
in the distribution sector could stimulate demand for and production of manufactured consumer goods;
reforms in the transport sectors, particularly railways, ports and maritime transport would very
significantly reduce the cost that manufacturers face in sourcing inputs and reaching customers both inside
India and beyond. Removing remaining restrictions on foreign entry and pro-competitive regulation in
fixed line broadband telecommunications would enhance incentives to roll out infrastructure which would
enable manufacturers to better integrate into global value chains and to expand exports particularly in
higher-end market segments. Lifting restrictions on movement of professionals would help Indian
engineers and other professionals teaming up with foreign partners and offer services support for both local
and foreign manufacturers. Finally, lifting some of the restrictions in commercial banking, particularly
measures such as directed credit schemes could improve access to credit for innovative firms both in
manufacturing and services.
TAD/TC/WP(2016)18/FINAL
48
REFERENCES
Aleksynska, M. and G. Peri (2014), “Isolating the network effects of immigrants on trade”, The World
Economy, 37, 434-455.
Amiti, M. and S-J. Wei (2009), “Services offshoring and productivity: Evidence from the US”, The World
Economy, 32, 203-220.
Anderson, James E. and Eric van Wincoop (2003), “Gravity with Gravitas: A Solution to the Border
Puzzle”, American Economic Review, 93(1): 170-192.
Anderson, J. E., C.A. Milot and Y.V. Yotov (2014), “How much does geography deflect services trade?”,
International Economic Review 55(3): 791-818.
Arbache, J., D. Rouzet and F. Spinelli (2016), “Services and performance of the Brazilian economy:
analysis and policy options”, Paper presented to a workshop organized by the Brazilian Ministry of
Foreign Affairs, February 2016.
Arnold, J.M. and B.S. Javorcik (2009), ‘‘Gifted Kids or Pushy Parents? Foreign Direct Investment and
Plant Productivity in Indonesia”, Journal of International Economics, 79, 42–53.
Arnold, J.M., B.S. Javorcik, M. Lipscomb and A. Mattoo (2014), “Services reform and manufacturing
performance: Evidence from India”, The Economic Journal, 126, 1-37.
(0.28) (0.37) (0.39) (0.61) (0.31) (0.41) (0.18) intra EU -0.21 -2.11 -0.77 -4.31* -1.33 -0.21 -0.01
(1.16) (1.46) (0.95) (2.31) (1.37) (0.90) (0.47) b * language -0.51*** -0.34* -0.81*** -0.76** -0.22 -0.18 -0.52***
(0.13) (0.18) (0.12) (0.31) (0.27) (0.23) (0.12) b * English 0.36*** -0.23 0.66*** 0.23 1.42*** 0.51*** 0.73***
(0.14) (0.18) (0.10) (0.20) (0.16) (0.14) (0.08) b * internet
3.72***
3.06*** -0.72
(0.78)
(0.93) (0.97)
Exp * Year FE Yes Yes Yes Yes Yes Yes Yes Imp * Year FE Yes Yes Yes Yes Yes Yes Yes N 4597 5039 4439 3887 4598 4191 4143
Note: All results from sector-level PPML regression. Dependent variable is the volume of exports. Independent variable preceded by b * refer to interactions with the border dummy. Standard errors clustered at the importer level. ***, ** and * represent statistical significance at a 1%, 5% and 10% level respectively.
Source: Benz (2016) and own regressions
TAD/TC/WP(2016)18/FINAL
53
Table A2. Determinants of entry and export values, selected sectors and importers
Note: Pooled zero inflated Poisson regressions for the exports of seven HS 2-digit sectors (28, 29, 30, 61, 62 85, 87) run at 6-digit level for all countries in the world to UAE, China, Germany, India, Japan, Korea, Malaysia, South Africa, the United Kingdom and the United States. Robust standard errors clustered on 6-digit products are reported in parenthesis. ***, **, and * signify statistical significance at 1%, 5% and 10% levels respectively. The row labelled Service reports the coefficients on the services variable indicated in the column heading. The columns labelled Exports report the results of the full models while the columns labelled Inflate report the probability of zero trade using logit. The Vuong test strongly support using zero inflated Poisson rather than simple Poisson.
TAD/TC/WP(2016)18/FINAL
54
Table A3. Services and manufacturing exports, intensive and extensive margin by export market
Note: The table reports the coefficients on the services variable of interest for zero inflated Poisson regressions run on pooled data for bilateral manufacturing exports at 6-diigt HS level for HS sectors 28,29,30, 61, 62, 85 and 87 for 2014. ***, **, and * represent statistical significance at 1%, 5% and 10% levels respectively.
Table A4. Services and manufacturing exports, intensive and extensive margin, by industry
Inorganic chemicals Organic chemicals Pharmaceuticals Apparel Electrical machinery Motor vehicles
Note: The table reports the coefficients on the services variable of interest for zero inflated Poisson regressions run on pooled data for bilateral manufacturing exports at 6-diigt HS level for the exports to UAE, China, Germany, the United Kingdom, India, Japan, Korea, Malaysia, United States and South Africa for 2014. ***, **, and * represent statistical significance at 1%, 5% and 10% levels respectively.
TAD/TC/WP(2016)18/FINAL
55
Table A5 reports the results of a standard regression relating unit prices to income and distance in a
cross-section for 2014. Ideally one should use panel data to capture the time variation in the data and also
to be able to control for unobserved time-varying country-specific factors. Due to time constraints this was
not possible for this draft. There are about 4 million observations per year.
Table A5. Determinants of unit export prices, 2014
Ln export unit prices (1) (2)
Ln exporter GDP per capita 0.422*** 0.422***
(0.005) (0.004)
Ln importer GDP per capita 0.084*** 0.105***
(0.002) (0.003)
Ln distance 0.144*** 0.133***
(0.003) (0.003)
Ln export value -0.076***
(0.003)
R2 0.435 0.444
N 3840515 3840515
2-digit sector fixed effects Yes Yes
Note: the regressions are run on 6-digit HS 2002 product categories for all 2-digit sectors from 10 to 97 for all countries using OLS with robust standard errors clustered on 6-digit product categories. ***, ** and * represent statistical significance at a 1%, 5% and 10% level respectively.
The first regression confirms the results reported in the literature. The second regression adds export
value, which is negatively associated with the unit price. Ideally, one should control for export volume
rather than value, since the unit price is a component of export value. With that caveat in mind, the result
suggests that there may be economies of scale in exporting and there could also be a trade-off between
Note: The table reports the coefficients for the services indicators when the export price regression is run by country (with industry fixed effects) and by industry (with export market fixed effects). The regressions are OLS with robust standard errors clustered on HS6-digit products. ***, ** and * signify statistical significance at a 1%, 5% and 10% level respectively. In the interest of space we drop the United Kingdom from Panel A. The results are very similar to Germany.