44
Phase 1 Results April 2013

Phase 1 ResultsApril 2013

UK H2Mobility Phase 1 Results
This document reflects the results of a fact based study undertaken by the members of the UK H2Mobility project in 2012 with the assistance of professional consultants and advisors. The information contained in this document represents a collective view of the members listed and not that of individual members. It is intended only as a summary of the findings of one phase of the project. The members make no warranty as to its accuracy, completeness or suitability for any purpose. The members accept no liability whatsoever in respect of reliance placed by the user on information and materials contained in this document.
This report and all information and data contained within it are owned by the members of the UK H2Mobility coalition. Other organisations and entities are welcome to use the data and information subject to a formal reference and acknowledgement.

During 2012, the UK H2Mobility project undertook a robust fact based analysis of the potential for hydrogen fuel cell electric vehicles (FCEVs) in the UK.
The work quantified the opportunities offered by FCEVs, studied the barriers to their market introduction and integrated the insights and results to understand the market dynamics. It predicted the required number of hydrogen refuelling stations to provide satisfactory national coverage and the required hydrogen
production mix to achieve substantial CO2 savings relative to diesel vehicles. This analysis has enabled the creation of a feasible and realistic roadmap for the introduction and roll-out of FCEVs in the UK, starting from 2015, together with an evaluation of the benefits of its implementation. This report is a summary of the findings.
McKinsey & Company and Element Energy Limited provided analytical support to the members of UK H2Mobility during the study.
The analysis was undertaken by the following organisations:
UK H2Mobility Phase 1 Results

The UK H2Mobility members would like to thank the following organisations who kindly participated in interviews and provided input into the project’s findings:
The UK H2Mobility project benefited from having the following companies involved in the initial work of Phase 1: Air Products, Tata Motors and Vauxhall.
The UK H2Mobility members would also like to thank the H2 Mobility Initiative in Germany and the participants in the study “A portfolio of powertrains for Europe: a fact-based analysis” for their kind contributions.
This report was prepared in conjunction with Jonathan Lewis Consulting and Crest Communications (PR) Ltd.
Arval
BVRLA
CAP
Commercial Group
DHL
Lex Autolease
National Grid
Sainsbury’s
Shell
UPS
UK H2Mobility Phase 1 Results
Contents
UK H2Mobility Phase 1 Results
Executive Summary i - iv
Background 1-6
FCEVs and Hydrogen 1
Benefits to the UK of FCEVs 3
The Need to Act Now 4
The UK H2Mobility Project 5
Consumer Demand for FCEVs 7-14
Understanding Consumer Preferences 7
The Consumer Proposition 9
Consumer Reactions 11
FCEV Market Growth 13
Hydrogen Production and Retail 15-22
Supplying the Consumer with Hydrogen 15
The Refuelling Network Develops 17
How the Hydrogen is Produced 19
Benefits 23-26
The National CO2 Emissions Benefit 23
Local Air Quality Benefits 24
Industrial and Employment Benefits 25
Benefits for the UK Energy System 26
Towards Market Introduction 27-32
Building the Refuelling Network 27
Making it Happen 29
Next Steps 30
Support for the UK H2Mobility Process 31
Annexes 33-34
Data and Information Sources 33
Glossary 34
Executive Summary
Successful commercialisation will require the establishment of a hydrogen refuelling network to support vehicle sales. This necessitates a co-ordinated approach involving many parties from different sectors acting together.
FCEVs will be introduced in suitable markets from 20151. The UK H2Mobility members recognise the importance of prompt action to ensure that the potential economic and carbon benefits of hydrogen transport are realised within the UK.
To build a fact base for the evaluation, the members of the project used their own data in combination with relevant information from previous studies and from published sources. Data on the performance, cost and availability of different classes of FCEV were aggregated and the costs of hydrogen production, distribution, storage, dispensing and retail calculated. In all cases, data were collated to cover the period 2015-2030.
Having assembled the most robust and detailed fact base possible, the project was able to develop a roadmap for the roll-out of FCEVs and hydrogen refuelling stations in the UK.
The UK H2Mobility members:
ll Evaluated the potential demand for FCEVs over time.
ll Determined the hydrogen refuelling network necessary to support the consumer demand and planned its development.
ll Identified a mix of production methods able to provide cost-competitive hydrogen to the consumer while delivering significant CO2 emissions reductions.
ll Quantified the benefits of establishing FCEVs in the UK market.
Introduction
FUEL CELL ELECTRIC VEHICLES (FCEVs) provide the potential to decarbonise road transport, create new economic opportunities, diversify national energy supply, and reduce significantly the local environmental impacts of road transport. The UK H2Mobility project was established to evaluate the benefits of FCEVs to the UK and to develop a roadmap for the introduction of vehicles and hydrogen refuelling infrastructure.
1 Daimler, Ford, GM, Honda, Hyundai-Kia, Renault-Nissan and Toyota all signed a letter of understanding in September 2009 saying that they “strongly anticipate that from 2015 onwards” fuel cell vehicles could be commercialised.
In 2013, Toyota and Hyundai have reiterated their commitment to a 2015 launch; Daimler and Nissan announced that they, in partnership with each other and with Ford, would go into series production of FCEVs from 2017. In September 2012, Honda reconfirmed its 2015 launch date for FCEVs.
UK H2Mobility Phase 1 Results – Executive Summary
i

Consumer Demand
Gaining an improved understanding of the potential buyers of FCEVs was a central focus of the project.
A series of consumer focus groups and interviews provided new insights into how consumers view hydrogen-powered road transport. The focus groups explored consumers’ attitudes to FCEVs and related topics, including costs, performance (technical and environmental), safety and refuelling habits. The consumers were receptive to FCEVs, especially in terms of vehicle performance and refuelling time. However, without intervention or dedicated mechanisms, in the early years after market introduction, FCEVs will be significantly more expensive to buy than conventional vehicles using combustion engines, and the refuelling network will be limited. These two factors were seen by the consumers surveyed as major barriers to buying an FCEV.
In addition, a quantitative survey was completed by 2,000 consumers who have recently bought, or are looking to buy, a new or nearly-new vehicle. This was used to assess demand for the vehicles in different circumstances. Consumers were given information on the costs and performance (technical and environmental) of the vehicles. The information was based on a comparison between an FCEV and an equivalent vehicle with a diesel engine using the total cost of ownership over the first four years of the vehicle’s life. The costs considered included purchase price (including VAT) less the residual value, financing, fuel, maintenance and servicing, insurance and vehicle tax. Although the project assumed a continuation of preferential vehicle tax rates for zero CO2 vehicles, no other financial incentives were included.
The project was able to segment the market into groups of consumers with similar attitudes to the particular characteristics that they value in a vehicle, to new technology, to the environment and to costs. For each group, the dependency between total costs, availability of hydrogen refuelling stations (HRS) and the decision to buy an FCEV was quantified. Some 10% of new vehicle buyers showed themselves to be potential early adopters of FCEVs, being receptive to new technology and environmentally motivated.
The survey provided new understanding on how far different types of consumer would be prepared to drive to an HRS. It also assessed the difference between the price a consumer would be willing to pay for an FCEV and for an equivalent diesel vehicle. This price difference was found to depend largely on the availability of HRS, but varied greatly between different consumer groups.
From the quantification of the dependencies between costs, vehicle performance and HRS network development, the project developed a model to predict the rate of vehicle uptake in different circumstances. This model indicates that, once HRS are available, the initial uptake will be limited by the cost of buying the vehicles. Nevertheless, the analysis identified sufficient early
adopters to generate sales of approximately 10,000 vehicles p.a. by 2020. As the vehicle costs become more competitive and the refuelling network develops, FCEV uptake increases rapidly. In the UK H2Mobility roadmap, by 2030 there will be 1.6 million FCEVs in the UK with annual sales of more than 300,000.
The Hydrogen Refuelling Network
It is important for the HRS network roll-out to strike a balance between maximum consumer convenience (and therefore FCEV uptake) and investment required.
Consumers require both local availability and national coverage, and the quantitative survey showed them to be significantly more receptive to FCEVs if they have access to more than one HRS locally. Detailed spatial modelling identified those locations which deliver the greatest consumer benefit. It showed that a roll-out targeting particular areas and the national trunk routes is the most efficient early strategy.
The analysis and network modelling undertaken within the project indicated that 65 stations across the UK could provide sufficient initial coverage to start the market, covering major population centres (with more than one HRS in each) and the connecting roads. Thereafter, the network develops and extends in line with the demand for hydrogen by vehicle owners/users. The roadmap shows full national coverage with 1,150 stations by 2030, providing close-to-home refuelling for the whole of the UK.
In the market conditions assumed in the UK H2Mobility roadmap, the HRS network as a whole will not be profitable initially but will be able to cover its operating costs by the early 2020s and to reach break-even in the late 2020s. In the roadmap, the total financing need up to the break-even point is £418 million, of which £62 million is required before 2020.
The low utilisation of the HRS network before 2020 will hurt profitability and analysis of the economics of individual stations shows that the early stations will not be able to deliver the same returns as those built later. There exists, therefore, a challenge in securing the initial investment and some support for seeding the market may be required. The next phase of the UK H2Mobility project will develop potential business cases for the initial network of stations, including identifying how utilisation rates might be improved and how first mover commercial advantage could be secured.
UK H2Mobility Phase 1 Results – Executive Summary
ii

Hydrogen Production and Distribution
The consumer research carried out in the project and the UK’s decarbonisation objectives each defined a need for low and reducing CO2 emissions for each kilometre driven by an FCEV.
While FCEVs themselves emit no CO2, some processes for hydrogen production do and any CO2 emitted during fuel production must be considered. Therefore, a mix of hydrogen production technologies was identified for the roadmap that is at least competitive with other advanced low-emission vehicle technologies in the early years and is on a path to full decarbonisation by 2050.
Using the project fact base, the analysis shows that a mix of hydrogen production methods can deliver hydrogen to the driver at a cost competitive with diesel, yet with 60% lower CO2 emissions in 2020 and 75% lower in 2030.
The hydrogen production mix in the roadmap for 2030 is 51% water electrolysis (WE), 47% steam methane reforming (SMR) and 2% existing capacities2. WE, using renewable electricity3, includes both on-site production at the HRS and centralised production with distribution to the HRS. In 2030, the roadmap shows that the national demand for hydrogen for FCEVs will be 254,000 tonnes p.a.
Water electrolysis capacity offers significant benefits to the electricity sector in assisting the integration of renewable generating capacity and in providing grid-balancing services. These benefits will increase as the proportion of renewable energy in the generating mix increases. The project quantified these benefits and determined that this would have the effect of reducing the cost of hydrogen produced by electrolysis by 20%.
The Benefits of FCEVs
The commercialisation of FCEVs and hydrogen has potential benefits for the UK in terms of reduction of carbon emissions, air quality improvements and energy security enhancements, in addition to wider economic benefits.
The UK H2Mobility roadmap shows that the total CO2 emissions for an FCEV can be 75% less than the equivalent diesel vehicle in 2030, and on a path to zero-carbon by 2050. The total annual CO2 abatement is projected to be 3 million tonnes in 2030. The DECC 2050 Pathway Analysis4 has scenarios for FCEVs as a proportion of the total UK fleet of between 20% (7 million vehicles) and 50% (17 million vehicles). The UK H2Mobility roadmap puts the UK on the right path to meet these scenarios.
Using DEFRA’s Air Quality Damage Cost Guidance, it is possible to quantify the benefit of replacing diesel vehicles, which emit oxides of nitrogen (NOx) and particulate matter (PM), with FCEVs emitting only water vapour. The cost saving that accrues from reduced damage to human health and the environment is £100-£200 million annually by 2050 (depending on the rate of growth of FCEVs in the total fleet after 2030).
The hydrogen production mix in the UK H2Mobility roadmap shows a further benefit of FCEVs: a greater proportion of UK’s road fuel (measured both by financial value and energy content) would be made in the UK. This is because more of the process inputs are locally produced and because the economics of hydrogen production and distribution favour local production. As well as obvious benefits for energy security, switching from imported fossil fuels to hydrogen made in the UK would deliver a £1.3 billion annual benefit to the UK economy by 2030.
2 The existing capacities are a mix of SMR and readily available by-product hydrogen from other processes.
3 The use of renewable electricity is included in the costs of water electrolysis through the use of certified green tariffs for the electricity price.
4 The DECC 2050 Pathways work presents a framework through which to consider some of the choices and trade-offs that will have to made over the next 40 years to reduce carbon emissions. It is system-wide, covering all parts of the economy and all greenhouse gases emissions released in the UK.
iii
UK H2Mobility Phase 1 Results – Executive Summary
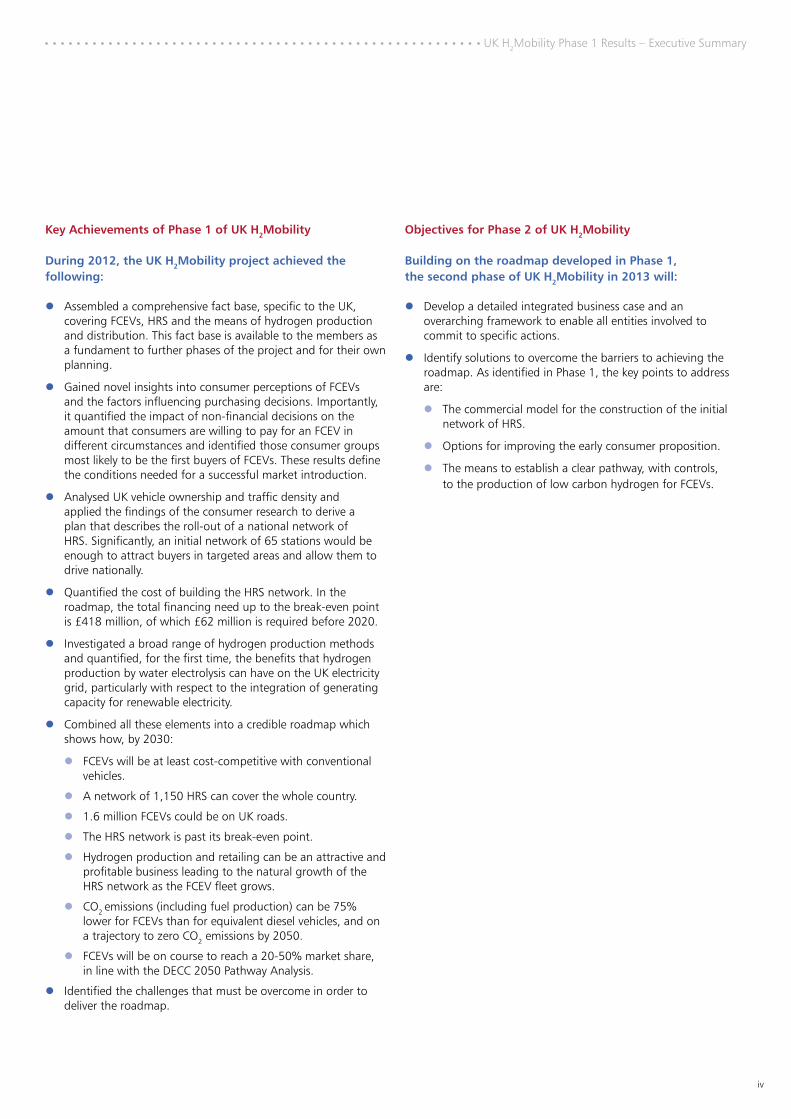
Key Achievements of Phase 1 of UK H2Mobility
During 2012, the UK H2Mobility project achieved the following:
ll Assembled a comprehensive fact base, specific to the UK, covering FCEVs, HRS and the means of hydrogen production and distribution. This fact base is available to the members as a fundament to further phases of the project and for their own planning.
ll Gained novel insights into consumer perceptions of FCEVs and the factors influencing purchasing decisions. Importantly, it quantified the impact of non-financial decisions on the amount that consumers are willing to pay for an FCEV in different circumstances and identified those consumer groups most likely to be the first buyers of FCEVs. These results define the conditions needed for a successful market introduction.
ll Analysed UK vehicle ownership and traffic density and applied the findings of the consumer research to derive a plan that describes the roll-out of a national network of HRS. Significantly, an initial network of 65 stations would be enough to attract buyers in targeted areas and allow them to drive nationally.
ll Quantified the cost of building the HRS network. In the roadmap, the total financing need up to the break-even point is £418 million, of which £62 million is required before 2020.
ll Investigated a broad range of hydrogen production methods and quantified, for the first time, the benefits that hydrogen production by water electrolysis can have on the UK electricity grid, particularly with respect to the integration of generating capacity for renewable electricity.
ll Combined all these elements into a credible roadmap which shows how, by 2030:
ll FCEVs will be at least cost-competitive with conventional vehicles.
ll A network of 1,150 HRS can cover the whole country.
ll 1.6 million FCEVs could be on UK roads.
ll The HRS network is past its break-even point.
ll Hydrogen production and retailing can be an attractive and profitable business leading to the natural growth of the HRS network as the FCEV fleet grows.
ll CO2 emissions (including fuel production) can be 75% lower for FCEVs than for equivalent diesel vehicles, and on a trajectory to zero CO2 emissions by 2050.
ll FCEVs will be on course to reach a 20-50% market share, in line with the DECC 2050 Pathway Analysis.
ll Identified the challenges that must be overcome in order to deliver the roadmap.
Objectives for Phase 2 of UK H2Mobility
Building on the roadmap developed in Phase 1, the second phase of UK H2Mobility in 2013 will:
ll Develop a detailed integrated business case and an overarching framework to enable all entities involved to commit to specific actions.
ll Identify solutions to overcome the barriers to achieving the roadmap. As identified in Phase 1, the key points to address are:
ll The commercial model for the construction of the initial network of HRS.
ll Options for improving the early consumer proposition.
ll The means to establish a clear pathway, with controls, to the production of low carbon hydrogen for FCEVs.
iv
UK H2Mobility Phase 1 Results – Executive Summary

FCEVs and Hydrogen
Vehicle types
C/D Family saloon/estate
E Executive
J SUV
Commercial introduction
Date 2015
Powertrain
Power source Hydrogen Fuel Cell
Transmission Electric Motor
Peak power 100kW (135bhp)
Continuous power 75kW (100bhp)
Torque 300Nm (220 lbft)
Fuel
Pressurised hydrogen gas
Tank pressure 70MPa (700bar)
Capacity 5kg
Consumption (NEDC) 1kg/100km (62miles/kg)*
Range (NEDC) 500km (320miles)
Performance
Top Speed 160km/h (100mph)
Acceleration 0-100km/h (0-62mph) 12s
Emissions at tailpipe
Carbon Dioxide Zero (0gCO2/km)
NOx (Oxides of Nitrogen) Zero
Sulphur Dioxide Zero
Particulates Zero Table 1 Typical Specifications for FCEVs expected to be available from 2015.
The UK H2Mobility project considered the FCEVs and hydrogen refuelling equipment that are currently in demonstration around the world and which will be available for commercial launch from 2015. It also considered how these and other technologies will develop to 2030.
The typical characteristics of vehicles and systems expected to be introduced from 2015 are shown in the tables in this section.
These tables represent the technology as it stands now. In developing the roadmap to 2030, the project members assembled data on the predicted improvements in performance and efficiency for these technologies and for the systems against which they are compared. The roadmap therefore takes account of future technology progress.
FCEVs
Typical technical specifications for FCEVs expected to be available from 2015 are shown in Table 1.
UK H2Mobility Phase 1 Results – Background
1
*1kg of hydrogen has approximately the same energy content as 3.3 litres of diesel.

Vehicle filling
Hydrogen purity To standard ISO 14687-2
Maximum filled pressure 70MPa (700bar)
Filling time 3 minutes (for a 5kg fill)
Daily capacity 80-1,000kg (i.e. 16-200 full fills)
On-site fuel storage
Pressure Cascade storage system with highest pressure tank at 85MPa (850bar)
Capacity** 3 days supply
Hydrogen Refuelling Station
Typical technical specifications for a hydrogen refuelling station complying with standard SAE-J2601 “Fuelling Protocols for Light Duty Gaseous Hydrogen Surface Vehicles” are shown in Table 2 below.
Table 2 Typical Specifications for HRS available from 2015.
Station size Daily H2 capacity Capacity (FCEV fills/day)
Small 80kg 16
Medium 400kg 80
Large 1,000kg 200 Table 3 Standard HRS sizes in the UK H2Mobility roadmap.
The UK H2Mobility roadmap includes three standard HRS sizes, as shown in Table 3.
2
UK H2Mobility Phase 1 Results – Background
**On-site storage for HRS receiving hydrogen deliveries; storage for those with hydrogen production on-site will be a function of the electrolyser operating regime.

The Benefits to the UK of FCEVs
The UK H2Mobility project was created to evaluate the potential of, and develop a roll-out strategy for, FCEVs in the UK. Hydrogen transport has the potential to deliver significant benefits in four areas.
Decarbonising Road Transport
To meet long term emission reduction targets (80% reduction in greenhouse gas emissions by 2050), the UK needs to decarbonise road transport over the coming decades. Hydrogen and FCEVs offer a practical mass-market solution to help meet this objective.
Creating New Economic Opportunities for the UK
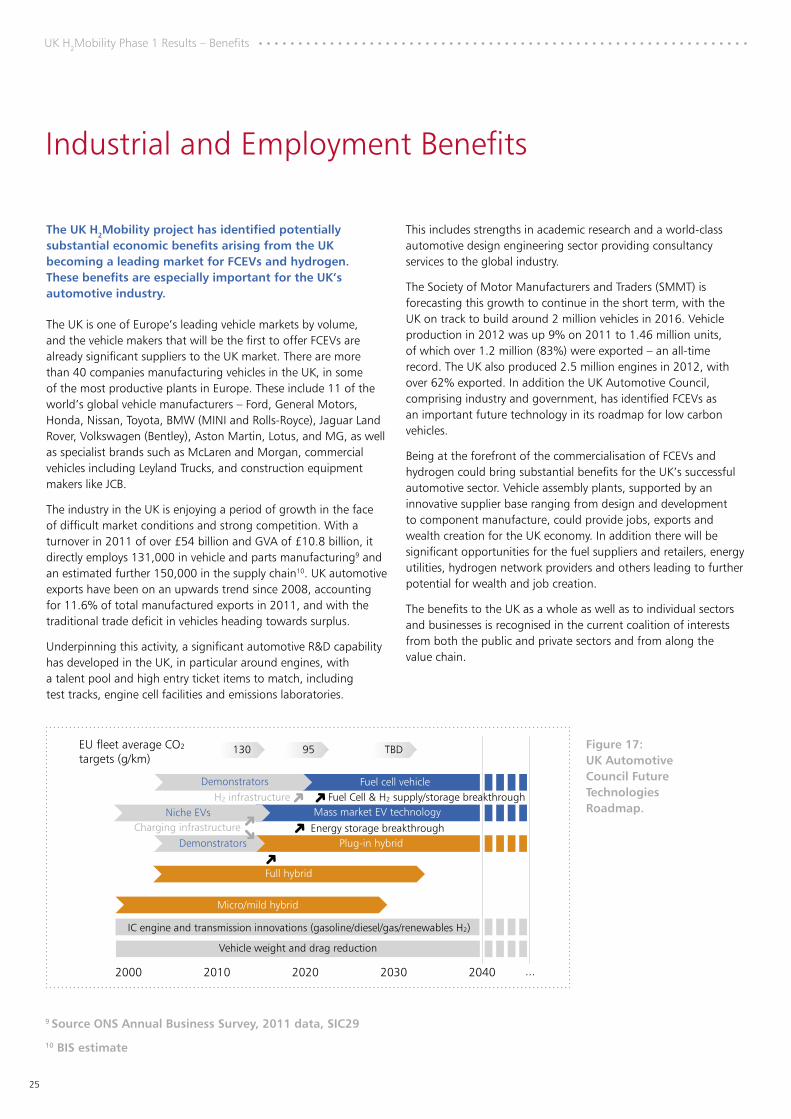
The UK Automotive Council Roadmap5 for passenger vehicles identifies hydrogen as a technology option that could lead to opportunities in employment creation across the value chain (from vehicle manufacture, development of new components, fuel production, distribution and supply, etc) and thereby bring significant economic benefit to the UK.
Diversifying Energy Supply
A wide range of primary energy sources can be used in the production of hydrogen. This is a major advantage when considering diversification of supply in the UK energy system. Hydrogen could also help to reduce the UK’s reliance on imported fossil fuels for transport and thereby increase energy security in the UK.
Reducing Local Environmental Impacts of Road Transport
FCEVs offer a means for improving air quality and reducing noise pollution from traffic compared with conventional vehicles powered by internal combustion engines.
5 http://www.automotivecouncil.co.uk/technology-group/strategies/
3
UK H2Mobility Phase 1 Results – Background

The next few years are critical to the commercialisation of FCEVs and hydrogen refuelling in the UK. Global automotive manufacturers are preparing to introduce FCEVs into selected markets from 2015. If introduced to the UK, FCEVs could augment the decarbonisation of transport that is already underway to bring substantial economic benefits and make the UK a world leading market. An adequate refuelling infrastructure (including production, distribution and retail) is required for FCEVs to be marketed as a credible and attractive alternative to conventional vehicles. Action is required now to position the UK as an early launch market for FCEVs to ensure that the UK maximises the benefits that hydrogen transport offers.
FCEVs Available from 2015
A group of the world’s leading vehicle manufacturers, including those participating in the UK H2Mobility project, has publicly committed to starting the series production of FCEVs from 2015. This follows successful demonstrations of FCEVs in daily use since 2008, principally in Germany, Scandinavia, Japan and California. In this time, they have travelled millions of miles and refuelled thousands of times. Most recently:
ll 2011 – Daimler drove three of its Mercedes Benz B-Class F-Cell cars around the world without any major mechanical failure.
ll Summer 2012 – A fleet of five fuel cell-powered London taxis was introduced by Intelligent Energy and London Taxi Company to carry passengers during the 2012 London Olympics.
ll Autumn 2012 – Seven FCEVs from Daimler, Honda, Hyundai and Toyota crossed the UK as part of the European Hydrogen Road Tour.
The UK, as a significant and innovative vehicle market, has the potential to be one of the leading countries in their deployment plans.
The Decarbonisation Imperative
The UK’s ambitious decarbonisation targets for road transport by 2050 call for substantial efforts to begin over the coming decade. The DECC report The Carbon Plan6 acknowledges the decarbonisation challenge for road transport and notes that Ultra Low Emission Vehicles (ULEVs) are part of the solution. “ULEVs could be powered by batteries, hydrogen fuel cells, sustainable biofuels or a mix of these and other technologies”.
It is clear that these powertrain types must be a significant part of the UK vehicle fleet mix by 2050 if carbon targets for road transport are to be achieved. The DECC report acknowledges the challenge of ensuring that by 2040 all new vehicles have zero carbon emissions. It recognises that the introduction of FCEVs and other ULEVs will be required in the preceding decades and the current decade is identified as a crucial period in preparing for progress in the 2020s.
The UK’s Competitive Position
FCEVs and hydrogen represent a substantial economic opportunity for the UK. Jobs, exports and wealth creation among the UK’s successful automotive sector will depend on the ability of the UK to compete in the area of the future ULEV technologies noted above.
The UK Government has stated its desire for the UK to be at the global forefront of the design, development, manufacture and use of ULEVs. As a substantial automotive market, as a centre of vehicle design and manufacture and as a leader in renewable energy systems, the UK is well positioned to take a role in the commercialisation of FCEV and hydrogen refuelling technologies. Taking a leading role in commercialisation of ULEVs will translate into an unparalleled, once in a century opportunity for the UK’s automotive sector to achieve a leading position in the development, design and production of these innovative technologies.
4
UK H2Mobility Phase 1 Results – Background
6 The Carbon Plan: Delivering Our Carbon Future DECC 2011
The Need to Act Now
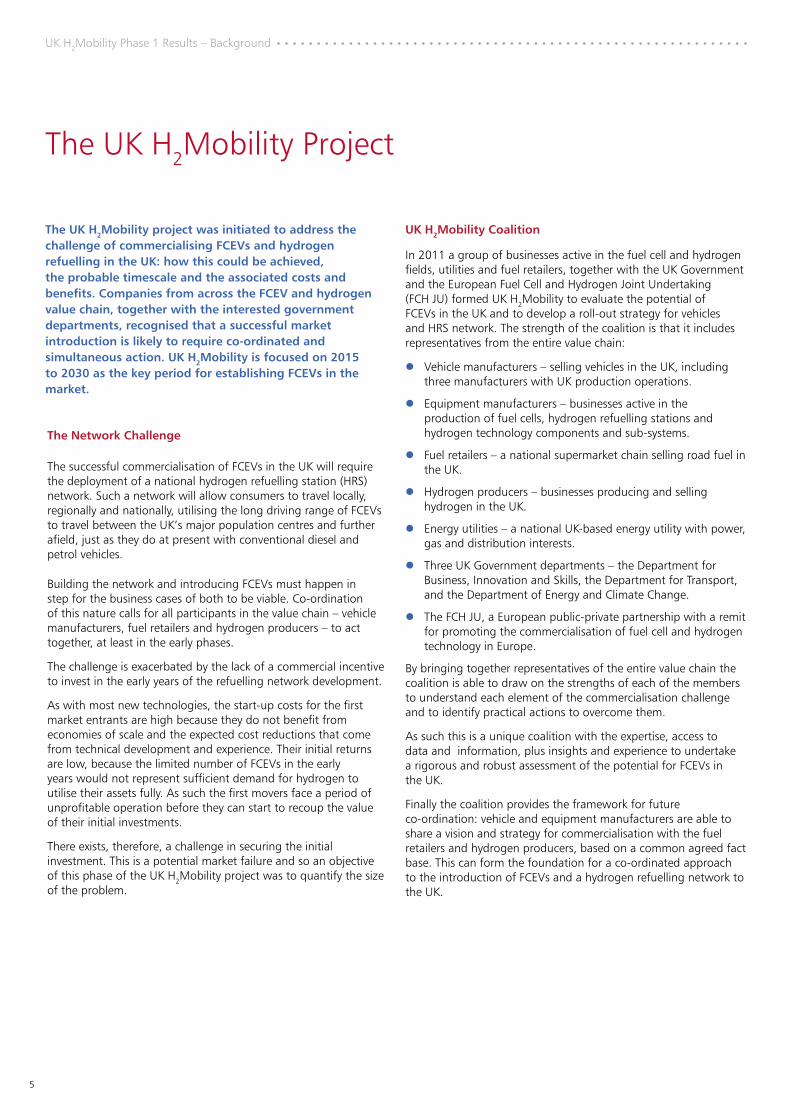
The UK H2Mobility Project
UK H2Mobility Coalition
In 2011 a group of businesses active in the fuel cell and hydrogen fields, utilities and fuel retailers, together with the UK Government and the European Fuel Cell and Hydrogen Joint Undertaking (FCH JU) formed UK H2Mobility to evaluate the potential of FCEVs in the UK and to develop a roll-out strategy for vehicles and HRS network. The strength of the coalition is that it includes representatives from the entire value chain:
ll Vehicle manufacturers – selling vehicles in the UK, including three manufacturers with UK production operations.
ll Equipment manufacturers – businesses active in the production of fuel cells, hydrogen refuelling stations and hydrogen technology components and sub-systems.
ll Fuel retailers – a national supermarket chain selling road fuel in the UK.
ll Hydrogen producers – businesses producing and selling hydrogen in the UK.
ll Energy utilities – a national UK-based energy utility with power, gas and distribution interests.
ll Three UK Government departments – the Department for Business, Innovation and Skills, the Department for Transport, and the Department of Energy and Climate Change.
ll The FCH JU, a European public-private partnership with a remit for promoting the commercialisation of fuel cell and hydrogen technology in Europe.
By bringing together representatives of the entire value chain the coalition is able to draw on the strengths of each of the members to understand each element of the commercialisation challenge and to identify practical actions to overcome them.
As such this is a unique coalition with the expertise, access to data and information, plus insights and experience to undertake a rigorous and robust assessment of the potential for FCEVs in the UK.
Finally the coalition provides the framework for future co-ordination: vehicle and equipment manufacturers are able to share a vision and strategy for commercialisation with the fuel retailers and hydrogen producers, based on a common agreed fact base. This can form the foundation for a co-ordinated approach to the introduction of FCEVs and a hydrogen refuelling network to the UK.
5
The UK H2Mobility project was initiated to address the challenge of commercialising FCEVs and hydrogen refuelling in the UK: how this could be achieved, the probable timescale and the associated costs and benefits. Companies from across the FCEV and hydrogen value chain, together with the interested government departments, recognised that a successful market introduction is likely to require co-ordinated and simultaneous action. UK H2Mobility is focused on 2015 to 2030 as the key period for establishing FCEVs in the market.
UK H2Mobility Phase 1 Results – Background
The Network Challenge
The successful commercialisation of FCEVs in the UK will require the deployment of a national hydrogen refuelling station (HRS) network. Such a network will allow consumers to travel locally, regionally and nationally, utilising the long driving range of FCEVs to travel between the UK’s major population centres and further afield, just as they do at present with conventional diesel and petrol vehicles.
Building the network and introducing FCEVs must happen in step for the business cases of both to be viable. Co-ordination of this nature calls for all participants in the value chain – vehicle manufacturers, fuel retailers and hydrogen producers – to act together, at least in the early phases.
The challenge is exacerbated by the lack of a commercial incentive to invest in the early years of the refuelling network development.
As with most new technologies, the start-up costs for the first market entrants are high because they do not benefit from economies of scale and the expected cost reductions that come from technical development and experience. Their initial returns are low, because the limited number of FCEVs in the early years would not represent sufficient demand for hydrogen to utilise their assets fully. As such the first movers face a period of unprofitable operation before they can start to recoup the value of their initial investments.
There exists, therefore, a challenge in securing the initial investment. This is a potential market failure and so an objective of this phase of the UK H2Mobility project was to quantify the size of the problem.

6
UK H2Mobility Phase 1 Results – Background
Establishing a Fact Base
To build a fact base for the evaluation, the members of the project used their own data in combination with data from previous studies and from published sources. Data on the performance, cost and availability of different classes of FCEV were aggregated and the costs of hydrogen production, distribution, storage, dispensing and retail calculated. In all cases, data were assembled for the period 2015-2030.

Understanding Consumer Preferences
The UK H2Mobility project assessed consumer reactions to FCEVs and hydrogen refuelling in order to understand the circumstances in which consumers would choose an FCEV over an alternative. The most extensive study of its type to date, this work represents a major step forward in understanding consumers’ attitudes to this new vehicle technology.
The approach used a “choice experiment” with a sample of 2,000 consumers, together with a number of focus groups seeking the views of high mileage drivers, green/technology enthusiasts, early adopters and mass market users. The approach and sample size gives significant confidence in the results.
The project also benefited from the support of a group of vehicle fleet operators. Discussions were conducted with this group to assess their specific needs.
The benchmark for all comparisons was an equivalent vehicle with a diesel engine and a mechanical (i.e. not an electric-hybrid) transmission. The diesel vehicle was chosen as the best comparator because the first FCEVs that manufacturers are planning to offer to the market will be in the larger vehicle segments where diesel rather than petrol engines predominate. These vehicles are more likely to be bought by those drivers using their vehicles for long journeys as well as for local trips. Such drivers are willing to pay a higher price for diesel-powered vehicles, but also expect lower running costs and lower CO2 emissions than petrol versions.
Individuals
Before designing the large-scale consumer survey, the project commissioned four focus groups to understand the qualitative issues of FCEV purchasing, ownership and operation. The understanding gained from this work included views on initial purchase cost, performance (e.g. range, acceleration), operating costs, requirements for hydrogen refuelling infrastructure and perceptions on hydrogen production sources in relation to carbon dioxide emissions. The key insights from these focus groups were:
ll Consumers have a positive perception of FCEVs. In terms of performance, driving behaviour and refuelling, FCEVs are perceived to be acceptable alternatives to diesel vehicles.
ll There is a general expectation of lower running costs. All consumer groups expected that FCEVs, as with other ultra-low emission vehicles, will be more expensive to purchase, but will be cheaper to run when compared with existing vehicle technologies.
ll Limited early availability of hydrogen refuelling stations is a source of concern for potential FCEV buyers. Plug-in hybrid electric vehicles (PHEVs), which offer some of the same environmental and performance advantages as FCEVs, are preferred by some consumers in the early stages of FCEV deployment (in the first 5-8 years) given their ability to refuel using the existing petrol/diesel/electricity networks.
ll A less-developed refuelling network is perceived as more of a barrier for some consumers than for others. Consumers expect their refuelling behaviour with FCEVs to be similar to that with diesel vehicles: i.e. convenient access to refuelling stations and a refuelling time of five minutes. However, the distance consumers are prepared to travel to refuel varies between different groups.
ll Local refuelling availability is an important influence on many consumers’ perceptions: consumers have an adverse attitude to FCEVs if only one station is available close to home; attitudes change when two or more are available. However, as with the previous point, there is a broad range of opinions on the importance of this local choice.
ll A national refuelling network is also necessary. Consumers willing to buy an FCEV want to be able to use it to make long distance journeys as well as local trips.
ll There should be a clear path to zero-carbon hydrogen. Environmentally-motivated consumers value the zero tail-pipe emissions from FCEVs, but don’t expect the carbon footprint of the hydrogen to be zero in the early years. Consumers feel that while they can control the vehicle they purchase, they have no control over the fuel supply chain. However, they do expect hydrogen to be on a pathway to low/zero-carbon content.
These results were used to inform the ownership proposition that was put to the consumers and the types of questions asked of them in the quantitative survey.
7
UK H2Mobility Phase 1 Results – Consumer Demand for FCEVs

Fleet Operators
Telephone interviews and two workshops were held with a group of fleet operators with the objective of exploring similar issues to those for individual consumers. As expected, the fleet buyer preferences reflected their business needs:
ll Fleet operators stated a clear need for low emission, long range, fast refuelling vehicles. The operators have a particular need for vans with these characteristics.
ll The economics of vehicle fleets mean that buyers are not able to pay a large premium for FCEVs. Their cost assessment was carried out on total cost of ownership, not purchase costs alone.
ll Operators are particularly sensitive to the taxes and charges on vehicle use. Special rates or exemptions for zero emission vehicles could make FCEVs more competitive with diesel vehicles earlier than would otherwise be the case.
ll Sensitivity to hydrogen availability varies greatly between operators. Some could run a large number of vehicles using only one refuelling station at or close to the fleet base. Those with dispersed or home-based fleets need a national HRS network. All, however, have more predictable driving patterns than consumer-owned vehicles.
ll Environmental performance is important to operators, both because of commitments to environmentally responsible behaviour and because of the current structure of vehicle taxation which favours low emission vehicles.
ll Operators are aware that regulatory and consumer demands for improved environmental performance will continue to increase. They are therefore looking to “future-proof” their vehicle fleets.
8
UK H2Mobility Phase 1 Results – Consumer Demand for FCEVs

The Consumer Proposition
Environmental Benefits
The tailpipe CO2 emissions of an FCEV are 0g/km. The focus groups showed that some consumers are prepared to pay a premium for this, even if the financial benefits of reduced Vehicle Excise Duty (VED), congestion charge exemptions and other incentives do not cover the extra cost.
Although the vehicle emissions are 0gCO2/km, some hydrogen production routes emit CO2. The consumer focus groups also showed that many consumers have a sophisticated understanding of emissions from the vehicle and the emissions related to fuel production. While consumers do not feel that they can control the way their fuel is produced, they do expect that total emissions should be better with FCEVs from the start, and should decline towards zero over time. Therefore, UK H2Mobility derived a mix of hydrogen production technologies to deliver a low and declining total emissions value for FCEVs (in gCO2/km). See Figure 1 below.
0
20
40
60
80
100
120
140
160
180
-75%
-60%
~55~45
~35
FCEV target
Diesel
Tota
l CO
em
issi
ons
(incl
udin
gfu
el p
rodu
ctio
n) g
CO /
km2
2
2015
2016
2017
2018
2019
2020
2021
2022
2023
2024
2025
2026
2027
2028
2029
2030
Figure 1: The path for the CO2 intensity of hydrogen used in FCEVs selected by the project members for the roadmap.
9
Driving Range & Refuelling
FCEVs can be driven long distances and then refuelled in a few minutes. This makes them attractive alternatives to diesel vehicles. However, this usability is compromised if the network of refuelling stations is limited, as it inevitably will be in the early years. The project therefore investigated consumers’ attitudes to the accessibility of hydrogen refuelling stations locally and to the national reach of the network.
The consumer proposition for FCEVs comprises a balance between costs, benefits and utility aspects. Based on the data and forecasts of the UK H2Mobility members, and from data available from other sources, these costs and benefits were calculated for the years from 2015 to 2030.
UK H2Mobility Phase 1 Results – Consumer Demand for FCEVs

Total Cost of Ownership
The UK H2Mobility project calculated the relative costs of FCEVs compared with the equivalent diesel vehicle over the first four years of the vehicle’s life (see Figure 2 below). This total cost of ownership (TCO) is calculated as a single cost for the period.
Figure 2: Calculation of TCO.
+ + =Purchase price (inc VAT)
+Cost of capital
–Residual value
=Capital costs
Maintenance and servicing
+Insurance
+Vehicle tax (VED)
=Operating costs
Cost of hydrogen (£/kg)x
Fuel consumption (kg/km)x
Distance driven over4 years (km)
=Fuel costs
Total cost of ownership
(TCO)
Although the project assumed a continuation of preferential vehicle tax (VED) rates for zero CO2 vehicles, no other financial incentives were included.
The purchase price and total fuel costs have the greatest influence on relative TCO. The evolution of these cost differences, and the TCO, during the period of the study are shown in Figure 3 below.
Figure 3: Average purchase price premium, relative fuel costs and relative TCO for FCEVs v. equivalent diesel vehicles.
The purchase price premium for FCEVs relative to diesel is high at the point of market introduction but is forecast to decline to near zero by 2030 as worldwide production volumes increase and technology advances. To reflect the consumer expectations
revealed in the focus groups, the price of hydrogen to the consumer in the UK H2Mobility roadmap starts and remains below that of diesel on a £/km basis.
The four year TCO for FCEVs becomes increasingly competitive with diesel between 2015 and 2030. By 2030, the TCOs are equivalent.
2015 20302020 2025
Purchase price
Fuel costsTCO
Rela
tive
cost
s fo
r FC
EVs
v. d
iese
l
10
UK H2Mobility Phase 1 Results – Consumer Demand for FCEVs

Potential early adopters
Segment
Attitudes toinfrastructure
Technology attitudes
Green attitudes
Cost sensitivity
Proportion insample
Probable late adopters Technology followers
High willingness to drive to find H2
Medium concern over 1 HRS per city
Strongest willingness to sacrifice convenience
Strong tech enthusiast
Willing to pay for new tech
Wants and might pay for new tech
WTP for green
Tailpipe more important that WTW
Strongest green attitude
Green hydrogen important
Payback not important
WTP for green and new tech
~10%
Payback of low importance
WTP for green and new tech
Below average willingness to drive to HRS
Strong concern over 1 HRS
Medium willingness to drive to HRS
Low innovativeness
Well informed on car tech
Not interested in new tech
Weak green motivation
Not willing to pay
Slightly green,but no sacrifices
Payback more important for new/green tech
~40%
Low running costs important
No WTP for green/new tech
Limited willingness to sacrifice convience
Limited willingness to sacrifice convenience
Very low interest in tech
Low innovativeness
Low interestin new tech
Some concern about pollution, but not WTP for green cars
Some concern about pollution but not WTP
Low running costs important
Value buyer
~50%
No WTP for green/new tech
Will only drive short distance to find H2
Low interestin tech
Lowest environmental concern
No WTP for green/new tech
Capital cost primary factor
Well-off enthusiasts
Innovative greens
1 2 High mileageluxury
Cautiouspragmatists
3 4 Single car value Younger sceptics
5 6 Uninterested rejecters
7
Consumer Reactions
As part of the project, 2,000 consumers, all prospective buyers of new or nearly-new vehicles, took part in a survey in which they were offered a series of choices to simulate the process of choosing a new vehicle. In each case, the choice was between a diesel vehicle, an FCEV and a plug-in hybrid electric vehicle (PHEV). They were given information on costs, performance and refuelling networks. These factors varied with each choice they were asked to make. The key output from this work is the ability to quantify the effect of all variables investigated in terms of their influence on the consumer’s willingness to pay (WTP).
This work generated two key outputs:
ll Segmentation of the consumer market into seven distinct consumer groups according to their willingness to pay for different features of the vehicles and a number of other factors.
ll Quantification of the consumer willingness to pay for an FCEV as determined by the stage of development of the refuelling network.
By necessity in these studies, the consumer is expressing a WTP based on their preferences now rather than at the point in the future when they might be able to choose an FCEV. In addition the respondents are not spending real money when stating their preferences. The project therefore calibrated the results by using Department for Transport studies on real world vehicle sales
to reflect consumers’ observed sensitivity to changes in vehicle prices. It should be noted that, in the first years after market introduction, the choice of FCEVs will be more limited than for existing vehicle types but it was assumed that a full choice of vehicles will become available as the market develops over time. Further, it is assumed that currently expressed preferences are maintained into the future.
Consumer Groups
Three groups of the new or nearly-new vehicle purchasing population are identified – Early adopters (10%), Later adopters (40%) and Techology followers (50%) – with the groups further segmented as below. Segmentation is made on the basis of attitudes (expressed as a WTP) to new technology, environmental performance and access to the refuelling network.
The key common attribute of the potential early adopters is their willingness to pay a premium for an FCEV (based on the four year TCO measure described in the previous section). This group represents approximately 10% of new vehicle buyers. Therefore, market introduction of FCEVs is possible before cost parity is reached with existing vehicle technologies.
Figure 4: Consumer segments identified in the quantitative survey, with defining characteristics.
11
UK H2Mobility Phase 1 Results – Consumer Demand for FCEVs

The Importance of the Refuelling Network for Willingness to Pay
Analysis of the consumer’s sensitivity to the refuelling station network can be shown as a WTP. The consumer will be less willing to pay for something if it requires some behavioural adjustment or compromise. It is apparent that this is the case with FCEVs in the period during the build-up of the refuelling network. An important insight from the quantitative survey is that the price the consumer puts on this compromise varies greatly between different groups.
If the refuelling network is very limited, the Early adopters motivated by a desire for the new technology have a negative WTP for FCEVs, i.e. they would require a discount relative to diesel vehicles to purchase, whereas those motivated by environmental concerns are prepared to pay a premium. If the network is more developed, the WTP of both groups becomes strongly positive (see Figure 5).
Although the work showed that some individuals were willing to accept a level of inconvenience associated with access to only one HRS (Innovative greens), the majority of consumers were not. Most respondents indicated that they would require access to more than one HRS locally if they are to consider buying an FCEV, but even here only some groups have a positive WTP. Furthermore with an improved HRS network the majority of consumers represented by the Later adopters and Technology followers would still require a discount to buy an FCEV under initial market conditions.
UK H2Mobility used these WTP data to determine both the minimum refuelling network needed to get the market started and the subsequent rate of growth of the market.
Well-off technologyenthusiasts
Innovative greens
0 0
Later adopters
Technology followers
GBP GBP
1 HRS per city & 10 Motorway stations
>1 HRS in local area & 100 Motorway stations
-ve +ve -ve +ve
Figure 5: The WTP of different consumer groups in two different HRS network scenarios.
12
UK H2Mobility Phase 1 Results – Consumer Demand for FCEVs

FCEV Market Growth
Assessing the Market Demand
The project undertook an extensive assessment of the market demand for FCEVs in the UK. A demand model was created using data and information from the vehicle manufacturers (on purchase costs and vehicle attributes) and from the consumers (on their willingness to pay in a given set of circumstances). Other than purchase cost, the variables affecting consumer purchasing decisions are operating cost, the coverage (both local and national) of the refuelling station network at the time of purchase and the total reduction in CO2 emissions in comparison to an equivalent diesel vehicle. The model is able to project sales under a range of different conditions.
Demand model
Estimatedpopulation sizeper segment
Consumer attitudes (from survey)Reaction to eachFCEV and HRSattribute
Segment-specificattitudes
Vehicle attributesVehicle pricePerformance/rangeHydrogenconsumption
HRS attributesUrban coverageNational coverageH² price andemissions
Market share
Year
Perc
enta
ge FCEVPHEV
Figure 6: Outline structure of UK H2Mobility demand model for FCEVs.
The demand model and consumer analysis provides the following insights:
By 2030 a cumulative FCEV fleet of 1.6 million vehicles can be achieved as the vehicles become cost-competitive and the HRS network develops. Annual sales could exceed 300,000 p.a. by 2030.
Early demand will be driven by the 10% of the population attracted to and willing to buy FCEVs at the prevailing total cost of ownership. These Early adopters would generate sales of FCEVs in the UK of approximately 10,000 p.a. by 2020.
Initial uptake rates, amounting to 13,000 vehicles in the first five years, are limited by the cost of buying the vehicles. No subsidy for FCEV purchase or operation has been assumed in the roadmap. Accelerating demand in this period requires a substantial reduction in the premium of FCEVs over diesel vehicles.
Fuel cell vans are not expected to be available in commercial volumes until the mid-2020s. This reflects the price sensitivity of the market for these vehicles, and the fact that vehicle manufacturers do not expect to supply this market until the mid-2020s, when fuel cell powertrain components and hydrogen have benefited from technology development and cost reduction in other vehicle types.
The market growth predicted in the UK H2Mobility roadmap implies a UK share of 10-15% of expected global FCEV sales.
UK Market for FCEVs
13
UK H2Mobility Phase 1 Results – Consumer Demand for FCEVs

0
50,000
100,000
150,000
200,000
250,000
300,000
HRS numbers
Annual FCEV sales
Relative total costsof FCEV v. diesel
350,000 1,400
1,200
1,000
800
600
400
200
0
2015
2016
2017
2018
2019
2020
2021
2022
2023
2024
2025
2026
2027
2028
2029
2030
Ann
ual F
CEV
sal
es
Num
ber
of H
RS in
ope
ratio
n
2015
2020
2025
2030
Relative total costs of FCEV v. diesel
0
5,000
10,000
15,000
2015 2016 2017 2018 2019 2020
Vehicle manufacturers’expectations
Consumer demandmodel prediction
Ann
ual F
CEV
sal
es
Figure 7: UK consumer demand for FCEVs increases as the cost premium diminishes and the network of HRS expands.
The expectations of the vehicle manufacturers and the consumer demand model show a strong correlation. The demand curve is very similar to the experience of other new technology vehicles introduced in the past ten years, e.g. petrol-electric hybrids: a slow take-up in the early years followed by acceleration thereafter as costs fall.
Figure 8: Demand curves from model compared with vehicle manufacturer input data.
14
UK H2Mobility Phase 1 Results – Consumer Demand for FCEVs

Supplying the Consumer with Hydrogen
Convenient and accessible hydrogen refuelling stations (HRS) are critical to the FCEV consumer proposition. The consumer analysis shows that the availability of hydrogen and cost of ownership are their primary concerns. Consumers expect the convenience of the HRS network to be similar to the diesel refuelling network. This is reflected in the consumers’ stated willingness to pay for an FCEV, which is heavily influenced by the distance they must drive to an HRS.
The quantitative survey showed that consumers were significantly more receptive to FCEVs if they have convenient access to HRS (see Figure 9 below).
In determining a suitable HRS network the project had two issues to consider and to balance:
ll Creating a network which provides accessibility for the maximum number of consumers.
ll Creating a network that delivers the best possible return on the up-front investment.
To ensure that the greatest number of consumers have the most convenient access to HRS and can use their vehicles as they want to, successful commercialisation requires the HRS network to cover the UK’s most populous areas and its key motorway and trunk routes.
<20
20
40
60
80
100
2 – 4 5 – 7 8 – 10 10 – 15 16 – 20 20>
Driving minutes to find HRS
% o
f gr
oup
will
ing
todr
ive
a nu
mbe
r of
min
utes
to
find
HRS
Well-off enthusiasts
Innovative greens
Later adopters
Technology followers
Figure 9: Early adopter groups are willing to drive further to refuel their FCEVs than are late adopters and followers.
Access to Stations
The project developed an HRS model capable of generating a number of different HRS roll-out scenarios. This spatial and temporal GIS-based model was used to identify an optimal HRS network and a strategy for roll-out. The UK was analysed at the level of Local Authority Districts (LAD), of which there are 405.
The consumer work indicates that a successful introduction of FCEVs in the UK is best achieved with the development from the outset of a “national” network of HRS. This will enable both localised commuting, and everyday and weekend travel for the population, while also providing for national travel for business and leisure/personal purposes.
Additionally consumers perceive access to only one local HRS to be a significant inconvenience. Therefore successful HRS roll-out requires at least two, and in some instances more, HRS per LAD.
The UK benefits from a relatively dense population in a number of conurbations/centres so that locating stations in the areas of greatest vehicle ownership and highest traffic flow, plus connecting motorways/A roads, was considered by the survey respondents to be sufficient for a viable HRS network providing national hydrogen mobility.
UK H2Mobility Phase 1 Results – Hydrogen Production and Retail
15

The Initial Network
An initial network of stations is necessary to get the market started. The challenge for UK H2Mobility was to identify the minimum number (and therefore the minimum upfront investment) necessary to ensure the availability of refuelling stations is not a barrier to early adopters buying FCEVs.
A key finding of the project is that an optimised roll-out strategy involves introducing FCEVs and HRS first in selected localities, with additional national coverage of HRS on major roads to enable long distance journeys. This provides a pathway for high population coverage in the early years, and enables principal journeys between population centres, while also taking account of associated investment levels.
The project determined that an initial minimum network of 65 stations in the right locations represents a good balance between consumer benefit and investment return. This network would cover major population centres, and connecting motorways and A roads to enable national mobility. It is based on having a minimum of two HRS per LAD in the targeted regions, with 8km between HRS and within a 10 minute drive.
Development of the Network
As the network develops, larger HRS will be built to satisfy the increased demand for hydrogen and to benefit from lower costs. The initial small stations will be upgraded to increase their capacity.
0
200
400
600
800
1000
1200Small
Medium
Large
2015 2020 2025 2030
Nu
mb
er o
f HR
S in
nat
ion
al n
etw
ork
Figure 10: The development in HRS number and size in the UK H2Mobility roadmap.
UK H2Mobility Phase 1 Results – Hydrogen Production and Retail
16
The Refuelling Network Develops
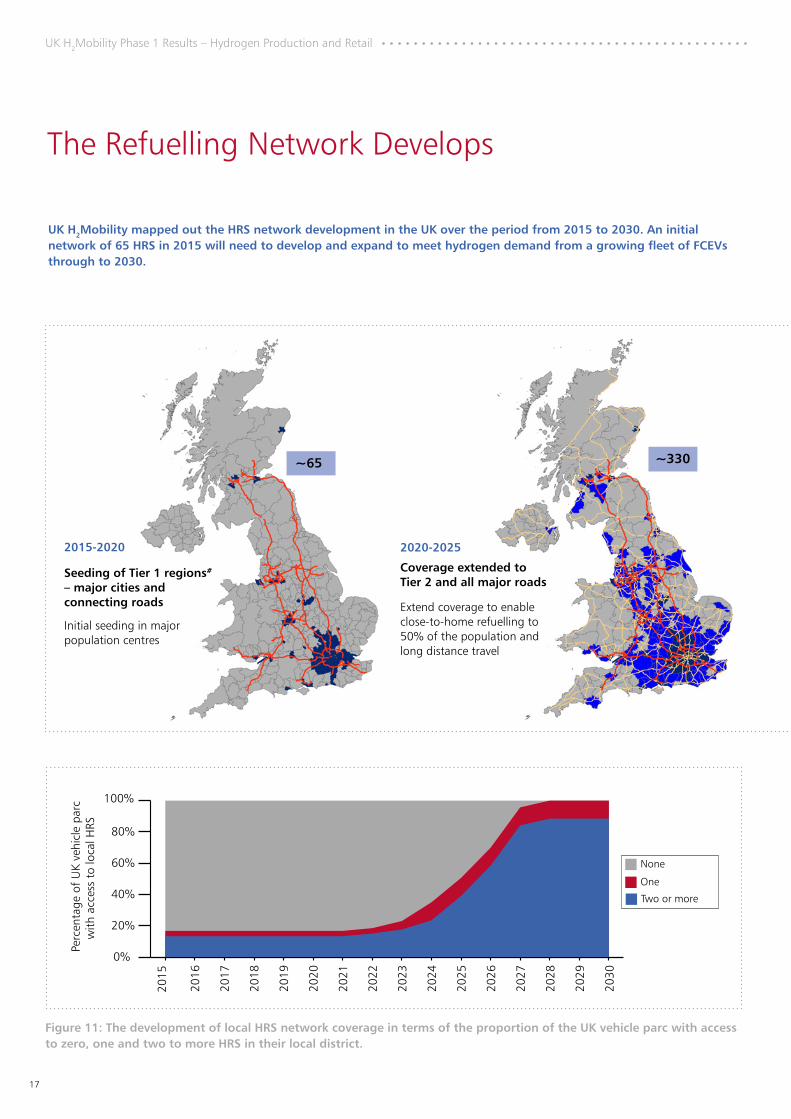
UK H2Mobility mapped out the HRS network development in the UK over the period from 2015 to 2030. An initial network of 65 HRS in 2015 will need to develop and expand to meet hydrogen demand from a growing fleet of FCEVs through to 2030.
0%
20%
40%
60%
80%
100%
2015
2016
2017
2018
2019
2020
2021
2022
2023
2024
2025
2026
2027
2028
2029
2030
None
One
Two or more
Perc
enta
ge o
f U
K ve
hicl
e pa
rcw
ith a
cces
s to
loca
l HRS
Figure 11: The development of local HRS network coverage in terms of the proportion of the UK vehicle parc with access to zero, one and two to more HRS in their local district.
Seeding of Tier 1 regions#
– major cities and connecting roads
Initial seeding in major population centres
~65
Coverage extended to Tier 2 and all major roads
Extend coverage to enable close-to-home refuelling to 50% of the population and long distance travel
~330
17
UK H2Mobility Phase 1 Results – Hydrogen Production and Retail
2015-2020 2020-2025
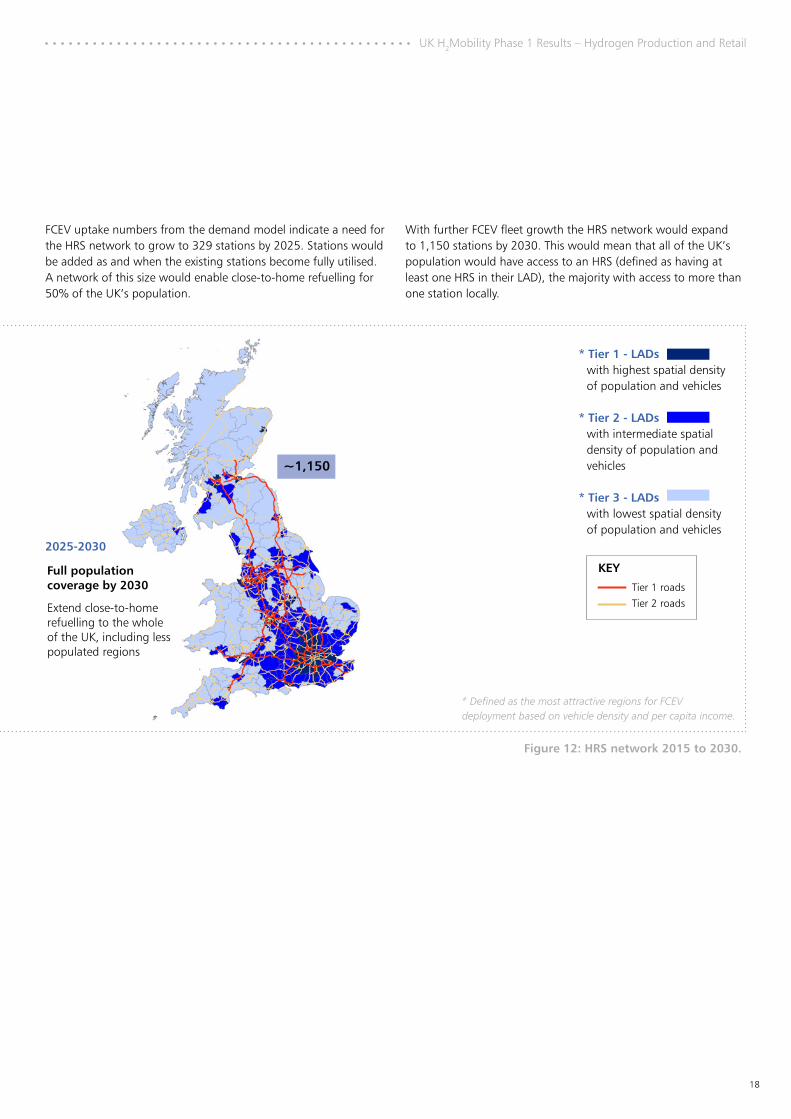
Figure 12: HRS network 2015 to 2030.
Full population coverage by 2030
Extend close-to-home refuelling to the whole of the UK, including less populated regions
~1,150
FCEV uptake numbers from the demand model indicate a need for the HRS network to grow to 329 stations by 2025. Stations would be added as and when the existing stations become fully utilised. A network of this size would enable close-to-home refuelling for 50% of the UK’s population.
With further FCEV fleet growth the HRS network would expand to 1,150 stations by 2030. This would mean that all of the UK’s population would have access to an HRS (defined as having at least one HRS in their LAD), the majority with access to more than one station locally.
18
# Defined as the most attractive regions for FCEV deployment based on vehicle density and per capita income.
UK H2Mobility Phase 1 Results – Hydrogen Production and Retail
2025-2030
* Tier 1 - LADs with highest spatial density of population and vehicles
* Tier 2 - LADs with intermediate spatial density of population and vehicles
* Tier 3 - LADs with lowest spatial density of population and vehicles
Tier 1 roads
Tier 2 roads
KEY

Production price (£/kg H2)
Prod
uctio
n ca
rbon
foo
tprin
t(k
g CO
2 / k
g H
2)
How the Hydrogen is Produced
An extensive assessment of the production of hydrogen for use by FCEVs was undertaken by UK H2Mobility to understand how consumer expectations for low and zero-carbon hydrogen could be met, while also ensuring that the resulting cost of hydrogen was acceptable. A further investigation was made of the benefits of water electrolysis for the UK’s electricity networks.
Consumer Expectations
The hydrogen produced for FCEVs must meet consumer expectations in terms of price and carbon footprint. Analysis of consumer data shows that consumers do not demand zero-carbon hydrogen from the first year of market introduction, but they do expect hydrogen supplied over the period to 2030 to have an ever decreasing carbon footprint, and to eventually be zero-carbon. These views are reflected in consumers’ willingness to pay for low/zero-carbon hydrogen.
While FCEVs themselves emit no CO2, some processes for hydrogen production do. Generally, the zero-carbon processes are more expensive (see Figure 13 below). There is therefore a balance to be struck between the competing desires for low cost hydrogen and hydrogen with a low/zero-carbon footprint. It is clear that expensive hydrogen would be a limiting factor on the demand for FCEVs, because this increases the TCO relative to diesel vehicles. At the same time, building an FCEV market on cheap high-carbon hydrogen will fail to deliver the desired road transport decarbonisation benefits, while also potentially locking out zero-carbon technologies for the future.
Fulfilling these consumer expectations while also meeting the demand for hydrogen from technologically proven and commercially viable production technologies drives the project’s hydrogen production assumptions.
Declining Carbon Intensity of Hydrogen
Eleven hydrogen production technologies were assessed by the project in terms of the carbon content and costs, with data from several sources, including the expert views of UK H2Mobility members. The processes evaluated were all based on water electrolysis (using electricity from different sources), hydrocarbon reforming (using fossil and bio-derived feedstocks) and gasification (of waste, coal and biomass). For those technologies under development, an assessment of their readiness and likelihood of operational deployment in the period 2015 to 2030 was made. The members took a conservative view and excluded those technologies for which there is doubt whether they will be sufficiently developed to make a contribution by 2030. In particular, the members assumed that carbon capture and storage (CCS) would not be part of hydrogen production processes before 2030.
Using the data on capacities, costs and carbon footprint, the UK H2Mobility project identified a mix of production technologies that would deliver acceptable total carbon emissions on a Well-to-Wheel (WTW) basis at an acceptable cost to the consumer. As such the project assumes that hydrogen supplied for road transport has a falling carbon intensity over time as shown on page 9 above. Using the mix of steam methane reforming (SMR), water electrolysis (WE) and by-product hydrogen, the WTW emissions of FCEVs will be competitive with plug-in hybrid electric vehicles, and far lower than diesel vehicles: 60% lower in 2020 and 75% lower in 2030, accounting for efficiency improvements in diesel cars over this period.
These targets meet the stated preferences of consumers, while also providing a pathway to zero emission hydrogen beyond 2030, thus allowing the decarbonisation benefits of hydrogen transport to be realised.
Figure 13: Price against CO2 emissions for different hydrogen production methods in 2015.
19
UK H2Mobility Phase 1 Results – Hydrogen Production and Retail

Hydrogen Production Mix
0%
20%
40%
60%
80%
100%
2015 2020 2025 2030
SMR WE Existing CapacitiesCO Intensity
Shar
e of
tot
al p
rodu
ctio
n m
ix
0
140
160
180
Tota
l CO
2 em
issi
ons
from
hyd
roge
npr
oduc
tion
on a
g/k
m b
asis140
120
100
80
60
40
20
2
Figure 14: The changing mix of hydrogen production methods in the roadmap delivers low and decreasing CO2 emissions.
The WTW CO2 emission targets for FCEVs in the UK H2Mobility roadmap can be met by initially utilising existing hydrogen production and evolving the production processes over time as shown in Figure 14. Existing available production capacity in the UK is sufficient to meet hydrogen demand from the FCEV fleet until 2018, at less than 1,000 tonnes p.a.
Water electrolysis would be a small proportion of total hydrogen production in 2015, but is forecast to become 50% of total production capacity by 2020, or about 1,500 tonnes of hydrogen. As a zero-carbon source of hydrogen when using renewable power, WE would lower the average carbon content of hydrogen in the UK, which currently is mainly dependent upon natural gas reforming. Additionally as a scalable production technology it could be deployed on a scale small enough for localised hydrogen production across the UK. In the UK H2Mobility roadmap, the electricity for WE is supplied on green electricity tariffs, delivering
CO2 benefits to the hydrogen production mix and operating and integration benefits to the renewable electricity producers.
Beyond 2020 further hydrogen demand requires the introduction of substantial additional production capacity to provide 51,000 tonnes p.a. by 2025. This calls for a mix of existing production capacities, including SMR. SMR and WE are forecast to be able to deliver the hydrogen required to fuel the FCEV fleet at an acceptable cost while at the same time reducing the carbon emissions.
By 2030, it is projected that the FCEV fleet will require 254,000 tonnes of hydrogen p.a. which would be supplied by a mix of SMR and WE. As noted above, the roadmap is conservative, based on currently demonstrated technologies. Developments in production technologies and in the wider energy system could deliver hydrogen at lower cost and lower CO2 intensity.
20
UK H2Mobility Phase 1 Results – Hydrogen Production and Retail

Options for Distribution and On-Site Production
Just as hydrogen can be made by many routes from many primary energy sources, so it can be made by the kilogram or by the tonne. The UK H2Mobility project considered production technologies at both centralised (i.e. a few large production facilities) and distributed scale. Distributed production has the benefit of producing hydrogen close to or at the point of demand. The economic and environmental benefits of each were assessed, with cost and practicalities of distributing hydrogen from centralised production fully considered.
In the roadmap, the WE part of the production mix is a combination of centralised and distributed production. WE is a very scalable technology and so the choice between on-site production and delivered hydrogen depends on the circumstances of individual stations and the economics of the two production paths. SMR is the cheapest production method at large scales and centralised SMR has lower CO2 emissions than distributed SMR, so the roadmap assumes that all SMR production to 2030 will be centralised.
The Benefits of Water Electrolysis for Electricity Networks
Water electrolysis is a key element of future hydrogen production. Using electricity to break the bonds between oxygen and hydrogen in water provides an opportunity for storing power in the form of hydrogen. Hydrogen has a number of applications as a fuel for stationary power and heat generation, for industrial use, and for power-to-gas applications but clearly it is a prerequisite for FCEV deployment.
WE is also an attractive and potentially valuable process for providing benefits to the operators of the UK’s power networks. The technology can be installed within the power system and controlled to operate at varying power levels and across varying periods. This is possible whether it is installed as a few large facilities or as a network of distributed units. Because it can respond very quickly, it can provide a new source of large scale and flexible demand, which can be used to absorb excess renewable energy and offer load levelling and frequency response services to the power industry, while delivering hydrogen for FCEV refuelling.
Through the period to 2030 the UK is expected to see a substantially increased share of time-varying renewable power sources, primarily wind and solar, reaching more than 30% by 20307 with a concomitant increase in reserve power plant. These sources are connected to both the transmission and distribution networks, are regionally focused, and are intermittent, diurnal and seasonal. Supply and price volatility arising from more renewables are significant challenges to providing a balanced and stable grid.
21
UK H2Mobility Phase 1 Results – Hydrogen Production and Retail
7 DECC, Updated Energy and Emissions Predictions (October 2012)

8 RedPoint report to the Committee on Climate Change projects, 110 hours of negative prices in 2030
22
In addition to the sale of hydrogen for refuelling FCEVs, WE can provide flexible and responsive demand at a number of scales:
Balancing system generation and load – WE would improve utilisation of power generation assets by providing a better balance between generation and system load. WE operators could react to price signals driven by excess or insufficient renewable power or sudden changes in system frequency by altering their demand and hence providing a balancing mechanism for the grid. One key opportunity is to operate WE to utilise low and negative electricity prices, which are likely to increase in the future due to greater renewables curtailment8. WE could also be located at bottlenecks in the electricity infrastructure to permit increased deployment of renewables without requiring expensive upgrading of the local electricity network.
Stabilising the grid – WE operators could be contracted by National Grid to provide a new form of demand-side reserve which ensures stability and helps maintain the system frequency of 50Hz. Several potential services are available including Short Term Operating Response (STOR), Frequency Control and Demand Management (FCDM) and frequency response. WE operators so contracted would need to guarantee to stop operations and hence power demand as instructed by the grid operator in timeframes of between seconds and hours.
The analysis undertaken by UK H2Mobility considered future electricity price duration curves and the system services that WE could offer the electricity distribution and transmission networks. The value of the WE balancing and stabilising services is predicted to improve the economics of hydrogen production. It is calculated that by providing these services, WE could by 2030 achieve at least a 20% reduction in the cost of hydrogen produced.
UK H2Mobility Phase 1 Results – Hydrogen Production and Retail

The National CO2 Emissions Benefit
A primary benefit of the successful introduction of FCEVs and hydrogen is a substantial reduction in the UK’s CO2
emissions from road transport.
UK H2Mobility has identified a pathway to zero-carbon emission road transport using FCEVs. Substantial carbon reductions by 2050 are achievable given the analysis of the market potential for FCEVs and the possible production routes for hydrogen. As shown in previous sections, the UK H2Mobility roadmap shows FCEVs achieving 75% lower emissions by 2030 compared to diesel vehicles, on a path to zero emissions by 2050.
The reductions per vehicle translate to total fleet WTW CO2
reductions of 3 million tonnes annually by 2030, and critically, between 13 and 32 million tonnes p.a. by 2050 depending on the assumptions on the ultimate share that FCEVs have of the UK vehicle fleet and of vehicle miles driven. These lower and upper carbon reduction estimates are based on scenarios derived from the DECC 2050 Pathway Analysis for FCEVs, assuming the proportion of the total UK fleet lies between 20% (7 million vehicles) and 50% (17 million vehicles) of the total 2050 fleet.
The hydrogen production mix in the UK H2Mobility roadmap is conservative, containing technologies that are all commercially available now. Any new technology that becomes available before 2030 could have a significant effect. If it is able to produce cost-competitive hydrogen with lower or zero CO2 emissions, it will further improve the CO2 reductions offered by the roadmap. If it is able to produce hydrogen more cheaply with competitive CO2 emissions, it will increase FCEV uptake to the benefit of national CO2 emissions reduction.
Full decarbonisation of hydrogen production by 2050 will depend, as for all vehicle types, on the development of new energy production technology and capacity. The great diversity of hydrogen production routes gives FCEVs a particular advantage in this area. As and when the new, lower carbon production technologies are introduced, the effect will be to reduce CO2 emissions across the whole FCEV fleet, not just new vehicles.
0
10
20
30
40
2015
2020
2025
2030
2035
2040
2045
2050
3
roadmap
DECC 2050
Pathway Scenarios
Ann
ual C
O a
bate
men
t(m
illio
n to
nnes
p.a
.)2
UK H2Mobility
Figure 15: Annual CO2 savings to 2030 delivered by the UK H2Mobility roadmap put the UK on the right trajectory to meet DECC’s 2050 scenarios and CO2 targets.
UK H2Mobility Phase 1 Results – Benefits
23

Local Air Quality Benefits
With the introduction of FCEVs and hydrogen there are further emissions benefits to the UK in the form of improvements to local air quality.
FCEVs emit no pollutants. Therefore, their use will afford a number of air quality and environmental health benefits, besides carbon dioxide emissions savings. Reductions in air pollutants relative to diesel and petrol vehicles, in particular oxides of nitrogen (NOx) and particulate matter (PM), will deliver improvements in air quality and hence the health of the UK population.
The UK H2Mobility roadmap shows FCEVs displacing 1.6 million diesel vehicles from the UK fleet by 2030. Two of the DECC Pathway Scenarios show this number growing to between 7 million and 17 million vehicles in 2050. The savings in annual emissions implied by FCEVs replacing diesel vehicles in these numbers are shown in Figure 16. Using DEFRA’s air quality damage costs for a Euro VI diesel vehicle, the cost savings represented nationally are £14 million p.a. by 2030 and £100-£200 million p.a. by 2050.
0
1
2
2015
2020
2025
2030
2035
2040
2045
2050
0
10
20
30
2015
2020
2025
2030
2035
2040
2045
2050
Ann
ual N
Ox
savi
ngs
(tho
usan
d to
nnes
p.a
.)A
nnua
l PM
sav
ings
(tho
usan
d to
nnes
p.a
.)
Figure 16: Air quality benefits, annual reduction in national pollutant emissions.
UK H2Mobility Phase 1 Results – Benefits
24
Industrial and Employment Benefits
The UK H2Mobility project has identified potentially substantial economic benefits arising from the UK becoming a leading market for FCEVs and hydrogen. These benefits are especially important for the UK’s automotive industry.
The UK is one of Europe’s leading vehicle markets by volume, and the vehicle makers that will be the first to offer FCEVs are already significant suppliers to the UK market. There are more than 40 companies manufacturing vehicles in the UK, in some of the most productive plants in Europe. These include 11 of the world’s global vehicle manufacturers – Ford, General Motors, Honda, Nissan, Toyota, BMW (MINI and Rolls-Royce), Jaguar Land Rover, Volkswagen (Bentley), Aston Martin, Lotus, and MG, as well as specialist brands such as McLaren and Morgan, commercial vehicles including Leyland Trucks, and construction equipment makers like JCB.
The industry in the UK is enjoying a period of growth in the face of difficult market conditions and strong competition. With a turnover in 2011 of over £54 billion and GVA of £10.8 billion, it directly employs 131,000 in vehicle and parts manufacturing9 and an estimated further 150,000 in the supply chain10. UK automotive exports have been on an upwards trend since 2008, accounting for 11.6% of total manufactured exports in 2011, and with the traditional trade deficit in vehicles heading towards surplus.
Underpinning this activity, a significant automotive R&D capability has developed in the UK, in particular around engines, with a talent pool and high entry ticket items to match, including test tracks, engine cell facilities and emissions laboratories.
This includes strengths in academic research and a world-class automotive design engineering sector providing consultancy services to the global industry.
The Society of Motor Manufacturers and Traders (SMMT) is forecasting this growth to continue in the short term, with the UK on track to build around 2 million vehicles in 2016. Vehicle production in 2012 was up 9% on 2011 to 1.46 million units, of which over 1.2 million (83%) were exported – an all-time record. The UK also produced 2.5 million engines in 2012, with over 62% exported. In addition the UK Automotive Council, comprising industry and government, has identified FCEVs as an important future technology in its roadmap for low carbon vehicles.
Being at the forefront of the commercialisation of FCEVs and hydrogen could bring substantial benefits for the UK’s successful automotive sector. Vehicle assembly plants, supported by an innovative supplier base ranging from design and development to component manufacture, could provide jobs, exports and wealth creation for the UK economy. In addition there will be significant opportunities for the fuel suppliers and retailers, energy utilities, hydrogen network providers and others leading to further potential for wealth and job creation.
The benefits to the UK as a whole as well as to individual sectors and businesses is recognised in the current coalition of interests from both the public and private sectors and from along the value chain.
2000 2010 2020 2030 2040
130 95 TBD
Demonstrators Fuel cell vehicle
Niche EVs Mass market EV technology
Demonstrators Plug-in hybrid
Full hybrid
Micro/mild hybrid
IC engine and transmission innovations (gasoline/diesel/gas/renewables H²)
Vehicle weight and drag reduction
H² infrastructure Fuel Cell & H² supply/storage breakthrough
Energy storage breakthroughCharging infrastructure
EU fleet average CO²targets (g/km)
...
Figure 17: UK Automotive Council Future Technologies Roadmap.
25
UK H2Mobility Phase 1 Results – Benefits
9 Source ONS Annual Business Survey, 2011 data, SIC29
10 BIS estimate

Benefits for the UK Energy System
The UK’s energy system will benefit from successful commercialisation of FCEVs and hydrogen, both in terms of diversifying energy supplies and from the economic benefits arising from UK produced, rather than imported, road fuels.
UK Future Energy System
As part of its decarbonisation plans, the UK is committed to substantial increases in energy derived from renewables over the next few decades. This includes wind generated energy, both on- and off-shore. It is recognised that increasing renewables in the energy system leads to challenges for grid operation and the need for substantial investment in electricity infrastructure; notably to ensure stability when intermittent renewable power is delivered to the grid.
Hydrogen generation by water electrolysis for refuelling FCEVs provides a new means for smoothing out intermittent renewable energy production and energy storage. HRS generating or receiving hydrogen generated by water electrolysis would benefit the continued integration of indigenous renewable power sources in both the short and long term.
Increased UK Value in the Fuel Supply Chain
The introduction of hydrogen into the energy economy will have benefits for the UK arising from substitution of imported fuels by UK produced hydrogen and the indirect benefits of hydrogen production using water electrolysis for the UK’s power sector.
The substitution of diesel by the equivalent energy value of hydrogen (after accounting for the greater energy efficiency of FCEVs compared with diesel vehicles) is estimated to produce an overall £1,300 million per annum benefit to the UK economy by 2030. The benefit arises from the fact that half of diesel used in the UK is imported, representing 55% of the fuel value chain for diesel. Hydrogen would be largely UK produced, equivalent to 92% of the value chain for hydrogen, with the remaining 8% of value accounted for by imported natural gas used for the SMR production process. It should be noted that the financial benefit far exceeds the cost of building the recommended 1,150 HRS by 2030.
Hydrogen Diesel
Additional UK value
UK valueImported
Increased proportion of UK value in hydrogen cf diesel
Figure 18: Value of increased domestic energy production and reduced imports in 2030.
26
UK H2Mobility Phase 1 Results – Benefits
Building the Refuelling Network
As described previously in the section on “Supplying the Consumer with Hydrogen”, the spatial and temporal planning of the refuelling network in the UK H2Mobility roadmap was concerned with balancing two objectives: maximum accessibility for the most consumers and the best possible return on the up-front investment. Throughout the process, the UK H2Mobility members assessed the costs and returns for the HRS network, both for the whole network and at the individual station level. Understanding the business case for the HRS stations is critical to planning the market introduction of FCEVs.
The Elements of the Business Case
Four main variables determine the investments required for an HRS network and the potential returns, each of which varies with technology development, growth in the demand for hydrogen and economies of scale. The project assessed all of them across the whole period of the study.
1. Capital cost of equipment. This includes the cost of buying and installing all equipment for compressing, storing and dispensing hydrogen on site, and the cost of financing the expenditure. An HRS is assumed to have a 20 year useful life. Not included is the cost of buying the site of the HRS since not all business models would require the purchase of the land. The cost of land was therefore included as an annual fee in the operating cost.
2. Operating cost. This includes the cost of manning the HRS, the general running costs, the cost of administration and sales and, as mentioned above, a rental charge for the land under the HRS.
3. Hydrogen. It was assumed that all HRS pay the same price for hydrogen, and that this is the average national cost based on the mix of production and distribution at the time, as set out in the roadmap. This applies equally to HRS with on-site generation.
4. Revenues. This includes only the revenue from selling hydrogen and takes no account of any associated retail income. Thus it is calculated as kg H2 sold multiplied by the retail margin on each kg. The margin is the selling price (less any taxes) minus the delivered cost of the hydrogen. As for the cost (point 3 above), the selling price of hydrogen was calculated as a national average. In the roadmap, it is determined to be the highest price that the consumer is willing to pay (as determined in the consumer surveys) or the highest price permitted by local competition – whichever is lower. In the calculations, revenue flow from an HRS does not start until a year after the investment has been made, to allow for building and commissioning.
These elements were combined to assess the business case for building individual new stations, for the upgrading of existing stations to increase their capacity, and for the network of HRS as a whole. In analysing these business cases over the whole period of the roadmap, three distinct phases are identified.
Phase 1: Market Seeding – 2015 to 2020
As described in early sections, the UK H2Mobility project arrived at a network of 65 small HRS as sufficient to meet the needs of the early market for FCEVs while keeping the up-front investment as low as possible.
This phase is characterised by two key features:
ll The capital costs are high, because the technology is new and the number of stations few. The UK H2Mobility roadmap reduces this effect by assuming that these will be small stations, with a capacity to serve about 100 FCEVs each. (Although this capacity will not be sufficient when the market starts to take off, it is cheaper to enlarge them when needed than to build them as larger stations from the outset.)
ll The revenues are low, because the number of FCEVs on the roads is low in the early years and not sufficient to make full use of the installed refuelling capacity in the network. The UK H2Mobility roadmap minimises this effect by placing the stations in the areas where they will have access to the largest number of potential consumers.
This combination of upfront investment and low initial income indicates that a challenge exists in securing the initial investment and some support for seeding the market may be required.
Phase 2: Investing in Growth – 2020 to 2025
After 2020, as the number of FCEVs on the road grows, new HRS must be built to meet the demand for hydrogen. The UK H2Mobility roadmap envisages that the new stations will be built as needed, rather than in advance of demand, resulting in high utilisation rates. Higher utilisation rates translate into higher revenues meaning that, early in this period, the margins are sufficient for the network to cover its operating costs (though not yet its capital costs).
HRS in this period are not yet profitable. Nevertheless, they represent a good investment because, if the market develops as predicted in the roadmap, stations built in this period will be profitable over their lifetime. Some measures or commitments may be needed to give investors confidence in the continued growth of the market but the investment case is good.
During this period, the factor determining the market price for hydrogen changes from its competitiveness with diesel on a £/km basis to competition between retailers within the hydrogen market on a £/kgH2 basis.
UK H2Mobility Phase 1 Results – Towards Market Introduction
27

Phase 3: A Developed Network and a Developed Market – 2025 to 2030
Before 2030, an important tipping point is reached. Demand is high enough and growing strongly enough for revenues to cover all HRS costs, including the annualised capital cost, and new HRS are profitable from their first year of operation on that basis.
By 2030, a full national network of HRS has been built. This, together with the competitive TCO of FCEVs by this time, will allow the market for FCEVs and for hydrogen fuel to grow strongly. With confidence in future demand and a profitable business case for HRS investment, the refuelling network will be funded and built in accordance with market demand.
Quantifying the Commitment
The financing need required before the HRS network becomes fully self-sustaining is best quantified in terms of free cash flow. This is the sum of all undiscounted net cashflows from the first HRS investment to the point (described in Phase 3 above) at which the annual cashflows turn positive. This financing need is £418 million, of which £62 million is required before 2020.
In considering this financing need, there are three important points:
1. This is not the total investment needed in the network; it is the amount of the investment that is not covered by income.
2. This is not a lost investment. The investment of £418 million results in an asset – the HRS network – that will deliver positive returns in the years after breakeven.
3. The UK H2Mobility roadmap assumes that policies on fuel excise duty remain unchanged and that hydrogen will start to be taxed as a road fuel. If road fuel duty on hydrogen is less than assumed in the roadmap, the breakeven point for the HRS network and TCO-parity for FCEVs would be brought forward, increasing the rate of FCEV market development.
UK H2Mobility Phase 1 Results – Towards Market Introduction
28

Making it Happen
This first phase of the UK H2Mobility project has demonstrated that a roll-out of FCEVs can deliver significant benefits to the UK and provide commercial opportunities for industry players across the entire hydrogen transport value chain. However, it has also identified, and quantified, the key challenges, especially at the very early market stages.
A second phase of the project will focus on identifying ways by which these challenges might be overcome. The key challenges to be addressed are described below.
Building the Early HRS Network
There is no obvious first mover advantage to invest in the initial, critical 65 HRS identified as necessary to meet consumer needs for the deployment of vehicles from 2015 onwards. The initial utilisation rates will be insufficient to cover operating costs, and thus there is no incentive for existing fuel retailers to make hydrogen available on their forecourts. Furthermore, there is no long term case for initial investment in these early stations if the market is unable to afford protection against later entry fuel retailers who are able to take advantage of lower costs and higher revenues. Innovative financing options and mechanisms to build sustainable advantage, including collaborative efforts, will need to be further explored to overcome this first mover disadvantage and ensure that the early stations are built.
Improving the Early Consumer Proposition
The results of the consumer study demonstrate that an early consumer case for FCEVs exists, but that uptake in the first years will be low due to the initially high TCO relative to diesel vehicles. Although this uptake curve mirrors that seen in other new vehicle technologies, it risks deterring vehicle manufacturers from viewing the UK as a viable lead market for the deployment of their FCEVs from 2015. The low uptake also has a negative impact on the case for HRS investment, due to the resulting low utilisation rates. Various sensitivities were carried out on the uptake numbers during the development of the roadmap and these demonstrated that a reduction in the upfront cost of the vehicles or increase in the taxation rates of conventional fuels could significantly accelerate the take-up of vehicles in the early years and, through the resulting increase in utilisation of the HRS stations, could have a positive impact on the case for HRS investment.
Consideration of potential options to reduce the upfront costs of the vehicles and improve the early consumer proposition will also therefore be a key element of the second phase of the project.
Ensuring Synchronisation of Vehicle Introduction and HRS Build Up
The HRS network development identified in the roadmap as most efficiently meeting the needs of consumers in accordance with the forecast vehicle uptake numbers, is likely to require co-ordinated action if stations are to be built in the right locations at the right time. Industry and government (at national, devolved and local levels) will need to work together in the next phase of the UK H2Mobility project to identify options for ensuring such co-ordination can be achieved. In addition, options to ensure vehicles are brought to the UK in sufficient numbers to support the network roll-out will need to be considered.
Securing the Right Mix of Hydrogen Production Technologies to Deliver Carbon Benefits
The UK H2Mobility roadmap sets out a plausible production pathway for hydrogen, but it is not the lowest cost mix. To ensure that reductions in CO2 emissions are achieved in line with the roadmap, it will be necessary to control and monitor the carbon emissions from hydrogen production.
29
UK H2Mobility Phase 1 Results – Towards Market Introduction

Next Steps
The second phase of the UK H2Mobility project, to be completed in 2013, will build on the fact base produced in the first phase. This next phase aims to develop the integrated business case for realising all parts of the roadmap and address key barriers to the introduction of FCEVs to the UK.
Phase 1a:Role of hydrogentransport in the UK
Phase 1b:Hydrogen roll-outstrategydevelopment
Phase 2: Business casedevelopment
Phase 3:Implementationplan
Objectives UK H²MobilityEvaluate the potential for hydrogen asa transport fuel and develop a roll-outstrategy that will contribute towards
l Decarbonising surface transportl Creating new economic opportunitiesl Diversifying energy supplyl Reducing local environmental impacts
Main focus of Phase 2l Developing a detailed business case and overarching framework for how the UK H²Mobility roll-out will proceed into Phase 3 and the implementationl Achieving mechanisms and consensus on how key barriers and market failures are to be resolved
The key objectives of Phase 2 of the UK H2Mobility project are:
ll Development of a commercial model for building the early refuelling infrastructure, with detailed business planning for all the required participants.
ll Evaluation of options – both financial and non-financial – for improving the early consumer proposition.
ll Establishment of a clear technical, commercial and regulatory pathway to low carbon production of hydrogen.
Additionally, Phase 2 will address practical obstacles to the market introduction of both the FCEVs and the HRS.
30
UK H2Mobility Phase 1 Results – Towards Market Introduction

UK H2Mobility Phase 1 Results – Towards Market Introduction
“The transition to ultra-low emission vehicles has already begun. It has the potential to create really significant new economic opportunities for the UK, to diversify national energy supply and to decarbonise road transport. The findings released today demonstrate that hydrogen fuel cell electric vehicles can make a significant contribution to this.”
Michael Fallon Business Minister Department for Business, Innovation and Skills
“The motor industry recognises it is vital for it to develop and deliver new solutions for reducing the environmental impact of the vehicles it produces. Hydrogen fuel cell technology represents a major advance in securing sustainable mobility.
“As manufacturers reach the point of bringing the first FCEVs to market, it is important that all interested parties work together to ensure their benefits can be appreciated and realised through co-ordinated dialogue between industry partners and government bodies. UK H2Mobility’s Phase 1 findings provide valuable resources and intelligence to help us secure these advantages and we look forward to participating in Phase 2 to further confirm the potential of hydrogen as a low carbon fuel in the UK.”
Akihito Tanke Vice President, Research and Development Toyota Motor Europe
Support for the UK H2Mobility Process
“We are pleased with the findings of Phase 1 of UK H2Mobility, which reflect a diligent process of appraisal by the collaborative partnership. Phase 1 sows a seed for the adoption and development of a new transport system which will allow society to decarbonise road transport and clean up emissions, without disrupting its business and social routine. Phase 2 will show how that seed can proliferate, enabling the UK to be a world leader in the deployment and manufacturing of the necessary electrolyser-refuelling technology and fuel cell vehicles. This presents the UK with a very real economic opportunity for growth.”
Dr. Graham Cooley CEO ITM Power
“This is an important step for the automotive sector towards the development of clean vehicle technologies and zero emission mobility.”
Jerry Hardcastle Vice-President, Vehicle Design and Development Nissan
“The extensive work carried out by the UK H2Mobility consortium positions the UK as a lead market for the roll-out of fuel cell electric vehicles, directly contributing to national decarbonisation and air quality improvement objectives.
“The programme is particularly relevant for UK companies such as Intelligent Energy in building on our leading fuel cell expertise, developing our local supply chains and in creating additional opportunities for our products. We look forward to progressing to the next phase.”
James Batchelor Managing Director, Motive Intelligent Energy
31
Following the announcement of preliminary results from Phase 1 of the project in February 2013, members of UK H2Mobility reconfirmed their support for the process.

UK H2Mobility Phase 1 Results – Towards Market Introduction
“Sustainable mobility is a key challenge for the future and we are convinced that fuel cell vehicles will play a central role. Our engineers have developed this technology already to a very high level of maturity and with our co-operation with Ford and Nissan we will accelerate the commercialisation of fuel cell electric vehicles worldwide. But such a technological change – from the conventional internal combustion engine towards emission-free mobility in the long term – cannot be implemented by the individual. A major prerequisite for the market success of FCEVs is an appropriate infrastructure. As a partner of UK H2Mobility we have the possibility to support the acceleration of the hydrogen and fuel cell technologies’ deployment in the UK. The strong commitment of industry leaders within this platform is an important milestone on the path to a future sustainable mobility.”
Prof. Herbert Kohler Vice President Group Research and Sustainability; Chief Environmental Officer Daimler AG
“The UK H2Mobility initiative has succeeded in gathering both leading industry companies and government bodies in a co-ordinated approach to study the conditions and paths to allow FCEVs to reach their full potential in the UK.
“The work achieved in Phase 1 provided fact based elements and rationale which confirm that the UK could be a country at the forefront of early FCEV deployment.”
Pierre-Etienne Franc Director, Technologies of the Future Air Liquide
32

Data and Information Sources
The UK H2Mobility project utilised a range of data and information in the course of the project. This included data and information from coalition members, other businesses and organisations, including from similar studies undertaken in Europe, and data and information generated by the study e.g. surveys, as well as publicly available data and information.
To ensure that the best available information could be used in the analysis, all commercially sensitive data were collected, aggregated and anonymised by a dedicated and separate team of analysts before being used in the project.
Key data sources and uses are set out in Table 4 below.
Data type Description/Explanation1. Monetary values All values are 2010 real values. Projected future values include no inflation effects.
Currency conversions at 2011 average rates.2. Vehicle data Vehicle pricing, performance, efficiency, maintenance and servicing costs.
All from manufacturers' data.3. Vehicle use Annual mileage from UK average values. All other requirements derived from
consumer research within the project.4. Hydrogen production
and distribution Costs (capital and operating) and technical norms from industry data and research within the project.
5. Energy input costs and diesel costs
DECC forecasts used for comparison purposes.
6. Hydrogen refuelling stations
Costs (capital and operating) and technical norms from industry data and research within the project.
UK H2Mobility Phase 1 Results – Annexes
33
Table 4 Data used in the UK H2Mobility roadmap.

Glossary
BIS Department for Business, Innovation and SkillsCCS Carbon Capture & StorageCO2 Carbon DioxideDECC Department of Energy and Climate ChangeDEFRA Department for Environment, Food and Rural AffairsDfT Department for TransportEuro VI European Union emission standards applying to all light vehicles sold in the EU from 2014FCDM Frequency Control & Demand ManagementFCEV Fuel Cell Electric VehicleFCH JU European Fuel Cell and Hydrogen Joint UndertakingGBP UK PoundsGIS Geographical Information SystemsGVA Gross Value AddedH2 HydrogenHRS Hydrogen Refuelling Station(s)kg Kilogramkm KilometreLAD Local Authority DistrictNOx parc
Oxides of Nitrogen The population of vehicles in use
PHEV Plug-in Hybrid Electric VehiclePM Particulate Matter (Particulates)R&D Research & DevelopmentSMMT Society of Motor Manufacturers and TradersSMR Steam Methane ReformingSTOR Short Term Operating ResponseSUV Sport Utility VehicleTCO Total Cost of OwnershipULEV Ultra Low Emission VehiclesVAT Value Added TaxVED Vehicle Excise Duty (Vehicle Tax)WE Water ElectrolysisWTP Willingness to PayWTW Well-to-Wheel
UK H2Mobility Phase 1 Results – Annexes
34

For further information on UK H²Mobility, please contact any of the participants listed in the report.
For general enquiries, please email [email protected]


