LCP ACCOUNTING FOR PENSIONS 2014 2014 has ushered in a new era for UK pensions. Our 21st annual survey looks at how FTSE 100 companies are managing their pension liabilities and highlights opportunities for the future.
Transcript
LCP ACCOUNTING FOR PENSIONS 2014
2014 has ushered in a new era for UK pensions. Our 21st annual survey looks at how FTSE 100 companies are managing their pension liabilities and highlights opportunities for the future.
2
For further information please contact Bob Scott, Nick Bunch or the partner
who normally advises you.
This report may be reproduced in whole or in part, without permission,
provided prominent acknowledgement of the source is given. The report
is not intended to be an exhaustive analysis of IAS19. Although every
effort is made to ensure that the information in this report is accurate,
Lane Clark & Peacock LLP accepts no responsibility whatsoever for any
errors, or the actions of third parties. Information and conclusions are
based on what an informed reader may draw from each company’s
annual report and accounts. None of the companies have been contacted
to provide additional explanation or further details.
View a full list of our services at www.lcp.uk.com
We would like to thank those from LCP who have made this report possible:
Catriona Armstrong
Nick Bunch
Emma Colpus
Sophie Dapin
Laura Davies
Jeremy Dell
Catherine Drummond
David Everett
Charlie Finch
David Fink
Emma Ingham
Andrew Keenan
Holly Moffat
Simon Perera
David Poynton
Ella Purkiss
Charlotte Quarmby
Rebeccah Robinson
Max Root
Bob Scott
Natalie Stimpson
Alex Waite
Rachel Walton
Ken Willis
Charlotte Woods
Chris Wragg
2
LCP Accounting for Pensions 2014
p4 Foreword
p6 1. Main findingsp8 1.1 Deficits persist
p8 1.2 Major longevity swap and
buy-in transactions
p8 1.3 Companies continue to seek alternatives
to straight cash funding
p8 1.4 The 2014 Budget – a retirement revolution
p9 1.5 Collective defined
contribution schemes?
p9 1.6 More companies move to DC schemes
p10 1.7 Pension contributions down,
despite auto-enrolment
p10 1.8 After a pause, the flight from
equities continues
p11 1.9 Further challenges and
opportunities lie ahead
p12 2. A remarkable year for pensionsp14 2.1 The March 2014 Budget
p17 2.2 The defined ambition project
p20 3. Summary of main findingsp22 3.1 Introduction
p22 3.2 FTSE 100 pension liabilities exceed half a
trillion pounds
p23 3.3 Pension scheme funding
p25 3.4 More reductions in DB pension
provision
p27 3.5 De-risking
p30 3.6 Challenges and opportunities on the
horizon
p34 4. Accounting standards p36 4.1 New version of IAS19
p36 4.2 Disclosures overhauled
p37 4.3 Tail wagging the dog?
p38 5. Analysis of pension disclosuresp40 5.1 Introduction
p40 5.2 Analysis of results
p46 5.3 Key assumptions
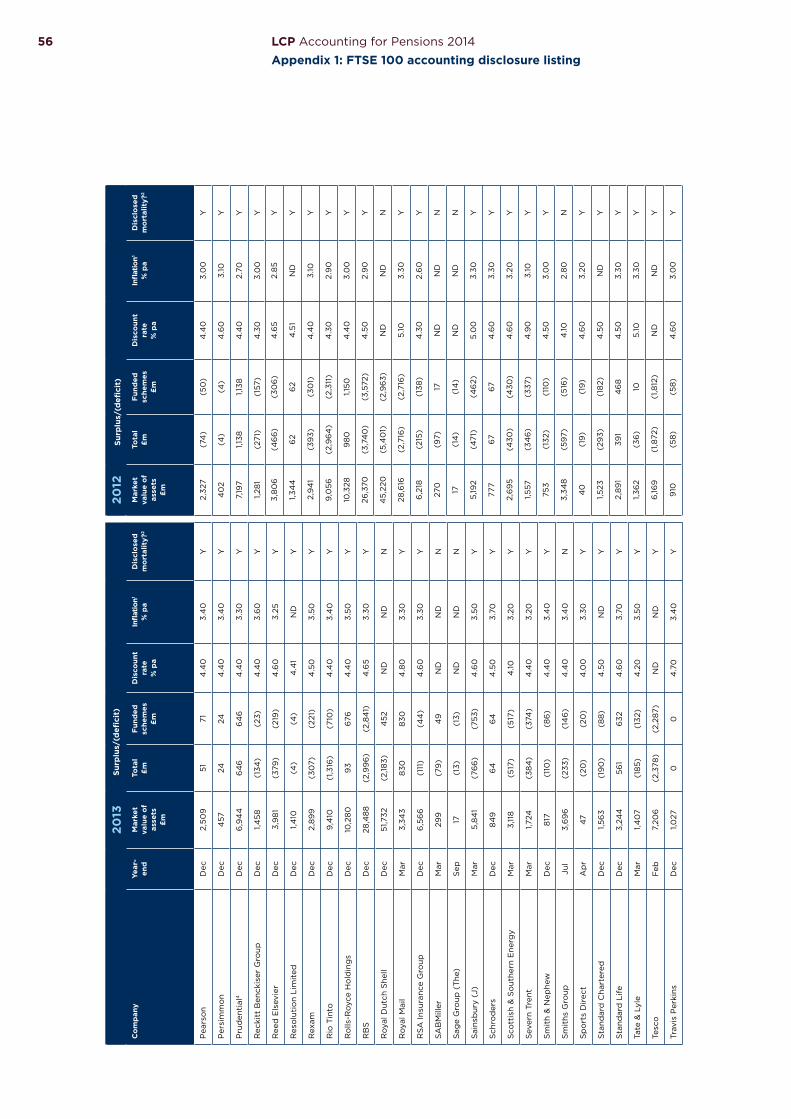
p54 Appendix 1 - FTSE 100 accounting
disclosure listing
p58 Appendix 2 - FTSE 100 accounting
risk measures
p63 Appendix 3 - Summary of disclosed
non-cash funding arrangements
3
LCP Accounting for Pensions 2014
Foreword4
In some ways the pensions outlook – for individuals as well as companies – is as bright as it has been for many years.
Bob ScottPARTNER, LCP
5LCP Accounting for Pensions 2014
Foreword
The past 12 months have seen wider
pension coverage as “auto-enrolment”
takes effect for medium sized companies.
However, most new entrants have joined
defined contribution (DC) arrangements
and many have had no more than the
statutory minimum contributions from
their employers. With pension taxation
becoming ever more complex and with
companies facing additional costs when
“contracting-out” ends in 2016 this trend
is likely to continue.
Our survey shows that, despite FTSE 100
companies pumping more than
£100 billion into their pension schemes
over the past five years, most schemes
still do not have enough money to cover
their pension liabilities.
Yet in some ways the pensions outlook –
for individuals as well as companies – is
as bright as it has been for many years.
Following the 2014 Budget, people will
no longer be forced to use their
retirement savings to purchase an
annuity. And this change could benefit
companies who sponsor defined benefit
(DB) schemes if retiring individuals
decide to cash in their DB benefits to
take account of the new flexibilities.
This year has seen “buy-in” and longevity
swap transactions at levels not previously
contemplated. Most recently, BT Group
announced it had implemented a
£16 billion longevity swap. And a few
months earlier, the ICI Pension Fund
completed a £3.6 billion buy-in of
pensioner liabilities.
Finally, this year also saw a fall in the
level of cash contributions to FTSE 100
pension schemes, with the number of
companies adopting innovative ways
of providing security to their pension
schemes increasing markedly.
38 FTSE 100 companies disclosed some
form of security arrangement in their
2013 accounts.
So we see that members of pension
schemes can be better served whilst
companies find that their pension
scheme is less of a burden.
We hope that you find our analysis of
recent accounts useful and that, as we
go through 2014 and towards a general
election next year, things continue to
look up for the pensions industry as a
whole.
Fore
wo
rd
Welcome to our 21st annual survey of FTSE 100 companies’ pension disclosures.
Bob Scott
6
Contentp6 1. Main findingsp8 1.1 Deficits persist
p8 1.2 Major longevity swap and
buy-in transactions
p8 1.3 Companies continue to seek
alternatives to straight cash
funding
p8 1.4 The 2014 Budget – a
retirement revolution
p9 1.5 Collective defined
contribution schemes?
p9 1.6 More companies move to DC
schemes
p10 1.7 Pension contributions down,
despite auto-enrolment
p10 1.8 After a pause, the flight from
equities continues
p11 1.9 Further challenges and
opportunities lie ahead
Mai
n fi
ndin
gs
FTSE 100 pension contributions fell by £1.7bn in 2013 as a growing number of companies made use of alternative funding methods. 38 companies disclosed such arrangements in their 2013 accounts.
Bob Scott
Partner LCP
0
5
10
15
20
25
2007 2008 2009 2010 2011 2012 2013
£ b
illio
n
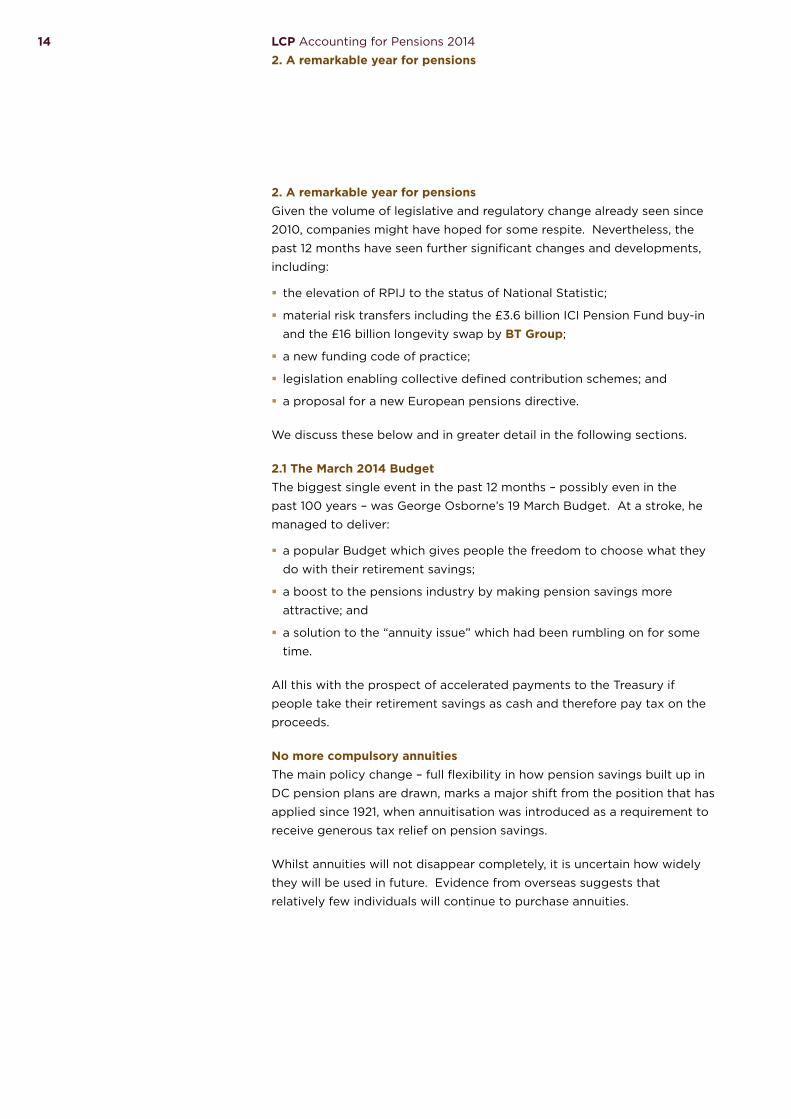
Employer contributions to pension schemes
Deficit contributions (DB schemes)
Employer service cost (DB schemes)
Employer DC costs
LCP Accounting for Pensions 2014
1. Main findings8
1.1 Deficits persist � We estimate that at the end of June 2014 the total UK IAS19 pension
deficit for FTSE 100 companies was £37 billion, compared to £43 billion
a year earlier.
� This reflects total assets of £475 billion, which represent about 93% of
liabilities valued at £512 billion.
1.2 Major longevity swap and buy-in transactions � Several companies have hedged some or all of their pension risk through
insurance contracts during the last year. For example, InterContinental Hotels Group insured all of its pension liabilities in July 2013 and the
ground breaking £3.6 billion ICI Pension Fund buy-in transaction has
demonstrated the market's capacity to undertake much larger buy-in
transactions than we have seen in the past.
� In March 2014 Aviva entered into a (then) record-breaking swap that
hedges longevity risk for around £5 billion of pension liabilities. In
July 2014 this was surpassed by BT Group announcing that it has
removed 25% of its longevity risk by setting up its own insurance
company and reinsuring the risk for liabilities valued at £16 billion.
1.3 Companies continue to seek alternatives to straight cash funding � Around 1 in 5 of the FTSE 100 companies that sponsor DB pension
schemes, including Capita and Johnson Matthey, have now disclosed
having put in place an asset backed contribution arrangement to fund
their pension scheme.
� These arrangements can provide additional security to the pension
scheme whilst avoiding the risk of a trapped surplus for the employer.
� Other companies have provided security in different ways. For example,
International Airlines Group has provided its pension schemes with
security over aircraft and Whitbread has provided security over
property.
1.4 The 2014 Budget – a retirement revolution � On 19 March 2014 George Osborne introduced major changes to the UK
pension system that have been hailed as the biggest reforms in nearly a
century.
� The main policy change – full flexibility in how pension savings built up
in DC pension plans are drawn – marks a major shift from the position
that has applied since 1921, when annuitisation was introduced as a
requirement to receive generous tax relief on pension savings.
� Already there is evidence that this has encouraged greater pensions
saving as individuals no longer perceive a pension plan as inflexible and
poor value.
20%The proportion of FTSE
100 companies with an
asset backed contribution
arrangement in place.
9LCP Accounting for Pensions 2014
1. Main findings
� The change is also likely to impact DB schemes as we expect to see an
increase in the number of retiring members transferring their benefits to
a DC scheme in order to take advantage of the new flexibilities.
� This will potentially reduce company pension liabilities and, over time,
may increase the number of schemes that can be bought out with an
insurance company.
� Several commentators have expressed concern that individuals will not
be able to manage their finances under the new regime. Some have
suggested that people will underestimate how long they will live and so
are likely to run out of money. Others have pointed to the high cost of
care in old age.
� To address this, the government has committed to providing free
guidance for all DC pension scheme members at the point of retirement.
� Determining exactly how this will work is one of the biggest challenges
the coalition faces before the election next year.
1.5 Collective defined contribution schemes? � A further change to the UK pension system announced in the Queen’s
speech on 4 June was that employers will be able to establish collective
pension schemes where investment (and other) risks are pooled across
the membership.
� Similar schemes have operated successfully in the Netherlands and
Denmark.
� With many UK companies having recently undertaken auto-enrolment
exercises, we are unlikely to see widespread adoption of such schemes
in the UK in the foreseeable future.
� However, this legislation does signify the government’s recognition that
collective schemes have a role to play in pension provision. Perhaps,
over time, we will see a reversal of the trend which, for many years, has
been away from collective provision.
1.6 More companies move to DC schemes � Nevertheless, for now, the trend is still away from collective schemes and
towards DC arrangements where there is no pooling of risks.
� During 2013 GKN closed its “hybrid” pension scheme – which offers a
combination of DB and DC benefits – to new recruits. This leaves only
four FTSE 100 companies providing any form of DB pension provision to
new employees.
� In addition, four more companies, BG Group, InterContinental Hotels Group, Sainsbury’s and Wolseley closed their DB pension schemes to
future benefit accrual. A further three companies, including HSBC and
Severn Trent, have reached agreement to do the same in the near future.
4FTSE 100 companies
providing any form of DB
pension provision to new
employees.
Mai
n fi
ndin
gs
LCP Accounting for Pensions 2014
1. Main findings10
� However, all large employers are now required to automatically enrol
employees into a work-based pension scheme. Whilst membership of
DB schemes has been declining, membership of DC pension schemes
has been increasing rapidly.
� Scottish & Southern Energy reports an employee participation rate in
its DC scheme of over 90% and Travis Perkins has said that only 2% of
employees have opted out of its pension arrangements.
� As a result, significantly greater numbers of employees are now
members of workplace pension schemes. The next challenge will be to
find ways of encouraging (or compelling) employers and employees to
pay contributions at a level sufficient to provide members with decent
outcomes in retirement.
1.7 Pension contributions down, despite auto-enrolment � This year has seen total pension contributions paid by FTSE 100
employers fall from £21.9 billion in 2012 to £20.2 billion in 2013.
� The decrease is largely due to a significant reduction in deficit
contributions for a small number of companies, such as BT Group, BAE Systems and Barclays that made very large contributions in previous
years.
� However, it also reflects the lower value of benefits currently being
provided to employees through DC schemes than were previously
provided in DB schemes.
1.8 After a pause, the flight from equities continues � Last year we saw an overall increase in the proportion of pension scheme
assets invested in equities. However, the long-term trend of switching
into assets that more closely match pension liabilities has been seen
again this year with a modest reduction in the overall equity allocation.
� A few companies made more significant changes to their pension
scheme investments during 2013 – for example, BG Group moved 23%
of its pension scheme assets from equities to bonds. Going against the
general trend, G4S increased its pension scheme’s allocation to equities
from 15% to 26%.
� Many companies, such as Bunzl and Rexam, have disclosed that they
have pre-agreed “triggers” in place with their pension schemes, with
assets automatically being switched from equities to bonds as the
funding level increases. We can therefore expect to see a continued
movement out of equities and into bonds in future years, as and when
funding positions improve.
£20.2bnof company pension
contributions in 2013, down
from £21.9 bn in 2012.
11LCP Accounting for Pensions 2014
1. Main findings
1.9 Further challenges and opportunities lie ahead Inflation measures � In November 2013 a new measure of inflation, RPIJ – which is
systematically lower than conventional RPI inflation – was granted the
status of "National Statistic".
� This increases the opportunity for companies to consider which measure
of inflation should be used in their pension schemes – and the potential
savings from making a change.
Scottish independence � Scottish independence could cause a pensions headache for some
companies.
� A "yes" vote on 18 September could result in pension schemes
operating "cross border" and being subject to more stringent funding
requirements.
� In addition, the attractiveness of Scottish Limited Partnerships, used for
most asset backed contribution arrangements, could reduce.
Pension taxation � Should we have a new government following next year’s general election
we could see further changes to pension scheme taxation.
� We wait to see what the various parties put in their manifestos but, over
recent months:
– Spokesmen for the Labour party have proposed that tax relief on
pension contributions should be limited to 20% and that the Annual
Allowance should be reduced from £40,000 to the level of national
average earnings (about £26,000).
– The Liberal Democrats have proposed that the Lifetime Allowance
– the maximum value of pension savings that can be made without
incurring additional tax charges – should be reduced from £1.25 million
to £1 million.
– Separately Steve Webb has indicated that he would like to see a
uniform level of pension tax relief – perhaps 30%.
Legislative changes � The ability to contract out of the state pension system comes to an end
in 2016. This will result in higher national insurance contributions for the
majority of employers that continue to provide a DB pension scheme
to their employees. This may result in further levelling down of pension
provision and more closures of schemes to future accrual.
� With a new European pension directive in the pipeline, UK schemes
could be subject to much more onerous governance and reporting
requirements in coming years.
2016The ability to contract out
of the state pension system
comes to an end.
Mai
n fi
ndin
gs
12
Contentp12 2. A remarkable year for pensionsp14 2.1 The March 2014 Budget
p17 2.2 The defined ambition project
No caps. No drawdown limits. Let me be clear: no one will have to buy an annuity.
George Osborne
19 March 2014
A r
emar
kab
le y
ear
for
pen
sio
ns
LCP Accounting for Pensions 2014
2. A remarkable year for pensions14
2. A remarkable year for pensionsGiven the volume of legislative and regulatory change already seen since
2010, companies might have hoped for some respite. Nevertheless, the
past 12 months have seen further significant changes and developments,
including:
� the elevation of RPIJ to the status of National Statistic;
� material risk transfers including the £3.6 billion ICI Pension Fund buy-in
and the £16 billion longevity swap by BT Group;
� a new funding code of practice;
� legislation enabling collective defined contribution schemes; and
� a proposal for a new European pensions directive.
We discuss these below and in greater detail in the following sections.
2.1 The March 2014 BudgetThe biggest single event in the past 12 months – possibly even in the
past 100 years – was George Osborne’s 19 March Budget. At a stroke, he
managed to deliver:
� a popular Budget which gives people the freedom to choose what they
do with their retirement savings;
� a boost to the pensions industry by making pension savings more
attractive; and
� a solution to the “annuity issue” which had been rumbling on for some
time.
All this with the prospect of accelerated payments to the Treasury if
people take their retirement savings as cash and therefore pay tax on the
proceeds.
No more compulsory annuitiesThe main policy change – full flexibility in how pension savings built up in
DC pension plans are drawn, marks a major shift from the position that has
applied since 1921, when annuitisation was introduced as a requirement to
receive generous tax relief on pension savings.
Whilst annuities will not disappear completely, it is uncertain how widely
they will be used in future. Evidence from overseas suggests that
relatively few individuals will continue to purchase annuities.
15LCP Accounting for Pensions 2014
2. A remarkable year for pensions
The requirement to purchase an annuity was at odds with many other
developed countries – such as the US and Australia – where individuals are
able to take their pension pot in full as cash. As a result the UK had the
largest annuity market in the world, with some statistics indicating that
over half of worldwide annuities are purchased here.
Insurers who saw their captive market shrinking materially overnight were
therefore hit particularly hard by the Budget announcements.
Variable retirement incomeThe Budget changes could, therefore, mark a turning point in how later
life is viewed. The concept of a single point of retirement, with a steady
income thereafter, may well become outdated.
Instead, we may see individuals making a gradual transition into full
retirement, whereby they steadily decrease the number of hours worked,
and use their pension pot to top up their income. In the middle years of
retirement, the individual’s income needs may well fall before rising again
due to care costs in old age.
Accessing pension savingsThe government has confirmed that members of DB schemes will be able
to benefit from the new flexibilities – albeit they may have to transfer to a
DC scheme to do so.
This is to be welcomed as restricting transfers from DB schemes – and
so denying DB scheme members the flexibility available to DC members
– would have introduced an unnecessary divide between those in DB
schemes and those in DC schemes.
Impact on DB schemesFor sponsors of DB pension schemes, the Budget changes raise the
possibility that certain members may want, or can be encouraged, to
transfer to a DC scheme. This could result in a significant change in the
profile of the scheme’s liabilities.
Most transfers are likely to take place close to retirement, as there seems
little reason for an individual to take on investment risk prior to retirement
by transferring at a younger age. However, where there is concern about
the ongoing viability of a pension scheme, and there is a risk that it will
end up in the Pension Protection Fund with lower levels of compensation
being provided, we can expect to see increased numbers of transfers at all
ages.
A r
emar
kab
le y
ear
for
pen
sio
ns
LCP Accounting for Pensions 2014
2. A remarkable year for pensions16
The charts below illustrate:
1. The typical profile of benefit payments from a pension scheme prior to
the March Budget announcements; and
2. The possible revised profile of benefit payments if half of the members
take a transfer value at retirement.
0
10
20
30
40
50
60
70
80
90
£ m
illio
n
Active
Deferred
Pensioner
Existing typical DB cashflow “shape”
2015 2030 2045 2060 2075 2090
70
80
90Active
Deferred
Pensioner
0
10
20
30
40
50
60
£ m
illio
n
Possible DB cashflow “shape” following March Budget
2015 2030 2045 2060 2075 2090
If transfers occurred at these levels, companies would need to consider the
impact on their scheme’s investment strategy – for example, in relation to
liquidity requirements – as payments would be accelerated.
It would also have an impact on funding strategy as, under current
legislation, the payment of a transfer value generally improves a scheme’s
funding position.
17LCP Accounting for Pensions 2014
2. A remarkable year for pensions
The guidance guaranteeSome commentators have expressed concern that individuals may run out
of income in old age – either because they spend their whole pension pot
as soon as possible, or because they underestimate how long they will live
and how much money they will need in later life.
To address these concerns, George Osborne announced that everyone
who retires with a DC pension will be offered “free, impartial, face-to-face
advice”. This has since been relabelled as “guidance” and the government
has stated it may not be “face-to-face”, but nonetheless it will be no
simple task to provide guidance to as many as 400,000 people each year.
Putting everything in place before April 2015 – when the changes come
fully into force – is one of the biggest challenges the coalition faces before
the election next year.
2.2 The defined ambition projectLegislation to enable collective DC schemes – and other defined ambition
pensions – is currently contained within the Pension Schemes Bill before
Parliament. However, many people feel that the government has missed
the opportunity to make defined ambition schemes a reality.
One option already available to companies that want to provide retirement
benefits with more risk sharing than DC schemes is to set up a “cash
balance” pension scheme.
Under this type of scheme employees accrue a cash pot at retirement,
based on the level of their salary and length of employment. Pre-
retirement investment risk is therefore retained by the employer, with the
employee taking on all post retirement risk.
Prior to the Budget announcements the main downside of a cash balance
scheme was the employees’ risk that annuities would be particularly
expensive at the point of retirement. However, with the new flexibilities
meaning that pension pots can be taken as cash this is now much less of
an issue. Johnson Matthey, Morrisons and Diageo all currently have cash
balance schemes which are open to new employees.
A r
emar
kab
le y
ear
for
pen
sio
ns
It's been a remarkable year for pensions.
21 July 2014Announcement that transfer values from private sector
DB schemes to DC schemes can continue to proceed
4 July 2014BT Group announces that it has removed £16 billion of
longevity risk
10 June 2014The Pensions Regulator issues a new code of practice
on scheme funding
4 June 2014Announcement in Queen’s speech that the government
will legislate for collective defined contribution pensions
29 May 2014PPF issues consultation on the next triennium of levies
– running from 2015/16 to 2017/18
4 April 2014High Court rules against IBM in scheme closure case
27 March 2014Proposal for new European pension directive published
26 March 2014The ICI Pension Fund announces that it has insured
£3.6 billion of liabilities with Legal & General and Prudential
19 March 2014March 2014 Budget
6 March 2014Aviva enters into a £5 billion longevity swap
21 November 2013The Pensions Regulator issues a new code of practice
relating to the governance of occupational DC pensions
21 November 2013RPIJ and CPIH inflation indices are designated
“National Statistics”
19 November 2013The Pensions Regulator issues guidance on asset
backed contributions
2014
2013
Amid concerns that too much value is being placed on asset backed
contributions, the Regulator sets out the standards it expects of
pension trustees when entering into these arrangements
The Regulator continues to increase its focus on DC
issues, given the large number of individuals now being
auto-enrolled into these schemes
Fundamental changes to the UK pensions landscape are announced by George Osborne
Whilst more stringent funding requirements are off the table for
the time being, this could introduce significant new governance
and disclosure requirements for UK pension schemes
Some schemes will see a significant increase in the level
of their PPF levies following the change in insolvency risk
provider from Dun & Bradstreet to Experian
A more employer friendly version of the code reflecting
the Regulator’s new statutory objective to “minimise any
adverse impact on the sustainable growth of an employer”
The elevation in status of these inflation indices increases
the potential for companies to consider changes to the
level of indexation in their pension schemes
Brokered directly with the reinsurance market,
this marks a major increase in the size of longevity
swaps taken out by pension schemes
This represents a significant increase in the size of
transaction undertaken in the buy-in/buy-out market
IBM is held to have breached its duty of good faith
to its employees when closing its pension schemes to
future accrual in 2011
With discontent over this type of pension scheme in
the Netherlands, and new flexibilities for existing DC
schemes, questions remain over the level of take up
Another massive increase in the amount of
longevity risk removed by a pension scheme, with
a new insurance company set up in order to have
direct access to reinsurance markets
18
The most significant change to UK pensions in almost a century.
Bob Scott
Partner LCP
19
A r
emar
kab
le y
ear
for
pen
sio
ns
20
Contentp20 3. Summary of main findingsp22 3.1 Introduction
p22 3.2 FTSE 100 pension liabilities
exceed half a trillion pounds
p23 3.3 Pension scheme funding
p25 3.4 More reductions in DB pension
provision
p27 3.5 De-risking
p30 3.6 Challenges and opportunities
on the horizon
As scheme closures continue, only 4 FTSE 100 companies disclosed any form of DB pension for new employees.
Bob Scott
Partner LCP
Sum
mar
y o
f m
ain
find
ing
s
Type of pension benefit provided for existing employees of FTSE 100 companies
No UK DB scheme
DB scheme closed to accrual
DB scheme - final salary, with cap on salary increases
DB scheme - final salary, no cap on salary increases
DB scheme - non final salary
14
23
11
38
14
LCP Accounting for Pensions 2014
3. Summary of main findings22
3. Summary of main findings
3.1 IntroductionThe following sections provide an insight into the disclosure of pension
scheme costs in companies’ 2013 accounts, comparing the different
practices adopted by the largest UK companies and highlighting the
financial implications.
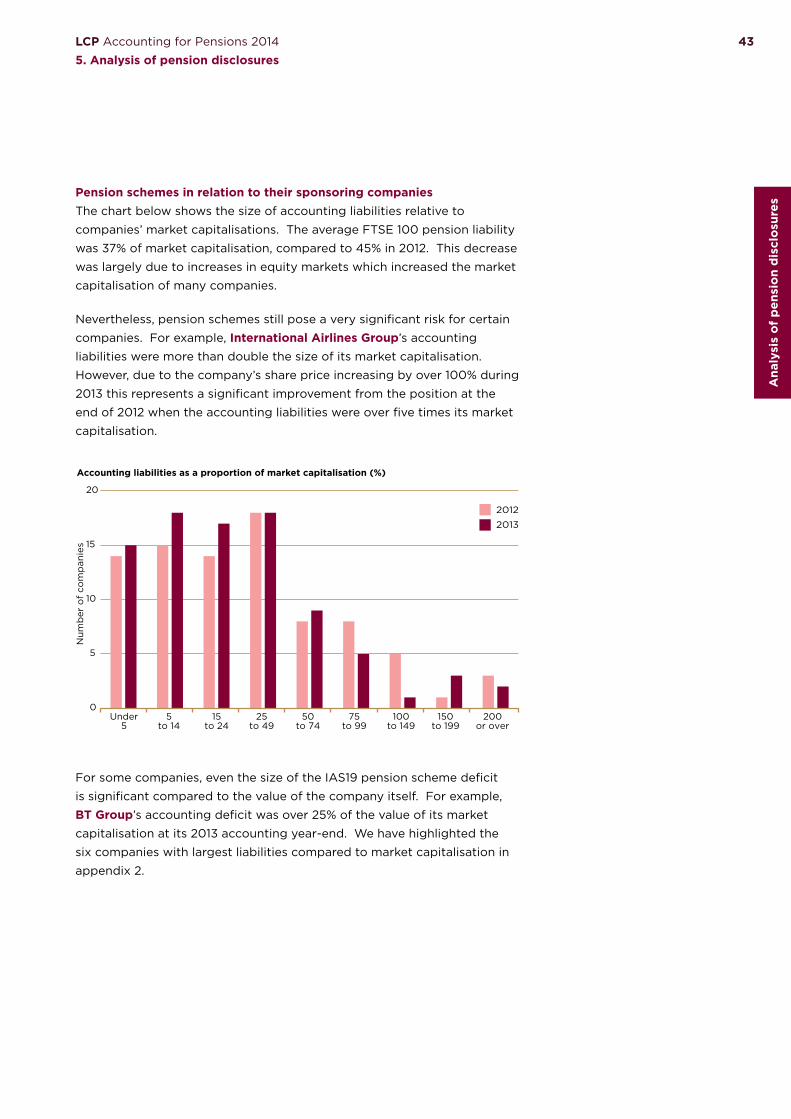
By analysing their pension disclosures we aim to measure the exposure
that companies have to their pension liabilities and deficits, particularly in
the context of their market capitalisations, and we identify the steps that
companies are taking to address their pensions issues.
FTSE 100 companies scrutinisedAll of the companies analysed have reported under international
accounting standards (IAS19 for pension costs) as required under EU
regulations.
The information and conclusions of this report are based solely on detailed
analysis of the information that companies have disclosed in their annual
report and accounts and other publicly available information. We do
not approach companies or their advisers for additional information or
explanation.
Of the companies in the FTSE 100 at the end of 2013, 89 sponsored at
least one material DB scheme, either in the UK or overseas. The remaining
11 companies provide DC pensions and have no legacy DB scheme on their
balance sheet.
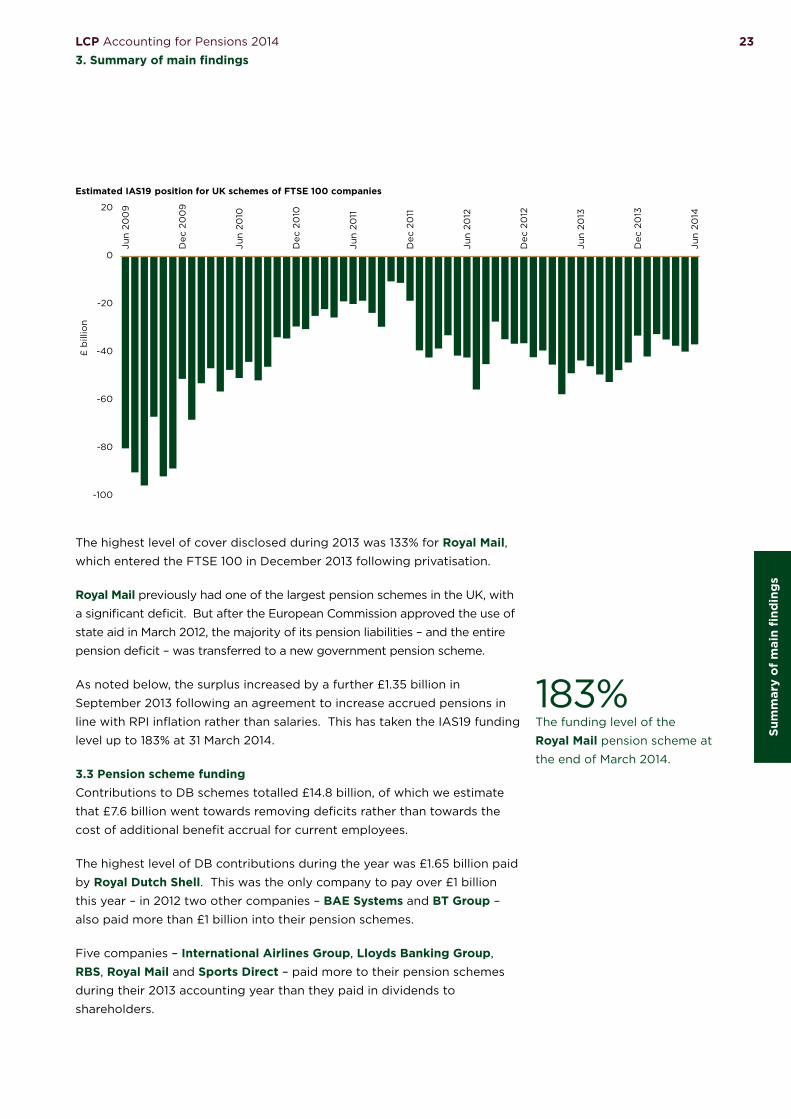
3.2 FTSE 100 pension liabilities exceed half a trillion poundsWe estimate that the combined FTSE 100 pension deficit in respect of UK
liabilities was £37 billion at the end of June 2014, reflecting total IAS19
liabilities of £512 billion against assets of £475 billion.
Strong investment returns over the year to June 2014 – particularly on
equities – have increased asset values, although this has been largely
offset by an increase in IAS19 liabilities resulting from a fall in corporate
bond yields.
The chart on the following page shows how the accounting deficit has
developed over the past five years. Our figures include unfunded pension
promises but exclude, where possible, the overseas pension schemes
sponsored by FTSE 100 companies and any employee benefits other than
pensions.
£37bnThe combined accounting
deficit for FTSE 100
companies at the end of
June 2014.
23LCP Accounting for Pensions 2014
3. Summary of main findings
Estimated IAS19 position for UK schemes of FTSE 100 companies
-100
-80
-60
-40
-20
0
20
Jun
200
9
Dec
20
09
Jun
2010
Dec
20
10
Jun
2011
Dec
20
11
Jun
2012
Dec
20
12
Jun
2013
Dec
20
13
Jun
2014
£ b
illio
n
The highest level of cover disclosed during 2013 was 133% for Royal Mail, which entered the FTSE 100 in December 2013 following privatisation.
Royal Mail previously had one of the largest pension schemes in the UK, with
a significant deficit. But after the European Commission approved the use of
state aid in March 2012, the majority of its pension liabilities – and the entire
pension deficit – was transferred to a new government pension scheme.
As noted below, the surplus increased by a further £1.35 billion in
September 2013 following an agreement to increase accrued pensions in
line with RPI inflation rather than salaries. This has taken the IAS19 funding
level up to 183% at 31 March 2014.
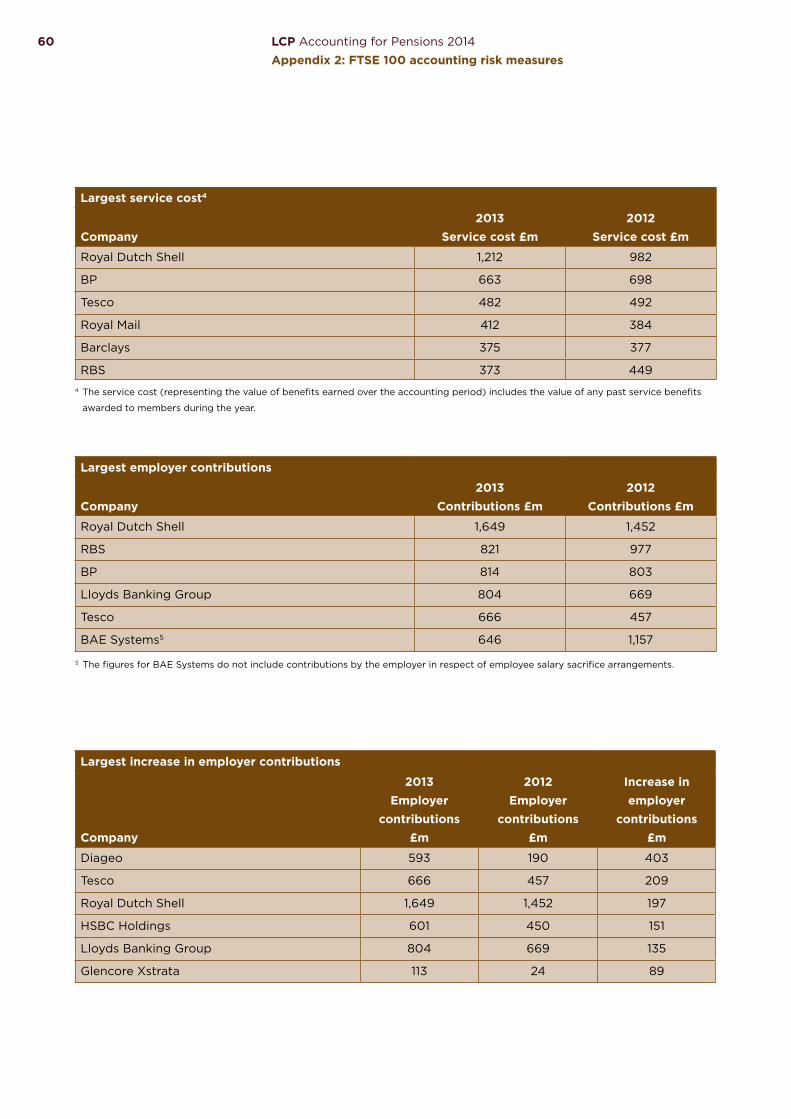
3.3 Pension scheme fundingContributions to DB schemes totalled £14.8 billion, of which we estimate
that £7.6 billion went towards removing deficits rather than towards the
cost of additional benefit accrual for current employees.
The highest level of DB contributions during the year was £1.65 billion paid
by Royal Dutch Shell. This was the only company to pay over £1 billion
this year – in 2012 two other companies – BAE Systems and BT Group –
also paid more than £1 billion into their pension schemes.
Five companies – International Airlines Group, Lloyds Banking Group,
RBS, Royal Mail and Sports Direct – paid more to their pension schemes
during their 2013 accounting year than they paid in dividends to
shareholders.
Sum
mar
y o
f m
ain
find
ing
s
183%The funding level of the
Royal Mail pension scheme at
the end of March 2014.
LCP Accounting for Pensions 2014
3. Summary of main findings24
The chart below shows how company payments into pension schemes
have changed since 2007.
0
5
10
15
20
25
2007 2008 2009 2010 2011 2012 2013
£ b
illio
n
Employer contributions to pension schemes
Deficit contributions (DB schemes)
Employer service cost (DB schemes)
Employer DC costs
This year the total pension contributions paid by FTSE 100 companies
reduced from £21.9 billion to £20.2 billion.
In particular, contributions to DB schemes have reduced from £16.8 billion
in 2012 to £14.8 billion in 2013. This largely reflects a significant reduction
in deficit contributions for a small number of companies, such as
BT Group, BAE Systems and Barclays that made very large contributions
in the previous year.
Payments to DC pension schemes are likely to increase further in coming
years as companies continue to close their DB schemes and the minimum
required contributions under the auto-enrolment regime are increased
over the period to 2018.
Non-cash fundingIncreased use of alternate funding methods and security arrangements
may be one reason for the decrease in cash contributions to DB pension
schemes. These can take various forms, including:
� Asset backed contribution arrangements. Usually the company transfers
assets to a Scottish Limited Partnership which then provides income to
the scheme and recourse to the underlying assets in certain pre-defined
circumstances.
� A charge over specific company assets.
� A pledge of additional funding in certain circumstances (for example,
following a disposal or when profits exceed a certain level).
� A parent company or intra-group guarantee.
25LCP Accounting for Pensions 2014
3. Summary of main findings
� Payment of contributions to an escrow account under which funds pass
to the scheme in certain pre-defined circumstances.
We have set out a summary of those companies who reported some form
of contingent funding arrangement in appendix 3.
The Pensions Regulator’s viewsGiven the increased use of asset backed contributions, the Pensions
Regulator felt it necessary to issue guidance on these arrangements
in November 2013. Whilst the Regulator has not approved the use of
asset backed contribution arrangements, it recognises that this sort
of innovative funding arrangement can be beneficial to both pension
schemes and employers.
However, the Regulator has expressed concern over the risk that these
arrangements could be found to be in breach of employer related
investment limits and has said that a backup funding plan should be put
in place in case the arrangement subsequently has to be unwound. This,
combined with the PPF’s proposal that only asset backed contributions
secured on UK property will be allowable for PPF levy purposes, could
reduce the attractiveness of certain arrangements to FTSE 100 companies.
3.4 More reductions in DB pension provisionThere are currently no FTSE 100 companies that provide traditional final
salary pensions to new employees. GKN provided a “hybrid” pension
scheme – offering a combination of DB and DC benefits – to new entrants
but closed this to new entrants during 2013.
This leaves only 4 FTSE 100 companies disclosing any form of DB pension
provision to new employees – Diageo, Johnson Matthey and Morrisons,
which provide cash balance schemes, and Tesco, which provides a career
average revalued earnings (CARE) scheme.
Several companies took one step further and closed their scheme to all
future accrual during 2013:
� BG Group closed to accrual on 31 December 2013 and as a result
disclosed a $154 million gain in its 2013 accounts.
� InterContinental Hotels Group closed its scheme from 1 July 2013.
� Sainsbury’s closed its scheme to future accrual in September 2013,
resulting in a gain of £172 million.
� Wolseley closed its UK pension scheme to accrual at the end of 2013.
In addition, HSBC, Severn Trent and Weir Group have all reached
agreement to close their pension schemes to future accrual in 2015.
Sum
mar
y o
f m
ain
find
ing
s
LCP Accounting for Pensions 2014
3. Summary of main findings26
At the same time, companies are making changes that reduce the
employer cost of their remaining DB pensions:
� Lloyds Banking Group previously limited increases in pensionable pay
to 2% per annum in 2010, but has now decided to freeze increases to
pensionable pay completely from April 2014. It has been reported that
this will result in a gain of £1 billion being disclosed in its December 2014
accounts.
� Johnson Matthey has increased employee contributions for those who
remain in its CARE scheme.
� National Grid has capped increases in pensionable salary to the lower of
RPI inflation and 3% per annum.
� Royal Mail reached agreement to increase accrued pensions in line with
RPI inflation (up to a maximum 5%) rather than in line with salaries.
This resulted in a £1.35 billion gain, taking the IAS19 funding level of its
pension scheme up to 183% at 31 March 2014.
The chart below shows the numbers of companies providing any
continuing DB pension provision after allowing for the changes listed
above.
Type of pension benefit provided for existing employees of FTSE 100 companies
No UK DB scheme
DB scheme closed to accrual
DB scheme - final salary, with cap on salary increases
DB scheme - final salary, no cap on salary increases
DB scheme - non final salary
14
23
11
38
14
With auto enrolment requirements now applying for all large companies,
membership of DC schemes is on the increase. Sainsbury’s disclosed
that it has auto-enrolled 57,000 employees into its DC scheme with an
opt-out rate of only 6%. Similarly, Scottish & Southern Energy reported
a participation rate in its pension scheme of over 90% and Travis Perkins
had only a 2% opt-out rate following the auto-enrolment of 9,200
employees into its pension scheme.
27LCP Accounting for Pensions 2014
3. Summary of main findings
Nevertheless, enrolling individuals in a pension scheme is only the first
stage. Even once all companies have completed auto-enrolment, the
minimum required level of contributions (8% of relevant earnings) is not
sufficient to provide a decent outcome in retirement. The next challenge
will be to find ways of encouraging (or compelling) employers and
employees to pay contributions at a level sufficient to provide members
with meaningful levels of retirement income.
Auto-escalation of employee contributions – which has worked well in the
United States – might be one way of addressing this. This would involve
automatically increasing an employee’s rate of pension contribution
whenever a salary increase is granted.
Although the employee would be able to opt out of paying the increased
level of contributions, inertia is likely to mean that many will continue
paying the higher rate, particularly as the increase in salary would avoid
any fall in take home pay.
3.5 De-riskingAs pension schemes mature and the time horizon for payment of benefits
decreases, companies and pension scheme trustees have typically looked
to reduce the risks posed by the pension scheme.
Last year we saw an overall increase in the allocation of assets to equities.
This year, the general trend has been restored with a modest movement
of assets out of equities and into bonds and other asset classes. This is in
the context of a period when equities significantly outperformed bonds,
and so if no rebalancing had been undertaken, the equity allocation would
have increased by around 4%.
December 2013 December 2012
Equities33.2%
Bonds43.3%
Other 23.5% Equities
34.5%
Bonds42.5%
Other23.0%
Su
mm
ary
of
mai
n fi
ndin
gs
33%The overall proportion of
pension scheme assets
invested in equities.
LCP Accounting for Pensions 2014
3. Summary of main findings28
Some companies made significant changes to their schemes’ investment
strategies during 2013 – for example, BG Group moved 23% of its pension
scheme assets from equities to bonds and Babcock undertook a hedging
programme which resulted in a 17% reduction in its schemes’ allocation to
equities.
However, not all pension schemes reduced their exposure to equities
during the year. G4S states that the asset strategy for its UK pension
schemes is managed dynamically rather than against a fixed asset
allocation. During 2013 the proportion of assets held in bonds in its
UK pension schemes decreased from 22% to 4%, with the allocation to
equities increasing from 15% to 26%.
As part of the new disclosure rules under the revised version of the
international accounting standard IAS19, companies are required to
provide increased detail on their pension schemes’ investment strategies.
Several companies, such as Bunzl, GlencoreXstrata, Meggitt and Rexam,
have disclosed that pre-agreed investment triggers have been put in place,
under which assets will be switched from equities to bonds when the
scheme’s funding level improves.
This type of mechanism potentially enables schemes to de-risk without
any additional contributions being required from the sponsoring employer.
Given the relatively wide-spread use of such triggers we can expect to see
further moves out of equities in future years as and when equity markets
rise and funding levels improve.
Many companies have also looked to remove other risks within their
pension schemes. Longevity risk – the risk that pension scheme members
live longer than expected (and therefore the cost of providing their
pension is higher than expected) – can be removed by entering into a
“longevity swap” or buy-in with an insurance company. Under a longevity
swap the counterparty would make payments to the pension scheme if
individuals live longer than anticipated. An increasing number of FTSE 100
companies have taken out this type of contract:
� AstraZeneca reports that its pension scheme entered into a longevity
swap during 2013 to hedge against the longevity risk in respect of around
10,000 pensioners, which covers $3.8 billion of the scheme’s liabilities.
� In March 2014 one of Aviva’s pension schemes entered into a longevity
swap covering approximately £5 billion of pensioner liabilities.
� BAE Systems reports that one of its main pension schemes entered
into an arrangement to insure longevity risk for its current pensioner
population, covering £2.7 billion of pension scheme liabilities. This
was followed in December 2013 with similar contracts for two of the
company’s other pension schemes, covering £0.9 billion and £0.8 billion
of pension scheme liabilities in each case.
8FTSE 100 companies that
have now entered into a
longevity swap.
29LCP Accounting for Pensions 2014
3. Summary of main findings
Babcock, International Airlines Group, ITV and Rolls-Royce have all
previously disclosed entering into longevity swaps. In July 2014 BT Group announced that it has removed the longevity risk applying for £16 billion
of pension liabilities by setting up its own insurance company and then
reinsuring the risk.
We have also seen a number of companies purchasing “buy-in” contracts,
under which the risks relating to a section of their pension scheme
liabilities – including longevity risk – are hedged by an insurance company:
� GKN disclosed that a £123 million buy-in was completed in early 2014.
� Following the closure of its pension scheme to future accrual in July
2013, InterContinental Hotels Group completed a buy-in transaction in
August which covers all of its pension scheme liabilities.
� Resolution reports that it has purchased an additional tranche of buy-in
contracts covering benefits for pensions in payment up to 30 June 2013.
� Smith & Nephew purchased an insurance contract to cover a subset of
the pensioner liabilities in its UK pension scheme.
� In September 2013 Smiths Group invested around £160 million in
annuities to match specific liabilities of one of its UK pension schemes.
� Tate & Lyle reports that in December 2012 the trustee of its main UK
pension scheme agreed a £347 million partial pensioner buy-in, covering
approximately 43% of the scheme’s pensioner liabilities. In its 2014
accounts, it discloses that one of its smaller pension schemes agreed a
buy-in for £82 million in September 2013, covering all of its liabilities.
The chart below shows how pensioner buy-in pricing has changed in recent
years compared to the cost of holding gilts to meet pension liabilities.
December 2007
June 2008
December 2008
June 2009
December 2009
June 2010
December 2010
June 2011
December 2011
June 2012
December 2012
June 2013
December 2013
Pre-bankingcrisis
Bankingcrisis Early quantitative easing Return to economic growthEurozone uncertainties
Val
ue o
f g
ilts
rela
tive
to
buy
-in
pri
ce
Buy-inpricing lessfavourablethan gilt
valuations
Buy-in pricing morefavourablethan gilt
valuations
Source: LCP analysis of the relative value of gilts against pensioner buy-in prices based on middle-of-the-road longevity assumptions for a UK pension plan. Buy-in pricing depends on a range of factors such as transaction size, benefit structure, membership profile and insurer appetite.
-10%
-8%
-6%
-4%
-2%
0%
2%
4%
6%
8%
How buy-in pricing has changed in recent years compared to the cost of holding gilts
Sum
mar
y o
f m
ain
find
ing
s
LCP Accounting for Pensions 2014
3. Summary of main findings30
Pensioner buy-in pricing remains relatively attractive at the current time
– allowing longevity risk to be transferred at little or no cost compared to
holding gilts – and this is reflected in the number and size of transactions
seen in the last year.
A growing pool of global reinsurers has significantly increased capacity for
buy-ins and longevity swaps in recent years. The UK is seen as the leading
market for longevity risk transfers and that has attracted a number of
overseas participants.
In addition, with UK-based insurers looking to make up for the decline
in individual annuity sales following the March Budget announcements,
additional competitiveness is likely to keep pricing keen for longevity risk
transfers in coming months.
3.6 Challenges and opportunities on the horizonLooking forward there are plenty of challenges – and also opportunities –
for companies sponsoring DB pension schemes.
A new inflation measure – RPIJThree years ago many companies looked at whether CPI inflation – which
had replaced RPI as the measure of inflation applying for statutory
increases to pensions – should apply for increases granted in their pension
scheme.
With RPIJ being granted the status of "National Statistic" by the UK
Statistics Authority in November 2013, we understand that a number of
companies are again looking at the measure of inflation their pension
schemes use.
Due to the way the indices are constructed, increases in RPIJ are expected
to be consistently lower than increases in RPI – with an average expected
difference in the region of 0.7% pa. Therefore, to the extent that schemes
can switch to RPIJ, employers would benefit from an immediate reduction
in pension cost – albeit at the expense of pension scheme members who
would be left with lower expected future pensions.
If all of the FTSE 100 companies that still use RPI inflation in their pension
schemes were to move to using RPIJ, then we estimate that the combined
pension deficit could fall by up to £20 billion.
Scottish independence?On 18 September Scottish residents will vote on whether Scotland should
separate from the rest of the UK and become an independent country.
£20bnThe potential impact of
adopting RPIJ inflation.
31LCP Accounting for Pensions 2014
3. Summary of main findings
If the referendum produces a "yes" result then there will be many
transitional issues that need to be addressed, including those relating to
pensions.
At present a pension scheme that operates across more than one EU state
has to register as “cross-border” and is subject to much more stringent
funding requirements than apply for schemes operating solely within the
UK. In particular, cross-border schemes must carry out annual actuarial
valuations and there is a requirement to be fully funded at all times.
This extra burden means that there are currently very few cross-border
schemes within the EU, with the majority operating between the UK and
Ireland. However, if Scottish independence goes ahead, and Scotland
becomes a new member of the EU, then the number of cross-border
schemes can be expected to increase dramatically, with many of those run
by FTSE 100 companies affected.
Scottish independence could also affect the attractiveness of Scottish
Limited Partnerships, which underlie the asset backed contribution
arrangements used by an increasing number of FTSE 100 companies.
PPF leviesThe PPF is currently consulting on the structure of its levies for the three
year period from 2015/16 to 2017/18. One major change is the replacement
of Dun & Bradstreet with Experian as the PPF’s insolvency risk provider.
Differences in the way in which the likelihood of a sponsoring employer’s
insolvency is assessed could result in significant changes to schemes’ PPF
levies. The PPF has suggested that the changes will generally be good
news for manufacturing and finance companies, but bad news for service
and not-for-profit organisations.
For some companies current PPF levies are significant – for example, International Airlines Group disclosed that costs in relation to PPF levies
were €6 million during 2013.
Sum
mar
y o
f m
ain
find
ing
s
LCP Accounting for Pensions 2014
3. Summary of main findings32
Further tax changes?With a general election on the horizon there is the potential for more
changes to the taxation applying on pension savings. The table below
illustrates the changes that have already been made since the current
regime – originally known as “tax simplification” – came into force in 2006.
Date Change
April 2006 New taxation regime comes into force
A new Lifetime Allowance – the maximum amount of total pension
savings that can be made without additional taxation – applies
and is set at £1.5 million. A new Annual Allowance – the maximum
amount of pension savings that can be made in one year without
additional taxation – applies and is set at £215,000
April 2009 Cuts in Annual Allowance and Lifetime Allowance from 2011
announced with immediate anti-forestalling rules impacting anyone
earning over £150,000 pa
December 2009 Anti-forestalling rules extended to anyone earning over £130,000 pa
April 2010 With inflationary increases the Lifetime Allowance reaches a peak of
£1.8 million and the Annual Allowance reaches a peak of £255,000
April 2011 Annual Allowance slashed to £50,000. With a sharp increase in the
number of individuals in DB schemes – including many on moderate
earnings – that face annual tax bills, the government introduces a
facility for pension schemes to pay tax on their members’ behalf in
return for a reduction in scheme pension (known as “scheme pays”).
April 2012 Lifetime Allowance reduced to £1.5 million
April 2014 Lifetime Allowance reduced to £1.25 million and Annual Allowance
reduced to £40,000
Further changes to the pension taxation system may be inevitable
regardless of which party is in power at the end of next year.
In March 2014 Labour announced a policy of limiting tax relief on pension
contributions made by high earners to 20%. This would effectively result
in double taxation of pension contributions, with those earning over
£150,000 being taxed at 25% on earnings paid into a pension scheme,
with the resulting pension then subject to income tax again when this is
drawn in retirement. Labour is also considering removing the existing
right for individuals to take 25% of their pension pot tax free and has
indicated an intention to reduce the Annual Allowance to the level of
National Average Earnings.
33LCP Accounting for Pensions 2014
3. Summary of main findings
The Liberal Democrats have proposed reducing the Lifetime Allowance to
£1 million. Separately, Steve Webb has indicated that he would like to see a
uniform level of pension tax relief set between 20% and 30%.
All of these measures would be complex to introduce and would further
increase the number of individuals subject to additional taxation on their
pension savings. As a result, they may reverse some of the benefits of the
March Budget changes and deter individuals (and their employers) from
providing adequately for their retirement.
The end of contracting outThe ability to contract out of the state pension system finally comes to an
end in 2016. This will result in higher national insurance contributions for
the majority of employers that continue to provide DB pensions to their
employees, as the rebate they currently receive will disappear. The value
of this annual rebate is dependent on earnings but can be worth over
£1,000 per employee.
In order to compensate for this additional cost employers are able to
reduce the level of benefits provided or increase members’ contributions,
but this will introduce administrative complexity. Instead we are likely to
see many employers using the end of contracting out as a reason to close
their pension scheme to future accrual.
More European legislationOn 27 March 2014 the European Commission put forward a new proposed
pension directive. As a result of lobbying from the UK and other affected
EU member states the stringent funding requirements that had previously
been put forward have been removed, and so the new directive focuses
solely on governance and reporting requirements.
The directive is intended to come into force in 2017 and is likely to require
an increase in standards of governance and disclosure, as it brings
pension scheme requirements in these areas more into line with those
applying for insurance companies. Schemes will be required to have a risk
management function, an internal audit function, and will need to provide
prescribed information to all of their members each year.
The costs associated with the new requirements are expected to be
significant and may encourage employers to wind up legacy DB pension
schemes.
Sum
mar
y o
f m
ain
find
ing
s
34
Contentp34 4. Accounting standards p36 4.1 New version of IAS19
p36 4.2 Disclosures overhauled
p37 4.3 Tail wagging the dog?
The new IAS19 accounting standard has increased the level of detail disclosed in relation to investment strategies.
Nick Bunch
Partner LCP
Acc
oun
ting
sta
ndar
ds
LCP Accounting for Pensions 2014
4. Accounting standards36
4. Accounting standards
4.1 New version of IAS19 For the first time in 2013 companies must report their results under a
revised version of the international pensions accounting standard IAS19. In
particular, two changes that we have flagged in previous surveys have now
come into force:
� the option of only recognising gains and losses that fall outside
a “corridor” (which was followed by a small minority of FTSE 100
companies) has been removed; and
� the “expected return on assets” has been abolished, replaced by a net
interest item calculated using the IAS19 discount rate.
4.2 Disclosures overhauledAs we have commented in previous surveys, the information given by
companies on their pension schemes in the past has not always been
commensurate with the pension risks that they run.
For example, lengthy pension disclosure notes have often lacked key
information needed to understand companies’ pension obligations, with
important messages obscured by unnecessary clutter and detail.
The new version of the accounting standard IAS19 is intended to remedy
this by introducing new, principles based, disclosure requirements that ask
companies to identify the key risks and figures that matter.
This year we have seen additional disclosure of items such as the
sensitivity of the pension figures to different assumptions and financial
conditions; and the average term to payment, or “duration”, of the
liabilities.
These are important improvements given that changes in financial
conditions can lead to huge changes in the pensions figures disclosed.
For example, a 0.5% increase in assumed future inflation would increase
FTSE 100 pension liabilities by over £35 billion.
As an example of changes that the new standard has brought,
Reckitt Benckiser did not mention pensions risk at all in its 2012 accounts.
However, it has included several paragraphs in its 2013 accounts as well as
quantifying the impact that changes in financial conditions might have on
its pension deficit.
37LCP Accounting for Pensions 2014
4. Accounting standards
Similarly, in its 2013 accounts AstraZeneca includes details of hedging
strategies put in place by its pension scheme to protect against falls
in equity markets, currency movements, changes in interest rates and
increases in inflation. No mention was made of any such strategies in
previous years’ accounts.
In general, the new accounting standard has increased the level of
detail disclosed in relation to investment strategies. This is a welcome
improvement given the sophisticated strategies that are now in place for
many pension schemes sponsored by FTSE 100 companies.
4.3 Tail wagging the dog?With all the extra words and figures that companies are now required to
provide about their pension arrangements, there is a danger that some will
start to believe that the accounting numbers are “real” and so use them as
the basis for strategic decisions.
This is unwelcome as, in our view, decisions should be based on sound
advice and information rather than on the technical treatment of a
particular transaction under the accounting rules. Basing decisions on
accounting numbers seems to us to be a classic case of the accounting
“tail” wagging the strategic “dog”.
Acc
oun
ting
sta
ndar
ds
38
Contentp38 5. Analysis of pension disclosuresp40 5.1 Introduction
p40 5.2 Analysis of results
p46 5.3 Key assumptions
Ana
lysi
s o
f p
ensi
on
dis
clo
sure
s
21 FTSE 100 companies disclosed a surplus in 2013 compared to just 15 of these companies in 2012.
Nick Bunch
Partner LCP
Ratio of assets to IAS19 liabilities at end of December (%)
December 2012
December 2013
0
5
10
15
20
Under 60 60 to 69 70 to 79 80 to 89 90 to 99 100 to 109 110 or over
Num
ber
of
com
pan
ies
LCP Accounting for Pensions 2014
5. Analysis of pension disclosures40
5. Analysis of pension disclosures
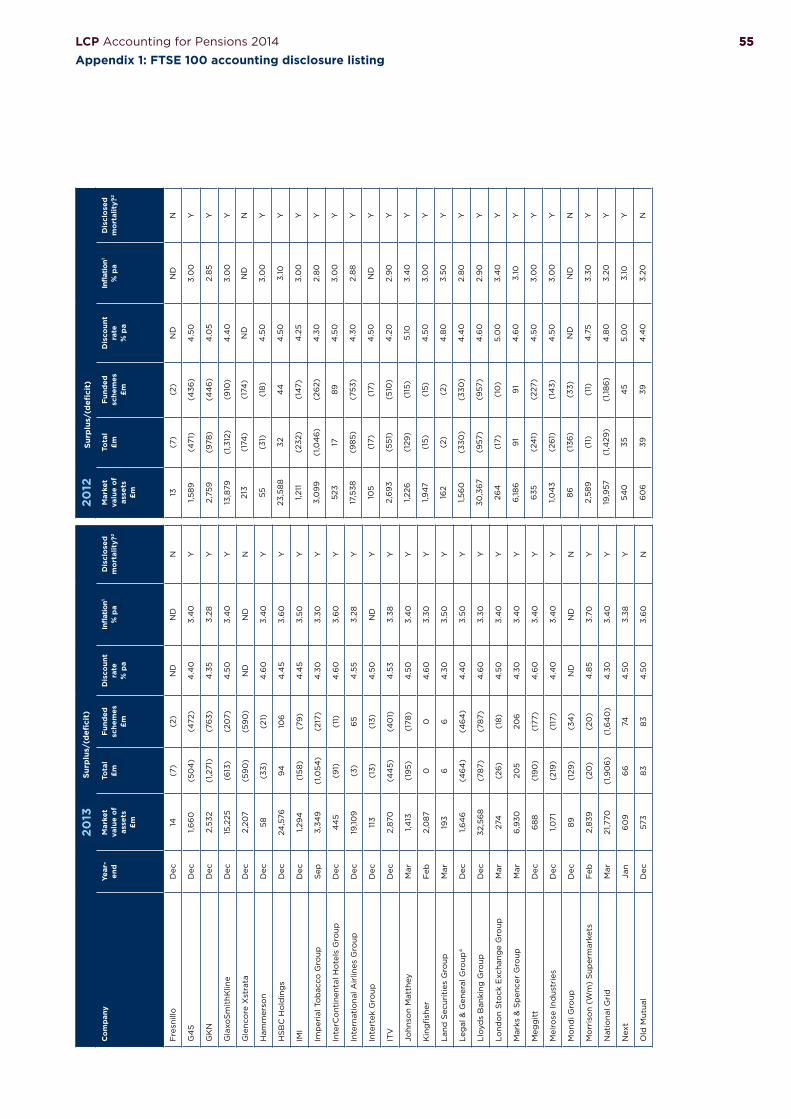
5.1 IntroductionIn this section we have analysed 89 FTSE 100 companies reporting in
2013. 11 companies have been excluded as they do not sponsor a material
DB pension scheme either in the UK or overseas. A full list and summary
details of the 89 companies’ key pension disclosures are set out in
appendix 1.
We have concentrated on the financial position of the DB schemes in
which the companies’ employees and former employees participate. Some
companies offer post-retirement healthcare, which we have excluded from
our analysis where possible. Overseas pension arrangements have been
included, except where otherwise indicated.
The disclosuresFor many FTSE 100 companies, pensions are financially significant and the
volume of information disclosed in the accounts reflects this.
The average pensions note is just over five pages, with most companies also
having several paragraphs of pension commentary in the main body of their
reports. The longest disclosures were by BT Group and Resolution, where
the main pension note ran across 10 pages of the 2013 report.
5.2 Analysis of results
Funding levelsIAS19 takes a snapshot of the accounting surplus or deficit at the
company’s year-end and this is generally the number that appears on the
balance sheet.
We have set out a full list of the disclosed accounting surpluses and
deficits of the FTSE 100 companies in appendix 1.
21 out of the 89 FTSE 100 companies disclosed pension assets equal to
or in excess of accounting liabilities, compared to 15 of these companies
last year.
38 companies reported being less than 90% funded on an accounting
basis at their 2013 year-end compared with 47 companies in 2012.
The general improvement in funding levels is largely due to strong
investment returns over 2013, particularly on equities, and a slight increase
in corporate bond yields, offset to some extent by higher expectations of
future inflation.
5 pagesThe average length of a
FTSE 100 pensions note.
41LCP Accounting for Pensions 2014
5. Analysis of pension disclosures
Changes over 2013The chart below shows how worldwide funding levels have changed
over the year for the 54 FTSE 100 companies in our report which have
December 2013 year-ends.
Ratio of assets to IAS19 liabilities at end of December (%)
December 2012
December 2013
0
5
10
15
20
Under 60 60 to 69 70 to 79 80 to 89 90 to 99 100 to 109 110 or over
Num
ber
of
com
pan
ies
The average reported IAS19 funding level for companies with December
year-ends was 90% in 2013, compared to 87% in 2012.
We have shown a similar chart for companies with March year-ends below.
0
2
4
6
8
10
12
Under 80 80 to 89 90 to 99 100 to 109 110 or over
Num
ber
of
com
pan
ies
March 2012
March 2013
March 2014
Ratio of assets to IAS19 liabilities at end of March (%)
Ana
lysi
s o
f p
ensi
on
dis
clo
sure
s
LCP Accounting for Pensions 2014
5. Analysis of pension disclosures42
The average reported IAS19 funding level for these companies was 98% at
March 2014 compared with 94% in 2013 and 92% in 2012. Notably, Royal Mail was 183% funded on an IAS19 basis at 31 March 2014 (compared to
133% funded at 31 March 2013) and this change has had a material impact
on the overall average.
Sources of deficits and surplusesFor the 54 companies with December year-ends, worldwide deficits
decreased by £11.7 billion over 2013. This is illustrated in the chart below.
IAS19 sources of deficits and surpluses for companies with December year-ends only (£ billion)
Benefits earned
Net interest chargedInvestment experience & exchange rate dierences
All rights to this document are reserved to Lane Clark & Peacock LLP (“LCP”). This document may be reproduced in whole or in part, provided prominent acknowledgement of the source is given.
We accept no liability to anyone to whom this document has been provided (with or without our consent). Lane Clark & Peacock LLP is a limited liability partnership registered in England and
Wales with registered number OC301436. LCP is a registered trademark in the UK (Regd. TM No 2315442) and in the EU (Regd. TM No 002935583). All partners are members of Lane Clark &
Peacock LLP. A list of members’ names is available for inspection at 95 Wigmore Street, London W1U 1DQ, the firm’s principal place of business and registered office. The firm is regulated by the
Institute and Faculty of Actuaries in respect of a range of investment business activities. The firm is not authorised under the Financial Services and Markets Act 2000 but we are able in certain
circumstances to offer a limited range of investment services to clients because we are licensed by the Institute and Faculty of Actuaries. We can provide these investment services if they are an
incidental part of the professional services we have been engaged to provide. Lane Clark & Peacock UAE operates under legal name “Lane Clark & Peacock Belgium – Abu Dhabi, Foreign Branch of