60
© Pennon Group plc 2019 1 UK Recycling Index 2019 Prepared by Edelman Intelligence EDELMAN INTELLIGENCE

© Pennon Group plc 2019EDELMAN INTELLIGENCE 1
UK Recycling Index 2019Prepared by Edelman Intelligence
EDELMAN INTELLIGENCE
EDELMAN INTELLIGENCE
© Pennon Group plc 2019
2
ContentsObjectives and Methodology
Recycling Index Key Take Outs 2016 - present
Considerations
2019 Findings
Detailed Research Findings
Detailed Research Findings
Section 1: Demand for greater collective national efforts
Section 2: Moving towards eco-friendlier practices –barriers and solutions
EDELMAN INTELLIGENCE
© Pennon Group plc 2019
3
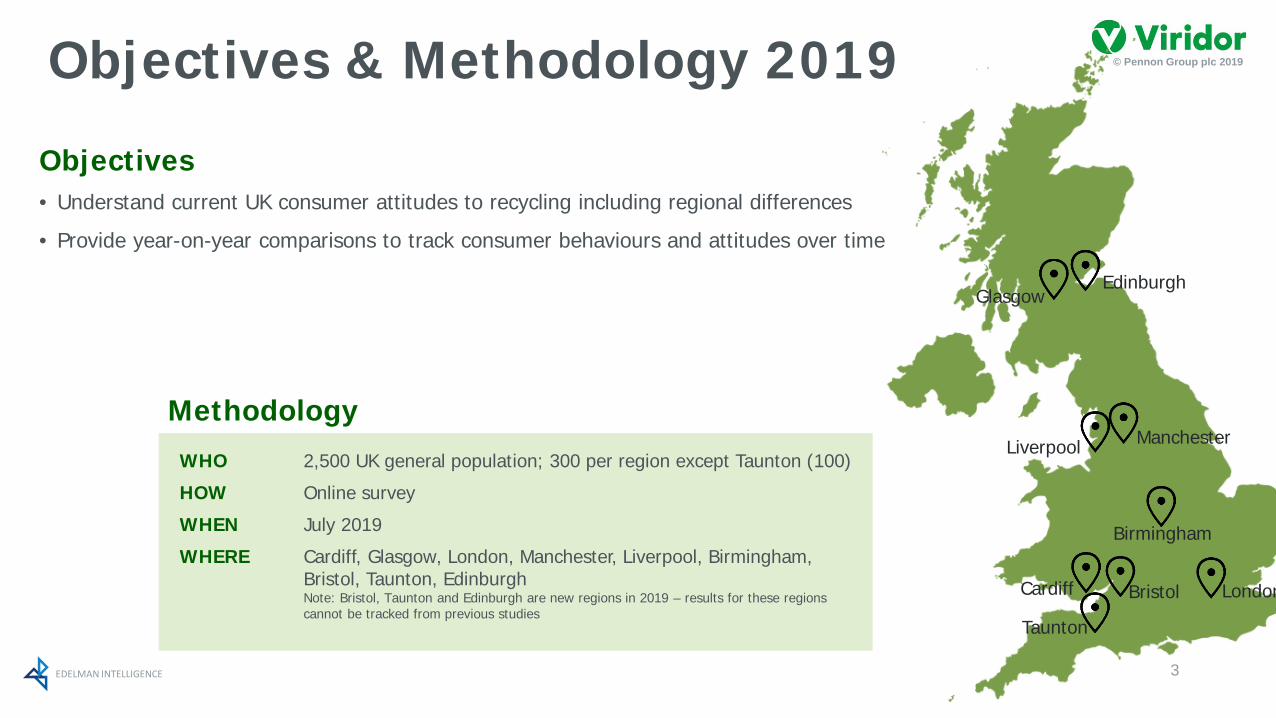
Objectives & Methodology 2019
WHO 2,500 UK general population; 300 per region except Taunton (100)
HOW Online survey
WHEN July 2019
WHERE Cardiff, Glasgow, London, Manchester, Liverpool, Birmingham, Bristol, Taunton, EdinburghNote: Bristol, Taunton and Edinburgh are new regions in 2019 – results for these regions cannot be tracked from previous studies
Glasgow
ManchesterLiverpool
London
Birmingham
Bristol
Taunton
Edinburgh
Cardiff
Objectives• Understand current UK consumer attitudes to recycling including regional differences
• Provide year-on-year comparisons to track consumer behaviours and attitudes over time
Methodology

EDELMAN INTELLIGENCE
© Pennon Group plc 2019
The Recycling Index is in its fourth year…
4
2016
The UK public acknowledges that they could be recycling more
household waste than they currently do
2017
There is public confusion about what to recycle and
many want more transparency about what
happens to their waste
2018
There is public openness towards adopting
recycling initiatives, yet there is still the challenge to
turn this willingness into action. Trust in
organisations to lead on recycling continues to be
low
2019
There is a significant rise in the expectations of the UK government to be
accountable for its own waste and how it deals with
plastic
For the last four years, we’ve been measuring the UK’s attitudes towards recycling

EDELMAN INTELLIGENCE
© Pennon Group plc 2019INTRODUCTIONConsiderations
o To allow Viridor to track key themes over time as well as understand emerging areas of interest, this year’s study includes 70-80% of comparable content with the 2018 survey.
o The footnotes on each slide indicate whether questions are comparable or not, and where appropriate year-on-year differences have been called out.
o Taking into account the cost and feasibility in recruitment versus media coverage gained in previous years, the regions sampled have changed slightly year-on-year. The nine regions sampled this year, including three new regions (Bristol, Taunton, Edinburgh) provide a view of recycling in the UK as well as offer city comparisons.
o Where all respondents (2500) have answered a comparable question, a difference of around 3% points is statistically significant year-on-year, indicating there has been a shift in opinion. Where local regions (300 respondents) have been asked comparable questions, a difference of around 8% points is statistically significant year-on-year.
Region sampled 2019 base size Years included in study
Cardiff 300 2016, 2017, 2018, 2019
Glasgow 300 2016, 2017, 2018, 2019
London 300 2016, 2017, 2018, 2019
Manchester 300 2016, 2017, 2018, 2019
Liverpool 300 2018, 2019
Birmingham 300 2018, 2019
Bristol 300 2019
Taunton, Somerset 100 2019
Edinburgh 300 2019
Total 2,500
5

EDELMAN INTELLIGENCE
© Pennon Group plc 2019INTRODUCTION
Consumers demand greater collective national efforts in managing the UK’s wasteo The gap between expectation and trust in the government to recycle properly is widening – significant increase of +4pts from 2018
o Nine in ten (87%) say the UK should find a way to deal with its own recycling without having to export it to other countries – up 7pts from 2018
o 85% say the UK should deal with its own plastic waste rather than exporting it – up 5pts from 2018
o Nine in ten (89%) agree existing plastic waste should be used to create useful resources that can be used again (new statement 2019)
o Nine in ten (88%) say councils should work together to collect materials in the same way in a national effort to recycle – up 5pts from 2018
o 87% think individuals should take responsibility for recycling more in the UK to avoid the amount of waste we send to landfill sites in the future –increase of 5pts from 2018
2019 Findings
6
EDELMAN INTELLIGENCE
© Pennon Group plc 2019INTRODUCTION
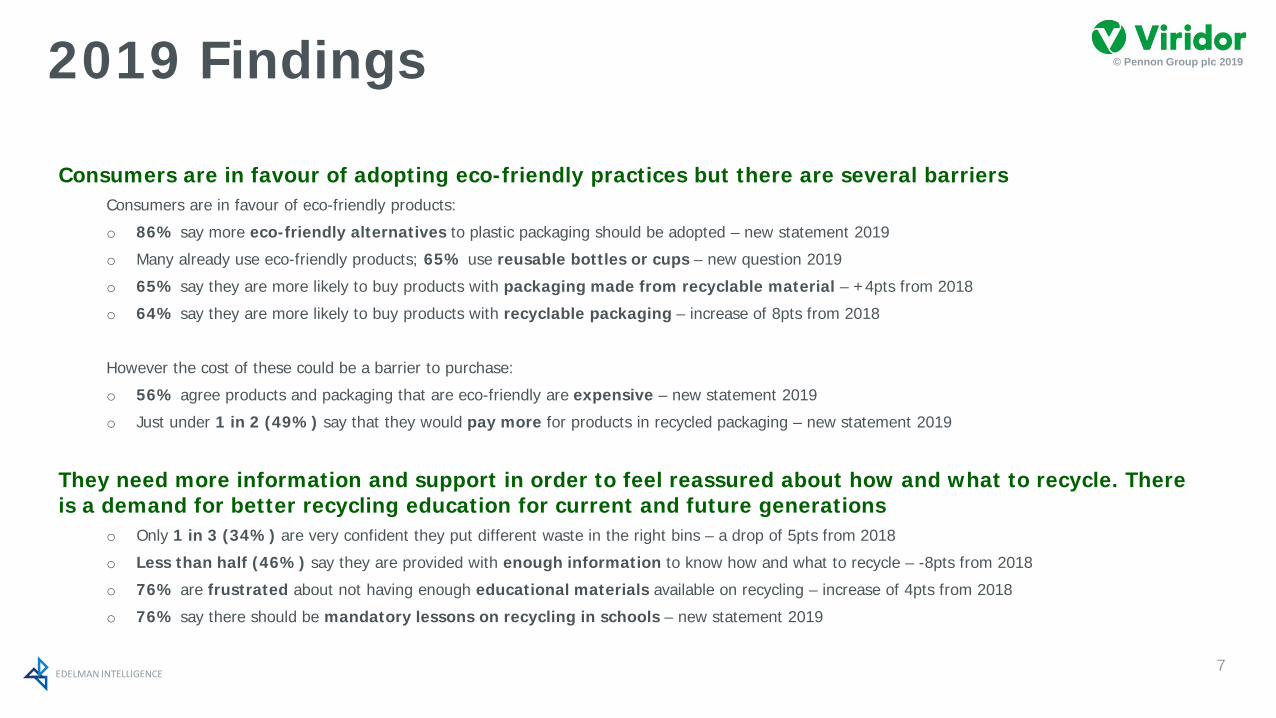
Consumers are in favour of adopting eco-friendly practices but there are several barriersConsumers are in favour of eco-friendly products:
o 86% say more eco-friendly alternatives to plastic packaging should be adopted – new statement 2019
o Many already use eco-friendly products; 65% use reusable bottles or cups – new question 2019
o 65% say they are more likely to buy products with packaging made from recyclable material – +4pts from 2018
o 64% say they are more likely to buy products with recyclable packaging – increase of 8pts from 2018
However the cost of these could be a barrier to purchase:
o 56% agree products and packaging that are eco-friendly are expensive – new statement 2019
o Just under 1 in 2 (49%) say that they would pay more for products in recycled packaging – new statement 2019
They need more information and support in order to feel reassured about how and what to recycle. There is a demand for better recycling education for current and future generations
o Only 1 in 3 (34%) are very confident they put different waste in the right bins – a drop of 5pts from 2018
o Less than half (46%) say they are provided with enough information to know how and what to recycle – -8pts from 2018
o 76% are frustrated about not having enough educational materials available on recycling – increase of 4pts from 2018
o 76% say there should be mandatory lessons on recycling in schools – new statement 2019
2019 Findings
7
EDELMAN INTELLIGENCE
© Pennon Group plc 2018INTRODUCTIONRegional differences
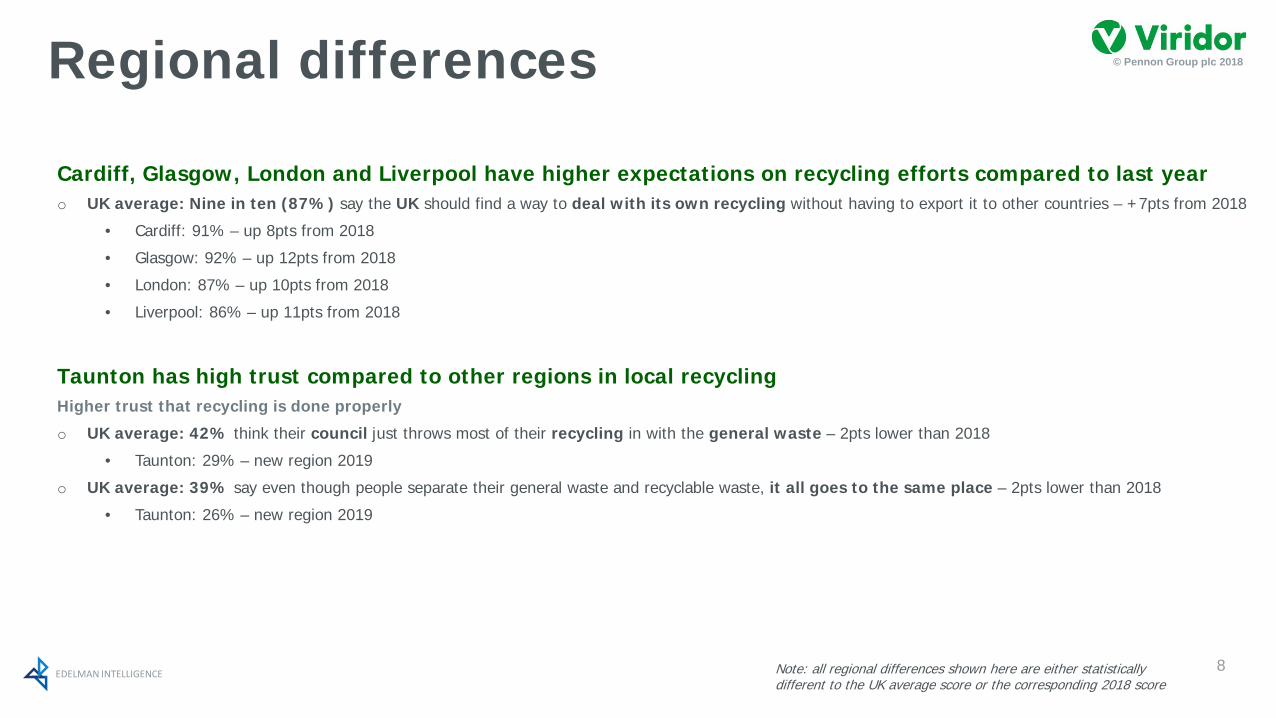
Cardiff, Glasgow, London and Liverpool have higher expectations on recycling efforts compared to last yearo UK average: Nine in ten (87%) say the UK should find a way to deal with its own recycling without having to export it to other countries – +7pts from 2018
• Cardiff: 91% – up 8pts from 2018
• Glasgow: 92% – up 12pts from 2018
• London: 87% – up 10pts from 2018
• Liverpool: 86% – up 11pts from 2018
Note: all regional differences shown here are either statistically different to the UK average score or the corresponding 2018 score
Taunton has high trust compared to other regions in local recyclingHigher trust that recycling is done properly
o UK average: 42% think their council just throws most of their recycling in with the general waste – 2pts lower than 2018
• Taunton: 29% – new region 2019
o UK average: 39% say even though people separate their general waste and recyclable waste, it all goes to the same place – 2pts lower than 2018
• Taunton: 26% – new region 2019
8

EDELMAN INTELLIGENCE
© Pennon Group plc 2018INTRODUCTIONRegional differences
Birmingham has lower expectations of recycling efforts and is less keen to adopt eco-friendly practicesErosion of trust in whether recycling is done properly at a local level
o UK average: 42% thinks their council just throws most of my recycling in with the general waste – down 2pts from 2018
• Birmingham: 59% – increase of 11pts from 2018
o UK average: 39% thinks even though people separate their general waste and recyclable waste, it all goes to the same place – down 2pts from 2018
• Birmingham: 51% – increase of 8pts from 2018
Less keen to adopt eco-friendly practices
o UK average: 86% say more eco-friendly alternatives to plastic packaging should be adopted – new question 2019
• Birmingham: 79%
• Those from Birmingham are also significantly less likely to use eco-friendly products such as reusable bottles/cups, recyclable products/packaging compared to the UK average
Feel less informed about how and what to recycle
o UK average: Less than half (46%) say they are provided enough information to know how and what to recycle – minus 8pts from 2018
• Birmingham: 37% – decrease of 14pts since 2018
Note: all regional differences shown here are either statistically different to the UK average score or the corresponding 2018 score
9
EDELMAN INTELLIGENCE
© Pennon Group plc 2019
Detailed Research FindingsSection 1: Demand for greater collective national efforts
Section 2: Moving towards eco-friendlier practices – barriers and solutions
© Pennon Group plc 2018
10

EDELMAN INTELLIGENCE
© Pennon Group plc 2019
Demand for greater collective national efforts
Section 1
© Pennon Group plc 2018
11

EDELMAN INTELLIGENCE
© Pennon Group plc 2019
The widening gap between expectation and trust in the UK government to lead on recycling suggests shift in the wrong direction
58 point trust gap (=)
25 point trust gap (=)
53 point trust gap (+4pts)
35 point trust gap (+1pts)
41 point trust gap (+1pts)
76%
65%
63%
56%
49%
18%
40%
10%
21%
8%
My local council
Individuals like me
National government
The waste management sector
Businesses
% who believe each isresponsible for recycling
% who trust each a greatdeal to play their role inensuring waste is recycledproperly
Expectation of who is responsible for recycling vs. trust in them to do this properly
(-2pts)
(-1pts)
(-2pts)
(-3pts)
(-1pts)
Q2. Who do you believe should be responsible for making sure rubbish and waste is recycled in the UK? // 2018 Base: All respondents (1,879) // 2019 Base: All respondents (2,500) Q3. How much do you trust each of the following people / organisations to play their role in ensuring waste is recycled properly? [Trust a great deal; Top 2 Box] 2018 Base: All respondents (1,879) // 2019 Base: All respondents (2,500)
(-1pts)
(-3pts)
(+2pts)
(=)
(-2pts)
Brackets denotes comparison with 2018 data
12
vs. 2018 scoresXpts = 2019 score significantly higher than 2018 scoreXpts = 2019 score significantly lower than 2018 score

EDELMAN INTELLIGENCE
© Pennon Group plc 2019
There is a significant rise in expectation that the UK should be accountable for its own waste
Q26. How much do you agree or disagree with each of the following statements when thinking about recycling now and in the future? [Agree; Top 2 Box] 2018 Base: All respondents (1,879), Cardiff (319), Glasgow (316), London (302), Manchester (331), Liverpool (304), Birmingham (307) // 2019 Base: All respondents (2,500), Cardiff (300), Glasgow (300), London (300), Manchester (300), Liverpool (300), Birmingham (300), Bristol (300), Taunton (100), Edinburgh (300).
9 in 10say the UK should find a way
to deal with its own recycling without
having to export it to other countries
(87%)
(+7pts from 2018)
2019 vs. 2018
Cardiff 91% +8ptsGlasgow 92% +12ptsLondon 87% +10ptsManchester 87% +3ptsLiverpool 86% +11ptsBirmingham 78% -3ptsBristol 86% -Taunton 87% -Edinburgh 88% -
2019 regional scoresX% = significantly higher than total UK scoreX% = significantly lower than total UK score
vs. 2018 scoresXpts = 2019 score significantly higher than 2018 scoreXpts = 2019 score significantly lower than 2018 score
13

EDELMAN INTELLIGENCE
© Pennon Group plc 2019
Expectations are increasing in how plastic waste is managed
14Q26. How much do you agree or disagree with each of the following statements when thinking about recycling now and in the future? [Agree; Top 2 Box] 2018 Base: All respondents (1,879) // 2019 Base: All respondents (2,500)
say the UK should deal with its own plastic waste rather
than exporting it
85%say existing plastic
waste should be
used to create useful resourcesthat can be used again
89%
(+5pts from 2018)
New statement 2019

EDELMAN INTELLIGENCE
© Pennon Group plc 2019
There is demand to ramp up collective efforts to improve recycling
15Q26. How much do you agree or disagree with each of the following statements when thinking about recycling now and in the future? [Agree; Top 2 Box] (New question 2019)2018 Base: All respondents (1,879) // 2019 Base: All respondents (2,500)
83%72%
82%88%
77%87%
Councils should work together to collect the same stuffin the same way around the UK in a national effort to
recycle
If we had a consistent recycling collection system around the UK - the same colour bins for the same
materials – it would increase UK recycling rates
Individuals should take responsibility for recycling morein the UK if we want to avoid overflowing landfill sites
in the future
2018 2019
+5 pts
% agree
+5 pts+5 pts

EDELMAN INTELLIGENCE
© Pennon Group plc 2019
Cardiff, Glasgow, London and Liverpool drive rise in expectations in recycling efforts
16Q26. How much do you agree or disagree with each of the following statements when thinking about recycling now and in the future? [Agree; Top 2 Box] (New question 2019)2018 Base: All respondents (1,879), Cardiff (319), Glasgow (316), London (302), Manchester (331), Liverpool (304), Birmingham (307) // 2019 Base: All respondents (2,500), Cardiff (300), Glasgow (300), London (300), Manchester (300), Liverpool (300), Birmingham (300), Bristol (300), Taunton (100), Edinburgh (300)
Total Cardiff Glasgow London Manchester Liverpool Birmingham Bristol Taunton Edinburgh
2019 88% 91% 86% 86% 85% 89% 83% 90% 89% 90%
vs. 2018 +5pts +4pts +3pts +8pts -1pts +5pts +4pts - - -
Councils should work together to collect the same stuff in the same way around the UK in a national effort to recycle
If we had a consistent recycling collection system around the UK - the same colour bins for the same materials - it would increase UK recycling rates
Total Cardiff Glasgow London Manchester Liverpool Birmingham Bristol Taunton Edinburgh
2019 77% 83% 80% 76% 76% 78% 72% 78% 73% 77%
vs. 2018 +5pts +9pts +8pts +6pts +4pts +7pts = - - -
Individuals should take responsibility for recycling more in the UK if we want to avoid overflowing landfill sites in the future
Total Cardiff Glasgow London Manchester Liverpool Birmingham Bristol Taunton Edinburgh
2019 87% 89% 88% 88% 86% 89% 83% 87% 91% 89%
vs. 2018 +5pts +5pts +5pts +10pts -1pts +7pts = - - -
% agree
2019 regional scoresX% = significantly higher than total UK scoreX% = significantly lower than total UK score
vs. 2018 scoresXpts = 2019 score significantly higher than 2018 scoreXpts = 2019 score significantly lower than 2018 score

EDELMAN INTELLIGENCE
© Pennon Group plc 2019
It’s easier for consumers to see action happening within their local community than at a national level
Q12C. What do you think about plastic pollution in the UK / in your local community? (New question 2019)2019 Base: All respondents (2,500), Cardiff (300), Glasgow (300), London (300), Manchester (300), Liverpool (300), Birmingham (300), Bristol (300), Taunton (100), Edinburgh (300).
17
Cardiff 77%Glasgow 77%London 70%Manchester 72%Liverpool 76%Birmingham 70%Bristol 79%Taunton 88%Edinburgh 79%
Cardiff 65%Glasgow 74%London 62%Manchester 66%Liverpool 72%Birmingham 62%Bristol 68%Taunton 71%Edinburgh 73%
% who think not enough is being done about plastic pollution...
76%68%
in the UK in your local community
-8pts
2019 regional scoresX% = significantly higher than total UK scoreX% = significantly lower than total UK score
vs. 2018 scoresXpts = 2019 score significantly higher than 2018 scoreXpts = 2019 score significantly lower than 2018 score
EDELMAN INTELLIGENCE
© Pennon Group plc 2019
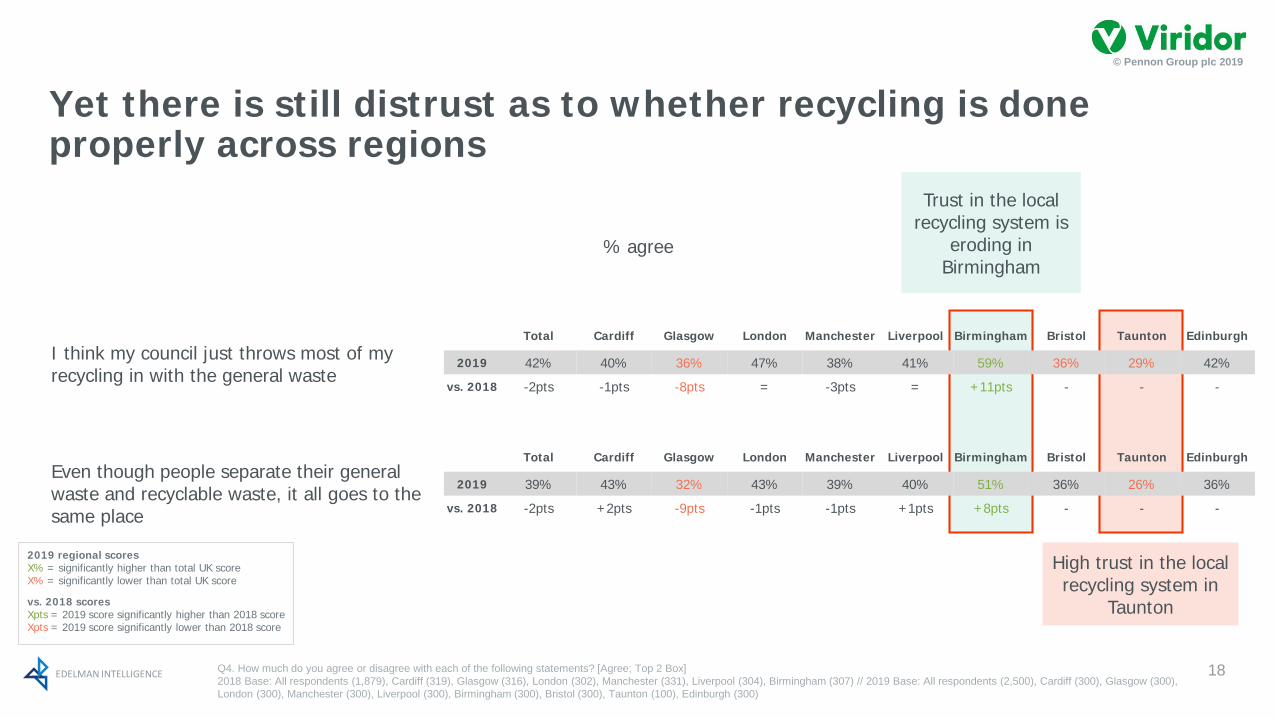
Yet there is still distrust as to whether recycling is done properly across regions
Q4. How much do you agree or disagree with each of the following statements? [Agree; Top 2 Box] 2018 Base: All respondents (1,879), Cardiff (319), Glasgow (316), London (302), Manchester (331), Liverpool (304), Birmingham (307) // 2019 Base: All respondents (2,500), Cardiff (300), Glasgow (300), London (300), Manchester (300), Liverpool (300), Birmingham (300), Bristol (300), Taunton (100), Edinburgh (300)
18
Total Cardiff Glasgow London Manchester Liverpool Birmingham Bristol Taunton Edinburgh
2019 42% 40% 36% 47% 38% 41% 59% 36% 29% 42%
vs. 2018 -2pts -1pts -8pts = -3pts = +11pts - - -
I think my council just throws most of my recycling in with the general waste
Even though people separate their general waste and recyclable waste, it all goes to the same place
Total Cardiff Glasgow London Manchester Liverpool Birmingham Bristol Taunton Edinburgh
2019 39% 43% 32% 43% 39% 40% 51% 36% 26% 36%
vs. 2018 -2pts +2pts -9pts -1pts -1pts +1pts +8pts - - -
Trust in the local recycling system is
eroding in Birmingham
High trust in the local recycling system in
Taunton
% agree
2019 regional scoresX% = significantly higher than total UK scoreX% = significantly lower than total UK score
vs. 2018 scoresXpts = 2019 score significantly higher than 2018 scoreXpts = 2019 score significantly lower than 2018 score

EDELMAN INTELLIGENCE
© Pennon Group plc 2019
Moving towards eco-friendlier practices – barriers and solutions
Section 2
© Pennon Group plc 2018
19

EDELMAN INTELLIGENCE
© Pennon Group plc 2019
The public are in favour of eco-friendly alternatives to plastics
Q12B. How much you agree or disagree with each of the following statements? [Agree; Top 2 Box]2019 Base: All respondents (2,500), Cardiff (300), Glasgow (300), London (300), Manchester (300), Liverpool (300), Birmingham (300), Bristol (300), Taunton (100), Edinburgh (300).
20
9 in 10say more eco-friendly alternatives to plastic
packaging should be adopted
(86%)Cardiff 88%Glasgow 88%London 87%Manchester 89%Liverpool 85%Birmingham 79%Bristol 86%Taunton 85%Edinburgh 87%
2019 regional scoresX% = significantly higher than total UK scoreX% = significantly lower than total UK score
vs. 2018 scoresXpts = 2019 score significantly higher than 2018 scoreXpts = 2019 score significantly lower than 2018 score
EDELMAN INTELLIGENCE
© Pennon Group plc 2019
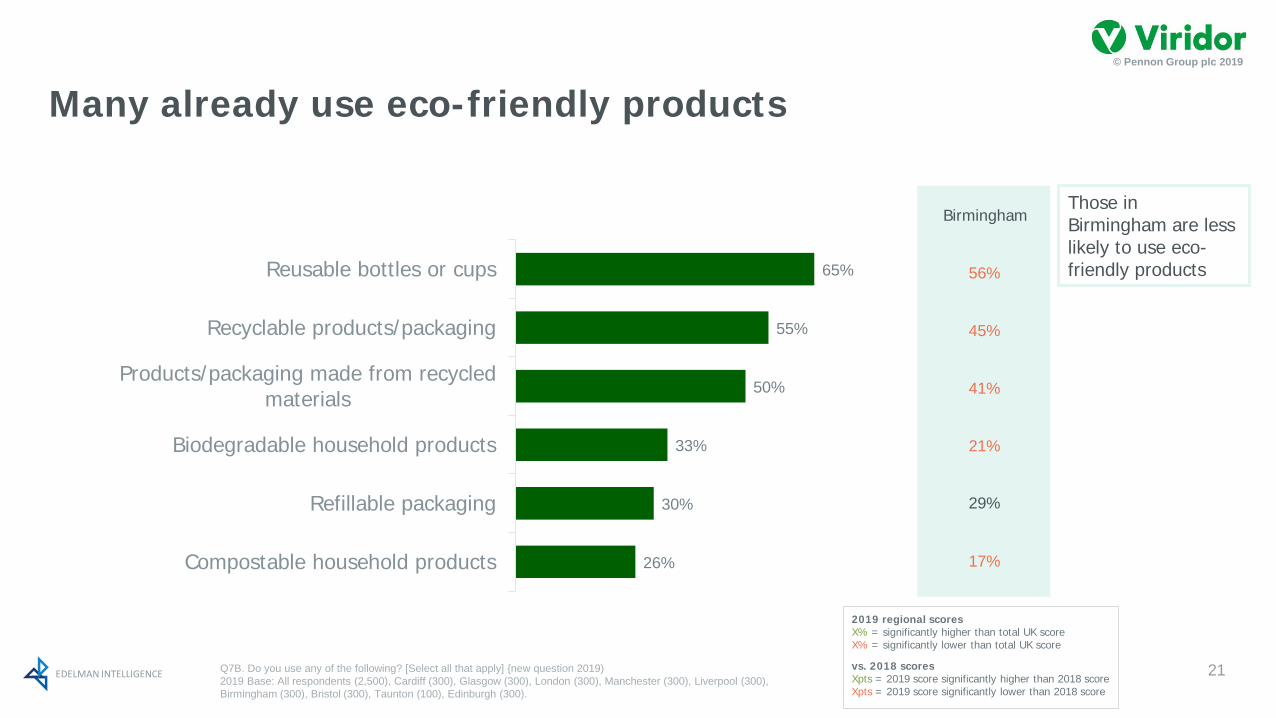
Many already use eco-friendly products
Q7B. Do you use any of the following? [Select all that apply] {new question 2019)2019 Base: All respondents (2,500), Cardiff (300), Glasgow (300), London (300), Manchester (300), Liverpool (300), Birmingham (300), Bristol (300), Taunton (100), Edinburgh (300).
21
26%
30%
33%
50%
55%
65%
Compostable household products
Refillable packaging
Biodegradable household products
Products/packaging made from recycledmaterials
Recyclable products/packaging
Reusable bottles or cups
Birmingham
56%
45%
41%
21%
29%
17%
Those in Birmingham are less likely to use eco-friendly products
2019 regional scoresX% = significantly higher than total UK scoreX% = significantly lower than total UK score
vs. 2018 scoresXpts = 2019 score significantly higher than 2018 scoreXpts = 2019 score significantly lower than 2018 score
EDELMAN INTELLIGENCE
© Pennon Group plc 2019
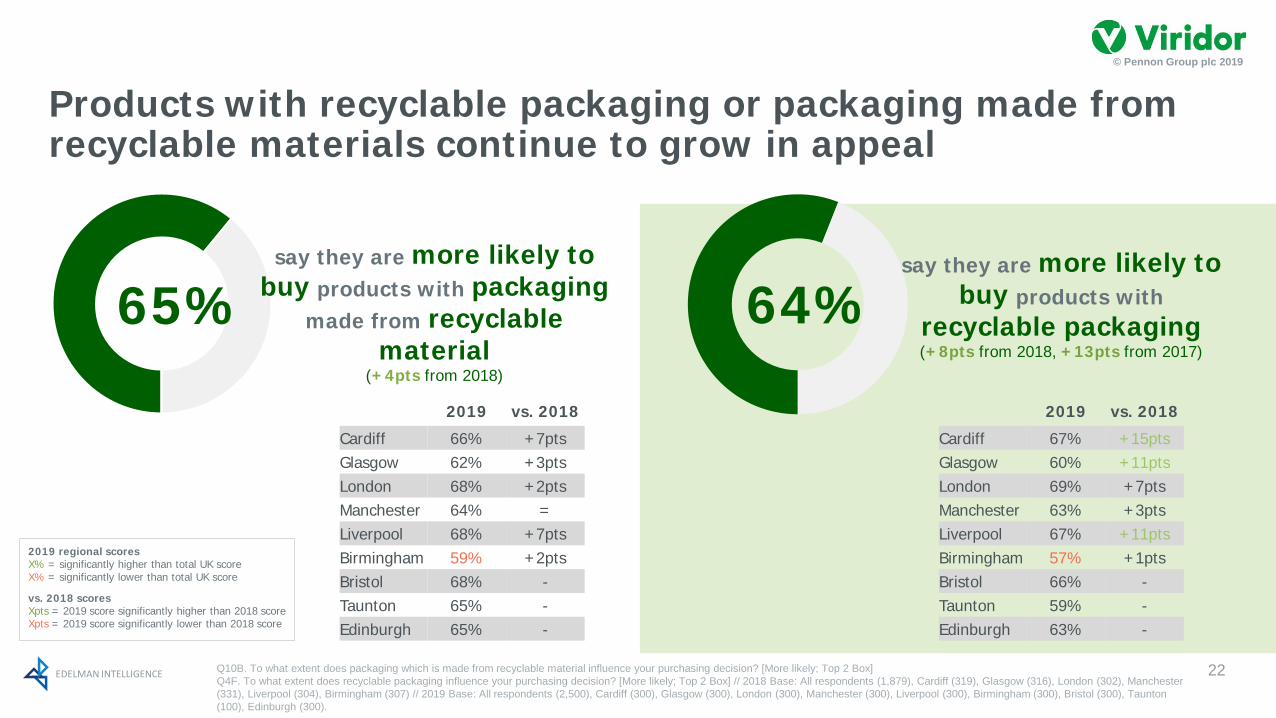
Products with recyclable packaging or packaging made from recyclable materials continue to grow in appeal
Q10B. To what extent does packaging which is made from recyclable material influence your purchasing decision? [More likely; Top 2 Box]Q4F. To what extent does recyclable packaging influence your purchasing decision? [More likely; Top 2 Box] // 2018 Base: All respondents (1,879), Cardiff (319), Glasgow (316), London (302), Manchester (331), Liverpool (304), Birmingham (307) // 2019 Base: All respondents (2,500), Cardiff (300), Glasgow (300), London (300), Manchester (300), Liverpool (300), Birmingham (300), Bristol (300), Taunton (100), Edinburgh (300).
22
say they are more likely to buy products with packaging
made from recyclable material
(+4pts from 2018)
65%say they are more likely to
buy products with recyclable packaging (+8pts from 2018, +13pts from 2017)
64%
2019 vs. 2018
Cardiff 66% +7ptsGlasgow 62% +3ptsLondon 68% +2ptsManchester 64% =Liverpool 68% +7ptsBirmingham 59% +2ptsBristol 68% -Taunton 65% -Edinburgh 65% -
2019 vs. 2018
Cardiff 67% +15ptsGlasgow 60% +11ptsLondon 69% +7ptsManchester 63% +3ptsLiverpool 67% +11ptsBirmingham 57% +1ptsBristol 66% -Taunton 59% -Edinburgh 63% -
2019 regional scoresX% = significantly higher than total UK scoreX% = significantly lower than total UK score
vs. 2018 scoresXpts = 2019 score significantly higher than 2018 scoreXpts = 2019 score significantly lower than 2018 score
EDELMAN INTELLIGENCE
© Pennon Group plc 2019
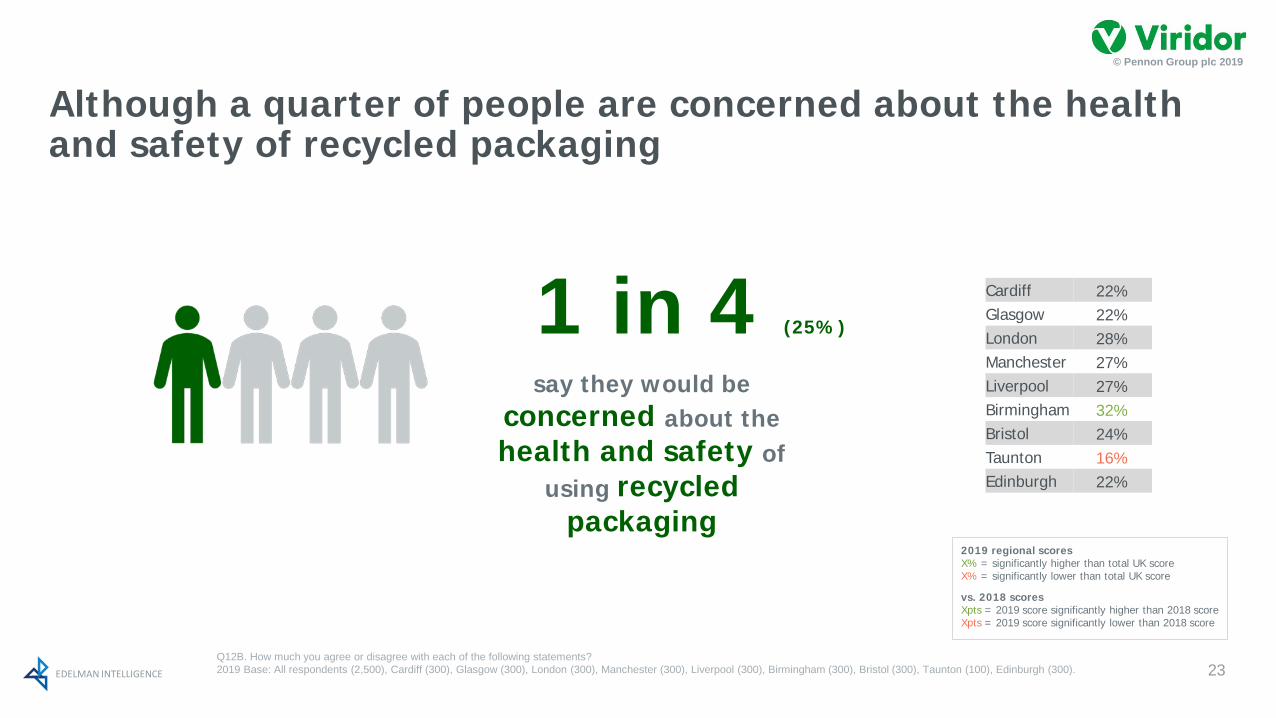
Although a quarter of people are concerned about the health and safety of recycled packaging
Q12B. How much you agree or disagree with each of the following statements?2019 Base: All respondents (2,500), Cardiff (300), Glasgow (300), London (300), Manchester (300), Liverpool (300), Birmingham (300), Bristol (300), Taunton (100), Edinburgh (300). 23
1 in 4 (25%)
say they would be concerned about the health and safety of
using recycled packaging
Cardiff 22%Glasgow 22%London 28%Manchester 27%Liverpool 27%Birmingham 32%Bristol 24%Taunton 16%Edinburgh 22%
2019 regional scoresX% = significantly higher than total UK scoreX% = significantly lower than total UK score
vs. 2018 scoresXpts = 2019 score significantly higher than 2018 scoreXpts = 2019 score significantly lower than 2018 score

EDELMAN INTELLIGENCE
© Pennon Group plc 2019
Eco-friendly products and packaging are also seen as expensive
24Q4. How much do you agree or disagree with each of the following statements? [Agree; Top 2 Box] (New question 2019)Q26. How much do you agree or disagree with each of the following statements when thinking about recycling now and in the future? [Agree; Top 2 Box] (New question 2019)2019 Base: All respondents (2,500)
agree products and packaging that are eco-friendly (e.g. recyclable, made from recycled materials, biodegradable) are expensive56%
say they would pay more for products in recycled packaging49%
Despite interest, price could be a barrier to purchase

EDELMAN INTELLIGENCE
© Pennon Group plc 2019
Adopting more environmentally friendly behaviours can be difficult. Despite high levels of responsibility individuals feel to recycle, they are less confident that they’re doing it correctly
Q8. How confident are you that you put all your different materials/waste in the right bins? (Very confident) 2018 Base: All respondents (1,879), Cardiff (319), Glasgow (316), London (302), Manchester (331), Liverpool (304), Birmingham (307) // 2019 Base: All respondents (2,500) All respondents (2,500), Cardiff (300), Glasgow (300), London (300), Manchester (300), Liverpool (300), Birmingham (300), Bristol (300), Taunton (100), Edinburgh (300).
25
1 in 3Are very confident they put
different waste in the right bins
(34%)
(-5pts from 2018)
2019 vs. 2018
Cardiff 35% -4ptsGlasgow 31% -5ptsLondon 30% -7ptsManchester 34% -10ptsLiverpool 33% -4ptsBirmingham 34% -9ptsBristol 39% -Taunton 45% -Edinburgh 34% -
2019 regional scoresX% = significantly higher than total UK scoreX% = significantly lower than total UK score
vs. 2018 scoresXpts = 2019 score significantly higher than 2018 scoreXpts = 2019 score significantly lower than 2018 score

EDELMAN INTELLIGENCE
© Pennon Group plc 2019
They look to technology to make the recycling process easier
Q26. How much do you agree or disagree with each of the following statements when thinking about recycling now and in the future? ? [Agree; Top 2 Box] 2019 Base: All respondents (2,500)
26
New statement 2019
7 in 10say in the future,
technology will help make recycling easier
e.g. smart bins that sort waste into categories for recycling
(67%)

EDELMAN INTELLIGENCE
© Pennon Group plc 2019
However drop in those who agree the industry will be designed out shows there is no overnight solution to waste management
Q26. How much do you agree or disagree with each of the following statements when thinking about recycling now and in the future? ? [Agree; Top 2 Box] 2018 Base: All respondents (1,879) // 2019 Base: All respondents (2,500)
27
The recycling industry will become
redundant in the future as waste will be ‘designed out’ of
products
32%
(-3pts from 2018)
vs. 2018 scoresXpts = 2019 score significantly higher than 2018 scoreXpts = 2019 score significantly lower than 2018 score

EDELMAN INTELLIGENCE
© Pennon Group plc 2019
Consumers need information about how and what to recycle, yet there is a significant drop in those who say they are provided with enough information
Q7. Now I’d like you to say how much you agree or disagree with each of the following statements. [Agree; Top 2 Box] 2018 Base: All respondents (1,879), Cardiff (319), Glasgow (316), London (302), Manchester (331), Liverpool (304), Birmingham (307) // 2019 Base: All respondents (2,500), Cardiff (300), Glasgow (300), London (300), Manchester (300), Liverpool (300), Birmingham (300), Bristol (300), Taunton (100), Edinburgh (300).
say they are
provided with enough information
to know
how and what to recycle (e.g. by their local council, by the
government, by businesses)(-8pts from 2018)
46%
2019 vs. 2018
Cardiff 55% -6ptsGlasgow 39% -5ptsLondon 49% -10ptsManchester 55% -6ptsLiverpool 43% -3ptsBirmingham 37% -14ptsBristol 48% -Taunton 41% -Edinburgh 44% -
2019 regional scoresX% = significantly higher than total UK scoreX% = significantly lower than total UK score
vs. 2018 scoresXpts = 2019 score significantly higher than 2018 scoreXpts = 2019 score significantly lower than 2018 score
28

EDELMAN INTELLIGENCE
© Pennon Group plc 2019
There is continued rise in frustration in the lack of information and education materials on recycling
are frustrated about not having enough educational materials available on recycling
76%
Q16: How frustrating, if at all, do you find each of the following are when it comes to recycling? [Frustrating; Top 3 Box]2018 Base: All respondents (1,879), Cardiff (319), Glasgow (316), London (302), Manchester (331), Liverpool (304), Birmingham (307) // 2019 Base: All respondents (2,500), Cardiff (300), Glasgow (300), London (300), Manchester (300), Liverpool (300), Birmingham (300), Bristol (300), Taunton (100), Edinburgh (300).
29
2019 vs. 2018
Cardiff 73% +3ptsGlasgow 79% +2ptsLondon 68% +1ptsManchester 78% +7ptsLiverpool 77% +3ptsBirmingham 81% +7ptsBristol 75% -Taunton 74% -Edinburgh 79% -
(+4pts from 2018, +7pts from 2017, +10pts from 2016)
are frustrated about not knowing what can be recycled
2019 vs. 2018
Cardiff 75% +4ptsGlasgow 79% +3ptsLondon 68% -3ptsManchester 74% +2ptsLiverpool 76% +5ptsBirmingham 73% +4ptsBristol 73% -Taunton 78% -Edinburgh 76% -
74%
(+2pts from 2018, +7pts from 2017, +10pts from 2016)
2019 regional scoresX% = significantly higher than total UK scoreX% = significantly lower than total UK score
vs. 2018 scoresXpts = 2019 score significantly higher than 2018 scoreXpts = 2019 score significantly lower than 2018 score

EDELMAN INTELLIGENCE
© Pennon Group plc 2019
Consumers demand more education on recycling for current and future generations
Q4. How much do you agree or disagree with each of the following statements? (new statements 2019) [Agree; Top 2 Box] 2019 Base: All respondents (2,500), Cardiff (300), Glasgow (300), London (300), Manchester (300), Liverpool (300), Birmingham (300), Bristol (300), Taunton (100), Edinburgh (300).
30
New statement 2019
Cardiff 76%Glasgow 77%London 74%Manchester 78%Liverpool 75%Birmingham 71%Bristol 75%Taunton 71%Edinburgh 82%
8 in 10say there should be to
mandatory lessons on recycling
in schools
(76%)
2019 regional scoresX% = significantly higher than total UK scoreX% = significantly lower than total UK score
vs. 2018 scoresXpts = 2019 score significantly higher than 2018 scoreXpts = 2019 score significantly lower than 2018 score
EDELMAN INTELLIGENCE
© Pennon Group plc 2019
Thank you
© Pennon Group plc 2018
31

EDELMAN INTELLIGENCE
© Pennon Group plc 2019
Appendix
© Pennon Group plc 2018
32
EDELMAN INTELLIGENCE
© Pennon Group plc 2019
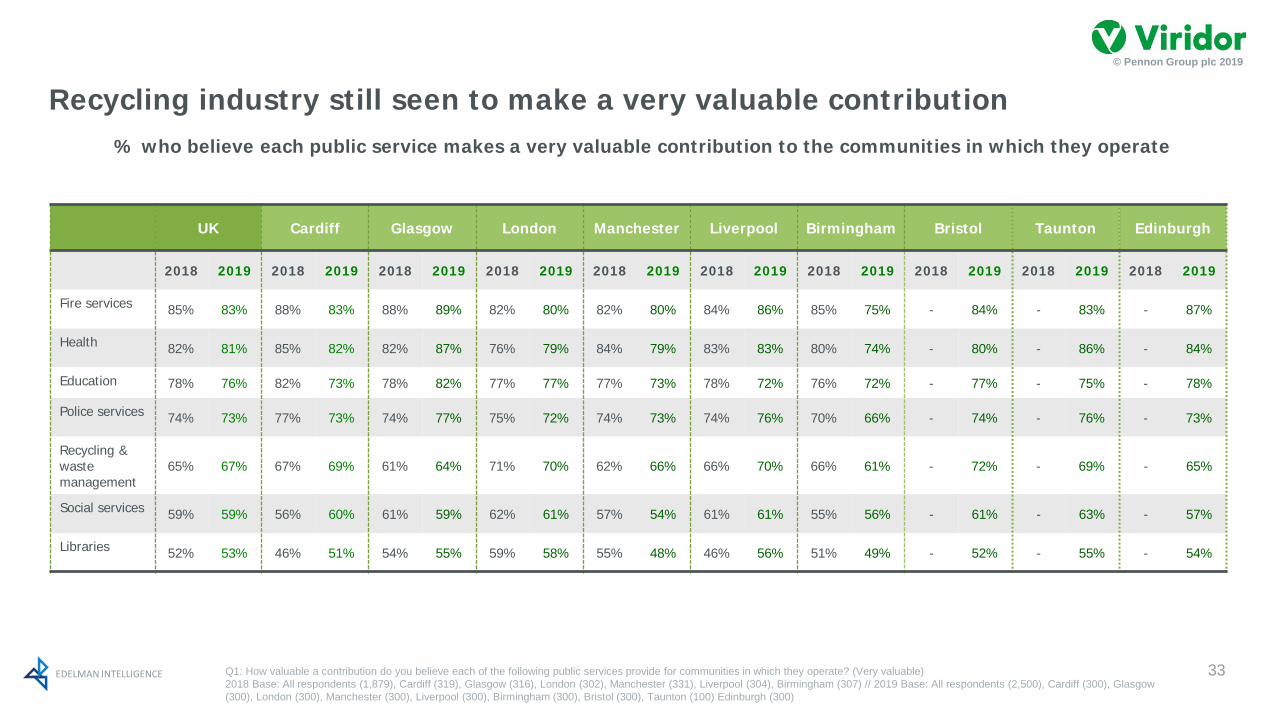
Recycling industry still seen to make a very valuable contribution
Q1: How valuable a contribution do you believe each of the following public services provide for communities in which they operate? (Very valuable)2018 Base: All respondents (1,879), Cardiff (319), Glasgow (316), London (302), Manchester (331), Liverpool (304), Birmingham (307) // 2019 Base: All respondents (2,500), Cardiff (300), Glasgow (300), London (300), Manchester (300), Liverpool (300), Birmingham (300), Bristol (300), Taunton (100) Edinburgh (300)
33
UK Cardiff Glasgow London Manchester Liverpool Birmingham Bristol Taunton Edinburgh
2018 2019 2018 2019 2018 2019 2018 2019 2018 2019 2018 2019 2018 2019 2018 2019 2018 2019 2018 2019
Fire services 85% 83% 88% 83% 88% 89% 82% 80% 82% 80% 84% 86% 85% 75% - 84% - 83% - 87%
Health 82% 81% 85% 82% 82% 87% 76% 79% 84% 79% 83% 83% 80% 74% - 80% - 86% - 84%
Education 78% 76% 82% 73% 78% 82% 77% 77% 77% 73% 78% 72% 76% 72% - 77% - 75% - 78%
Police services 74% 73% 77% 73% 74% 77% 75% 72% 74% 73% 74% 76% 70% 66% - 74% - 76% - 73%
Recycling & waste management
65% 67% 67% 69% 61% 64% 71% 70% 62% 66% 66% 70% 66% 61% - 72% - 69% - 65%
Social services 59% 59% 56% 60% 61% 59% 62% 61% 57% 54% 61% 61% 55% 56% - 61% - 63% - 57%
Libraries 52% 53% 46% 51% 54% 55% 59% 58% 55% 48% 46% 56% 51% 49% - 52% - 55% - 54%
% who believe each public service makes a very valuable contribution to the communities in which they operate

EDELMAN INTELLIGENCE
© Pennon Group plc 2019
Most consumers still believe the responsibility to recycle should be primarily shared by local councils, individuals and the government
Q2. Who do you believe should be responsible for making sure rubbish and waste is recycled in the UK?2018 Base: All respondents (1,879), Cardiff (319), Glasgow (316), London (302), Manchester (331), Liverpool (304), Birmingham (307). // 2019 Base: All respondents (2,500), Cardiff (300), Glasgow (300), London (300), Manchester (300), Liverpool (300), Birmingham (300), Bristol (300), Taunton (100) Edinburgh (300)
34
UK Cardiff Glasgow London Manchester Liverpool Birmingham Bristol Taunton Edinburgh
2018 2019 2018 2019 2018 2019 2018 2019 2018 2019 2018 2019 2018 2019 2018 2019 2018 2019 2018 2019
Individuals like me 68% 65% 69% 66% 70% 65% 66% 68% 70% 72% 69% 61% 63% 60% - 62% - 70% - 69%
My family 49% 49% 52% 55% 45% 47% 44% 49% 50% 50% 50% 44% 55% 50% - 46% - 58% - 48%
Waste / Bin collection staff 50% 51% 46% 55% 50% 49% 48% 53% 56% 56% 47% 44% 51% 52% - 50% - 55% - 47%
The waste management sector 56% 56% 54% 58% 57% 56% 58% 61% 59% 61% 54% 48% 54% 49% - 54% - 70% - 57%
My local council 77% 76% 80% 79% 80% 79% 75% 81% 82% 76% 72% 73% 74% 71% - 73% - 76% - 79%
Charities and not-for-profit organisations 25% 24% 24% 28% 23% 24% 26% 28% 28% 25% 20% 21% 26% 20% - 21% - 30% - 27%
Businesses 51% 49% 50% 51% 51% 49% 51% 50% 56% 55% 48% 48% 50% 37% - 48% - 54% - 50%
National government 61% 63% 62% 65% 58% 65% 59% 63% 65% 65% 57% 61% 62% 57% - 66% - 68% - 61%
% who believe each organisation/individual should be responsible for ensuring rubbish and waste is recycled

EDELMAN INTELLIGENCE
© Pennon Group plc 2019
Levels of trust to recycle properly continue to be low, particularly in businesses
Q3. How much do you trust each of the following people / organisations to play their role in ensuring waste is recycled properly? [Trust; Top 2 Box in 5pt scale]2018 Base: All respondents (1,879), Cardiff (319), Glasgow (316), London (302), Manchester (331), Liverpool (304), Birmingham (307). // 2019 Base: All respondents (2,500), Cardiff (300), Glasgow (300), London (300), Manchester (300), Liverpool (300), Birmingham (300), Bristol (300), Taunton (100) Edinburgh (300)
35
UK Cardiff Glasgow London Manchester Liverpool Birmingham Bristol Taunton Edinburgh
2018 2019 2018 2019 2018 2019 2018 2019 2018 2019 2018 2019 2018 2019 2018 2019 2018 2019 2018 2019
Individuals like me 43% 40% 44% 37% 40% 40% 44% 43% 40% 43% 45% 43% 45% 41% - 38% - 39% - 36%
My family 46% 46% 51% 47% 42% 40% 40% 41% 43% 48% 55% 51% 46% 47% - 49% - 55% - 45%
Waste / Bin collection staff 24% 25% 26% 28% 18% 22% 25% 26% 25% 28% 26% 28% 22% 24% - 23% - 25% - 23%
The waste management sector 22% 21% 24% 20% 20% 23% 26% 24% 24% 26% 21% 22% 19% 22% - 15% - 23% - 19%
My local council 20% 18% 23% 19% 16% 17% 26% 25% 20% 21% 20% 17% 15% 18% - 14% - 17% - 16%
Charities and not-for-profit organisations 20% 21% 17% 21% 20% 25% 25% 24% 22% 22% 20% 18% 14% 21% - 20% - 19% - 22%
Businesses 9% 8% 8% 7% 8% 7% 15% 14% 9% 8% 9% 8% 8% 11% - 6% - 6% - 7%
National government 12% 10% 11% 9% 11% 9% 18% 16% 12% 12% 12% 9% 11% 13% - 6% - 9% - 9%
% who trust each organisation/individual a great deal to play their role in ensuring waste is recycled properly

EDELMAN INTELLIGENCE
© Pennon Group plc 2019
Scepticism in what happens to waste remains steady
Q4. How much do you agree or disagree with each of the following statements? [Agree; Top 2 Box in 5pt scale]2018 Base: All respondents (1,879), Cardiff (319), Glasgow (316), London (302), Manchester (331), Liverpool (304), Birmingham (307). // 2019 Base: All respondents (2,500), Cardiff (300), Glasgow (300), London (300), Manchester (300), Liverpool (300), Birmingham (300), Bristol (300), Taunton (100) Edinburgh (300)).
36
UK Cardiff Glasgow London Manchester Liverpool Birmingham Bristol Taunton Edinburgh
2018 2019 2018 2019 2018 2019 2018 2019 2018 2019 2018 2019 2018 2019 2018 2019 2018 2019 2018 2019
I believe my recycling is put to good use
55% 55% 55% 53% 55% 53% 57% 57% 55% 59% 54% 59% 55% 53% - 52% - 47% - 57%
I would like more transparency on what happens to my waste
78% 75% 77% 78% 77% 73% 83% 78% 80% 75% 72% 75% 79% 70% - 76% - 70% - 78%
I would recycle more waste if I knew what happened to it
55% 53% 50% 51% 55% 50% 60% 57% 53% 55% 55% 55% 59% 57% - 50% - 46% - 54%
I think my council just throws most of my recycling in with the general waste
44% 42% 41% 40% 44% 36% 47% 47% 41% 38% 41% 41% 48% 59% - 36% - 29% - 42%
Even though people separate their general waste and recyclable waste, it all goes to the same place
41% 39% 41% 43% 41% 32% 44% 43% 40% 39% 39% 40% 43% 51% - 36% - 26% - 36%
Waste is a valuable resource 78% 75% 76% 74% 78% 78% 81% 78% 81% 79% 73% 74% 79% 70% - 71% - 73% - 75%
% who agree with each statement

EDELMAN INTELLIGENCE
© Pennon Group plc 2019
Consumers believe that waste that can’t be recycled should be used to create energy
Q4. How much do you agree or disagree with each of the following statements? [Agree; Top 2 Box in 5pt scale]2018 Base: All respondents (1,879), Cardiff (319), Glasgow (316), London (302), Manchester (331), Liverpool (304), Birmingham (307). // 2019 Base: All respondents (2,500), Cardiff (300), Glasgow (300), London (300), Manchester (300), Liverpool (300), Birmingham (300), Bristol (300), Taunton (100) Edinburgh (300)
37
UK Cardiff Glasgow London Manchester Liverpool Birmingham Bristol Taunton Edinburgh
2018 2019 2018 2019 2018 2019 2018 2019 2018 2019 2018 2019 2018 2019 2018 2019 2018 2019 2018 2019
Waste that can’t be recycled should be used to create energy
86% 84% 88% 86% 86% 84% 85% 83% 88% 84% 80% 82% 86% 81% - 84% - 81% - 88%
I’d rather waste was used to create energy than disposed of in a landfill
86% 84% 87% 89% 87% 86% 87% 80% 87% 85% 83% 81% 86% 80% - 85% - 86% - 87%
It is important for me to know what happens to my waste
67% 67% 67% 69% 64% 66% 71% 71% 70% 66% 62% 66% 69% 62% - 70% - 67% - 69%
There should be mandatory lessons on recycling in schools
- 76% - 76% - 77% - 74% - 78% - 75% - 71% - 75% - 71% - 82%
I wish I had more information on what can be recycled and how
- 70% - 66% - 72% - 65% - 70% - 72% - 71% - 70% - 70% - 74%
Products and packaging that are eco-friendly (e.g. recyclable, made from recycled materials, biodegradable) are expensive
- 56% - 56% - 55% - 54% - 54% - 59% - 58% - 55% - 46% - 58%
% who agree with each statement

EDELMAN INTELLIGENCE
© Pennon Group plc 2019
Q6B. When you are not at home or at work, how easy or difficult is it to recycle the following items? [NET Easy = Very easy + quite easy // NET difficult = Very difficult + quite difficult] (New question 2019)2019 Base: All respondents (2,500), Cardiff (300), Glasgow (300), London (300), Manchester (300), Liverpool (300), Birmingham (300), Bristol (300), Taunton (100) Edinburgh (300) 38
UK Cardiff Glasgow London Manchester Liverpool Birmingham Bristol Taunton Edinburgh
2019 2019 2019 2019 2019 2019 2019 2019 2019 2019
Plastic drink bottles (e.g. water or fizzy drinks) 52% 53% 54% 53% 51% 49% 48% 52% 47% 56%
Paper cups 53% 53% 52% 56% 53% 56% 50% 51% 44% 52%
Plastic cups 40% 40% 39% 45% 35% 40% 43% 38% 24% 44%
Food packaging (e.g. sandwich wrapper, pasta box)
34% 37% 33% 40% 31% 35% 34% 29% 19% 37%
Glass drink bottles (e.g. juice) 57% 59% 55% 61% 60% 56% 51% 56% 51% 59%
% who feel recycling the following products are easy to recycle
Food packaging is seen as the most difficult to recycle outside of the home and work
% who feel recycling the following products are difficult to recycle
UK Cardiff Glasgow London Manchester Liverpool Birmingham Bristol Taunton Edinburgh
2019 2019 2019 2019 2019 2019 2019 2019 2019 2019
Plastic drink bottles (e.g. water or fizzy drinks) 33% 29% 33% 28% 35% 35% 35% 35% 33% 34%
Paper cups 30% 30% 31% 22% 30% 28% 29% 34% 33% 32%
Plastic cups 43% 41% 46% 37% 48% 42% 42% 48% 48% 41%
Food packaging (e.g. sandwich wrapper, pasta box)
47% 44% 49% 37% 49% 49% 44% 54% 57% 47%
Glass drink bottles (e.g. juice) 27% 27% 30% 23% 26% 25% 26% 29% 23% 32%

EDELMAN INTELLIGENCE
© Pennon Group plc 2019
Q7B. Do you use any of the following? [Select all that apply] (New question 2019) 2019 Base: All respondents (2,500), Cardiff (300), Glasgow (300), London (300), Manchester (300), Liverpool (300), Birmingham (300), Bristol (300), Taunton (100) Edinburgh (300)
39
UK Cardiff Glasgow London Manchester Liverpool Birmingham Bristol Taunton Edinburgh
2019 2019 2019 2019 2019 2019 2019 2019 2019 2019
Reusable bottles or cups 65% 65% 64% 66% 64% 64% 56% 68% 71% 69%
Refillable packaging (i.e. refillable packs or containers which you can fill up in stores)
30% 33% 30% 31% 29% 29% 29% 30% 33% 32%
Products/packaging made from recycled materials
50% 53% 50% 52% 51% 47% 41% 54% 51% 50%
Recyclable products/packaging (i.e. any product/packaging that can be recycled)
55% 56% 50% 60% 54% 54% 45% 59% 54% 60%
Biodegradable household products 33% 35% 32% 37% 35% 26% 21% 36% 45% 40%
Compostable household products 26% 30% 25% 25% 30% 17% 17% 29% 49% 27%
None of the above 11% 11% 12% 11% 9% 11% 16% 9% 10% 13%
% who use the following products
Many already use eco-friendly products

EDELMAN INTELLIGENCE
© Pennon Group plc 2019
Q4F. To what extent does recyclable packaging influence your purchasing decision? 2018 Base: All respondents (1,879), Cardiff (319), Glasgow (316), London (302), Manchester (331), Liverpool (304), Birmingham (307) // 2019 Base: All respondents (2,500), Cardiff (300), Glasgow (300), London (300), Manchester (300), Liverpool (300), Birmingham (300), Bristol (300), Taunton (100) Edinburgh (300).
40
UK Cardiff Glasgow London Manchester Liverpool Birmingham Bristol Taunton Edinburgh
Recyclable packaging…2018 2019 2018 2019 2018 2019 2018 2019 2018 2019 2018 2019 2018 2019 2018 2019 2018 2019 2018 2019
…makes me more likely to purchase a productNET: much more likely, somewhat more likely
56% 64% 52% 67% 49% 60% 62% 69% 60% 63% 56% 67% 56% 57% - 66% - 59% - 63%
Much more likely 21% 21% 21% 19% 19% 20% 25% 25% 18% 18% 25% 21% 21% 21% - 21% - 24% - 21%
Somewhat more likely 34% 43% 32% 49% 30% 41% 38% 44% 41% 45% 30% 46% 35% 36% - 45% - 35% - 42%
It has no influence 32% 27% 35% 27% 40% 30% 27% 19% 30% 28% 29% 22% 32% 31% - 27% - 29% - 28%
…makes me less likely to purchase a productNET: somewhat less likely, much less likely
2% 3% 2% 3% 2% 3% 2% 2% 3% 3% 1% 3% 2% 5% - 2% - 5% - 1%
Somewhat less likely 1% 2% 1% 2% 1% 2% 1% 2% 2% 2% 0% 2% 1% 4% - 1% - 4% - 1%
Much less likely 1% 1% 1% 1% 1% 1% 1% 1% 1% 1% 1% 1% 1% 0% - 1% - 1% - 0%
Not sure / don’t know 10% 7% 11% 2% 9% 7% 9% 10% 8% 6% 14% 7% 9% 7% - 5% - 7% - 8%
The extent to which recyclable packaging influence consumers’ purchasing decision
Appeal of products with recyclable packaging is increasing

EDELMAN INTELLIGENCE
© Pennon Group plc 2019
Q10B. To what extent does packaging which is made from recyclable material influence your purchasing decision?2018 Base: All respondents (1,879), Cardiff (319), Glasgow (316), London (302), Manchester (331), Liverpool (304), Birmingham (307). // 2019 Base: All respondents (2,500), Cardiff (300), Glasgow (300), London (300), Manchester (300), Liverpool (300), Birmingham (300), Bristol (300), Taunton (100) Edinburgh (300)
41
UK Cardiff Glasgow London Manchester Liverpool Birmingham Bristol Taunton Edinburgh
Packaging made from recyclable material… 2018 2019 2018 2019 2018 2019 2018 2019 2018 2019 2018 2019 2018 2019 2018 2019 2018 2019 2018 2019
…makes me more likely to purchase a productNET: much more likely, somewhat more likely
61% 66% 59% 66% 59% 62% 66% 68% 64% 64% 61% 68% 57% 59% - 68% - 65% - 65%
Much more likely 22% 21% 22% 21% 19% 21% 26% 27% 19% 15% 23% 23% 23% 19% - 20% - 20% - 20%
Somewhat more likely 39% 44% 37% 45% 40% 42% 39% 41% 45% 49% 38% 45% 34% 40% - 47% - 45% - 45%
It has no influence 32% 28% 35% 31% 35% 30% 27% 24% 28% 30% 30% 23% 36% 33% - 26% - 28% - 27%
…makes me less likely to purchase a productNET: somewhat less likely, much less likely
2% 2% 1% 1% 1% 2% 2% 2% 2% 3% 1% 1% 2% 2% - 2% - 1% - 1%
Somewhat less likely 1% 1% 0% 1% 1% 1% 1% 2% 2% 2% 1% 1% 1% 2% - 1% - 1% - 0%
Much less likely 1% 0% 1% 0% 0% 1% 1% 0% 1% 1% 1% 0% 0% 0% - 1% - 0% - 0%
Not sure / don’t know 6% 3% 5% 3% 4% 6% 5% 7% 6% 4% 8% 8% 6% 6% - 4% - 6% - 7%
The extent to which packaging made from recyclable materials influence consumers’ purchasing decision
This is the same with packaging made from recyclable materials

EDELMAN INTELLIGENCE
© Pennon Group plc 2019
9 out 10 consumers notice recycling signs on product packaging
Q4G. How often do you notice recycling signs on the packaging of products you buy? [Notice recycling signs; Top 3 Box]2018 Base: All respondents (1,879), Cardiff (319), Glasgow (316), London (302), Manchester (331), Liverpool (304), Birmingham (307). // 2019 Base: All respondents (2,500), Cardiff (300), Glasgow (300), London (300), Manchester (300), Liverpool (300), Birmingham (300), Bristol (300), Taunton (100) Edinburgh (300)
42
UK Cardiff Glasgow London Manchester Liverpool Birmingham Bristol Taunton Edinburgh
2018 2019 2018 2019 2018 2019 2018 2019 2018 2019 2018 2019 2018 2019 2018 2019 2018 2019 2018 2019
Notice recycling signs NET: All the time,, Frequently, Sometimes
91% 93% 91% 94% 92% 93% 94% 95% 89% 94% 90% 93% 90% 90% - 94% - 95% - 91%
All the time 14% 14% 15% 17% 13% 11% 17% 18% 13% 12% 14% 14% 12% 14% - 15% - 7% - 15%
Frequently 36% 37% 38% 34% 36% 39% 37% 40% 34% 39% 36% 45% 38% 32% - 35% - 35% - 34%
Sometimes 30% 31% 29% 32% 32% 31% 27% 30% 33% 31% 28% 26% 29% 31% - 33% - 36% - 34%
Infrequently 11% 11% 9% 11% 11% 11% 13% 8% 10% 11% 12% 8% 10% 13% - 12% - 17% - 8%
Never 6% 4% 7% 4% 5% 4% 3% 2% 9% 4% 6% 5% 7% 7% - 2% - 2% - 7%
Not sure / don’t know 3% 3% 2% 2% 3% 3% 3% 2% 2% 2% 4% 2% 4% 3% - 3% - 3% - 3%
How often consumers notice recycling signs on the packaging of products they buy

EDELMAN INTELLIGENCE
© Pennon Group plc 2019
Q4H. To what extent do you feel recycling labelling on product packaging is easy or confusing to understand? [Easy to understand; Top 2 Box] [Confusing to understand; Bottom 2 Box]2018 Base: All respondents (1,879), Cardiff (319), Glasgow (316), London (302), Manchester (331), Liverpool (304), Birmingham (307).// 2019 Base: All respondents (2,500), Cardiff (300), Glasgow (300), London (300), Manchester (300), Liverpool (300), Birmingham (300), Bristol (300), Taunton (100) Edinburgh (300)
43
UK Cardiff Glasgow London Manchester Liverpool Birmingham Bristol Taunton Edinburgh
2018 2019 2018 2019 2018 2019 2018 2019 2018 2019 2018 2019 2018 2019 2018 2019 2018 2019 2018 2019
Easy NET: very easy, somewhat easy 48% 47% 45% 48% 44% 50% 55% 53% 47% 45% 49% 47% 51% 49% - 43% - 30% - 46%
Very easy 14% 14% 11% 12% 12% 12% 21% 21% 12% 11% 16% 13% 13% 17% - 11% - 7% - 16%
Somewhat easy 34% 33% 34% 35% 32% 38% 34% 32% 35% 34% 33% 34% 38% 33% - 32% - 23% - 30%
Neither easy or confusing 21% 20% 21% 19% 26% 21% 20% 17% 23% 22% 22% 19% 17% 20% - 22% - 24% - 17%
Confusing NET: somewhat confusing, very confusing
26% 30% 30% 31% 27% 27% 21% 28% 27% 31% 24% 31% 29% 25% - 32% - 41% - 33%
Somewhat confusing 20% 24% 24% 24% 21% 20% 15% 22% 22% 25% 18% 24% 22% 23% - 25% - 31% - 25%
Very confusing 6% 6% 6% 7% 6% 7% 6% 7% 5% 6% 6% 7% 7% 2% - 7% - 10% - 8%
Not sure / don’t know 4% 3% 4% 2% 3% 3% 5% 2% 4% 2% 6% 3% 4% 6% - 4% - 5% - 3%
% who feel recycling labelling on product packaging is easy or confusing to understand
More consumers find recycling labelling to be confusing compared to last year
EDELMAN INTELLIGENCE
© Pennon Group plc 2019
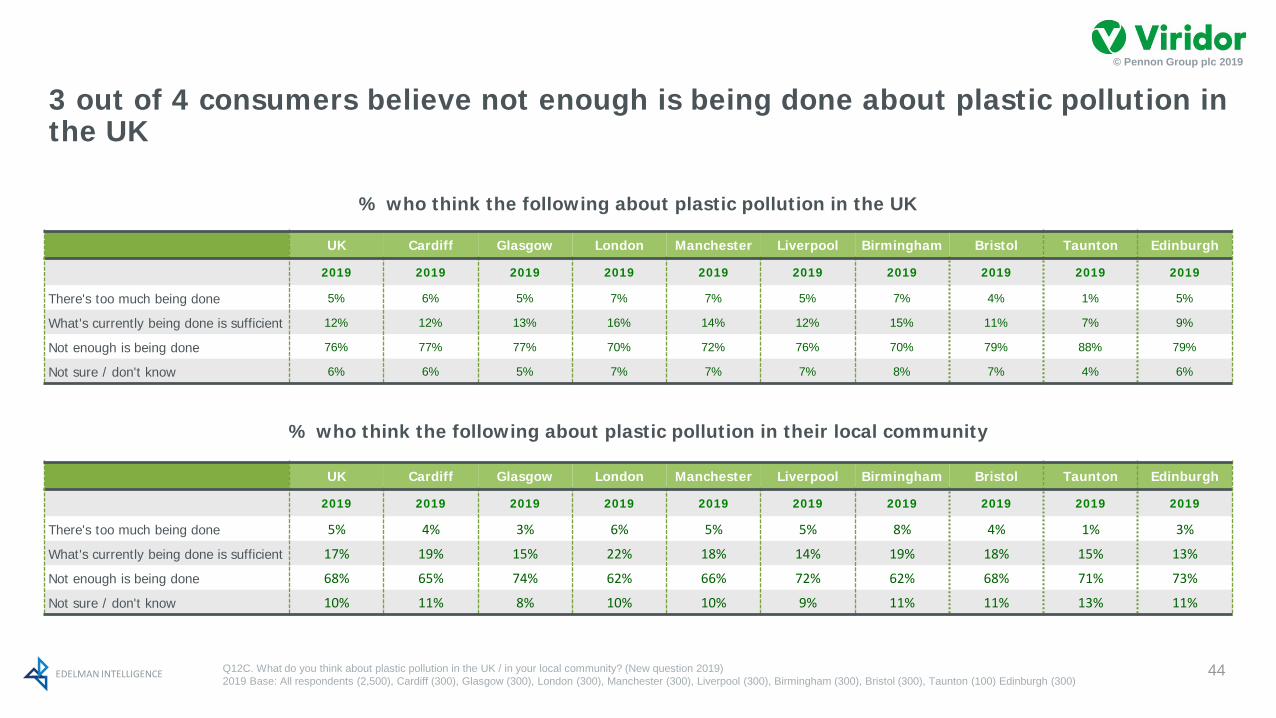
Q12C. What do you think about plastic pollution in the UK / in your local community? (New question 2019) 2019 Base: All respondents (2,500), Cardiff (300), Glasgow (300), London (300), Manchester (300), Liverpool (300), Birmingham (300), Bristol (300), Taunton (100) Edinburgh (300)
44
UK Cardiff Glasgow London Manchester Liverpool Birmingham Bristol Taunton Edinburgh
2019 2019 2019 2019 2019 2019 2019 2019 2019 2019
There's too much being done 5% 6% 5% 7% 7% 5% 7% 4% 1% 5%
What's currently being done is sufficient 12% 12% 13% 16% 14% 12% 15% 11% 7% 9%
Not enough is being done 76% 77% 77% 70% 72% 76% 70% 79% 88% 79%
Not sure / don't know 6% 6% 5% 7% 7% 7% 8% 7% 4% 6%
% who think the following about plastic pollution in the UK
UK Cardiff Glasgow London Manchester Liverpool Birmingham Bristol Taunton Edinburgh
2019 2019 2019 2019 2019 2019 2019 2019 2019 2019
There's too much being done 5% 4% 3% 6% 5% 5% 8% 4% 1% 3%
What's currently being done is sufficient 17% 19% 15% 22% 18% 14% 19% 18% 15% 13%
Not enough is being done 68% 65% 74% 62% 66% 72% 62% 68% 71% 73%
Not sure / don't know 10% 11% 8% 10% 10% 9% 11% 11% 13% 11%
% who think the following about plastic pollution in their local community
3 out of 4 consumers believe not enough is being done about plastic pollution in the UK

EDELMAN INTELLIGENCE
© Pennon Group plc 2019
Q6J. Who do you believe currently pays for the cost of recycling products? 2018 Base: All respondents (1,879), Cardiff (319), Glasgow (316), London (302), Manchester (331), Liverpool (304), Birmingham (307). // 2019 Base: All respondents (2,500), Cardiff (300), Glasgow (300), London (300), Manchester (300), Liverpool (300), Birmingham (300), Bristol (300), Taunton (100) Edinburgh (300)
45
% those who consumers believe are currently paying for the cost of recycling products
UK Cardiff Glasgow London Manchester Liverpool Birmingham Bristol Taunton Edinburgh
2018 2019 2018 2019 2018 2019 2018 2019 2018 2019 2018 2019 2018 2019 2018 2019 2018 2019 2018 2019
Producers / manufacturers of the product
10% 14% 7% 12% 11% 12% 14% 17% 12% 16% 11% 11% 8% 14% - 16% - 9% - 14%
Businesses selling the product 11% 13% 8% 15% 9% 12% 16% 13% 11% 15% 10% 10% 11% 10% - 14% - 11% - 14%
National government 22% 23% 22% 26% 22% 22% 25% 24% 24% 26% 17% 19% 21% 21% - 24% - 15% - 27%
My local council 44% 44% 42% 50% 43% 40% 45% 52% 49% 46% 45% 41% 39% 33% - 43% - 45% - 45%
Tax payers 67% 67% 69% 68% 69% 68% 67% 65% 66% 68% 65% 65% 66% 62% - 69% - 71% - 70%
Other 2% 1% 1% 0% 2% 4% 4% 1% 3% 0% 2% 1% 2% 2% - 1% - 2% - 1%
None of the above 5% 5% 3% 4% 6% 5% 4% 5% 4% 3% 4% 5% 7% 8% - 4% - 5% - 5%
7 out of 10 believe tax payers are paying for the cost of recycling products

EDELMAN INTELLIGENCE
© Pennon Group plc 2019
46
% those who consumers believe should be responsible for paying for the cost of recycling products
UK Cardiff Glasgow London Manchester Liverpool Birmingham Bristol Taunton Edinburgh
2018 2019 2018 2019 2018 2019 2018 2019 2018 2019 2018 2019 2018 2019 2018 2019 2018 2019 2018 2019
Producers / manufacturers of the product
54% 56% 56% 58% 53% 52% 57% 60% 54% 58% 49% 52% 53% 45% - 61% - 61% - 61%
Businesses selling the product
50% 53% 48% 57% 50% 49% 55% 58% 48% 54% 50% 46% 46% 47% - 57% - 50% - 57%
National government
44% 46% 43% 43% 46% 46% 43% 43% 46% 47% 42% 53% 44% 47% - 47% - 32% - 48%
My local council 35% 35% 32% 39% 39% 32% 38% 40% 36% 34% 32% 31% 36% 38% - 33% - 29% - 36%
Tax payers 24% 23% 24% 23% 23% 25% 24% 27% 26% 20% 23% 22% 23% 21% - 23% - 25% - 27%
Other 2% 1% 1% 1% 1% 2% 2% 2% 3% 1% 1% 1% 3% 1% - 1% - 1% - 1%
None of the above 3% 3% 2% 2% 3% 2% 4% 3% 2% 2% 4% 4% 5% 5% - 3% - 3% - 3%
More than half believe that producers/manufactures of or businesses selling the product should be responsible
Q6K. And who do you believe should be responsible for paying for the cost of recycling products? 2018 Base: All respondents (1,879), Cardiff (319), Glasgow (316), London (302), Manchester (331), Liverpool (304), Birmingham (307). // 2019 Base: All respondents (2,500), Cardiff (300), Glasgow (300), London (300), Manchester (300), Liverpool (300), Birmingham (300), Bristol (300), Taunton (100) Edinburgh (300)

EDELMAN INTELLIGENCE
© Pennon Group plc 2019
Q7. How much do you agree or disagree with each of the following statements? [Agree; Top 2 Box in 5pt scale]2018 Base: All respondents (1,879), Cardiff (319), Glasgow (316), London (302), Manchester (331), Liverpool (304), Birmingham (307). // 2019 Base: All respondents (2,500), Cardiff (300), Glasgow (300), London (300), Manchester (300), Liverpool (300), Birmingham (300), Bristol (300), Taunton (100) Edinburgh (300)
47
UK Cardiff Glasgow London Manchester Liverpool Birmingham Bristol Taunton Edinburgh
2018 2019 2018 2019 2018 2019 2018 2019 2018 2019 2018 2019 2018 2019 2018 2019 2018 2019 2018 2019
What I do with my recycling impacts the money my council can spend on other public services (e.g. health, education)
57% 51% 59% 58% 56% 50% 56% 55% 63% 53% 53% 52% 52% 38% - 52% - 52% - 52%
I understand what the term “Right Stuff, Right Bin” means 75% 72% 79% 74% 74% 72% 70% 69% 81% 77% 72% 73% 71% 63% - 73% - 66% - 73%
I am provided with enough information (e.g. by my local council, by the government, by businesses) to know how and what to recycle
54% 46% 61% 55% 44% 39% 59% 49% 61% 55% 46% 43% 51% 37% - 48% - 41% - 44%
My local council do all they can to make recycling simple and easy for me 54% 47% 57% 54% 45% 44% 57% 49% 57% 51% 53% 47% 51% 35% - 48% - 45% - 45%
There is a consistent recycling collection service across the UK 42% 41% 42% 44% 34% 33% 44% 41% 43% 50% 45% 46% 43% 39% - 38% - 34% - 36%
% who agree with each statement
Significant decrease in consumers who say they are provided enough information about recycling

EDELMAN INTELLIGENCE
© Pennon Group plc 2019
Q8. How confident are you that you put all your different materials/waste in the right bins?2018 Base: All respondents (1,879), Cardiff (319), Glasgow (316), London (302), Manchester (331), Liverpool (304), Birmingham (307 // 2019 Base: All respondents (2,500), Cardiff (300), Glasgow (300), London (300), Manchester (300), Liverpool (300), Birmingham (300), Bristol (300), Taunton (100) Edinburgh (300)
48
UK Cardiff Glasgow London Manchester Liverpool Birmingham Bristol Taunton Edinburgh
2018 2019 2018 2019 2018 2019 2018 2019 2018 2019 2018 2019 2018 2019 2018 2019 2018 2019 2018 2019
ConfidentNET: very confident, somewhat confident
84% 82% 86% 85% 80% 81% 85% 81% 88% 86% 81% 81% 83% 78% - 80% - 88% - 81%
Very confident 39% 34% 37% 35% 36% 31% 37% 30% 44% 34% 37% 33% 43% 34% - 39% - 45% - 34%
Somewhat confident 45% 48% 49% 50% 43% 50% 48% 51% 44% 52% 44% 48% 40% 44% - 41% - 43% - 47%
Neither confident or unconfident 9% 10% 8% 9% 12% 9% 8% 13% 6% 6% 12% 10% 9% 15% - 12% - 7% - 9%
Not ConfidentNET: somewhat unconfident, very unconfident
7% 8% 5% 6% 8% 10% 7% 5% 6% 8% 7% 9% 8% 7% - 8% - 5% - 10%
Somewhat unconfident 5% 6% 5% 5% 6% 8% 5% 4% 5% 5% 6% 6% 4% 4% - 7% - 4% - 7%
Very unconfident 2% 2% 0% 1% 2% 2% 2% 1% 1% 3% 2% 3% 4% 2% - 1% - 1% - 3%
Consumers’ confidence in putting different waste in the right bin
The number of people who are ‘very confident’ they put different kinds of waste in the right bin has fallen

EDELMAN INTELLIGENCE
© Pennon Group plc 2019
Q9. How easy or difficult do you find it to tell whether each of the following items is recyclable? [Easy; Top 2 Box in 5pt scale] 2018 Base: All respondents (1,879), Cardiff (319), Glasgow (316), London (302), Manchester (331), Liverpool (304), Birmingham (307). // 2019 Base: All respondents (2,500), Cardiff (300), Glasgow (300), London (300), Manchester (300), Liverpool (300), Birmingham (300), Bristol (300), Taunton (100) Edinburgh (300)
49
UK Cardiff Glasgow London Manchester Liverpool Birmingham Bristol Taunton Edinburgh
2018 2019 2018 2019 2018 2019 2018 2019 2018 2019 2018 2019 2018 2019 2018 2019 2018 2019 2018 2019
Ready meal packaging 48% 44% 53% 48% 49% 43% 51% 44% 43% 40% 48% 44% 45% 46% - 40% - 37% - 48%
Crisp packets 43% 37% 48% 45% 43% 37% 50% 44% 37% 32% 40% 40% 41% 38% - 30% - 22% - 38%
Mobile phones 47% 40% 49% 42% 43% 40% 47% 42% 47% 38% 44% 38% 48% 37% - 41% - 41% - 40%
Batteries 61% 54% 66% 57% 61% 53% 64% 52% 56% 51% 58% 51% 63% 49% - 60% - 59% - 58%
Juice cartons 64% 59% 70% 63% 61% 56% 69% 63% 67% 62% 59% 53% 57% 54% - 62% - 43% - 61%
Old clothes 68% 65% 68% 62% 69% 67% 63% 64% 71% 63% 67% 63% 68% 61% - 65% - 75% - 67%
Tyres 34% 29% 34% 31% 30% 28% 36% 36% 32% 28% 34% 32% 36% 27% - 26% - 25% - 27%
Glass bottles 87% 83% 92% 86% 84% 81% 84% 78% 90% 88% 84% 83% 86% 74% - 85% - 91% - 84%
Light bulbs 37% 33% 40% 35% 30% 31% 43% 42% 36% 33% 37% 36% 35% 32% - 30% - 29% - 30%
Magazines 82% 78% 83% 81% 81% 79% 81% 80% 84% 82% 83% 75% 82% 70% - 77% - 88% - 80%
Disposable plastic bags 54% 46% 58% 52% 53% 46% 60% 51% 47% 40% 54% 50% 55% 47% - 43% - 33% - 46%
Plastic bottles 83% 76% 91% 82% 84% 77% 79% 75% 80% 78% 79% 73% 83% 71% - 76% - 76% - 76%
Plastic packaging (e.g. pots, tubs, trays etc.)
58% 54% 67% 64% 59% 53% 61% 56% 50% 42% 55% 49% 57% 55% - 56% - 39% - 61%
Plastic wrapping 49% 43% 54% 47% 49% 41% 53% 47% 44% 39% 48% 44% 47% 45% - 42% - 27% - 41%
Disposable coffee cups 53% 47% 57% 54% 51% 46% 59% 52% 48% 46% 54% 50% 51% 47% - 39% - 38% - 49%
Plastic straws 50% 47% 55% 50% 51% 49% 53% 55% 43% 43% 50% 47% 51% 45% - 41% - 37% - 53%
Cotton Buds – added 2019 - 32% - 37% - 35% - 37% - 28% - 34% - 33% - 23% - 28% - 33%
% who say it is easy to tell whether each item is recyclable
Glass bottles, magazines and plastic bottles are seen as the easiest items to tell whether they are recyclable

EDELMAN INTELLIGENCE
© Pennon Group plc 2019
Q9. How easy or difficult do you find it to tell whether each of the following items is recyclable? [Difficult; Bottom 2 Box in 5pt scale]2018 Base: All respondents (1,879), Cardiff (319), Glasgow (316), London (302), Manchester (331), Liverpool (304), Birmingham (307). // 2019 Base: All respondents (2,500), Cardiff (300), Glasgow (300), London (300), Manchester (300), Liverpool (300), Birmingham (300), Bristol (300), Taunton (100) Edinburgh (300)
50
UK Cardiff Glasgow London Manchester Liverpool Birmingham Bristol Taunton Edinburgh
2018 2019 2018 2019 2018 2019 2018 2019 2018 2019 2018 2019 2018 2019 2018 2019 2018 2019 2018 2019
Ready meal packaging 32% 34% 27% 32% 55% 35% 28% 29% 40% 40% 33% 35% 35% 28% - 38% - 45% - 35%
Crisp packets 35% 41% 36% 36% 34% 42% 25% 33% 44% 47% 34% 39% 39% 33% - 50% - 51% - 44%
Mobile phones 28% 35% 27% 37% 27% 34% 25% 31% 30% 39% 29% 37% 29% 32% - 33% - 35% - 37%
Batteries 23% 27% 18% 26% 24% 32% 19% 26% 29% 30% 22% 29% 22% 28% - 21% - 18% - 29%
Juice cartons 20% 23% 17% 19% 20% 26% 13% 16% 19% 22% 25% 26% 27% 22% - 21% - 35% - 24%
Old clothes 14% 16% 16% 19% 9% 14% 18% 14% 15% 18% 13% 18% 15% 15% - 18% - 8% - 16%
Tyres 38% 42% 37% 43% 38% 42% 33% 35% 44% 45% 36% 38% 38% 43% - 42% - 49% - 47%
Glass bottles 4% 6% 2% 4% 4% 6% 5% 6% 5% 5% 4% 6% 5% 7% - 5% - 2% - 6%
Light bulbs 40% 44% 40% 46% 42% 44% 35% 38% 44% 45% 36% 40% 39% 41% - 47% - 44% - 47%
Magazines 6% 8% 7% 7% 5% 8% 6% 7% 8% 7% 6% 12% 7% 8% - 8% - 1% - 9%
Disposable plastic bags 26% 32% 23% 28% 26% 32% 20% 25% 34% 37% 26% 29% 28% 28% - 37% - 45% - 37%
Plastic bottles 7% 11% 3% 6% 7% 13% 8% 9% 12% 8% 8% 13% 7% 11% - 12% - 12% - 14%
Plastic packaging (e.g. pots, tubs, trays etc.)
26% 28% 21% 20% 21% 32% 19% 24% 39% 36% 29% 30% 25% 21% - 26% - 44% - 27%
Plastic wrapping 34% 37% 31% 33% 30% 39% 30% 31% 43% 42% 32% 36% 35% 29% - 42% - 51% - 42%
Disposable coffee cups 26% 29% 22% 26% 24% 28% 21% 24% 31% 34% 24% 29% 32% 22% - 36% - 37% - 29%
Plastic straws 30% 34% 25% 34% 28% 36% 25% 27% 40% 40% 30% 34% 33% 27% - 38% - 43% - 34%
Cotton Buds – added 2019 - 43% - 42% - 45% - 36% - 49% - 44% - 35% - 52% - 51% - 43%
% who say it is difficult to tell whether each item is recyclable
Light bulbs and crisp packets are the most difficult to tell whether they are recyclable or not
EDELMAN INTELLIGENCE
© Pennon Group plc 2019
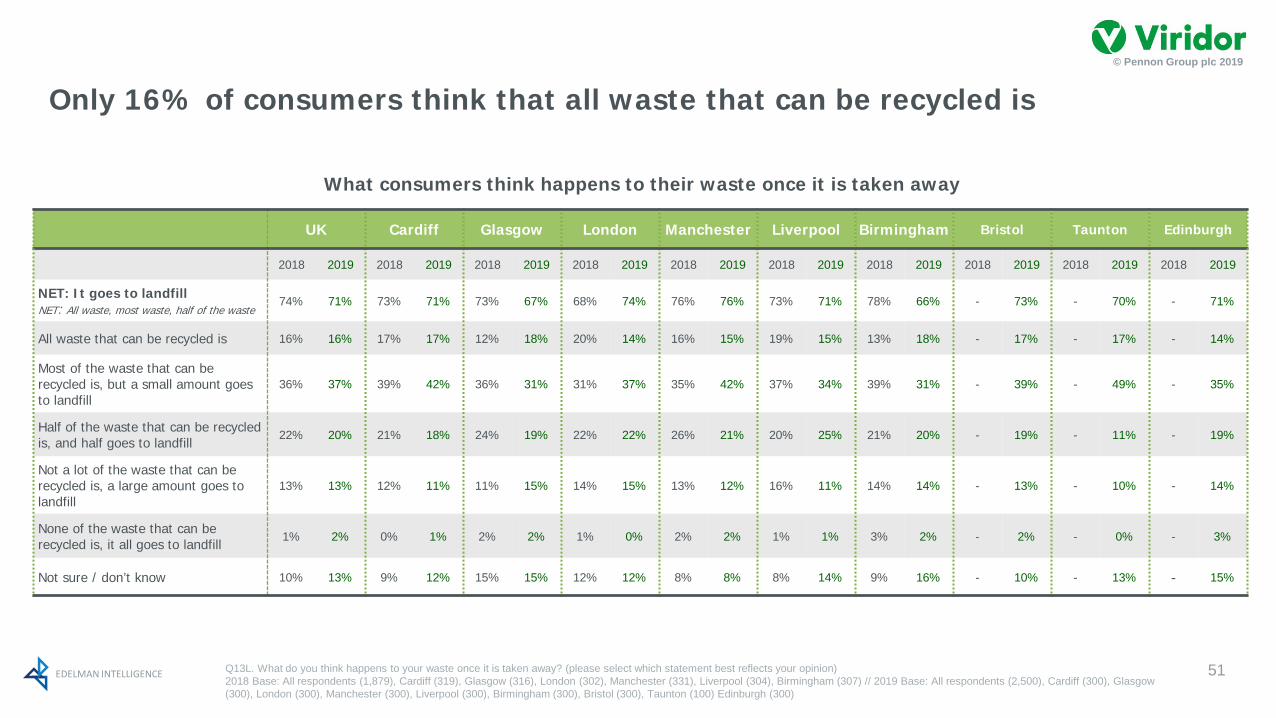
Only 16% of consumers think that all waste that can be recycled is
Q13L. What do you think happens to your waste once it is taken away? (please select which statement best reflects your opinion)2018 Base: All respondents (1,879), Cardiff (319), Glasgow (316), London (302), Manchester (331), Liverpool (304), Birmingham (307) // 2019 Base: All respondents (2,500), Cardiff (300), Glasgow (300), London (300), Manchester (300), Liverpool (300), Birmingham (300), Bristol (300), Taunton (100) Edinburgh (300)
51
UK Cardiff Glasgow London Manchester Liverpool Birmingham Bristol Taunton Edinburgh
2018 2019 2018 2019 2018 2019 2018 2019 2018 2019 2018 2019 2018 2019 2018 2019 2018 2019 2018 2019
NET: It goes to landfill NET: All waste, most waste, half of the waste
74% 71% 73% 71% 73% 67% 68% 74% 76% 76% 73% 71% 78% 66% - 73% - 70% - 71%
All waste that can be recycled is 16% 16% 17% 17% 12% 18% 20% 14% 16% 15% 19% 15% 13% 18% - 17% - 17% - 14%
Most of the waste that can be recycled is, but a small amount goes to landfill
36% 37% 39% 42% 36% 31% 31% 37% 35% 42% 37% 34% 39% 31% - 39% - 49% - 35%
Half of the waste that can be recycled is, and half goes to landfill
22% 20% 21% 18% 24% 19% 22% 22% 26% 21% 20% 25% 21% 20% - 19% - 11% - 19%
Not a lot of the waste that can be recycled is, a large amount goes to landfill
13% 13% 12% 11% 11% 15% 14% 15% 13% 12% 16% 11% 14% 14% - 13% - 10% - 14%
None of the waste that can be recycled is, it all goes to landfill
1% 2% 0% 1% 2% 2% 1% 0% 2% 2% 1% 1% 3% 2% - 2% - 0% - 3%
Not sure / don’t know 10% 13% 9% 12% 15% 15% 12% 12% 8% 8% 8% 14% 9% 16% - 10% - 13% - 15%
What consumers think happens to their waste once it is taken away

EDELMAN INTELLIGENCE
© Pennon Group plc 2019
Q15. The UK recycles approximately 44% of all household waste. What do you think should be done with the other 56% of household waste which isn’t currently recycled?2018 Base: All respondents (1,879), Cardiff (319), Glasgow (316), London (302), Manchester (331), Liverpool (304), Birmingham (307). // 2019 Base: All respondents (2,500), Cardiff (300), Glasgow (300), London (300), Manchester (300), Liverpool (300), Birmingham (300), Bristol (300), Taunton (100) Edinburgh (300)
52
UK Cardiff Glasgow London Manchester Liverpool Birmingham Bristol Taunton Edinburgh
2018 2019 2018 2019 2018 2019 2018 2019 2018 2019 2018 2019 2018 2019 2018 2019 2018 2019 2018 2019
Use it to create energy 83% 82% 89% 88% 83% 87% 77% 80% 84% 80% 81% 79% 83% 75% - 84% - 84% - 81%
Burn it to reduce it down, without creating energy
4% 6% 3% 6% 6% 4% 4% 7% 4% 6% 4% 7% 4% 8% - 5% - 10% - 6%
Bury it underground 3% 3% 2% 1% 3% 2% 6% 4% 3% 4% 3% 3% 2% 3% - 3% - 0% - 4%
Store it in a landfill site 5% 5% 3% 3% 3% 4% 7% 5% 4% 4% 8% 6% 6% 9% - 4% - 1% - 4%
I don’t care what happens to it 2% 1% 1% 1% 2% 1% 2% 1% 2% 3% 2% 0% 1% 1% - 1% - 1% - 1%
None of the above 3% 3% 2% 2% 4% 2% 4% 2% 3% 3% 3% 4% 3% 4% - 3% - 4% - 4%
% who agree each of the following should happen to the 56% of household waste that isn’t currently recycled
Most consumers think waste that is not recycled should be used to create energy

EDELMAN INTELLIGENCE
© Pennon Group plc 2019
Q16. How frustrating, if at all, do you find each of the following are when it comes to recycling? [Frustrating; Top 3 Box] [5-point scale]2018 Base: All respondents (1,879), Cardiff (319), Glasgow (316), London (302), Manchester (331), Liverpool (304), Birmingham (307). // 2019 Base: All respondents (2,500), Cardiff (300), Glasgow (300), London (300), Manchester (300), Liverpool (300), Birmingham (300), Bristol (300), Taunton (100) Edinburgh (300)
53
UK Cardiff Glasgow London Manchester Liverpool Birmingham Bristol Taunton Edinburgh
2018 2019 2018 2019 2018 2019 2018 2019 2018 2019 2018 2019 2018 2019 2018 2019 2018 2019 2018 2019
Knowing what day to put the bins out 40% 43% 43% 37% 43% 48% 45% 39% 40% 46% 42% 42% 40% 45% - 44% - 30% - 48%
Knowing what things I can recycle 72% 74% 71% 75% 76% 79% 71% 68% 72% 74% 71% 76% 69% 73% - 73% - 78% - 76%
Not having enough educational materials available on recycling
72% 76% 70% 73% 77% 79% 67% 68% 71% 78% 74% 77% 74% 81% - 75% - 74% - 79%
That different councils collect waste in different ways (e.g. different colour bins)
66% 68% 65% 69% 69% 70% 61% 64% 71% 70% 63% 63% 64% 67% - 72% - 74% - 68%
Having to wash food off packaging before putting it in the recycling bin
60% 62% 60% 60% 58% 62% 62% 60% 65% 65% 60% 64% 59% 65% - 60% - 44% - 64%
Having multiple bins at home 56% 56% 58% 57% 59% 58% 56% 50% 56% 56% 52% 50% 54% 54% - 61% - 51% - 57%
That different councils can recycle different materials
79% 81% 83% 82% 79% 82% 73% 73% 82% 82% 79% 78% 79% 78% - 87% - 93% - 81%
% who say they are frustrated by the following
There is growing frustration because of the lack of educational materials on recycling

EDELMAN INTELLIGENCE
© Pennon Group plc 2019
Consumers say the top reason why they recycle is because they care for the environment
Q17. Which of the following would you say are the top 3 reasons that you recycle? [Top 1 Summary]2018 Base: All respondents (1,879), Cardiff (319), Glasgow (316), London (302), Manchester (331), Liverpool (304), Birmingham (307) // 2019 Base: All respondents (2,500), Cardiff (300), Glasgow (300), London (300), Manchester (300), Liverpool (300), Birmingham (300), Bristol (300), Taunton (100) Edinburgh (300).
54
UK Cardiff Glasgow London Manchester Liverpool Birmingham Bristol Taunton Edinburgh
2018 2019 2018 2019 2018 2019 2018 2019 2018 2019 2018 2019 2018 2019 2018 2019 2018 2019 2018 2019
Because recycling is a resource that can be used to make new things 18% 14% 19% 15% 21% 14% 15% 15% 17% 15% 19% 14% 15% 14% - 16% - 14% - 12%
Because everyone else in my local community recycles 3% 3% 3% 2% 3% 3% 2% 4% 3% 2% 2% 1% 3% 5% - 4% - 2% - 1%
Because I care about the environment 38% 38% 37% 37% 35% 38% 40% 38% 37% 35% 38% 45% 39% 34% - 41% - 36% - 38%
Because I want to set a good example for future generations 8% 10% 9% 10% 8% 9% 6% 4% 6% 12% 7% 10% 9% 13% - 9% - 13% - 14%
Because I want future generations to grow up in a world that is environmentally safe 21% 22% 19% 24% 21% 24% 23% 24% 20% 23% 21% 18% 20% 21% - 20% - 21% - 21%
Because I feel bad about throwing things away 8% 8% 6% 7% 7% 8% 7% 10% 10% 9% 8% 7% 8% 9% - 6% - 6% - 9%
Because it saves my council money 4% 4% 4% 4% 3% 3% 5% 4% 5% 4% 4% 5% 2% 4% - 3% - 7% - 3%
Other 1% 1% 1% 1% 1% 1% 0% 0% 1% 1% 0% 0% 1% 1% - 1% - 0% - 2%
None of the above 2% 3% 2% 3% 3% 3% 2% 2% 2% 4% 2% 3% 2% 5% - 3% - 1% - 4%
Top reason why consumers say they recycle

EDELMAN INTELLIGENCE
© Pennon Group plc 2019
Consumers say that an easier recycling system and standardised packaging would make them recycle more
Q23B . Which of the following would make you recycle more? [Select all that apply]2018 Base: All respondents (1,879), Cardiff (319), Glasgow (316), London (302), Manchester (331), Liverpool (304), Birmingham (307) // 2019 Base: All respondents (2,500), Cardiff (300), Glasgow (300), London (300), Manchester (300), Liverpool (300), Birmingham (300), Bristol (300), Taunton (100) Edinburgh (300).
55
UK Cardiff Glasgow London Manchester Liverpool Birmingham Bristol Taunton Edinburgh
2018 2019 2018 2019 2018 2019 2018 2019 2018 2019 2018 2019 2018 2019 2018 2019 2018 2019 2018 2019
Financial incentives (i.e. money back or savings on groceries)
44% 42% 43% 43% 45% 40% 47% 40% 47% 46% 42% 39% 41% 41% - 47% - 32% - 46%
An easier recycling system 45% 47% 45% 44% 51% 46% 42% 50% 44% 45% 45% 44% 44% 41% 52% 48% 51%
Standardised packaging (i.e. if all packaging had the same recycling instructions)
53% 48% 55% 53% 55% 47% 49% 45% 56% 50% 52% 46% 50% 39% - 51% - 55% - 55%
If I knew more about which materials are recyclable
43% 45% 38% 44% 45% 46% 42% 44% 40% 48% 46% 45% 45% 41% - 43% - 52% - 49%
If other people knew how much I recycled 5% 6% 4% 6% 3% 8% 9% 8% 6% 6% 5% 6% 5% 10% - 4% - 2% - 5%
Knowing the impact your recycling makes (e.g. how much CO2 you’ve saved or what my recycling turns into)
36% 38% 39% 37% 33% 37% 30% 34% 35% 38% 38% 37% 38% 34% - 40% - 39% - 43%
Knowing how much your neighbours are recycling
5% 6% 2% 8% 3% 4% 7% 8% 6% 7% 5% 6% 7% 7% - 3% - 1% - 5%
If there were more recycling banks near me
29% 31% 24% 28% 30% 35% 31% 31% 31% 25% 30% 32% 28% 28% - 26% - 36% - 38%
Other 2% 2% 1% 2% 2% 2% 3% 2% 4% 0% 2% 1% 2% 0% - 1% - 3% - 3%
None of the above 8% 8% 11% 10% 7% 9% 9% 10% 6% 7% 6% 7% 9% 7% - 9% - 8% - 5%
Things that would encourage consumers to recycle more
EDELMAN INTELLIGENCE
© Pennon Group plc 2019
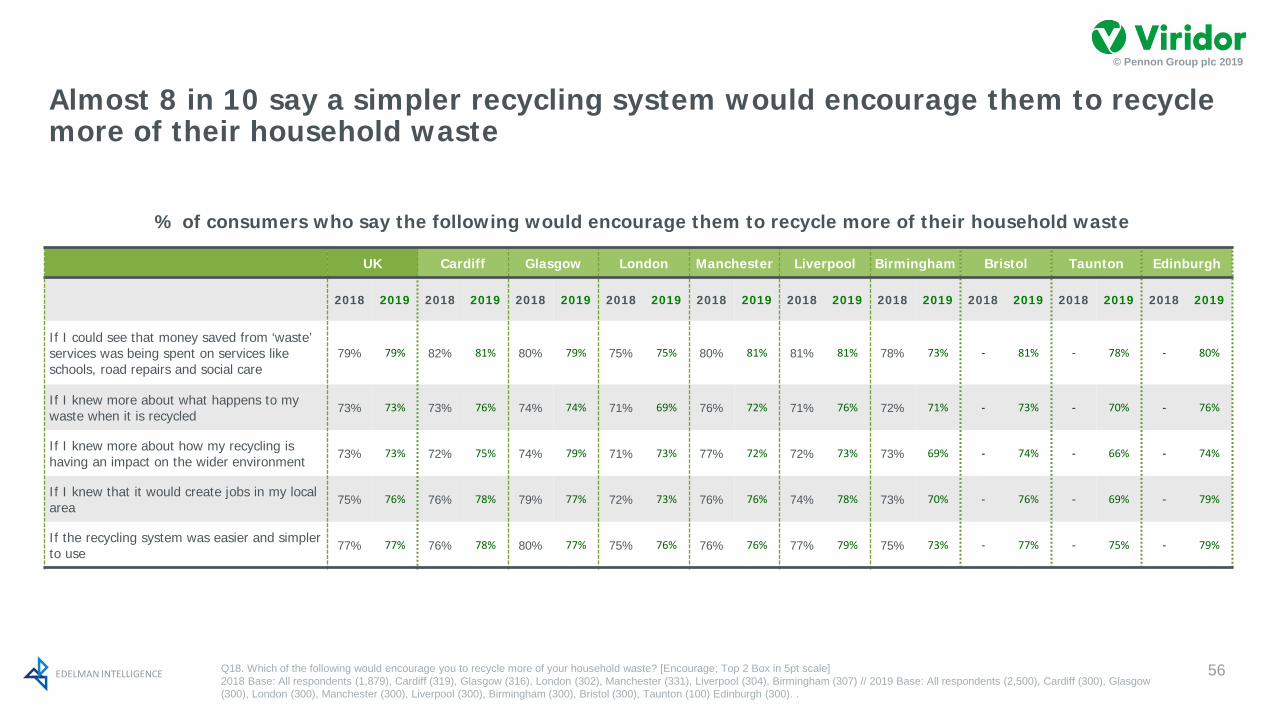
Q18. Which of the following would encourage you to recycle more of your household waste? [Encourage; Top 2 Box in 5pt scale]2018 Base: All respondents (1,879), Cardiff (319), Glasgow (316), London (302), Manchester (331), Liverpool (304), Birmingham (307) // 2019 Base: All respondents (2,500), Cardiff (300), Glasgow (300), London (300), Manchester (300), Liverpool (300), Birmingham (300), Bristol (300), Taunton (100) Edinburgh (300). .
56
UK Cardiff Glasgow London Manchester Liverpool Birmingham Bristol Taunton Edinburgh
2018 2019 2018 2019 2018 2019 2018 2019 2018 2019 2018 2019 2018 2019 2018 2019 2018 2019 2018 2019
If I could see that money saved from ‘waste’ services was being spent on services like schools, road repairs and social care
79% 79% 82% 81% 80% 79% 75% 75% 80% 81% 81% 81% 78% 73% - 81% - 78% - 80%
If I knew more about what happens to my waste when it is recycled
73% 73% 73% 76% 74% 74% 71% 69% 76% 72% 71% 76% 72% 71% - 73% - 70% - 76%
If I knew more about how my recycling is having an impact on the wider environment
73% 73% 72% 75% 74% 79% 71% 73% 77% 72% 72% 73% 73% 69% - 74% - 66% - 74%
If I knew that it would create jobs in my local area
75% 76% 76% 78% 79% 77% 72% 73% 76% 76% 74% 78% 73% 70% - 76% - 69% - 79%
If the recycling system was easier and simpler to use
77% 77% 76% 78% 80% 77% 75% 76% 76% 76% 77% 79% 75% 73% - 77% - 75% - 79%
% of consumers who say the following would encourage them to recycle more of their household waste
Almost 8 in 10 say a simpler recycling system would encourage them to recycle more of their household waste
EDELMAN INTELLIGENCE
© Pennon Group plc 2019
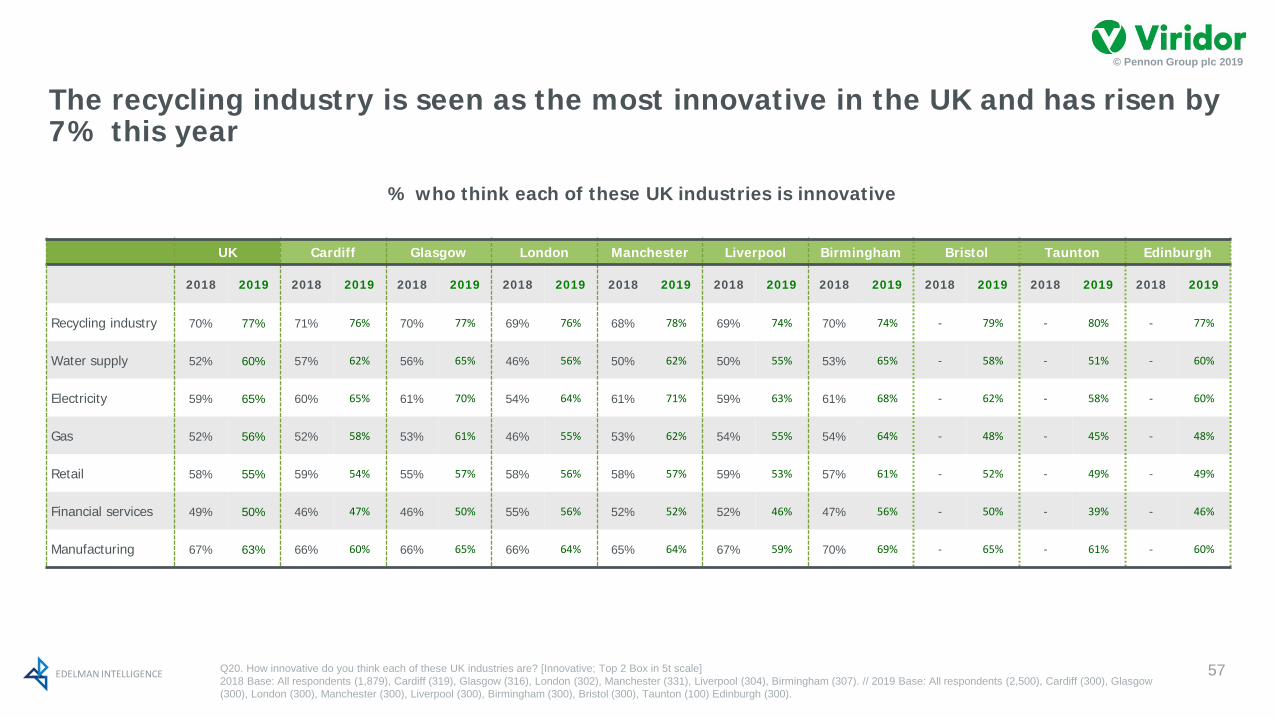
Q20. How innovative do you think each of these UK industries are? [Innovative; Top 2 Box in 5t scale]2018 Base: All respondents (1,879), Cardiff (319), Glasgow (316), London (302), Manchester (331), Liverpool (304), Birmingham (307). // 2019 Base: All respondents (2,500), Cardiff (300), Glasgow (300), London (300), Manchester (300), Liverpool (300), Birmingham (300), Bristol (300), Taunton (100) Edinburgh (300).
57
UK Cardiff Glasgow London Manchester Liverpool Birmingham Bristol Taunton Edinburgh
2018 2019 2018 2019 2018 2019 2018 2019 2018 2019 2018 2019 2018 2019 2018 2019 2018 2019 2018 2019
Recycling industry 70% 77% 71% 76% 70% 77% 69% 76% 68% 78% 69% 74% 70% 74% - 79% - 80% - 77%
Water supply 52% 60% 57% 62% 56% 65% 46% 56% 50% 62% 50% 55% 53% 65% - 58% - 51% - 60%
Electricity 59% 65% 60% 65% 61% 70% 54% 64% 61% 71% 59% 63% 61% 68% - 62% - 58% - 60%
Gas 52% 56% 52% 58% 53% 61% 46% 55% 53% 62% 54% 55% 54% 64% - 48% - 45% - 48%
Retail 58% 55% 59% 54% 55% 57% 58% 56% 58% 57% 59% 53% 57% 61% - 52% - 49% - 49%
Financial services 49% 50% 46% 47% 46% 50% 55% 56% 52% 52% 52% 46% 47% 56% - 50% - 39% - 46%
Manufacturing 67% 63% 66% 60% 66% 65% 66% 64% 65% 64% 67% 59% 70% 69% - 65% - 61% - 60%
% who think each of these UK industries is innovative
The recycling industry is seen as the most innovative in the UK and has risen by 7% this year
EDELMAN INTELLIGENCE
© Pennon Group plc 2019
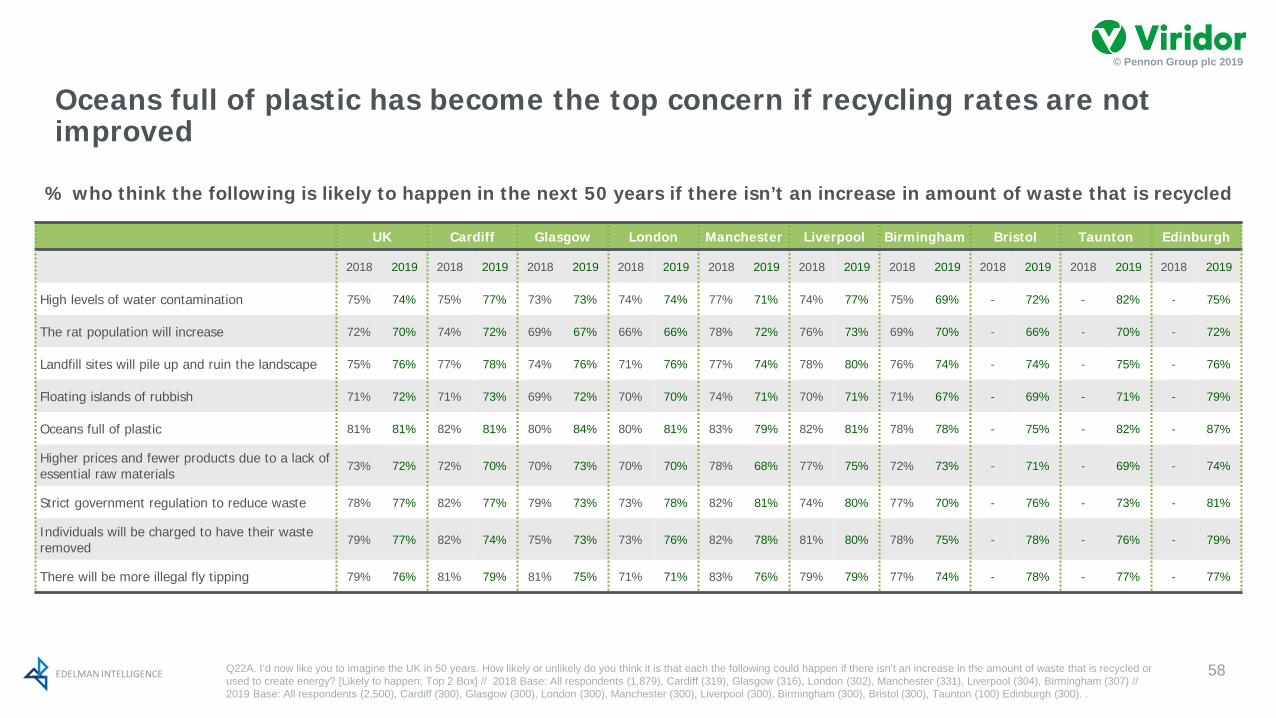
Q22A. I’d now like you to imagine the UK in 50 years. How likely or unlikely do you think it is that each the following could happen if there isn’t an increase in the amount of waste that is recycled or used to create energy? [Likely to happen; Top 2 Box] // 2018 Base: All respondents (1,879), Cardiff (319), Glasgow (316), London (302), Manchester (331), Liverpool (304), Birmingham (307) // 2019 Base: All respondents (2,500), Cardiff (300), Glasgow (300), London (300), Manchester (300), Liverpool (300), Birmingham (300), Bristol (300), Taunton (100) Edinburgh (300). .
58
% who think the following is likely to happen in the next 50 years if there isn’t an increase in amount of waste that is recycled
UK Cardiff Glasgow London Manchester Liverpool Birmingham Bristol Taunton Edinburgh
2018 2019 2018 2019 2018 2019 2018 2019 2018 2019 2018 2019 2018 2019 2018 2019 2018 2019 2018 2019
High levels of water contamination 75% 74% 75% 77% 73% 73% 74% 74% 77% 71% 74% 77% 75% 69% - 72% - 82% - 75%
The rat population will increase 72% 70% 74% 72% 69% 67% 66% 66% 78% 72% 76% 73% 69% 70% - 66% - 70% - 72%
Landfill sites will pile up and ruin the landscape 75% 76% 77% 78% 74% 76% 71% 76% 77% 74% 78% 80% 76% 74% - 74% - 75% - 76%
Floating islands of rubbish 71% 72% 71% 73% 69% 72% 70% 70% 74% 71% 70% 71% 71% 67% - 69% - 71% - 79%
Oceans full of plastic 81% 81% 82% 81% 80% 84% 80% 81% 83% 79% 82% 81% 78% 78% - 75% - 82% - 87%
Higher prices and fewer products due to a lack of essential raw materials
73% 72% 72% 70% 70% 73% 70% 70% 78% 68% 77% 75% 72% 73% - 71% - 69% - 74%
Strict government regulation to reduce waste 78% 77% 82% 77% 79% 73% 73% 78% 82% 81% 74% 80% 77% 70% - 76% - 73% - 81%
Individuals will be charged to have their waste removed
79% 77% 82% 74% 75% 73% 73% 76% 82% 78% 81% 80% 78% 75% - 78% - 76% - 79%
There will be more illegal fly tipping 79% 76% 81% 79% 81% 75% 71% 71% 83% 76% 79% 79% 77% 74% - 78% - 77% - 77%
Oceans full of plastic has become the top concern if recycling rates are not improved

EDELMAN INTELLIGENCE
© Pennon Group plc 2019
Q26. How much do you agree or disagree with each of the following statements when thinking about recycling now and in the future? [Agree; Top 2 Box in 5pt scale]2018 Base: All respondents (1,879), Cardiff (319), Glasgow (316), London (302), Manchester (331), Liverpool (304), Birmingham (307). // 2019 Base: All respondents (2,500), Cardiff (300), Glasgow (300), London (300), Manchester (300), Liverpool (300), Birmingham (300), Bristol (300), Taunton (100) Edinburgh (300).
59
UK Cardiff Glasgow London Manchester Liverpool Birmingham Bristol Taunton Edinburgh
2018 2019 2018 2019 2018 2019 2018 2019 2018 2019 2018 2019 2018 2019 2018 2019 2018 2019 2018 2019
I believe people in my area would take more responsibility for their recycling if they had to pay for it directly, rather it being part of their council tax
63% 66% 60% 64% 66% 73% 63% 62% 66% 67% 62% 72% 60% 65% - 64% - 66% - 63%
Councils should work together to collect the same stuff in the same way around the UK in a national effort to recycle 83% 88% 87% 91% 83% 86% 78% 86% 86% 85% 84% 89% 79% 83% - 90% - 89% - 90%
If we had a consistent recycling collection system around the UK - the same colour bins for the same materials – it would increase UK recycling rates
72% 77% 74% 83% 72% 80% 70% 76% 72% 76% 71% 78% 72% 72% - 78% - 73% - 77%
Individuals should take responsibility for recycling more in the UK if we want to avoid overflowing landfill sites in the future 82% 87% 84% 89% 83% 88% 77% 88% 87% 86% 82% 89% 80% 83% - 87% - 91% - 89%
To manage resources effectively, the UK needs a balance of recycling and turning leftover waste into energy 82% 86% 85% 89% 85% 87% 75% 84% 86% 87% 82% 87% 81% 82% - 87% - 83% - 88%
The recycling industry will become redundant in the future as waste will be ‘designed out’ of products 35% 32% 28% 33% 33% 28% 40% 34% 37% 35% 37% 32% 34% 37% - 31% - 28% - 29%
There should be consistent recycling targets across Great Britain 82% 85% 87% 92% 78% 88% 80% 86% 85% 85% 82% 84% 79% 78% - 84% - 84% - 86%
Housebuilders will design homes with integrated recycling facilities 66% 70% 67% 72% 62% 69% 68% 71% 68% 72% 65% 73% 65% 69% - 72% - 66% - 68%
% who agree with the following when thinking about recycling now and in the future
Significant rise to 9 in 10 who believe councils should collect waste in the same way in a national effort to recycle

EDELMAN INTELLIGENCE
© Pennon Group plc 2019
Q26. How much do you agree or disagree with each of the following statements when thinking about recycling now and in the future? [Agree; Top 2 Box in 5pt scale]2018 Base: All respondents (1,879), Cardiff (319), Glasgow (316), London (302), Manchester (331), Liverpool (304), Birmingham (307). // 2019 Base: All respondents (2,500), Cardiff (300), Glasgow (300), London (300), Manchester (300), Liverpool (300), Birmingham (300), Bristol (300), Taunton (100) Edinburgh (300).
60
UK Cardiff Glasgow London Manchester Liverpool Birmingham Bristol Taunton Edinburgh
2018 2019 2018 2019 2018 2019 2018 2019 2018 2019 2018 2019 2018 2019 2018 2019 2018 2019 2018 2019
Town planners will embed recycling facilities in the heart of communities 63% 69% 61% 68% 60% 70% 63% 72% 69% 67% 65% 72% 57% 63% - 74% - 56% - 68%
The UK should find a way to deal with its own recycling without having to export it to other countries 80% 87% 83% 91% 80% 92% 77% 87% 84% 87% 75% 86% 81% 78% - 86% - 87% - 88%
I am worried about the plastic in the food and water I consume 68% 71% 68% 72% 66% 74% 69% 72% 69% 70% 69% 75% 65% 69% - 72% - 67% - 69%
I am worried about plastics in the ocean 82% 86% 84% 85% 83% 87% 83% 85% 83% 85% 83% 87% 79% 85% - 83% - 85% - 88%
In the future, technology will help make recycling easier, e.g. smart bins that sort waste into categories for recycling - 69% - 70% - 69% - 67% - 70% - 71% - 68% - 70% - 58% - 73%
The UK should deal with its own plastic waste rather than exporting it - 85% - 87% - 88% - 85% - 85% - 85% - 78% - 85% - 86% - 87%
Existing plastic waste should be used to create useful resources that can be used again - 89% - 92% - 91% - 87% - 88% - 89% - 85% - 87% - 89% - 90%
I would pay more for products in recycled packaging - 49% - 52% - 48% - 49% - 45% - 51% - 46% - 51% - 44% - 49%
% who agree with the following when thinking about recycling now and in the future
Significant rise to 9 in 10 who believe the UK should deal with its own recycling without exporting it


