24
UK sugar trade in the global market after Brexit A report by Flint and The European Centre for International Political Economy Completed February 2018

UK sugar trade in the global market after Brexit
A report by Flint and The European Centre for International
Political Economy
Completed February 2018

UK sugar trade in the global market after Brexit
2
Foreword
Brexit is a significant event for trade policy. Businesses in all sectors are looking for clarity
and certainty on specific outcomes from the negotiation of the future relationship between
the UK and the European Union in order to invest. The UK government should ensure that
decisions taken are based on robust evidence and that the impacts of policy choices are
properly understood.
International Sugar Organization (ISO) data shows that approximately 170 million tonnes of
sugar was produced in 2016. This production was in more than 130 countries around the
world; 76% of production was concentrated in the 10 largest sugar producing nations.
Around 15 million tonnes were produced in the EU), which was the third biggest producer
globally.
The UK’s beet sugar industry will need to find its own place in the global market following
Brexit. To help inform the public debate and to support policy makers taking decisions,
Flint and The European Centre for International Political Economy (ECIPE) compare sugar
policy in major sugar producing countries examining the potential implications of Brexit for
the UK beet sugar industry.
This research was conducted with the support of an unrestricted educational grant from AB Sugar. The findings, views and opinions within this report are entirely those of Flint and ECIPE and do not necessarily reflect those of AB Sugar.

UK sugar trade in the global market after Brexit
3
About the Authors
Flint provides advice to business and other organisations, drawing on our extraordinary
blend of international expertise and experience. Flint’s headquarters are in London and we
have a strong presence across Europe.
We work at the point where government and business meet, offering an authoritative
perspective on both. We are active in many sectors including digital, tech, financial
services, life sciences, agri-food, and energy. As former senior leaders and advisers in
government and the private sector, we understand how public policy decisions are made
and we offer deep evidence based analysis of policy and regulatory events at national,
European and international levels.
ECIPE is an independent and non-profit policy research think tank dedicated to trade policy
and other international economic policy issues of importance to Europe.
ECIPE’s intention is to subject international economic policy, particularly in Europe, to
rigorous scrutiny of costs and benefits, and to present conclusions in a concise, readily
accessible form to the European public. We aim to foster a “culture of evaluation” so that
better public awareness and understanding of complex issues in concrete situations can
lead to intelligent discussion and improved policies.

UK sugar trade in the global market after Brexit
4
Executive summary
This paper examines the new trade policy landscape that the UK sugar industry might face
after Brexit.
The UK government has stated that the UK will leave the single market, the EU customs
union and the EU’s Common Agricultural Policy (CAP). This means that it will determine its
own policy on sugar production and sugar trade.
Against this background, this report investigates the following questions:
To what extent is the world sugar market free or distorted? If there are distortions,
what is the level and the nature of these distortions?
What does Brexit mean for UK sugar trade, and what trade arrangements are
needed to create a level playing field for the UK beet sugar industry?
This report addresses these questions in two main ways:
First, it uses a wide range of robust international data sources to look at the rate of
subsidisation in the sugar markets of six of the largest sugar producers and
exporters globally, covering both direct and indirect support measures. For the first
time, the report then makes a quantitative estimate of the extent of this
subsidisation.
Second, it uses the Global Trade Analysis Project (GTAP) model to assess the
impact of Brexit upon UK domestic output and international trade flows in different
policy scenarios, based on the extent to which trade barriers are removed in the
future relationship, and the level of domestic subsidy maintained in the UK.
Level of subsidisation – key research findings:
The report considers data from the International Sugar Organization (ISO), the Organization for Economic Cooperation and Development (OECD), the European Commission (EC), the US Department of Agriculture (USDA), and other national governments. It finds that a range of direct and indirect policy instruments are used to subsidise domestic sugar industries, including direct payments to farmers, price support mechanisms, preferential loans, production quotas and ethanol policy.
Based on this data, the report concludes that the world sugar market is heavily distorted by government interventions. For six of the largest sugar producers globally – the EU, Brazil, USA, India, Thailand and Australia – the report establishes that the average subsidisation rate is 20% of the production value at farm gate.
UK sugar trade in the global market after Brexit
5
There is considerable variation between individual countries – the US subsidisation rate is 66%, while Australia is at 4%. In Brazil, the world’s largest exporter of sugar, the subsidisation rate is 27%, which is linked strongly to ethanol production.
In the EU the subsidisation rate is 18%. This is made up of 7.0% direct ‘uncoupled’ payments to farmers (based on land holdings), 8.5% product specific ‘coupled’ support for sugar producers (concentrated in 11 Member States), and 2.5% general support (covering attendance at trade fairs for example). The Department for Environment, Food & Rural Affairs (Defra) data suggests that the UK has a lower than average rate of subsidisation than the EU, at around 10%, because coupled payments are not applied.
The report also finds that global trade is affected by significant quota and tariff distortions. World Trade Organization (WTO) rules and provisions help correct these distortions to some extent, but like trade in other commodities, sugar trade is often characterised by high import tariffs inherited from the past.
UK impacts from Brexit – key research findings:
The impact Brexit is likely to have on the UK sugar industry and UK sugar trade is
assessed using the GTAP model, an internationally recognised tool for trade policy
analysis. The basis for modelling is an assumption that the UK will leave the single
market and the customs union and agree a free trade agreement (FTA) with the EU.
This is the UK government’s stated objective and the EU has signalled its willingness
to accept these Brexit terms and enter negotiations towards an FTA.
Taking this as the starting point, the model assumes that the UK and the EU will put
in place an FTA providing for duty-free, quota-free trade in goods, including
agriculture, and that UK trade relations with other countries remain unchanged. We
then examine four different scenarios based on assumptions about how frictionless
trade is and the future:
- Removal of agricultural subsidies in the UK: ending direct ‘uncoupled’ payments
to farmers in the UK, making the cost of producing sugar higher in the UK.
- Increase in non-tariff barriers (NTBs): increasing the costs of trade for UK
exporters due to increased transaction costs such as food safety and labelling
standards.
- Removal of agricultural subsidies and an increase in NTBs: combining the two
trade scenarios described above to generate a maximum impact scenario.
- Maintenance of agricultural subsidies in the UK and frictionless trade: this
scenario is not modelled as it is effectively a continuation of current UK-EU
trade.

UK sugar trade in the global market after Brexit
6
The impact on the UK market for refined sugar is relatively small, at less than a 1% change in value of output and consumer prices in all modelled scenarios. In the maximum impact scenario, the value of output falls 0.7% and consumer prices increase by 0.8%. Where there is frictionless trade, but subsidies are removed, the value of output falls 0.4% and prices increase 0.1%. Where subsidies are retained, but NTBs are introduced output falls 0.3% and consumer prices increase 0.7%.
The impact on UK trade flows is almost entirely dependent on what assumption is made about the presence of NTBs. In the two scenarios where NTBs are assumed to increase, imports of sugar decline by approximately 8%, while exports decline by approximately 24%. Given that there is relatively little change in domestic output or price in this scenario, the changes in trade represent a realignment of UK output towards the domestic UK market. In the scenario where trade is frictionless, but UK subsidies are removed, there is only a very small impact on trade, at less than a 1% change in both imports and exports.
Within the two scenarios where NTBs are assumed to increase, there is a significant effect on UK-EU trade flows, with exports and imports both declining by around 45%. There is then a knock-on adjustment in the UK’s trade outside the EU with an increase in imports of around 12% from rest of the world, and an increase of exports to the rest of the world of around 15%. Because existing trade with the five non-EU exporting countries selected for this study is relatively low in volume terms, these percentage changes translate into less significant volumes, although Brazil’s import share would rise slightly.
Conclusions for future trade after Brexit – key research findings:
It is important that the UK takes appropriate steps to ensure that the UK beet sugar industry can compete on a level playing field with heavily subsidised sugar producers and exporters in other countries after Brexit. This should be done in a way that creates maximum certainty for businesses, while minimising market distortion to ensure consumers get a fair deal.
The average value of subsidisation found in the six major sugar producing and exporting countries examined in this report is €110 per tonne. This is calculated by applying the rate of subsidisation in each country to the expected prices and volumes produced by the model. The average value of subsidisation calculation is not materially affected by the different scenarios modelled.
This average value of subsidisation can be thought of as the average tariff that would need to be applied to these countries to offset distortion in their domestic markets, were they not to be subject to quotas. It shows that if the UK unilaterally cut tariffs, the UK beet sugar industry could be placed at a significant and unfair competitive disadvantage.

UK sugar trade in the global market after Brexit
7
The value of subsidisation does, however, vary considerably across the six major sugar producing and exporting countries considered. In the extreme case of the US for example, where there is a 66% subsidisation rate, the equivalent tariff required would be in excess of €500 per tonne. This demonstrates that the UK government would need to carefully consider the anti-competitive nature of high levels of subsidisation before it sought to strike any FTA with a third country outside of the EU after Brexit.
Given the wide range of subsidisation in global partners, and the need to apply one common ‘most favoured nation’ (MFN) tariff, it would be more straightforward for the UK government to replicate the existing EU trade arrangements after Brexit. This could be done by taking the UK’s average share of sugar quotas over the last three years, while also maintaining unrestricted access for Least Developed Countries (LDC) and African, Caribbean and Pacific (ACP) countries.
If the UK reproduced the current EU trade arrangements, there would not be large effects on sugar output and price in the UK market. This would ensure that the UK supply chain is served by a stable and balanced mix of both sugar cane and sugar beet production, and consumers would not lose out. The results also suggest that disruption to trade flows is smallest where there are no NTBs between the UK and the EU are eliminated. The new economic partnership should therefore aim to minimise changes to regulations such as the rules of origin, and ensure that these regulations are applied symmetrically in both the UK and the EU.
If a duty-free, quota-free trade between the EU and the UK cannot be reached for the sugar market, an option to offset the level of subsidisation seen in the EU would be to split the expected import volume into a new tariff rate quota (TRQ) and an out-of-quota volume charged at the EU’s most-favoured nation (MFN) tariff. The TRQ and out-of-quota volume should be set at a level that corresponds, in average terms, to the level of EU sugar subsidisation. Under expected trade flows in the maximum impact scenario, the EU subsidisation value of €110 per tonne could equate for instance to a duty-free quota of 148,000 tonnes and 71,000 tonnes out of quota to which a tariff of €339 per tonne would be applied.
Levelling the playing field by applying countervailing and anti-dumping duties would be difficult to implement and could take several years to put in place. The lack of immediate protection against the highly subsidised competitors found in this report and associated business uncertainty would seriously disrupt the UK’s beet sugar industry. These instruments would be more appropriate to deal with any significant future changes in subsidisation that generates import surges into the UK.
Increasing domestic subsidies for the UK’s sugar beet industry is likely to be an inefficient way of offsetting sugar trade distortions across the world, because it would undermine incentives for domestic productivity and put additional pressure on public finances.

UK sugar trade in the global market after Brexit
8
1. World sugar trade: a highly concentrated market
The first section of the report examines the world sugar market.
1.1. Top world and EU sugar producers
Compared to other crops and commodities, world sugar production is concentrated in a
relatively small number of countries that make up the bulk of output (Graph 1). In 2015,
Brazil accounted for just over 20% of world production. The most significant trend of the
last six years has been India’s rapid rise, primarily driven by growth in their domestic
market. The EU (Graph 2) is the third largest sugar producer in the world, far behind Brazil
and India, but ahead of Thailand and the USA.
Graph 1: Share of world sugar production in 2015
Source: ISO Sugar Yearbook 2016
Graph 2: Main EU sugar producers, 2016-1017 (million tonnes, white sugar equivalent)
Source: European Commission
Brazil 20%
India 17%
EU 9% Thailand
7% Mexico
3%
Russian Fed. 3% Australia
3%
USA 3%
Rest of the world 35%
169 million tonnes
0
10
20
EU-28 France Germany Poland UK Netherlands
Under quota Out of quota Total

UK sugar trade in the global market after Brexit
9
EU production was marked by the legacy of the production quota system which was fully
withdrawn in October 2017. In the marketing year 2016-2017 (i.e. before quotas were
removed) France, Germany, Poland, the UK and the Netherlands were respectively the
EU’s five top sugar producers.
1.2. Main world exporters and EU imports
Graph 3 shows the top exporters of sugar globally between 2009 and 2015. Brazil has been
dominating world sugar trade for decades. Recent trends, nonetheless, show that Thailand
and Australia have improved, and India has jumped from an insignificant trade player status
in the late 2000’s to becoming fourth largest world exporter.
Graph 3: World top exporters of sugar in 2009 and 2015 (million tonnes)
Source: ISO Annual Yearbook 2016
EU imports do not reflect the pattern of exports globally, as they make significant use of
preferential terms of trade (Graph 4). The least developed countries (LDCs) and African,
Caribbean and Pacific (ACP) countries export duty-free sugar to the EU under the
“Everything But Arms” (EBA) initiative and Economic Partnership Agreements (EPA)
respectively.1 Latin American countries benefit from free trade agreements and tariff-rate
quotas. By contrast the USA, India, Thailand and Australia are not among the EU’s main
sugar providers.
The UK is the country which imports the most from EPA-EBA countries at preferential rates
through a duty free quota. In the marketing year 2016-2017 (as of July 2017), it represented
39% of applications for import licences for sugar from EPA-EBA countries, up from 34% the
year before, demonstrating that international supply with the preferential quota is
reasonably responsive to changes in UK demand. This contrasts with France and Germany,
at 10% and 8% respectively.
1 In practice, LCD and ACP countries overlap to a large extent.
0.0
7.5
15.0
22.5
30.0
Brazil Thailand Australia India Guatemala Mexico EU Cuba
2009 2015

UK sugar trade in the global market after Brexit
10
Graph 4: Proportion of EU28 sugar imports by origin in 2016/2017
Source: European Commission
2. Distortions in world sugar markets and trade The second section of the report looks at current distortions to sugar production and the application of trade barriers. This section, for the first time, reviews the evidence from both a quantitative and qualitative point of view. Sugar is one of the most highly distorted agricultural commodity markets. The FAO-OECD Outlook for 2016-2025 predicts that “the sugar sub-sectors in many developed and developing countries will continue to benefit from domestic policy support measures such as high import tariffs, tariff rate quotas, and minimum price support.”2
2.1. Quantitative evidence: identifying subsidisation rates
This report estimates effective subsidisation rates of sugar for the six main sugar producing and exporting countries by collating available data on general agriculture and sugar-specific support measures and quantitatively and qualitatively analysing it. It uses data from the Organization for Economic Cooperation & Development’s (OECD) Producer and Consumer Support Estimates database, the US Department of Agriculture (USDA), the International Sugar Organization (ISO), and the American Sugar Association (ASA) and other sources. Graph 5 gives an overview of the results of the analysis, showing how these six major sugar producing and exporting countries are supporting their domestic industry. Estimates of country-specific subsidisation rates are then obtained by aggregating all identified support measures and comparing them with production values. These rates include government support for sugar, sugar crops, ethanol and as well as the share of
2 OECD-FAO Agricultural Outlook 2016-2025, p. 104
EPA-EBA, 53%
Central America, Columbia, Peru,
12%
Balkans, 7%
Brazil, 4%
Others, 24%

UK sugar trade in the global market after Brexit
11
sugar related products paid in general support or non-product specific agricultural support. The findings of this analysis are presented in Graph 5. Graph 5: Effective Sugar subsidisation rates in six major sugar producing and exporting countries (share of production value at farm gate)
Source: Flint with ECIPE, based on data from OECD (2016) for EU, Australia, USA, Brazil; USDA (2017), ASA (2015) for Thailand; ISO (2015), USDA (2017) and ASA (2016) for India.
2.2. Qualitative evidence: direct and indirect support to domestic production There exists no authoritative comparative study to date, for instance by the WTO or the OECD, on sugar support measures across the world. However, this report finds there is ample evidence of government intervention along the whole supply chain, from crop growing to processing and marketing. Below is a list of seven types of support measures that describes many of the support policies adopted by the world’s largest producers and exporters.
i. Subsidies to cane and beet growers
In the EU subsidies come in two forms: ‘decoupled’ subsidies under on the basis of farmers holding’s surface and their performance in agri-environment programmes, and “voluntary coupled support” in 11 countries in which the sugar beet sector faces difficulties.3 The former does apply specifically to sugar crops, but could help with general farm performance, while the second specifically applies to the production of sugar crops. The UK does not have a policy of coupled support for sugar crops.
In Brazil, the government offers short term subsidies for cane growers when the harvest is low.4 Australia subsidises cane growers to manage nitrogen run-off into the Great
3 European Commission website, https://ec.europa.eu/agriculture/sugar_en
4 USDA Foreign Agriculture Service, Biofuel Annual Report 2016, GAIN Report BR16009

UK sugar trade in the global market after Brexit
12
Barrier Reef lagoon5 and takes temporary support measures whenever necessary, typically after droughts6. Thailand provides supplementary payments to cane growers, and incentives to convert land used for rice production to cane production.7
ii. Minimum price for sugar crops and/or refined sugar
The Government of India sets a high minimum price for cane regardless of the market price of sugar.8 Some Indian states go beyond that price.9 The USA has a loan system in place that guarantee a minimum price to growers and refiners. USDA takes sugar stocks as collateral, and accepts them as repayment means.10
Box 1 gives details of the Thailand case, where a minimum price for sugar was set by the government. In January 2017, the government raised the minimum price by 30% in line with increasing sugar world market prices.11 However, this is expected to come to an end following a challenge by Brazil. Box 1 Brazil’s WTO challenge against Thailand sugar policy
In April 2016, Brazil filed a request for consultations in the WTO regarding Thailand’s
sugar subsidies. The document supporting the request claimed that Thailand “strictly
controls virtually every aspect of its sugar sector, including the production, storage,
transport, sale, import, export, and other activities applicable to cane, raw sugar, white
sugar, molasses, and sugar by-products”. In response, the Thai government announced
that price subsidies and direct payments to cane growers would be abandoned. An
executive order suspending the price control clause in the Cane and Sugar Act B.E.
2527 (1984) resulted in the local price of sugar being floated by the Thai government in
January 2018.
iii. Supply or sales quotas
Production or sales quotas aim to control the volume of sugar that can be sold on domestic markets. The EU moved away from a system of production quotas in October 2017 as part of the final phase of CAP reforms. In the US, ‘market allotments’ equate to a quota system, but are only implemented when supply (both domestic and imported) is likely to exceed domestic demand.12
5 Australian Government website, Department of the Energy and Environment, Reef Trust Programme 6 Australian Government website, Department of Agriculture and Water Resources, Drought and Rural Assistance Programme 7 USDA Foreign Agriculture Service, Thailand Sugar Annual 2016, GAIN Report TH6040
8 International Crops Research Institute for Semi-Arid Tropics, Sugar and cane pricing and regulation in India by
Amarender Reddy published on the International Sugar Journal 2011 Vol. 113, NO. 1352 9 USDA Foreign Agriculture Service, India Sugar Annual 2017, GAIN Report IN7045
10 USDA website, Economic Research Service
11 USDA Foreign Agriculture Service, Thailand Sugar Annual 2017, GAIN Report Number TH7045
12 USDA website, Economic Research Service

UK sugar trade in the global market after Brexit
13
iv. Ethanol policy
This is a powerful channel of support for the global sugar industry. Brazil’s ‘sugar-ethanol industry’ is the most significant case of ethanol based support and is analysed in detail in Box 2. In 2015, India’s National Policy on Biofuels has set a target of 20% blending of biofuels, both for bio-diesel and bioethanol. In 2016, it achieved an average blending rate of close to 5%.13 This has been accompanied by incentives for flex-fuel vehicles and subsidised loans have been offered to millers who invest in ethanol production. In the US, the Feedstock Flexibility Program for Bioenergy Producers ensures that defaulted sugar stocks are diverted to ethanol production.
Box 2: Brazil’s sugar ethanol industry
Since 1975, the Brazilian government has not only been setting a mandatory blend rate
of ethanol into petrol, typically between 20 and 25%, but also (via Petrobras, the state-
own oil company) sets petrol prices and fuel taxes. Car owners are also barred from
buying diesel-fueled cars by government regulations. Ethanol’s tax rate has been
systematically lower than the rate applied to petrol. This has created a large market for
ethanol, which have led to significant economies of scale for sugar producers. In
2017/2018, these polices led to 52% of Brazil’s sucrose is used for ethanol production.
v. Loans or debt financing facilities
Australia, Brazil and India all resort to this type of indirect support. In Brazil, the ProRenova programme run by the Brazilian Development Bank (BNDS) provides a credit line to help producers to replant sugar cane every five years.14
vi. Import licences and ‘single desks selling’
In Australia, the industry has long been running a “single desk export marketing function”. This translates into indirect government support for sugar contracting, export prices, storage, shipping and trading arrangements.15
vii. General service support
13
“Fuel Blending in India: learnings and way forward”, UPES, CSTEP and PLR Chambers, 2016 14
“BNDES Prorenova provides supports of R$ 4 billion for renovation and implementation of sugarcane
farms”, BNDES website, November 2012 15
Australian government, Department of Agriculture and Water Resources website
UK sugar trade in the global market after Brexit
14
All countries offer support to farmers in the form of R&D funding, training, promotion, storage, etc. This is typically the least common denominator for government policies, and not specific to sugar. As a result, it can be regarded as a more benign source of market distortion.
2.3. Tariffs and trade instruments Agriculture and commodities have traditionally been an area in which countries have extensively used tariffs and duties. Since the 1995 Uruguay Round Agreement on Agriculture, the WTO has limited the extent to which individual countries can discriminate against imports. However, for historical reasons and given the discretion retained by WTO members, trade in commodities is still characterised by significant distortions. Commonly applied trade policy tools are explored below.
Most-favoured nation (MFN) tariffs
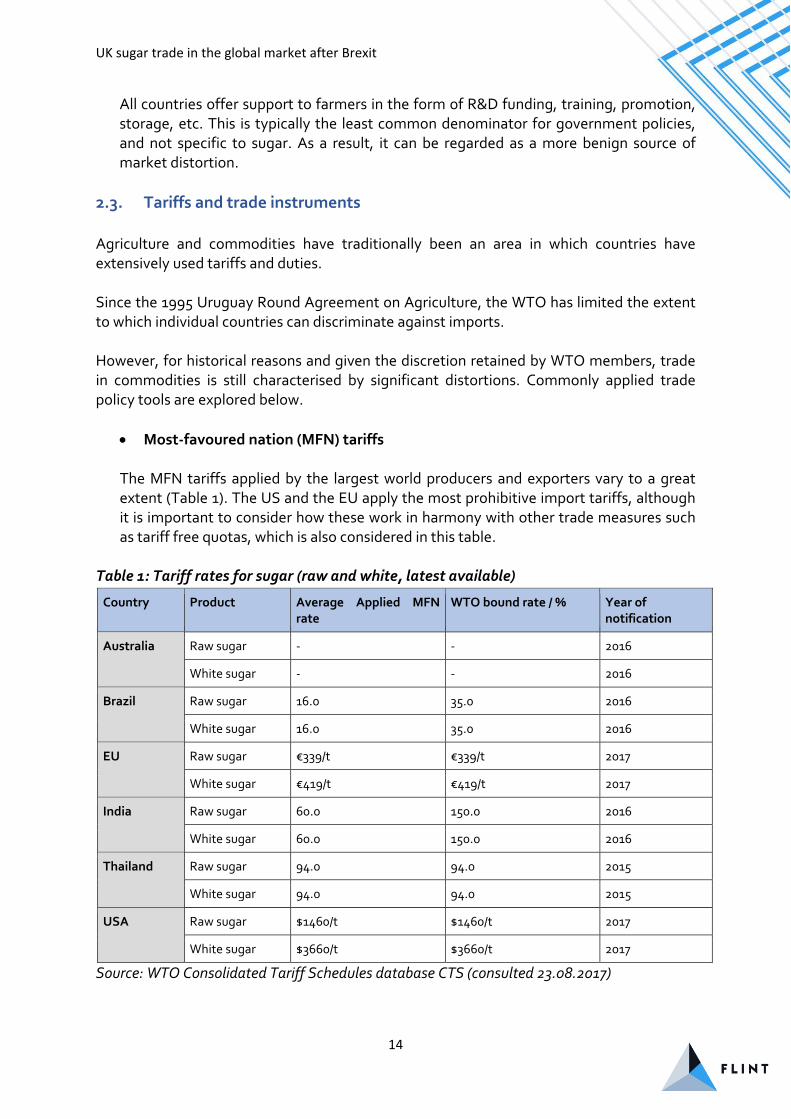
The MFN tariffs applied by the largest world producers and exporters vary to a great extent (Table 1). The US and the EU apply the most prohibitive import tariffs, although it is important to consider how these work in harmony with other trade measures such as tariff free quotas, which is also considered in this table.
Table 1: Tariff rates for sugar (raw and white, latest available)
Country Product Average Applied MFN rate
WTO bound rate / % Year of notification
Australia Raw sugar - - 2016
White sugar - - 2016
Brazil Raw sugar 16.0 35.0 2016
White sugar 16.0 35.0 2016
EU Raw sugar €339/t €339/t 2017
White sugar €419/t €419/t 2017
India Raw sugar 60.0 150.0 2016
White sugar 60.0 150.0 2016
Thailand Raw sugar 94.0 94.0 2015
White sugar 94.0 94.0 2015
USA Raw sugar $1460/t $1460/t 2017
White sugar $3660/t $3660/t 2017
Source: WTO Consolidated Tariff Schedules database CTS (consulted 23.08.2017)

UK sugar trade in the global market after Brexit
15
Preferential trade: the EU example
Most EU imports take place under preferential terms (Table 2). The EU imports raw sugar at a €98 per tonne tariff from countries such as Brazil under the CXL quota. It imports tariff-free from Serbia under the Balkans quota. It imports duty-free, quota free from the ACP (EPA)/LCD (EBA) countries. A third group of exporters to the EU includes countries under a free trade agreement with the EU such as Colombia, Peru, Central America and the Ukraine.
Table 2: EU preferential tariffs structure (2016)
Region Product Country Quantity (kt) Duty
CXL Raw sugar
Brazil 334
€98/t Erga omnes 254
Cuba 69
Australia 10
India 10 -
Balkans Beet white sugar Serbia 114 -
EU FTAs in place
Raw or white Central America 186 -
Raw or white Colombia 71 -
Raw or white Peru 25 -
Raw or white Georgia 8 -
White sugar Moldova 37 -
Raw or white Ukraine 20 -
Raw, white up to 50kt SADC 150 -
Raw, white up to 10kt Ecuador 25 -
EPA-EBA Raw Various 2m (5 year average) -
Source: European Commission
WTO instruments against subsidies
The WTO has regulated the actions governments can take to counter the effects of subsidies. One option is to use the WTO’s dispute settlement procedure to seek the withdrawal of the market distorting measure, or to seek the removal of its adverse effect. This is the tool Brazil used in 2016 to launch a challenge against Thailand’s export subsidies.

UK sugar trade in the global market after Brexit
16
A second option is for the country to take anti-dumping measures or to charge a ‘countervailing duty’ on unfairly subsidised exports. In 2014, the US threatened to charge a countervailing duty against Mexico before an agreement limiting Mexico’s sugar exports to the US was found. The agreement also set a minimum price for Mexican sugar sold on the US market.16
Maintaining MFN tariffs is not a first best solution to dealing with market distorting subsidisation, where the withdrawal of the market distorting measure should always be the objective. However, where there is a long history of market distortion it can be defensible as a more reliable and appropriate solution than relying on temporary countervailing duties or dispute settlement.
3. Sugar trade after Brexit: modelling exercise The third section of the report presents estimates the potential impact of Brexit on the UK
sugar market.
3.1. Simulating the impact of Brexit ECIPE have simulated the impact of Brexit using the Global Trade Analysis Project (GTAP) model, which has a long history of being used to analyse the potential impact of changes in international trade policy. Governments (including the US, Japan, Canada, and the European Commission) have commissioned studies based on the model and used their results to explain the impact of FTAs that are negotiated. The model compares the global economy before and after changing certain policies (such as the UK leaving the EU) and estimates impacts from the changes in import tariffs, prices or productivity. It is composed of a set of equations which link the production and consumption within or between countries. In other words, the equations calculate how much or less of a good or a service is produced and consumed by consumers and businesses in the UK, and from where they are most likely to be sourced. Thus, when trade barriers are altered between the EU and the UK, the model equations seek a new “equilibrium” – in other words how the global economy adapts to the change. They model is therefore able to help us assess which economic sectors decrease or increase their production, and how might imports and exports rise or fall. The data contained in the model is very detailed and takes into account a range of economic considerations, including how each industrial sector uses labour and capital, and
16
USDA website, Economic Research Service

UK sugar trade in the global market after Brexit
17
what level of protection does each country provide its different industrial sectors. However, like any applied economic model, it must simplify the complexity of the economy. The model is used to assess the impact of Brexit upon UK domestic output and
international trade flows in different policy scenarios, based on the extent to which trade
barriers are removed in the future relationship, and the level of domestic subsidy that is
maintained in the UK. The model is based on most recent FTAs and on estimates of trade
barriers imposed by the EU on other countries today. These simulations help us to draw
conclusions on how the UK might make trade arrangements after Brexit.
3.2. Brexit assumptions
In order to estimate the impact of Brexit on UK sugar industry, we make a number of assumptions on the future EU-UK trade relationship, on the UK production’s level of farming subsidisation, as well as on the UK and EU future relationship with third countries. This allows us to consider four different scenarios:
- Removal of agricultural subsidies in the UK: ending direct ‘uncoupled’ payments
to farmers in the UK, making the cost of producing sugar higher in the UK.
- Increase in non-tariff barriers (NTBs): increasing the costs of trade for UK
exporters due to increased transaction costs such as food safety and labelling
standards.
- Removal of agricultural subsidies and an increase in NTBs: combining the two
trade scenarios described above, to generate a maximum impact scenario.
- Maintenance of agricultural subsidies in the UK and frictionless trade: this
scenario is not modelled as it is effectively a continuation of current UK-EU
trade.
We explore each of these main assumptions in detail below.
An EU-UK free trade agreement
We assume that the UK will leave the Single Market and the Customs Union, and will seek to finalise a free trade agreement with the EU. This should translate into duty-free, quota-free trade in all crops and food products, including refined sugar. Tariff-free, quota-free trade does not necessarily prevent new costs arising from non-tariff barriers, though. These could arise in areas of regulatory divergence, for instance in sanitary and phytosanitary regulations, and rules of origin.
Where we assume NTBs, the cost difference between EU membership and free trade agreement is estimated to be approximately 42% on agriculture and food products. Here ECIPE used standard modelling assumptions common to EU FTA impact
UK sugar trade in the global market after Brexit
18
assessments. Research17 shows that agriculture and food NTBs are estimated to be around 56.8%. However, only 30.1% were deemed “actionable” (the part of the cost that can be removed through liberalisation) while 26.7% are non-actionable. The standard practice is such that a very ambitious FTA cuts the actionable part by 50%. This generates the assumption of 42%.
It is also reasonable to argue that NTBs in an EU-UK FTA are likely to be lower as the starting point is convergence, rather than divergence. Given this we also model a scenario where there are no NTBs.
The removal of most agriculture subsidies in the UK
With the end of sugar quotas in October 2017 EU sugar policies have gone through significant change. Nonetheless, the EU sugar sector still benefits from decoupled direct payments and from coupled support in 11 countries. As well as this, some specific measures such as private storage aid and collective bargaining support continue to apply. Taking all these measures together, we calculated that EU subsidisation amounts to 18% of sugar production value (see section 2.1 above).
The UK has a lower rate of subsidisation than the EU average, mostly because it does not offer coupled payments to support sugar production. The UK subsidisation rate is approximately 10%, calculated from 2016 Defra data and assuming that sugar crops receive an average level of uncoupled support per hectare.18
We note that the UK government has a stated objective to remove or reform agricultural subsidisation that is currently awarded to farmers in the UK under the CAP19. However, we also note that the UK government has also indicated that any changes are unlikely to be forthcoming before 2022, and that there would be a substantial transition period thereafter20.
Given these points we model two scenarios. Firstly, that the UK will over time remove almost all levels of existing direct ‘uncoupled’ agricultural subsidisation, but will retain general services support at around 2%. This includes research, education, sanitary, marketing and promotion expenses. Secondly, we assess the maintenance of subsidies in the UK at their current level. These two scenarios allow us to test the maximum impact Brexit could have.
All third country relations and conditions are assumed to be "as-is"
17
ECORYS, “Non-Tariff Measures in EU-US Trade and Investment – An Economic Analysis”, Report DG Trade,
European Commission, December 2009 (http://trade.ec.europa.eu/doclib/docs/2009/december/tradoc_145613.pdf) 18 See data in: https://www.gov.uk/government/uploads/system/uploads/attachment_data/file/672119/AUK-2016-08jan18.pdf 19 http://www.bbc.co.uk/news/uk-politics-42559845 20
Michael Gove, “The Unfrozen Moment – Delivering a Green Brexit”, 21 July 2017, UK government website,
https://www.gov.uk/government/speeches/the-unfrozen-moment-delivering-a-green-brexit

UK sugar trade in the global market after Brexit
19
The modelling exercise takes EU and UK trade relationships with third countries as they are today. This assumes on the one hand that the EU will not change preferential trade patterns, e.g. with EBA-EPA countries, nor sign new free trade agreements. On the other hand, the UK continues to benefit from EU FTAs benefits. We do not factor in new free trade agreements. We look at the impact of Brexit on UK trade assuming the UK applies current EU preferential and MFN tariffs.
3.3. Brexit simulation findings
Table 3 below presents the headline impacts on the UK economy under the 3 scenarios
considered, while Table 4 provides a more detailed analysis of import and export changes
with the 6 major sugar producing countries considered in this report.
Table 3: Headline impacts on the UK economy under 3 Brexit scenarios
Impacts on the UK economy
Product NTBs increased & UK subsidies removed / % change
NTBs increased & UK subsidies retained / % change
No NTBs & UK subsidies removed / % change
Industry Output Sugar crops -0.6 -0.3 -0.4
Processed Sugar -0.7 -0.3 -0.4
Aggregate Exports Sugar crops -48.2 -43.8 -7.7
Processed Sugar -24.0 -23.6 -0.5
Aggregate Imports Sugar crops -5.1 -7.3 2.5
Processed Sugar -7.6 -7.6 0.0
Consumer prices Sugar crops -0.1 -1.8 1.7
Processed Sugar 0.8 0.7 0.1
Source: ECIPE modelling for Flint
Table 4: Detailed impacts on UK with major sugar producing and exporting countries
under 3 Brexit scenarios
Detailed trade impacts EU27 BRA THA USA IND AUS
UK imports of processed sugar
NTBs increased & UK subsidies removed / % change
-45.0 12.0 12.1 12.3 12.2 12.1
NTBs increased & UK subsidies retained / % change
-45.0 12.0 12.0 12.2 12.1 12.1
No NTBs & UK subsidies removed / % change
0.0 0.0 0.0 0.1 0.1 0.1
UK exports of processed sugar
NTBs increased & UK subsidies removed / % change
-44.7 15.2 15.2 14.7 13.8 14.3
NTBs increased & UK subsidies retained / % change
-44.4 15.9 15.9 15.4 14.4 15.0
No NTBs & UK subsidies removed / % change
-0.5 -0.6 -0.6 -0.6 -0.5 -0.5
Source: ECIPE modelling for Flint
Interpreting these scenarios, we can conclude the following:
UK sugar trade in the global market after Brexit
20
The impact on the UK market for refined sugar is relatively small, at less than a 1% change in value of output and consumer prices in all modelled scenarios. Where there is frictionless trade, but subsidies are removed, the value of output falls 0.4% and prices increase 0.1%. This is due to the increased cost of agricultural production. Where subsidies are retained, but NTBs are introduced output falls 0.3% and consumer prices increase 0.7%. This is because the cost of trade has increased. Combining both effects, in the maximum impact scenario, the value of output falls 0.7% and consumer prices increase by 0.8%.
Removal of subsidisation has only a very small impact, at less than a 1% change in both imports and exports. This is a reasonable result given that the UK starts from a point of relatively low subsidisation. Where NTBs arise, the impact on UK trade flows is relatively strong. In both scenarios (with and without the removal of subsidisation in the UK) imports of sugar decline by approximately 8%, while exports decline by approximately 24%. Given that, in these two scenarios, UK output and price is relatively stable, the model is suggesting a realignment of UK output towards the domestic UK market will occur.
Within the two scenarios in which NTB arise, there is a greater effect than average effect on UK-EU trade flows, with exports and imports both declining by around 45%. This is to be expected, given that the increase in NTBs is between these two trading areas. There is then a knock-on adjustment in the UK’s trade outside the EU, with an increase in imports of around 12% from the rest of the world, and an increase of exports to the rest of the world of around 15%. For the other 5 major producing and exporting countries considered in this report, these percentage changes are less significant because the current trade flow is relatively low in volume terms, although Brazil’s import share would rise slightly.
The model is quite sensitive to changes in NTBs in the UK’s future economic partnership, but less sensitive to changes in UK subsidisation. There are a number of intermediate scenarios that could be modelled between “no NTBs” and “full NTBs”, and between “no change to uncoupled payments” and “removal of uncoupled payments”. These are not presented here, but ECIPE conclude that there is a roughly linear relationship between these variables.
3.4. Calculating subsidisation levels as base for new tariff In order to offset support mechanisms applied elsewhere, and create a level playing field for international competition, the UK beet sugar industry would need to benefit from tariff levels corresponding to the subsidisation rates in the UK’s main import partners. This study, for the first time, provides an estimate of the financial value of government subsidisation in UK sugar trade partners after Brexit. From these figures, it becomes possible to obtain an approximate tariff level that could be applied to imports into the UK in order to offset subsidisation levels.

UK sugar trade in the global market after Brexit
21
To do so, we weight the general subsidisation rates by the expected post-Brexit production volumes and their actual customs value price in the maximum impact scenario. This results into a subsidy level by imported tonne after Brexit as set out in Table 5. The figures presented are not materially affected by the use of different of production volumes and customs value prices – they are driven by the share of production value at farm gate. We assume continuity with current preferential access for EBA-EPA countries. Table 5: Sugar Subsidisation levels in six UK trade partners
Country By share of production value at farm gate
By imported volume post-Brexit / € per tonne
EU 18% 110
Australia 4% 10
US 66% > 500
Thailand 34% > 500
Brazil 27% 110
India 15% 160
Average 20% 110
Source: Flint with ECIPE, based on data from OECD (2016) for EU, Australia, US, Brazil; USDA (2017), ASA (2015) for Thailand; ISO (2015), USDA (2017) and ASA (2015-2016) for India The subsidisation level on imports into the UK amounts to approximately €110 per tonne. Coincidentally, the figure turns out to be the same for the EU and Brazilian subsidisation rates (the Brazilian subsidisation rate is higher, but its sugar is cheaper so the result in Euros per tonne is roughly the same). This average value of subsidisation can be thought of as the average tariff that would need to be applied to these countries to offset distortion in their domestic markets were they not to be subject to quotas. It shows that if the UK unilaterally cut tariffs, the UK beet sugar industry could be placed at a significant and unfair competitive disadvantage. Given that rates of subsidisation vary considerably between the countries examined in this report, the average effective tariff on sugar imports that would be needed to put the UK beet sugar industry on a level playing field also varies considerably by country. The findings show Australian imported sugar is by far the least subsidized, while Indian, Brazilian and EU imported sugar will be heavily subsidized. In the extreme cases of the US (66% subsidisation rate) and Thai (34% subsidisation rate) the equivalent tariff required would be in excess of €500 per tonne. WTO rules state that when one country lowers a trade barrier or opens up a market, it has to treat all trading partners equally. This is known as the most-favoured nation (MFN) clause. The variation in the subsidisation level could create difficulties for the UK if it was to seek to apply a single tariff as the only means of creating a level playing field between the UK and third countries after Brexit. Utilizing a single tariff would mean that some countries

UK sugar trade in the global market after Brexit
22
with low subsidisation were unfairly penalized, while other countries with high subsidisation were still allowed to compete unfairly.
3.5. Post-Brexit subsidisation rates and post-Brexit tariffs
This section aims to determine how good a model for post-Brexit tariffs is provided by the existing EU tariff level structure. Should the UK try to approximate this structure or, on the contrary, do existing subsidisation rates suggest a significant departure from it? Given the wide range of subsidisation in global partners, and the need to apply one common MFN tariff under WTO rules, it would be much more straightforward and effective for the UK government to replicate existing EU trade arrangements after Brexit. To do this, the UK could apply the system as the EU currently does, with preferential tariff-rate quotas (TRQs) on the one hand, and an out-of-quota MFN tariff on the other, taking an appropriate share of the EU’s total quota volume. This share of EU TRQs could be apportioned between the EU and the UK on the basis of a 3 year average. As Table 6 below shows, under this arrangement, the UK would be likely to inherit a significant share of the EU CXL quota, which represents 791 kilo tonnes in 2017/2018, generally charged at €98/t. It is also worth noting that the EU has agreed on a number of duty-free TRQs in the last few years in the context of new FTAs, for instance with Central America, Colombia, Peru, Ukraine and the South African Development Community. Overall, these new TRQ amount to 522 kt. We would also expect the duty-free, quota-free preferential access for LDC and ACP countries to continue to apply. Table 6: UK share of EU CXL quota based on 3 years average (2014-1017)
Country UK share of quota
Australia 33%
Brazil 15%
India 3%
Erga omnes 20%
Source: Eurostat The calculation results in average tariff levels post-Brexit for the main UK sugar import partners as follows in Table 7. Table 7: Average tariff levels after Brexit compared with subsidisation rates
Country In quota volume (kt)
In quota duty / € per tonne
Out of quota volume (kt)
Out-of-quota duty / € per tonne
Effective tariff post-Brexit / € per tonne
Subsidisation rate post-Brexit / € per tonne

UK sugar trade in the global market after Brexit
23
Australia 3,275 98 7,846 339 270 10
Brazil 50,108 98 43,132 339 210 110
India 300 - 292 339 170 160
Erga omnes 50,795 98 123,216 339 270 n/a
Source: ECIPE for Flint We find first that Australia, Brazil and India will pay effective tariffs above their subsidisation rates. In other words, Australia, Brazil and India’s subsidisation levels will be offset by the preferential and MFN tariffs after Brexit. Since they will, in part, draw from the ‘erga omnes’ tariff, Thailand and US effective tariff rates will be approximately 270 €/t, at a considerably lower level than their subsidisation rates. However, Thailand and the US will together account for 0.5% of total UK imports post-Brexit due to their lack of price competitiveness. Were this to change in the future, due to further increases in subsidisation for example, an option for the UK would be to request charging anti-dumping or countervailing duties against these countries to maintain a level playing field. This demonstrates that replicating the EU’s existing trade structure for the UK will be effective in preventing UK industry from being exposed to unfair competition after Brexit. Although the analysis shows that the existing quota regime is not a perfect counterbalance to subsidisation levels in major sugar producing and exporting countries, the scenarios considered show that there is limited impact (less than 1%) on domestic prices. There would also be an opportunity for an increase in supply from the LDC and ACP countries with preferential access. Together, this would ensure that the UK supply chain is served by a stable and balanced mix of both sugar cane and sugar beet production, and that UK consumers would not lose out.
3.6. Other policy options for future EU-UK trade The UK government is likely to seek duty-free, quota-free trade with the EU, given the competitiveness of the UK sugar industry. However, if there was political willingness to offset EU agricultural subsidisation after Brexit (at €110 per tonne), an option would be to split the expected import volume after Brexit into a new TRQ and an out-of-quota volume charged at the EU MFN tariff of €339 per tonne. With a duty-free quota of 148,000 tonnes and 71,000 tonnes out-of-quota, the EU27 would pay an effective tariff rate equivalent to their subsidisation rate. This calculation is sensitive to the assumption made about NTBs. Without NTBs there would be a higher flow of trade between the UK and the EU. Assuming trade continued uninterrupted, the duty-free quota could be set at 269,000 tonnes and 129,000 tonnes out of quota. There are alternative trade barriers that could be used to offset the impact of subsidies in third countries, but these instruments are not likely to be as effective.

UK sugar trade in the global market after Brexit
24
Using domestic subsidies for the UK’s sugar beet industry would be an inefficient way of offsetting sugar trade distortions across the world, because it would undermine incentives for domestic productivity and put additional pressure on public finances. As opposed to domestic subsidies, external trade barriers interfere less with competition, innovation and productivity growth in domestic markets. In some specific cases, anti-dumping measures are necessary to establish a level playing field. However, anti-dumping measures must follow a difficult determination process at the WTO, and are often subject to lengthy and complex justification procedures. The lack of immediate protection against subsidised competitors after Brexit would unfairly threaten domestic industries and not give them the certainty that they need to investment in the long term.
3.7. Synthesis of the main findings
Brexit is likely to result in a decrease in UK-EU bilateral sugar trade due to the cost of NTBs in an UK-EU FTA scenario, although the extent to which this will transpire is uncertain and will depend how comprehensively the FTA between the UK and the EU can address issues of regulatory divergence. The knock-on impact of less UK-EU bilateral trade is likely to be a realignment of UK production to the domestic market, and an increase in imports from the UK’s main sugar trade partners, including Brazil and the LDC and ACP countries.
Post-Brexit, the weighted average subsidisation level of the largest UK sugar importers (EU27, Australia, USA, India, Brazil, India), will be €110 per tonne. €110 per tonne therefore constitutes a benchmark against which the UK could apply a new tariff system on sugar imports outside of preferential access countries. This roughly corresponds to the subsidisation level of the EU27 and Brazil, but Australia subsidies are at a much lower level, while India, and above all Thailand and the US, subsidies at a much higher level. This illustrates the difficulty of using a single MFN tariff to create a level international playing field on which UK industry can compete.
The UK would be much better served by replicating existing EU tariffs, in order to honour its WTO commitments and provide stability and certainty for both the UK industry and the consumer through the domestic supply chain. Future divergence from these rules, for example due to the UK striking new trade deals with third countries, could be assessed on a case by case basis with appropriate consideration given to the sugar policy environment of the trading partner. Alternatively, were subsidisation rates to increase this to change in the future, and unfairly threaten the UK market, the UK would be able to consider additional policy instruments such as the imposition of countervailing duties.


