UK Technical Advisory Group on the Water Framework Directive Technical report on groundwater dependent terrestrial ecosystem (GWDTE) threshold values. 1. Background and Aim The Water Framework Directive (WFD) sets out objectives for the water environment. These include the protection, enhancement and restoration of surface water, groundwater and water dependent protected areas and prevention of deterioration. Environmental standards and conditions are needed to set the level of control to meet these objectives. For example, how much water can be abstracted, or how much of a pollutant can enter the environment, without causing harm to the health of aquatic plants and animals - harm that would compromise the achievement of the Directive’s objectives. The UK Technical Advisory Group (UKTAG), comprising representatives of the UK environment and conservation agencies, is responsible for providing advice on technical aspects of the WFD to the UK administrations. The UKTAG Wetland Task Team (WTT) provides technical advice on wetland aspects of WFD implementation to the UKTAG. Groundwater dependent terrestrial ecosystems (GWDTE) are wetlands which critically depend on groundwater flows and /or chemistries (WG-C; Schutten et al, 2011). As part of the assessment of groundwater status, we are required to assess if a GWDTE has been significantly damaged and if the pressure causing this damage has been transmitted via a groundwater body. The magnitude of damage (i.e. ‘significance’) is related to the societal (conservation in UK) importance of the features of the wetlands and the degree of change to these features resulting from the pressure (WG-C; Schutten et al, 2011). Threshold values are needed to determine what groundwater concentrations of chemicals, if exceeded, would indicate a pressure that could be (or actually is) causing damage to the GWDTE. In practise the values are used as a risk screen to trigger further investigation where needed. A combination of a damaged GWDTE (such as failure to meet conservation objectives) and exceedance of the relevant threshold values triggers further investigations (see groundwater chapter of the UKTAG consultation document; UKTAG 2012). These investigations need to confirm whether damage has occurred, substantiate the hydrogeological and hydrochemical pathway(s) between the groundwater body and GWDTE, and the outcome would inform groundwater body status assessment. This technical report is defined by the UKTAG. It documents the principles to be adopted by agencies responsible for implementing the Water Framework Directive (WFD) in the UK. This method will evolve as it is tested, with this report being amended accordingly. Working Paper Version: V8; 23 March 2012 Status: final for consultation Classification schemes, UKTAG WFD Requirement: regulation, environmental Review: Standards, groundwater, wetlands
Transcript
UK Technical Advisory Group on the Water Framework Directive
Technical report on groundwater dependent terrestrial ecosystem (GWDTE) threshold
values.
1. Background and Aim The Water Framework Directive (WFD) sets out objectives for the water environment. These include the protection, enhancement and restoration of surface water, groundwater and water dependent protected areas and prevention of deterioration. Environmental standards and conditions are needed to set the level of control to meet these objectives. For example, how much water can be abstracted, or how much of a pollutant can enter the environment, without causing harm to the health of aquatic plants and animals
- harm that would compromise the achievement of the Directive’s objectives. The UK Technical Advisory Group (UKTAG), comprising representatives of the UK environment and conservation agencies, is responsible for providing advice on technical aspects of the WFD to the UK administrations. The UKTAG Wetland Task Team (WTT) provides technical advice on wetland aspects of WFD implementation to the UKTAG. Groundwater dependent terrestrial ecosystems (GWDTE) are wetlands which critically depend on groundwater flows and /or chemistries (WG-C; Schutten et al, 2011). As part of the assessment of groundwater status, we are required to assess if a GWDTE has been significantly damaged and if the pressure causing this damage has been transmitted via a groundwater body. The magnitude of damage (i.e. ‘significance’) is related to the societal (conservation in UK) importance of the features of the wetlands and the degree of change to these features resulting from the pressure (WG-C; Schutten et al, 2011). Threshold values are needed to determine what groundwater concentrations of chemicals, if exceeded, would indicate a pressure that could be (or actually is) causing damage to the GWDTE. In practise the values are used as a risk screen to trigger further investigation where needed. A combination of a damaged GWDTE (such as failure to meet conservation objectives) and exceedance of the relevant threshold values triggers further investigations (see groundwater chapter of the UKTAG consultation document; UKTAG 2012). These investigations need to confirm whether damage has occurred, substantiate the hydrogeological and hydrochemical pathway(s) between the groundwater body and GWDTE, and the outcome would inform groundwater body status assessment.
This technical report is defined by the UKTAG. It documents the principles to be adopted by agencies responsible for implementing the Water Framework Directive (WFD) in the UK. This method will evolve as it is tested, with this report being amended accordingly.
Working Paper Version: V8; 23 March 2012 Status: final for consultation Classification schemes, UKTAG
This report explains how we have derived the GWDTE threshold values and sets out how the knowledge underpinning them can be improved in the future This technical report has benefitted from the peer review that was carried out by two academic consultants (Professor A.J. Davy at UEA, Norwich and Professor M. C. Acreman at CEH, Wallingford).
Aim of this paper A. To explain what the threshold values (TVs) are B. To outline the technical development of wetland threshold values C. To underpin the UKTAG standards consultation paper (UKTAG, 2012)
2. What is a GWDTE threshold value?
Groundwater dependent terrestrial ecosystem (GWDTE) threshold values (TVs) are groundwater chemical concentrations which have been derived from empirical evidence. GWDTE threshold values have been developed to ascertain whether or not there is a risk to the health of a GWDTE from pressures in a groundwater body. Wetlands are not identified as water bodies under WFD, and as such they do not have a formal status classification. In contrast, discrete areas of groundwater in an aquifer can be designated as groundwater bodies, and are subject to classification under WFD. One of the criteria set out in WFD for groundwater body classification is whether a groundwater body is causing significant damage to a dependent terrestrial ecosystem (wetland). Therefore, the thresholds in this document aim to protect the groundwater dependent wetland ecology but are applied to the groundwater body upon which the wetland depends. These TVs have implications for both wetland management and groundwater management, but the receptor in both cases is the groundwater dependent wetland. The TVs are used as follows (see also UKTAG stakeholder consultation document; UKTAG 2012):
1. As part of the identification and prioritisation of impacts i.e. the classification of groundwater bodies.
2. To prevent deterioration in status of the groundwater body from new activities. 3. To help design restoration measures to restore the groundwater body to good status.
It was proposed to develop chemical TVs for nitrate and phosphate because:
The macronutrients N and P are the major chemical pollutants that impact on groundwater dependent wetlands; (e.g. Holman et al, 2008; De Schrijver et al, 2011)
nutrient pressures are some of the most widespread pressures in groundwater bodies (and identified as reasons for poor status in groundwater bodies during the first cycle of river basin planning); (e.g.Howden et al, 2011) and
Standards for other relevant chemicals may be developed in the future as more information becomes available.
3. Why are nutrients a risk to GWDTEs and what damage can they cause?
Plants are a main focus of the conservation interest of wetlands and the vegetation provides the matrix in which many characteristic animals and plants thrive. Wetland plants exhibit a range of strategies which enable them to survive waterlogging, flooding and low nutrient status conditions (Kroeselman and Verhoeven et al, 1995) and can therefore outcompete less adapted species.
In general, higher nature conservation value is given to wetlands characteristic of low nutrient settings. These wetlands tend to be associated with a high species diversity per unit area, and in
general support more rare species than wetlands in higher nutrient settings. In a lowland context, low nutrient wetlands are particularly highly valued because they are rare. Experience shows that these lowland sites are particularly vulnerable to nutrient enrichment.
Changing nutrient conditions, and in particular enrichment, can change the relative competitive ability of individual plant species and can result in:
degradation or complete loss of high value species and communities;
a change of plant communities within the wetland;
increasing dominance of particular plant species that are responsive to elevated levels of nutrients (e.g. common reed, nettle); and
changes in the structure of particular plant communities (such as reedbeds) that affect their function as a habitat for birds or insects.
As a result of these changes, nutrient enrichment can affect the conservation interest and condition of the wetland (JNCC, 2004), and thereby can influence the status of the groundwater body (see section 2).
4. Where does the nutrient pressure come from? Nutrients can enter wetlands via a number of routes, these include any one or a combination of the following (see Figure 1):
1. aerial deposition (dry and wet); 2. surface water (during flooding events when adsorbed to particulate material and/or
dissolved in water) and through lateral water movement in the soil where the wetland abuts the surface water body
3. groundwater (dissolved nutrients); 4. direct deposition (such as spreading of fertiliser or spreading of soil improver); 5. re-mineralised nutrients within the wetland.
Figure 1. Schematic cross section, showing the various sources of nutrient input to wetlands (numbers refer to the nutrient sources identified above; the stars refer to the data-sets we used to define wetland TV’s (A = groundwater body and B = within wetland)
Groundwater body
Wetland
GWDTE
1
2
4
5
A B 3
5. Nutrient related wetland categories Wetland systems can be divided into a range of nutrient based (or trophic) classes based on the nutrient availability of their soils (Wheeler & Proctor, 2000). There are other drivers that affect wetland type, such as management, but for the current work we have focused on nutrients. Different wetland types will have different dominant water sources and thus different exposure to nutrients (Wheeler et al 2004; Wheeler et al 2009). For example, wetlands fed by regular over-topping of rivers in comparatively fertile lowland situations tend to support productive vegetation dominated by a relatively few nutrient responsive species. By contrast, groundwater-fed wetlands are less likely to be exposed to a significant nutrient pressure and are therefore characterised by less productive vegetation. Predominantly rain-fed systems (such as bogs) are not naturally exposed to elevated nutrient concentrations and tend to be highly infertile and acidic. The UKTAG Wetland Task team has grouped wetlands into 11 broad categories that take into account trophic classes and ecology according to the following criteria:
Dominant water source (rain / surface and groundwater);
Landscape setting (valley bottom, slope etc);
Intrinsic wetland sensitivity (based upon expert knowledge). These categories are:
1. Quaking bog 2. Wet dune 3. Fen (mesotrophic) and Fen Meadow 4. Fen (oligotrophic) and wetlands at tufa forming springs 5. Wet grassland 6. Wet heath 7. Peatbog and woodland on peatbog 8. Wetland directly irrigated by spring or seepage 9. Swamp (mesotrophic) and reedbed 10. Swamp (oligotrophic) 11. Wet woodland
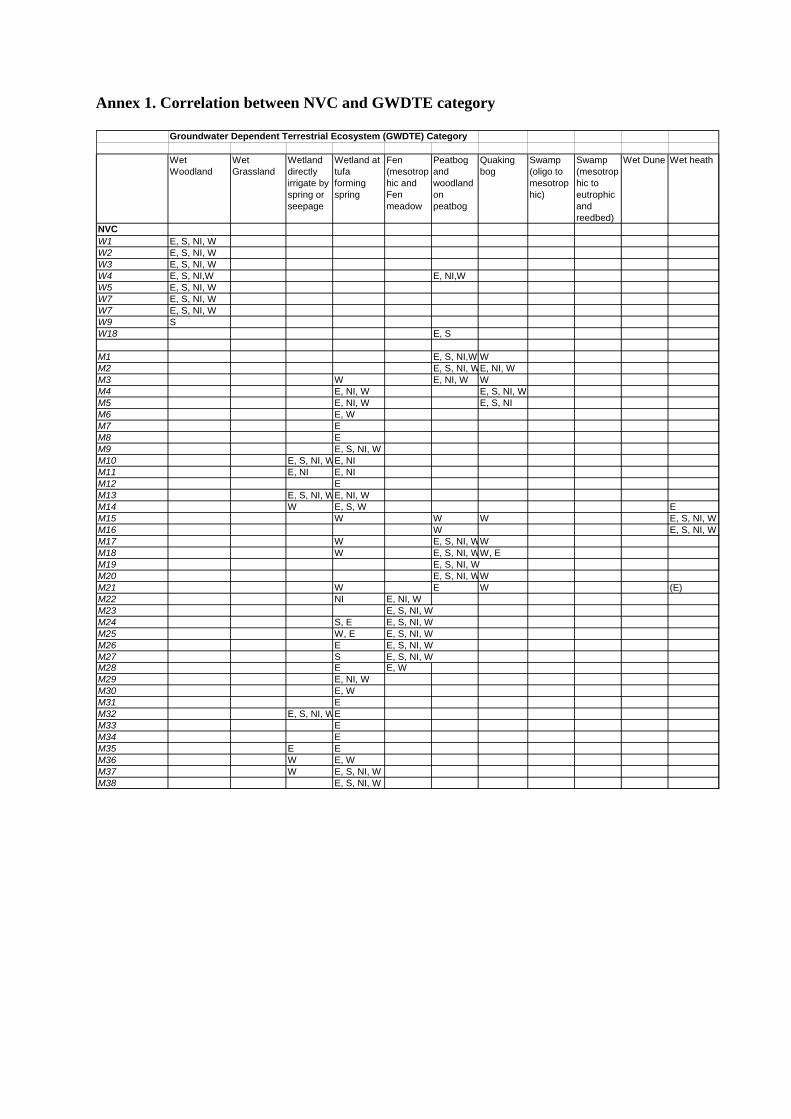
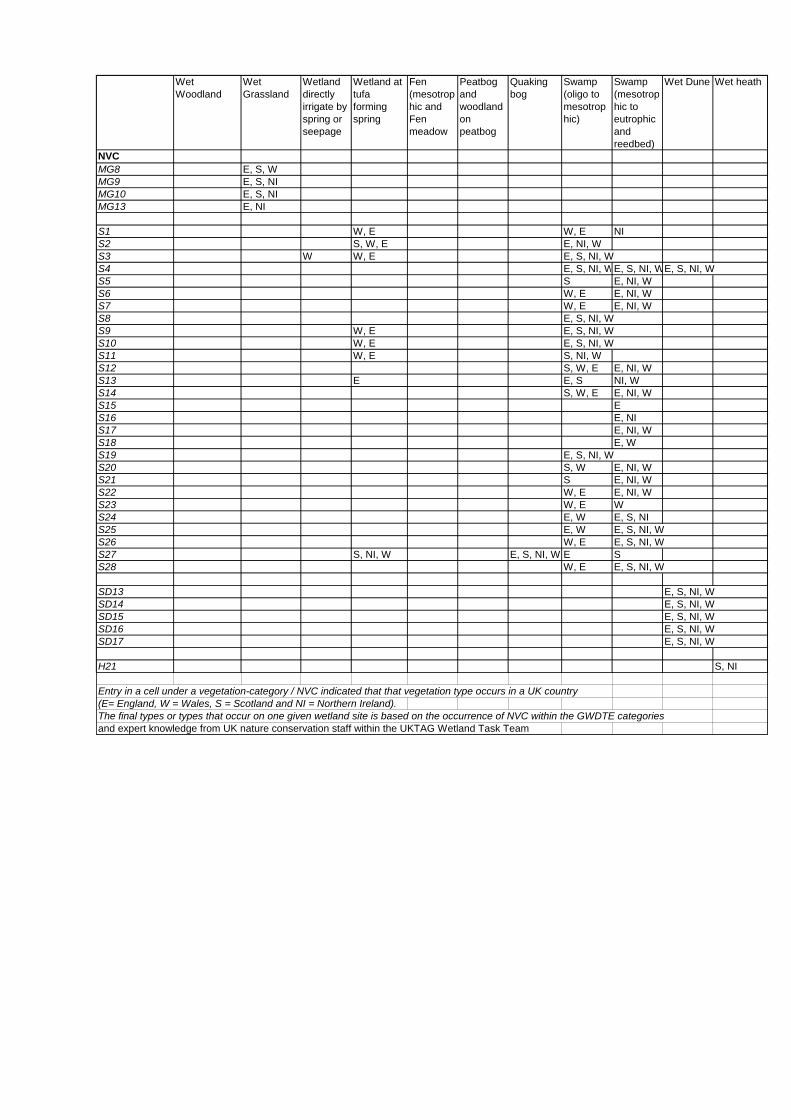
These categories are adapted from a functional wetland typology developed for Scotland (SNIFFER 2009) and relate to the more detailed National Vegetation Classification (NVC) and wider Natura 2000 feature types (see Annex 1). The number of distinct wetland categories that are defined is related to the quantity of available wetland data on which the proposed TV’s are based. A subdivision between those that occur naturally at locations with more elevated nutrient concentrations has been made where appropriate using expert knowledge from within the WTT The resulting wetland classes are still quite broad and it is therefore possible that the same category can contain a different set of species or species dominance at different altitudes.
6. Development of the GWDTE threshold values The wetland chemical groundwater TVs were developed using three sources of information, these were: 1: Empirical correlation between wetland condition and chemistry data for hydrogeologically linked groundwater bodies across the UK (A in fig 1) 2. Site specific investigations (B in fig 1) 3. Other published databases and literature. These are introduced in turn below. 6.1. Empirical correlation between wetland condition and chemistry data for hydrogeologically linked groundwater bodies across the UK Wetlands across England, Wales and Scotland judged to be critically dependent on groundwater were identified during the first cycle of the WFD. For this analysis only those that were designated under European (Special Areas of Conservation) or national legislation (Sites of Special Scientific Interest/ASSI) were included.
Any groundwater quality monitoring boreholes within 2 km of these sites were identified. The sites were evaluated, using local hydrogeological expertise, to determine linkage/s between the groundwater monitoring point/s and the wetland/s. Only 180 sites had a clear hydrogeological linkage and a high degree of confidence in this linkage. These were used in further analyses.
For each of these sites, the 6-yearly mean groundwater chemical concentrations were calculated from 2000 - 2005 data (the data used for groundwater body classification in the first River Basin Management Plans). If 6-yearly mean values were not available, shorter quality assured datasets with a minimum of 3 years were used.
Figure 2. Location of wetlands that were used in the empirical correlation
Wetlands can contain several different wetland categories (GWDTE’s), for example a wetland fed by groundwater discharge can have a ‘Wetland directly fed by spring or seepage’, a ‘Fen (Oligotrophic)’ and a ‘swamp (mesotrophic)’ where the wetland abuts a lake.
The various GWDTEs within the 180 wetlands were assigned into vegetation categories (see section 5, above) and this resulted in 474 GWDTE’s that we used in the further analysis.
For GWDTEs that were in good ecological condition (approximately two-thirds of the data); mean and 75th percentile concentrations were calculated for nitrate (as N, mg/l) and phosphate (as P, mg/l) in the monitoring point linked to the GWDTE. The condition of each GWDTE was measured using the relevant JNCC common Standards for Monitoring (JNCC, 2004) and was carried out by the nature conservation organisations. Where a site was in favourable condition we have inferred that the groundwater is not currently causing significant damage. This is, in a sense, a conservative approach because sites under some nutrient pressure could be placed into the good condition category because they are not yet exhibiting ecological signs of enrichment This assumption will need further testing in the future (See also section 10 and 11).
Approximately one-third of the GWDTEs were not in good condition, identified as those in unfavourable conservation status and those which the conservation organisations identified as likely to be nutrient impacted (supported by evidence). The mean and 25th percentile were calculated for nitrate (as N, mg/l) and phosphate (as P, mg/l). We recognise that the reason for unfavourable condition may not be as a result of poor groundwater quality. This dataset was kept separate from the ‘favourable condition’ dataset to facilitate interpretation of the data.
NOTE: We have assumed that if a GWDTE designated under European or national legislation meets its conservation targets, then any input from groundwater is not presently causing significant damage to the GWDTE. If a GWDTE is failing to meet its conservation targets, then the groundwater could be causing significant damage (though there may be other reasons for the failure).
It is important to understand that these nitrate and phosphate concentrations were measured in groundwater that is feeding the wetland and are not measured within the wetland itself.
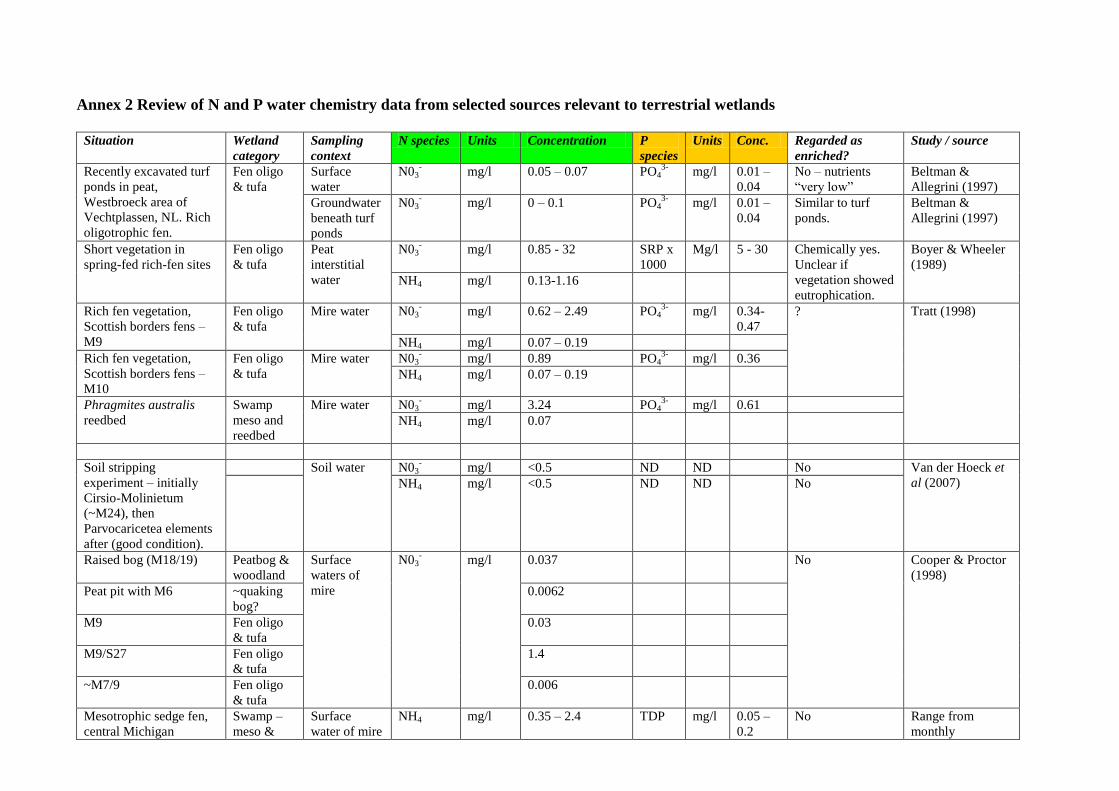
6.2. Site specific investigations The environment and conservation agencies (EA, NE, SEPA, NIEA, CCW, SNH and IEPA) have carried out detailed investigations of GWDTEs that are thought to be under pressure from nutrients or other human pressures as part of the first cycle of WFD and nature conservation legislation. Six sites were investigated in detail in England and Wales (ENTEC, 20111, and SWS, 2010). Data was also collected from non-impacted sites that have specifically been instrumented to ascertain the chemical condition of the groundwater feeding GWDTEs that are in good condition. These data were split into 2 groups, one with GWDTEs in good condition and another with GWDTEs in poor condition. It is important to realise that the nitrate and phosphate concentrations in these investigations were collected from within the wetlands. Groundwater within these sites will have been modified by natural processes such as de-nitrification, phosphorus adsorption and plant uptake. 6.3. Other (EU) databases and literature There is little published information that relates wetland communities or species to nutrient concentrations of groundwater within the wetland or groundwater feeding the wetland, however an overview of the available information is given in Annex 2. Most of these were of chemical measurements within wetland soils and did not include measurements of the chemical quality in the relevant groundwater source. There is also a large body of literature that describes the use of wetlands that are constructed to treat enriched waters. This data is not used in this analysis. The Belgian and Dutch authorities have developed large databases that contain information on vegetation type and groundwater level and quality. The vegetation description is not the same as that used in the UK and therefore further work needs to be undertaken to correlate the UK
vegetation categories to those in the continental European databases and the knowledge can then be used to evaluate the current TV’s
7. Factors affecting the relationship between nutrient and wetland condition During the analysis, we observed a large variability around the mean nitrate or phosphate concentration for each vegetation category and its associated condition. Initial analysis of this large variance pointed towards a difference between countries, whereby nitrate values in GWDTEs of the same type were often much lower in Scotland and Wales than they were in England.
It was decided to investigate whether this variability was due to catchment related factors such as catchment size, land-use and geology. The following variables for each groundwater monitoring / wetland location were identified as the possible reasons for the variance: 1. Dominant land use (using land use categories from CEH Land Use 2000) of the ground and
surface water catchment categories: arable, woodland, grassland, heath, urban, coastal ; 2. Mean altitude of the wetland above ordnance datum (see fig 3) (above or below 175 m); 3. Catchment geology (using WFD generic geology types;(WFD Directive Annex 2, system A)) categories: organic, calcareous, siliceous and salt) ; 4. Catchment size (using WFD generic catchment size types; WFD Directive Annex 2, system A); categories (extra small, small, medium and large) 5. Mean annual recharge to the groundwater (information from the relevant Environment Agencies):mm/annum; categories: low (0-200mm/annum) ; medium (200-400 mm/annum) ; high > 400 mm/annum. Initial results showed a strong correlation between wetland altitude and groundwater nitrate concentrations for a range of wetland categories (fig 3). We hypothesized that this correlation was likely to be related to land-use and thus was a proxy for the intensity of the land use in the groundwaters that were feeding that particular wetland. Inspection of the correlation curves (see fig 3) showed that in most cases only low nitrate concentrations were found above around 175m OD. This correlates well with the altitude of ‘enclosure’ and thus likely intensive land-use. We therefore decided to create two altitude categories (above and below 175m OD and use these in the further analysis). Figure 3 A and B show examples of the correlation between the nitrate concentration in the groundwater and mean altitude of two GWDTE categories.
Figure 3. Scatterplot showing the relationship between mean elevation (m OD) of GWDTE’s and the nitrate (NO3-N, mg/l) in the groundwater that feeds the GWDTE A: Wet Woodland.
B: Fen (mesotrophic and Fen meadow)
Mean Elevation of GWDTE (m OD)
Mean Elevation of GWDTE (m OD)
Nit
rate
conce
ntr
atio
n (
mg/l
N-N
O3)
Nit
rate
conce
ntr
atio
n (
mg/l
N-N
O3)
Statistical tests (ANOVA) were used to analyse variance in the nitrate-condition relationship using the five variables described above. The results clearly showed (see table 1 below) for half of the GWDTE categories that there was a primary significant effect of altitude for fen, quaking bog, wet woodland and wet grassland. Wet heath variance was significantly affected by land-use in the surface water catchment and peatbogs was affected by land-use in the groundwater catchment. Groundwater body land-use had a secondary significant effect on the variance for fen and quaking bog. We did not find significant effects for the wetland categories swamp and springs. Wet dunes do not occur at higher altitudes, so it is not surprising that we do not find a correlation for this habitat.
Table 1: Analysis of variance of nitrate-wetland condition relationship as a function of the environmental variables (Land use of surface waterbody, land use of groundwater body, mean altitude of wetland, catchment geology, catchment size and mean annual recharge class). Displayed are the environmental variables that explain a statistically significant (p<0.05) proportion of the variance.
Wet grassland Altitude (p=0.04) Swamp (mesotrophic and reedbed)
-
GWB = groundwater body SWB = surface water body
The major factor responsible for this difference in nitrate concentrations per vegetation/ condition couplet appears to be associated with altitude and land-use. It is likely that ‘altitude’ is in fact a proxy for the differences in intensity of land use between the uplands and the lowlands. Other factors such as geology and groundwater body recharge rate also influence differences but land use is the dominant factor. This is consistent with the widely documented increase in nitrate in groundwater in the latter half of the 20th century in parts of the UK linked to major changes in agriculture (e.g. Foster, 2000). Three distinct components that had the greatest impacts were the conversion of extensive areas of permanent pasture to land under arable cultivation (which is predominantly below 175 m OD in the UK); a significant increase in the total proportion of land devoted to cereal production, particularly in the period 1950-1970; and the major increase in application of inorganic fertilisers to sustain continuous arable cropping. Recent results from the Scottish groundwater monitoring network that showed those areas with arable, dairy, pig and poultry enterprises – all typical of, and largely restricted to, lowland farming systems – had the highest nitrate concentrations (MacDonald et al., 2007).
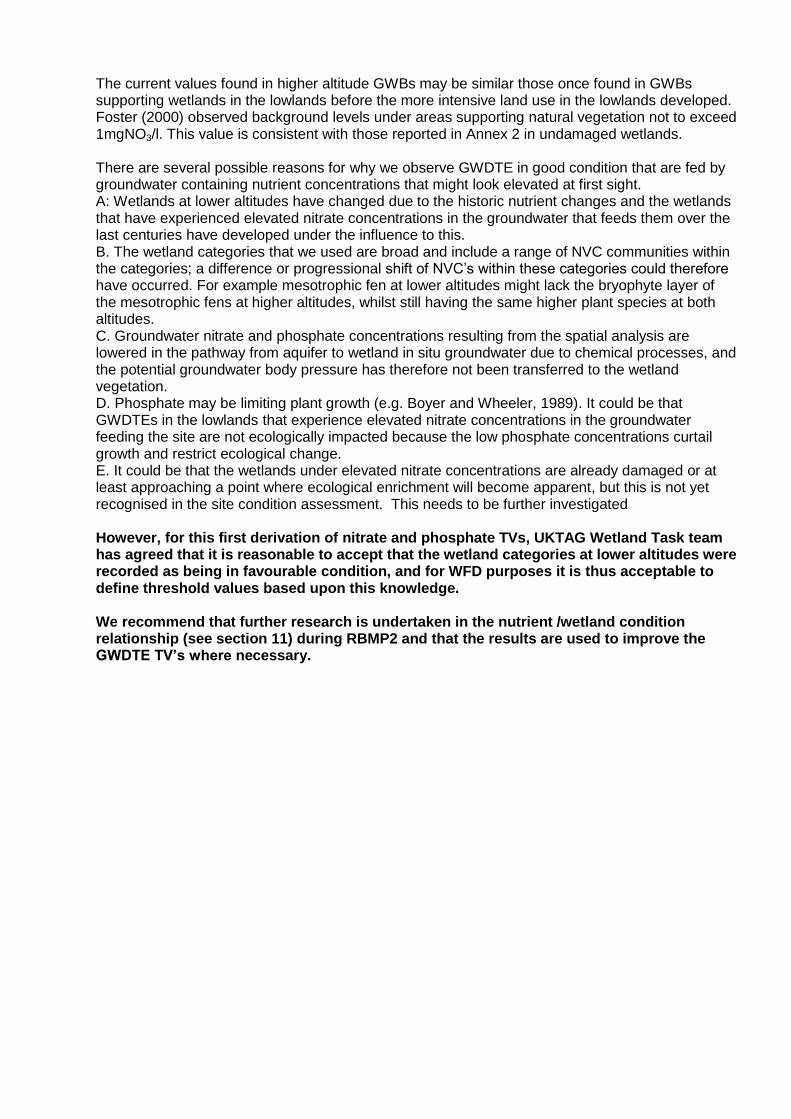
The current values found in higher altitude GWBs may be similar those once found in GWBs supporting wetlands in the lowlands before the more intensive land use in the lowlands developed. Foster (2000) observed background levels under areas supporting natural vegetation not to exceed 1mgNO3/l. This value is consistent with those reported in Annex 2 in undamaged wetlands. There are several possible reasons for why we observe GWDTE in good condition that are fed by groundwater containing nutrient concentrations that might look elevated at first sight. A: Wetlands at lower altitudes have changed due to the historic nutrient changes and the wetlands that have experienced elevated nitrate concentrations in the groundwater that feeds them over the last centuries have developed under the influence to this. B. The wetland categories that we used are broad and include a range of NVC communities within the categories; a difference or progressional shift of NVC’s within these categories could therefore have occurred. For example mesotrophic fen at lower altitudes might lack the bryophyte layer of the mesotrophic fens at higher altitudes, whilst still having the same higher plant species at both altitudes. C. Groundwater nitrate and phosphate concentrations resulting from the spatial analysis are lowered in the pathway from aquifer to wetland in situ groundwater due to chemical processes, and the potential groundwater body pressure has therefore not been transferred to the wetland vegetation. D. Phosphate may be limiting plant growth (e.g. Boyer and Wheeler, 1989). It could be that GWDTEs in the lowlands that experience elevated nitrate concentrations in the groundwater feeding the site are not ecologically impacted because the low phosphate concentrations curtail growth and restrict ecological change. E. It could be that the wetlands under elevated nitrate concentrations are already damaged or at least approaching a point where ecological enrichment will become apparent, but this is not yet recognised in the site condition assessment. This needs to be further investigated However, for this first derivation of nitrate and phosphate TVs, UKTAG Wetland Task team has agreed that it is reasonable to accept that the wetland categories at lower altitudes were recorded as being in favourable condition, and for WFD purposes it is thus acceptable to define threshold values based upon this knowledge. We recommend that further research is undertaken in the nutrient /wetland condition relationship (see section 11) during RBMP2 and that the results are used to improve the GWDTE TV’s where necessary.
8. From wetland concentrations to a WFD threshold value.
The three data sources presented above in section 6 represent water feeding wetlands in good or poor condition (6.1), groundwater within wetlands in good and poor condition (6.2) and available literature (6.3). The UKTAG WTT combined the knowledge from these three data sources into one set of TVs using the following rules: 1. The TVs must lie above the mean (per vegetation category) and preferably above the 75th
percentile for sites in good condition (see table 2a) 2. The TVs must lie below the mean (per vegetation category) and preferable below the 25th
percentile for sites in poor condition (see table 2a) 3. The TVs must include the knowledge from the within site research (knowledge base B, table 2b
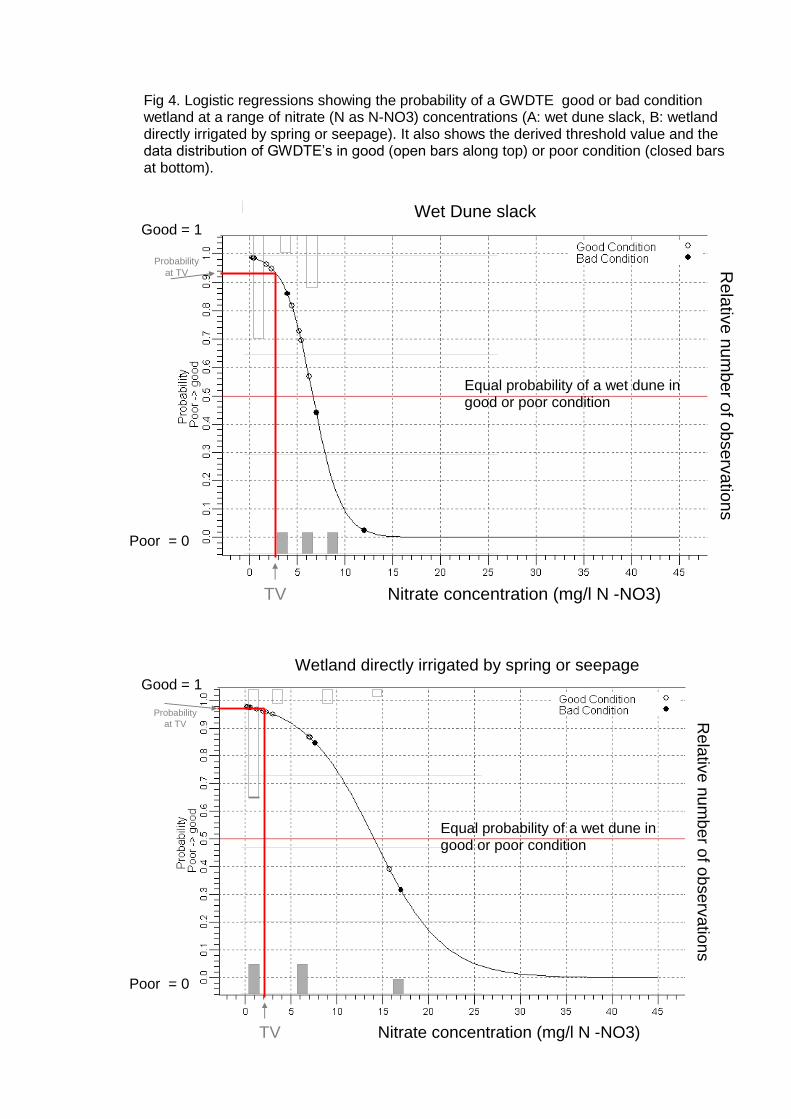
) 4. The TVs must reflect the available knowledge from the literature 5. The TVs are, where possible, a round number (or ½) to reflect the uncertainty in the data 6. The TVs must include expert knowledge from the Wetland Task Team members Setting TVs based upon varying data sources is not an easy task. The WTT wanted to ensure that the potential TV for a given wetland category/ altitude couplet would neither result in too many false triggers of risk, where there was no material risk, nor result in too high a probability of failure to identify a risk where a real risk is present. The logistic regression (in Fig 4) shows how the likelihood of a GWDTE being in good condition decreases with increasing nutrient concentration in the groundwater that feeds the wetland and supports our determination of the actual values of the TV (as shown in rules 1-6 above). The open-bars along the top axis indicate the data distribution of GWDTE’s in good condition and the solid bars along the bottom axis show the data distribution of GWDTE’s in poor condition. Not all the wetland categories (split into altitude classes where appropriate) resulted in meaningful logistic regressions which is likely due to the number of data points. The results of the logistic regression show that it is highly likely (85% to 95%) that the GWDTE is in good condition when the ‘Threshold Value’ is not exceeded.
Fig 4. Logistic regressions showing the probability of a GWDTE good or bad condition wetland at a range of nitrate (N as N-NO3) concentrations (A: wet dune slack, B: wetland directly irrigated by spring or seepage). It also shows the derived threshold value and the data distribution of GWDTE’s in good (open bars along top) or poor condition (closed bars at bottom).
Wet Dune slack
Rela
tive n
um
ber o
f observ
atio
ns
Nitrate concentration (mg/l N -NO3)TV
Probability
at TV
Poor = 0
Good = 1
Equal probability of a wet dune in good or poor condition
Wetland directly irrigated by spring or seepage
Rela
tive n
um
ber o
f observ
atio
ns
Nitrate concentration (mg/l N -NO3)TV
Probability
at TV
Poor = 0
Good = 1
Equal probability of a wet dune in good or poor condition
Table 2 : Nitrate results
A: Results of empirical correlation bewteen wetland condition and groundwater body chemistry
Fen (oligotrophic and wetlands at tufa forming springs 0.059 (11) 0.041 (4) 0.023 (37)
Wet grassland
Wet heath
Peatbog and woodland on peatbog <0.02 (3)
Wetland directly irrigated by spring or seepage <0.02 (6)
Swamp (mesotrophic) and reedbed
Swamp (oligotrophic) <0.02 (1) 0.046 (3)
Wet woodland 0.059 (1) 0.351 (3)
n = number of samples
All values in Phosphate (P, mg/l)
9. The proposed threshold values
9.1 Nitrate The proposed GWDTE TVs are shown in Table 4. Separate TVs for altitude sub-categories
are presented where this was statistically relevant.
Table 4 Proposed nitrate trigger values (mg/l N)
GWDTE category Low altitude (<175mAOD)
Medium altitude (>175mAOD) Any altitude
Quaking bog 4 1 Wet Dune_ 3 Fen (mesotrophic) and fen Meadow) 5 2 Fen (oligotrophic and wetlands at Tufa forming springs) 4.5 1 Wet Grassland 6 2 Wet Heath 3 2 Peatbog and woodland on peatbog 2 Wetlands directly irrigated by spring or seepage 2 Swamp (mesotrophic) and reedbed 5 Swamp (oligotrophic) 4 Wet Woodland 5 2
The above TVs are expressed as in N (in nitrate) in mg/l.
For groundwater purposes we need to convert these into nitrate expressed as NO3 in mg/l. This is done by dividing the figure as N by 14 and multiplying by 62 (to take account of the atomic masses), this approximates to a multiplication of 4.4, which results in the TVs shown in Table 5.
The analysis of phosphate data was more problematic than for nitrate. The data is not normally distributed due to a relatively large number of ‘detection limit’ values, which will impact on any analysis. Furthermore, there is no clear distinction in phosphate concentrations between wetlands in good condition and those in poor condition or with a likely nutrient risk. This could be due to a combination of factors:
the wetland ecology might be predominantly impacted by nitrate coming from the groundwater, whereas phosphates are more likely to be transported through surface waters.
the wetlands investigated may be N limited (Koerselman and Verhoeven (1995)).
Further work on phosphate data and links to wetland ecology are underway and this will determine whether or not we can advise future chemical trigger values for phosphate in groundwater.
9.3 Other chemical pressures
Despite the lack of generic trigger values for phosphate, where there is evidence locally that phosphate, or any other chemical substance is causing damage to a wetland, it may be necessary to set a trigger value to screen against these other substances. In this case, site-specific local evidence would be used to inform local action (effectively an override to risk screening using national datasets, based upon local expert knowledge). Examples of chemical pressures potentially affecting wetlands, for which TV’s may be required,
include amongst others:
Pesticides Phosphates
local pollution (e.g. septic tank,
landfill)
Metalliferous mine water discharges
10. Local considerations when applying the threshold value
The TV’s that have been developed in this document are intended to identify groundwater dependent wetlands where the damage could be caused by elevated groundwater nutrient concentrations.
Many factors have a bearing on the actual significance of exceedance in a given wetland and are discussed below.
10.1 Factors influencing the significance of nutrient exceedance There are a number of different factors which affect the significance of nutrient exceedance. These are listed below.
The duration that a standard can be exceeded is based upon: o the fate of the nutrient in the wetland (i.e. will it pass through the wetland, get
chemically changed, or utilised and locked up by the vegetation), o the magnitude of the nutrient pulse (duration and concentration (loading)) and o the sensitivity of the wetland type. This is further described in 6.2.
Residence time: Nutrients in groundwater feeding a wetland may pass through during flooded conditions and low temperatures, but more usually are retained in the matrix of the wetland, or leave the wetland in gaseous form (denitrification cycle).
Nitrate transmitted through groundwater can follow a series of chemical pathways in wetland soils; some can remove the pressure before it arrives at the sensitive receptor. For example, nitrate can be converted by soil-dwelling bacteria into nitrogen gas (Pieterse et al, 2005) under anaerobic conditions and not under aerobic conditions. Most wetlands have, at least temporarily, water saturated soils that tend to become anaerobic.
Phosphate in groundwater occurs predominantly in dissolved form. Most wetlands are phosphate limited so any bio-available phosphate will be taken up by the plants and converted into biomass. This immobilises the nutrient for one or more seasons, depending on the vegetation, and unless removed by cutting will continue to be recycled within the wetland. A short lived pulse of nutrients can therefore have long lasting effects. It is worth noting that the most significant input of phosphate to wetlands is via surface water runoff and flood water rather than groundwater. However, this does not mean that dissolved phosphate in groundwater can be ignored.
Ecological response time: the impact of nutrients on species composition is unlikely to be immediately visible (unless there are very high concentrations which will result in algal mats). The change is unlikely to happen within one growing season, but will become visible over several years, and might happen very slowly depending on the concentrations. It is often lower plants (mosses and liverworts) that respond most rapidly to nitrate enrichment and as these species are small, changes in abundance and species composition can be hard to identify. Current assessment methods for wetlands by statutory nature conservation agencies do not generally include assessment of lower plant communities.
10.2 Factors affecting the sensitivity of wetlands to nutrients The sensitivity of wetlands can be affected by a number of factors, these include those listed below.
Vegetation management can alter the sensitivity of a wetland to nutrient pressure. For example cutting and removal of biomass will remove nutrients and could mask an increased nutrient pressure. However this may also be a good may to manage higher than desired nutrient input into a wetland in a cost effective way.
Water management can directly affect the quantity of nutrients that arrive at a wetland. The water table in a wetland affects the potential for de-nitrification and thus can affect the significance of the impact of enhanced nitrate pressure.
Reversibility of impact: It very difficult (and costly) to reverse the impact of nutrients on wetlands. Once a nutrient pressure has changed the species composition of plant communities, or in the case of phosphate become embedded in the biomass, it will be near
impossible to change. This non-linear relationship between pressure and state is well documented for lakes and is equally applicable to wetlands
Some nutrients can be immobilised as a result of chemical processes within or adjacent to wetlands – for example phosphate immobilisation by iron and calcium.
10.3 When is a nutrient pressure particularly important? The timing and duration of the nutrient pressure is important. For example, a short-lived phosphate peak that travels through a wetland during biologically inactive times, such as in winter, might have limited impact, whilst the same or smaller pressure during the growing season can have a significant effect. Nitrate can also be removed from a wetland through de-nitrification in soil. The effectiveness of this process depends on the oxidation state of the soil and temperature as it is mediated via bacteria (Mayer et al, 2007) Groundwater generally travels slowly. This means that a nutrient plume can last for a long period of time, especially as most nitrate and phosphate in groundwater comes from diffuse sources. In addition, high nutrient levels identified in a groundwater body may not yet have reached the GWDTE and therefore the nutrient pressure on the GWDTE may increase over time.
Groundwater body aspects of exceedance are discussed in the consultation document
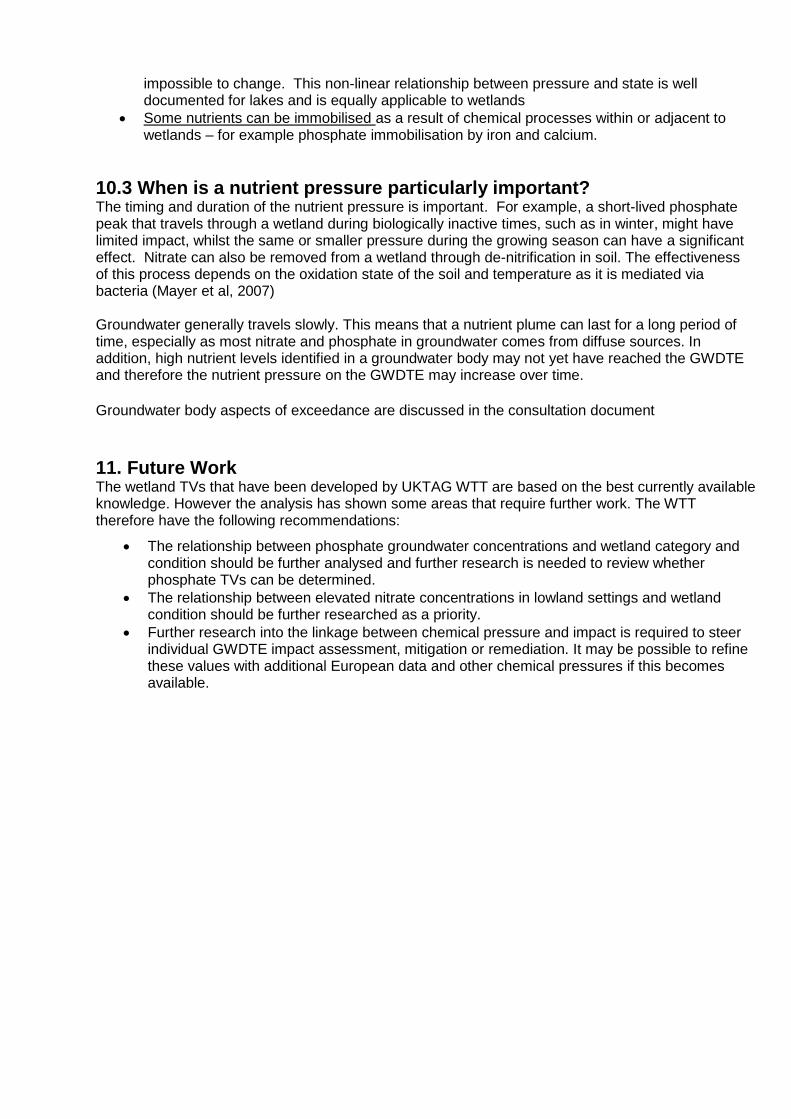
11. Future Work The wetland TVs that have been developed by UKTAG WTT are based on the best currently available knowledge. However the analysis has shown some areas that require further work. The WTT therefore have the following recommendations:
The relationship between phosphate groundwater concentrations and wetland category and condition should be further analysed and further research is needed to review whether phosphate TVs can be determined.
The relationship between elevated nitrate concentrations in lowland settings and wetland condition should be further researched as a priority.
Further research into the linkage between chemical pressure and impact is required to steer individual GWDTE impact assessment, mitigation or remediation. It may be possible to refine these values with additional European data and other chemical pressures if this becomes available.
12. References
Anderson, H.E. (2004). Hydrology and nitrogen balance of a seasonally inundated Danish floodplain wetland. Hydrological Processes, 18, 415-434. Beltman, B. & Allegrini, C. (1997). Restoration of lost aquatic plant communities: new habitats for Chara. Netherlands Journal of Aquatic Ecology, 30 (4), 331-337. Boyer, M.L.H. & Wheeler, B.D. (1989). Vegetation patterns in spring-fed calcareous fens: calcite precipitation and constraints on fertility. J. Ecol, 77, 597-609. Cooper, E.A. & Proctor, M.C.F. (1998). Malham Tarn National Nature Reserve: The vegetation of Malham Tarn Moss and Fens. Field Studies, 9, 277-31. De Mars, H. & Garritsen, A.C. (1997). Interrelationship between water quality and groundwater flow dynamics in a small wetland system along a sandy hill ridge. Hydrological Processes, 11, 335-351. De Schrijver, A., De Frenne, P., Ampoorter, E., Van Nevel, L., Demey, A., Wuyts, K. And Verheyen, K., 2011. Cumulative nitrogen input drives species loss in terrestrial ecosystems. Global Ecology and Biogeography (2011) 20: 803-816 ENTEC 2011. Refining river basin planning through targeted investigation on GWDTE - Wybunbury Moss. Final report to Environment Agency of England and Wales. Foster, S.S.D. (2000). Assessing and Controlling the Impacts of Agriculture on Groundwater – from Barley Barons to Beef Bans. Quarterly Journal of Engineering Geology and Hydrogeology, 33, 262-280. Giller, K. & Wheeler, B.D. (1986). Peat and peat water chemistry of a flood-plain fen in Broadland, Norfolk, U.K. Freshwater Biology, 16, 99-114. Grieve, I.C., Gilvear, D.G. & Bryant, R.G. (1995). Hydrochemical and water source variations across a floodplain mire, Insh Marshes, Scotland. Hydrological Processes, 9, 99-110. Holman, I.P., Whelan, M.J., Howden, N.J.K., Bellamy, P.H., Willby, N.J., Rivas-Casado, M. And McConvey, P., 2008. Phosphorus in groundwater – an overlooked contributor to eutrophication? Hydrological processes 22: 5121-5127 Howden, N.J.K., Burt, T.P., Worrall, F, Matias, S and M.J. Whelan., 2011. Nitrate pollution in intensively farmed regions: What are the prospects for sustaining high-quality groundwater? Water Resources Research (47) JNCC, (2004), Common Standards Monitoring Guidance for Lowland Wetland, Version August 2004, ISSN 1743-8160 Koerselman, W., Bakker, S.A. & Blom, M. (1990). Nitrogen, phosphorus and potassium budgets for two small fens surrounded by heavily fertilised pastures. J. Ecol, 78, 428-442. Koerselman, W. and Verhoeven, J.T.A. 1995. Eutrophication of fen ecosystems: external and internal nutrient sources and restoration strategies.. In: Restoration of temperate wetlands. Wheeler, B.D., Shaw, S.C., Fojt, W. and Robertson, R.A. (eds) pp 91-112. J Wiley, Chichester. Mayer, P.M., Reynolds, S.K., Marshall, Jr, McCutchen, D. and T.J. Canfield, 2007. Meta-analysis of
nitrogen removal in riparian buffers. J. Environ. Qual (36) 1172-1180
Pieterse, N.M., Venterink, H.O., Schot P.P. and Verkroost A.W.M.; 2005. Is Nutrient contamination of groundwater causing eutrophication of groundwater-fed meadows. Landscape Ecology (2005) 20: 743-753
Richardson, C.J. & Marshall, P.E. (1986). Processes controlling movement, storage, and export of phosphorus in a fen wetlands. Ecological Monographs, 56, 279-302. Schot, P.P. & Wassen, M.J. (1993). Calcium concentrations in wetland groundwater in relation to water sources and soil conditions in the recharge area. Journal of Hydrology, 141, 197-217. Tratt, R. (1998). The Scottish Border Fens: Controls on vegetation development and composition. Ph.D. Thesis, University of Sheffield. Schutten, Verweij, Hall & Scheidleder, 2011. Common Implementation strategy for the Water
SWS (Schlumburger Water Services) 2010. Report on targeted risk-based investigations on selected Welsh Groundwater Dependant terrestrial Ecosystems (Cors Bodeilio and Merthyr Mawr). Report to Environment Agency of England and Wales.
Smart, J, Sutherland, W.J., Watkinson, A.R. and J.A. Gill, 2004. A new means of presenting the results of logistic regression. Bulletin of the Ecological Society of America: 100-103
SNIFFER (2009) WFD95: A Functional Wetland Typology for Scotland – Field Survey Manual. Version 1. ISBN: 978-1-906934-22-4.
UKTAG, 2012. Updated Recommendations on Environmental Standards River Basin Management (2015-21) Van der Hoeck, D. & Heijmans, M.M.P.D. (2007). Effectiveness of Turf Stripping as a Measure for Restoring Species-rich Fen Meadows in Sub-optimal Hydrological Conditions. Restoration Ecology, 15, 627-637. Vitt, D.H. & Chee, W-L. (1990). The relationships of vegetation to surface water chemistry and peat chemistry in fens of Alberta, Canada. Vegetatio, 89, 87-106. Wassen, M.J., van Diggelen, R., Wolejko, L. & Verhoeven, J.T.A. (1996). A comparison of fens in natural and artificial landscapes. Vegetatio, 126, 5-26. Wheeler et al. (2004) Ecohydrological Guidelines for Lowland Wetland Plant Communities. Environment Agency, Peterborough Wheeler et al. (2009) A Wetland Framework for Impact Assessment at Statutory Sites in England and Wales. Environment Agency Research Report, Bristol.
Wheeler, B.D. & Proctor, M.C.F. (2000). Ecological gradients, subdivisions and terminology of north-west European mires. Journal of Ecology, 88, 187-203.
Annexes
Annex 1: Wetland types and NVC / Annex 1 matrix
Annex 2: Review of N and P water chemistry data from selected sources relevant to terrestrial wetlands
Annex 1. Correlation between NVC and GWDTE category