UK Energy Research Centre UK ENERGY RESEARCH CENTRE UKERC Review of Evidence on Global Oil Depletion Technical Report 1: Data Sources and Issues July 2009: REF UKERC/WP/TPA/2009/016 Steve Sorrell 1 Jamie Speirs 2 1. Sussex Energy Group, SPRU, University of Sussex 2. Imperial College Centre for Environmental Policy and Technology This document has been prepared to enable results of on-going work to be made available rapidly. It has not been subject to review and approval, and does not have the authority of a full Research Report.
Transcript
UK Energy Research Centre
U K E N E R G Y R E S E A R C H C E N T R E
UKERC Review of Evidence
on Global Oil Depletion
Technical Report 1: Data Sources and Issues July 2009: REF UKERC/WP/TPA/2009/016
Steve Sorrell1
Jamie Speirs2
1. Sussex Energy Group, SPRU, University of Sussex
2. Imperial College Centre for Environmental Policy and Technology This document has been prepared to enable results of on-going work to be made available rapidly. It has not been subject to review and approval, and does not have the authority of a full Research Report.
ii
UK Energy Research Centre UKERC/WP/TPA/2009/016
iii
UK Energy Research Centre UKERC/WP/TPA/2009/016
T H E U K E N E R G Y R E S E A R C H C E N T R E
The UK Energy Research Centre is the focal point for UK research on sustainable
energy. It takes a whole systems approach to energy research, drawing on
engineering, economics and the physical, environmental and social sciences.
The Centre's role is to promote cohesion within the overall UK energy research
effort. It acts as a bridge between the UK energy research community and the
wider world, including business, policymakers and the international energy
research community and is the centrepiece of the Research Councils’ Energy
Preface This report has been produced by the UK Energy Research Centre’s Technology
and Policy Assessment (TPA) function. The TPA was set up to address key
controversies in the energy field through comprehensive assessments of the
current state of knowledge. It aims to provide authoritative reports that set high
standards for rigour and transparency, while explaining results in a way that is
useful to policymakers.
This report forms part of the TPA’s assessment of evidence for a near-term peak
in global oil production. The subject of this assessment was chosen after
consultation with energy sector stakeholders and upon the recommendation of
the TPA Advisory Group, which is comprised of independent experts from
government, academia and the private sector. The assessment addresses the
following question:
What evidence is there to support the proposition that the global supply
of ‘conventional oil’ will be constrained by physical depletion before 2030?
The results of the project are summarised in a Main Report, supported by the
following Technical Reports:
1. Data sources and issues
2. Definition and interpretation of reserve estimates
3. Nature and importance of reserve growth
4. Decline rates and depletion rates
5. Methods for estimating ultimately recoverable resources
6. Methods for forecasting future oil supply
7. Comparison of global supply forecasts
The assessment was led by the Sussex Energy Group (SEG) at the University of
Sussex, with contributions from the Centre for Energy Policy and Technology at
Imperial College, the Energy and Resources Group at the University of California
(Berkeley) and a number of independent consultants. The assessment was
overseen by a panel of experts and is very wide ranging, reviewing more than
500 studies and reports from around the world.
Technical Report 1: Data sources and issues is authored by Jamie Speirs and
Steve Sorrell. It defines a number of the key terms relevant to the assessment of
oil depletion, introduces the main data sources together with their associated
definitions and assumptions and highlights the discrepancies between these
sources with regard to both production and reserves. Particular attention is paid
to the distinction between proved, and proved and probable reserve estimates. It
also provides some background information on hydrocarbon chemistry, oil
products and refinery processes.
vi
UK Energy Research Centre UKERC/WP/TPA/2009/016
vii
UK Energy Research Centre UKERC/WP/TPA/2009/016
Executive Summary
The modelling and forecasting of oil supply requires data on oil production and remaining reserves. This is available from a variety of sources, but much of it is inaccurate, inconsistent, uncertain and/or contested. While some degree of uncertainty is inevitable, the situation is considerably more difficult than it should be owing to factors such as inconsistent definitions, obstacles to data disclosure and the absence of third-party verification. These difficulties need to be fully acknowledged if oil supply forecasts are to be properly evaluated.
This report summarises several of the significant issues associated with oil production and reserve data. A fuller understanding of these issues provides a necessary basis for an objective examination of global oil depletion. The report addresses the subject in four sections:
Definitions used within oil industry data are often a subject of confusion. When examining production data, for instance, it is important to know exactly which liquids have been included in the quoted figures. Some data refer to crude oil and lease condensate while others will also include natural gas liquids or sources of so-called non-conventional oil. This in itself raises further questions regarding what is meant by non-conventional. Section 2 summarises the relevant definitions and describes how they are used.
The Data Sources commonly available are also discussed. Many sources use differing definitions, differing classifications within those definitions and differing reporting methods. This can cause significant difficulties when comparing data across sources. Section 3 identifies the main data sources, along with their associated definitions and assumptions.
Reserve Estimates are the most contentious data reported by the oil industry. Their probabilistic nature, their significant uncertainty and their importance to the financial markets means that they are often disputed. These estimates are published by several sources and the inconsistencies between these sources can be considerable. There are also issues regarding the suitability of “proved” reserve estimates for assessing the security of future oil supply and the comparable advantages of “proved and probable” or 2P reserve estimates. Section 4 discusses these issues and highlights the potential inaccuracy of several countries reported reserves.
Finally Production Data is examined in Section 5. Comparison is made of the quoted production figures from several of the commonly available sources. They are found to be in reasonable agreement, once the classification of included liquids is accounted for. A comparison of production by region is made highlighting the increasing dominance of a small number of producers. The issue of “net exports” is also briefly discussed.
Supporting the main discussion are three annexes providing background information on hydrocarbon chemistry, oil products and refinery processes respectively.
2.1 CLASSIFICATION OF OIL AND LIQUIDS .................................................................................... 3 2.1.1 Crude Oil .......................................................................................................................... 3 2.1.2 Natural Gas (Associated or Non-Associated) ................................................................... 4 2.1.3 Lease Condensate ............................................................................................................. 4 2.1.4 Natural Gas Liquids (NGLs)............................................................................................. 5 2.1.5 Heavy Oil .......................................................................................................................... 5 2.1.6 Extra Heavy Oil ................................................................................................................ 5 2.1.7 Oil Sands and Synthetic crude (‘Syncrude’) ..................................................................... 6 2.1.8 Gas to liquids (GTLs) ....................................................................................................... 6 2.1.9 Coal to liquids (CTLs) ...................................................................................................... 6 2.1.10 Biofuels ........................................................................................................................ 6 2.1.11 Refinery/Processing Gains (or losses) ......................................................................... 7
2.2 UNITS OF MEASUREMENT ...................................................................................................... 7 2.3 MEASURES OF PRODUCTION, DISCOVERY AND RESERVES ....................................................... 8
2.3.1 Production and supply ...................................................................................................... 8 2.3.2 Reserves ............................................................................................................................ 9 2.3.3 Cumulative discoveries ................................................................................................... 10 2.3.4 Discoveries ..................................................................................................................... 11
3 DATA SOURCES ....................................................................................................................... 13
3.1.1 International Energy Agency .......................................................................................... 13 3.1.2 Energy Information Administration ................................................................................ 13 3.1.3 BP Statistical Review ...................................................................................................... 13 3.1.4 Oil and Gas Journal ....................................................................................................... 13 3.1.5 World Oil ........................................................................................................................ 13 3.1.6 Organisation of Petroleum Exporting Countries (OPEC) .............................................. 14 3.1.7 Industry databases .......................................................................................................... 14 3.1.8 Comparison of data sources ........................................................................................... 14
4.3 TREATMENT OF US RESERVES IN IHS PEPS ........................................................................ 24 4.4 SUMMARY ............................................................................................................................ 24
5 PRODUCTION DATA ............................................................................................................... 25
5.1 VARIATION IN PRODUCTION DATA ....................................................................................... 25 5.2 PRODUCTION BY REGION ...................................................................................................... 26 5.3 NET PRODUCTION/NET EXPORTS ......................................................................................... 30
FIGURE 2.1 CURRENT VERSUS BACKDATED ESTIMATES OF CUMULATIVE DISCOVERIES – TREATMENT OF
RESERVE REVISIONS ....................................................................................................................... 11 FIGURE 4.1: PROVED GLOBAL RESERVES AS PRESENTED IN BP STATISTICAL REVIEW, OIL AND GAS
JOURNAL AND WORLD OIL ............................................................................................................ 17 FIGURE 4.2: PROVED KUWAIT RESERVES AS PRESENTED IN BP STATISTICAL REVIEW, OIL AND GAS
JOURNAL AND WORLD OIL ............................................................................................................ 18 FIGURE 4.3: PROVED SAUDI ARABIA RESERVES AS PRESENTED IN BP STATISTICAL REVIEW, OIL AND
GAS JOURNAL AND WORLD OIL .................................................................................................... 18 FIGURE 4.4: PROVED IRAQ RESERVES AS PRESENTED IN BP STATISTICAL REVIEW, OIL AND GAS
JOURNAL AND WORLD OIL ............................................................................................................ 19 FIGURE 4.5: PROVED RUSSIA RESERVES AS PRESENTED IN BP STATISTICAL REVIEW, OIL AND GAS
JOURNAL AND WORLD OIL ............................................................................................................ 20 FIGURE 4.6: PROVED CANADA RESERVES AS PRESENTED IN BP STATISTICAL REVIEW, OIL AND GAS
JOURNAL AND WORLD OIL ............................................................................................................ 21 FIGURE 5.1: GLOBAL OIL PRODUCTION DATA AS PRESENTED IN BP STATISTICAL REVIEW, WORLD OIL,
OIL AND GAS JOURNAL, IEA OIL MARKET REPORT, EIA INTERNATIONAL PETROLEUM MONTHLY
AND IHS PEPS DATABASE ............................................................................................................. 25 FIGURE 5.2 SHARE OF WORLD ALL-OIL PRODUCTION BY COUNTRY ......................................................... 26 FIGURE 5.3: SHARE OF WORLD OIL PRODUCTION FOR SELECTED REGIONS. .............................................. 27 FIGURE 5.4: CHANGE IN OIL PRODUCTION OVER THE LAST 5 YEARS FOR TOP 49 PRODUCING COUNTRIES.
...................................................................................................................................................... 29 FIGURE 5.5: INDONESIA OIL PRODUCTION, OIL CONSUMPTION AND NET OIL AVAILABLE FOR EXPORT ..... 31 FIGURE 5.6: UK OIL PRODUCTION, OIL CONSUMPTION AND NET OIL AVAILABLE FOR EXPORT. ................ 32
Tables
TABLE 2.1: TYPICAL PRODUCT MIX FROM A REFINED BARREL OF OIL. ....................................................... 4 TABLE 3.1 COMPARISON OF GLOBAL DATA SOURCES ON OIL PRODUCTION AND RESERVES ..................... 15 TABLE 5.1: TOP 49 OIL PRODUCING COUNTRIES REPRESENTING 98.9% OF GLOBAL PRODUCTION. .......... 28 TABLE 5.2: LIQUIDS MAKING UP LIQUID PETROLEUM PRODUCTION (KB/D) .............................................. 29 TABLE 5.3: LIQUIDS MAKING UP LIQUID PETROLEUM PRODUCTION AS % OF TOTAL ................................ 30
xi
UK Energy Research Centre UKERC/WP/TPA/2009/016
1
UK Energy Research Centre UKERC/WP/TPA/2009/016
1 Introduction
Understanding the nature, behaviour and possible future of the oil industry requires careful analysis of various types of data, including the production of crude oil, the supply of and demand for oil products, the exploration activity by oil companies and estimates of remaining oil reserves. This data is collected and published by several different organisations over many levels of aggregation - including individual fields, provinces, countries, regions and the globe. Such data is of particular importance when assessing the state of global oil reserves and the possibility of a near-term „peaking‟ of global oil supply. The conclusions of such studies depend very much on the accuracy and reliability of the data used and disputes over such data are a central feature of the peak oil debate.
There are numerous concerns regarding the accuracy, reliability and transparency of different sources of oil industry data. For example, different data sources frequently provide different estimates for what appears to be a similar and often straightforward measure - such as the annual production of crude oil from a particular region. One reason for such discrepancies is differing definitions of geographical regions, or of the types of liquids included (e.g. whether Natural Gas Liquids are included in a measure of crude oil production). Another is the potential inaccuracy of official figures provided by particular companies or countries and the reliance upon alternative sources of information that differ from official estimates in a variety of ways (Bentley, et al., 2007). Disputes are particularly intense in relation to estimates of reserves, which are by their nature probabilistic and uncertain. For example, it has been proposed that the conservative nature of the „proved‟ reserve figures that feature in most official publications can lead to an inaccurate or misleading portrayal of depletion of global oil resources.
The aim of this report is to identify the main sources of oil industry data, to clarify some relevant definitions, to summarise some of the issues relevant to interpreting and using this data and to highlight some implications for assessments of global oil depletion.
2
UK Energy Research Centre UKERC/WP/TPA/2009/016
3
UK Energy Research Centre UKERC/WP/TPA/2009/016
2 Definitions
This section provides definitions of a number of terms used by the data sources referred to in this report. These definitions are largely consistent across the data sources, but significant difficulties can be experienced when applying these definitions. A detailed glossary of these and other terms can be found on the websites of the International Energy Agency (IEA) and US Energy Information Administration (EIA).
2.1 Classification of oil and liquids
What is commonly termed „oil‟ represents a heterogeneous mix of liquid hydrocarbons derived from a range of sources. Several subcategories of oil are commonly defined, but the boundaries between them are not fixed and they are not always distinguished in the available data.
2.1.1 Crude Oil
Crude oil is defined by the EIA as a mixture of hydrocarbons that exist in liquid phase in natural underground reservoirs and which remain liquid at atmospheric temperature and pressure (EIA, 2006). Crude oil is a complex mixture of a large number of chemical compounds and is of limited use until it is processed (refined). The mixture includes alkanes, cycloalkanes and various aromatic hydrocarbons (see Annex 1), together with other compounds such as sulphur (<6%), nitrogen (<1%), oxygen (<5%) and metals such as iron, nickel and vanadium. Most of the non-hydrocarbon constituents are chemically combined with carbon and hydrogen and are contaminants which must either be removed or reduced in concentration by refinery processes.
Crude oil is typically classified by its origin, density and sulphur content. Density is usually measured in units of American Petroleum Institute (API) Gravity - with higher API indicating less dense oil. Crude is often classified as Light (>30°API), Medium (Between 20°API and 30°API) and Heavy (<20°API), although different sources may use different criteria in making these distinctions. Heavy crudes have a higher ratio of carbon to hydrogen atoms and consequently produce more heavy petroleum products such as gas oil, heavy fuel oil and bitumen. Light crudes produce more light products such as gasoline; naphtha and kerosene (see Annex 2) and are much easier to transport and refine. It is the light products which are most attractive to the industry as refinery output has shifted increasingly towards the road and air transport market.
Crude oil with relatively high sulphur content is described as sour, while that with relatively little sulphur is described as sweet. With tightening regulatory restrictions on both sulphur emissions and the sulphur content of products, sweet crude trades at a premium.
The particular molecular composition of any crude stream depends upon the region from which it has been produced. This makes definitions of origin important and has resulted in the use of certain reference crudes for pricing
4
UK Energy Research Centre UKERC/WP/TPA/2009/016
purposes. Typical reference crudes include Brent (comprising 15 oils from fields in the Brent and Ninian systems in the East Shetland Basin of the North Sea), West Texas Intermediate (WTI, a very high-quality, sweet, light oil delivered at Cushing, Oklahoma) and the OPEC Reference Basket (a weighted average of oil blends from various OPEC countries).
The mix of products produced from a barrel of crude oil depends upon both the composition of the crude and the refinery processes that are available (Annex 3). Typically, gasoline accounts for the largest fraction, with the rest being made up of heavier distillates including diesel, fuel oil and jet fuel. Table 2.1 presents the typical breakdown of a distilled barrel of oil (EIA, 2008b). Note the Total Refined Volume exceeds the volume of the initial barrel, with the difference being referred to as „refinery gains‟ (Section 2.1.11).
Table 2.1: Typical product mix from a refined barrel of oil.
Volume (US Galllons)
Barrel of Crude Oil 42
Gasoline 19.2
Diesel 9.2
Heating Oil 1.8
Heavy Fuel Oil 1.76
Jet Fuel 3.8
Liquefied Petroleum Gas 1.7
Other Products 7.3
Refinery Gains 2.7
Total Refined Volume 44.7
Source: EIA (2008b)
2.1.2 Natural Gas (Associated or Non-Associated)
Methane (CH4), or natural gas, is produced from gas wells or in association with crude oil. Gas produced independently is referred to as “non-associated” while gas produced during the production of crude oil is referred to as “associated”. Natural gas is used as a fuel for industry, electricity production and domestic heating as well as a chemical feedstock.
2.1.3 Lease Condensate
The extraction of associated and non-associated natural gas may yield a product which is liquid at surface temperature and pressure, referred to as condensate, or lease condensate. Lease condensate is usually removed to avoid its condensation within natural gas pipelines and the proportion of condensate from a gas well is often used to classify the gas as either „wet‟ or „dry‟. Condensate includes pentanes (C5) and heavier hydrocarbons, but excludes the lighter molecules in the gas stream, such as propane and butane, which can only be recovered at specialist natural gas processing plants.
Lease condensate normally has an API between 50° and 85°. Condensate from associated gas at oil wells is typically remixed with the crude oil stream
5
UK Energy Research Centre UKERC/WP/TPA/2009/016
at the well before transport downstream. As a result, it is rarely separated from crude oil in the production data. Condensate separated from non-associated natural gas is included in the NGL data (see below). However, this distinction is complicated by the fact that different countries may treat these liquids differently.. The heavier hydrocarbons in condensate can be blended into transportation fuels, but the lighter, volatile components need to be used sparingly to keep within the specification for vapour pressure. Condensate type distillates are often used as solvents for various industrial applications.
2.1.4 Natural Gas Liquids (NGLs)
NGLs are light hydrocarbons found associated with natural gas which are either liquid at normal temperatures and pressures, or can be relatively easily turned into a liquid with application of moderate pressure. NGLs comprise both lease condensate, which is produced by lease separators located at the oil or gas well, and lighter hydrocarbons such as butane and propane which are recovered at natural gas processing plants. NGLs therefore comprise ethane, propane and butane, as well as pentanes and heavier hydrocarbons, but exclude methane since this needs refrigeration to be liquefied (EIA, 1998). They are sometimes classified on the basis of vapour pressure, distinguishing between low (condensate), intermediate (natural gasoline) and high (liquefied petroleum gas).
NGLs are often combined with crude oil and lease condensate in production data, with the aggregate being variously referred to as „petroleum liquids‟, „liquids‟ or „conventional oil‟. The proportion of NGLs in the total production of „liquids‟ is increasing and is expected to continue do so in the future, which could have important consequences for the supply of different products, including transport fuels (IEA, 2008; Koppelaar, 2009). Data on NGL production is reported by the IEA though many data sources do not distinguish NGLs from crude oil.
2.1.5 Heavy Oil
Heavy oil is commonly defined as oil having an API gravity less than 20º. This definition is not consistent, however, with Venezuela including oil up to 22º as heavy, and Canada using 25º. Heavy oil is included along with lighter oils in the production data of the IEA, EIA, BP Statistical Review, and IHS.
Heavy oils yield a greater proportion of heavy products, such as fuel oils, and less light products, such as gasoline. The proportion of heavy oil in the oil mix is increasing over time, thereby creating a challenge for the production of lighter and high-value products such as gasoline.
2.1.6 Extra Heavy Oil
Extra heavy oil is commonly defined as oil having an API gravity less than 10°, although this definition is also not consistent. Because of its high viscosity it has to be produced using steam injection, which is capital and energy intensive. Most current production is from the Orinoco belt in Venezuela, but
large deposits are also found in other regions such as China and Russia. Extra heavy oil is typically excluded from the production figures for crude oil.
2.1.7 Oil Sands and Synthetic crude (‘Syncrude’)
Oil sands (or tar sands) are sandstone impregnated with bitumen. Most current production is through open-cast mining, but in-situ methods using steam injection are being developed to access deeper deposits. Most global production derives from Canada, but large deposits also found in Russia, China, Romania, Nigeria and the US.
The bitumen may be marketed directly or upgraded to a synthetic crude transportable by pipeline - termed syncrude. The properties of the synthetic crude depend on the processes used in the upgrading - typically they are low in sulphur, with an API gravity around 30º. Syncrudes are generally excluded from the definition of conventional crude production. However, these volumes are included in production data for petroleum liquids in the BP Statistical Review.
2.1.8 Gas to liquids (GTLs)
Gas-to-Liquids (GTLs) are derived through the liquefaction of methane using the Fischer-Tropsch process. This involves steam reforming of natural gas to produce carbon monoxide and hydrogen followed by catalysed chemical reactions to produce liquid hydrocarbons and water. The product mix depends upon the temperature and catalyst used and the economics may be more favourable when no pipeline facilities are available. Major GTL projects are currently underway in Qatar (~0.05 mb/d in 2007). GTLs are considered as non-conventional sources of liquid fuels and are included in the liquid production figures of the IEA.
2.1.9 Coal to liquids (CTLs)
Coal-to-Liquids (CTLs) are derived through the gasification of coal followed by a Fischer-Tropsch process. Research is also being carried out on direct conversion through dissolution of coal in a solvent followed by catalytic cracking. CTL plants are under development in China and the US but a major drawback is their high capital costs and carbon emissions. CTLs are considered as non-conventional sources of liquid fuels and are included in the liquid production figures of the IEA.
2.1.10 Biofuels
Biofuels are transport fuels derived from biological sources. Commonly this consists of either ethanol produced through the yeast fermentation of sugar or starch rich arable crops, or biodiesel derived from seed oils or recycled oils. Second generation cellulosic processes using non-food feedstocks offer greater promise in the longer term. Biofuels are are usually excluded from crude oil production data but are included in the IEA Oil Market Report (IEA, 2007a).
These are a result of the volumetric output of the products of a refinery being greater (or smaller) than the volumetric input of crude oil. Refinery gains can largely be attributed to the production of products which, on average, have a lower specific gravity than the crude oil and feedstocks which were refined.
2.2 Units of Measurement
Oil is typically measured on a volumetric basis in either barrels (b or bbl) or cubic meters (m3). The term barrel refers to a historical used wooden oil barrel (1800‟s) which was 42 US gallons or 159 litres in volume.1 The abbreviations kb or Mbbl (thousand barrels), mb or MMbbl (million barrels) and Gb or Gbbl (billion barrels) are also commonly used.2
Oil may also be measured on a weight basis in metric tonnes (t). The weight of a barrel depends on the source and hence composition of the oil and can vary between 6.0 and 8.0 barrels per tonne. For NGLs, the corresponding figures are 10.0 and 13.5 b/tonne (Karbuz, 2004). Many oil analysts use a standard conversion factor of 7.33 b/tonne for crude oil, but the use of different conversion factors can lead to widely different estimates of the volume or weight of oil production. Particular care must be taken to distinguish between crude oil and NGLs.
The gross heat content of a barrel of oil is similarly variable, but typically lies around 1700kWh. This forms the basis of the barrel of oil equivalent (boe) definition, which is a unit of energy measure corresponding to a standardised heat content of a barrel of oil (6.1178632 × 10⁹ J) and is commonly used to combine oil and gas data into a single measure. However, heat content may either be measured on a gross or net basis, with the 7-9% difference between the two corresponding to the heat that could be released by condensing the water generated during combustion. Unfortunately, when data is reported on a heat content basis, it is not always clear which definition is being used.
At a country and regional level, the production of crude oil is normally reported in either million barrels per day (mb/d) or billion barrels per year (Gb/year). The IEA estimates that the total global supply of crude oil and lease condensate averaged 74.5 mbd in 2008, while the total supply of liquids averaged 86.8 mb/d. The difference between the two was accounted for by NGLs, biofuels, extra heavy oil and tar sands.
1 There is some dispute as to the origin of the double “b” in the unit abbreviation, but it may
have been adopted to distinquish it from the bale (bl), or to indicate plurality (1bl, 2bbl)
2 US sources tend to use Mbbl, MMbbl and Gbbl while European sources use kb, mb and Gb.
The M is derived from the Latin “mille” meaning “thousand”, which can cause some confusion.
The inaccuracy of current units of measurement and their application has potentially significant impact on the aggregation and interpretation of oil production and reserve data. This is compounded by the use of inconsistent and sometimes inaccurate conversion factors when aggregating dissimilar products, such as oil and gas through the use of boe. Karbuz (2004) has shown how relatively small differences in the assumed conversion factors can make a very large difference to aggregate estimates of the volume, weight or heat content of oil production. These difficulties may account in part for the observed discrepancies between different data sources.
2.3 Measures of production, discovery and reserves
2.3.1 Production and supply
The terms supply and production are used in the relevant literature to define volumes of oil. Though these terms are sometimes used interchangeably there are significant distinctions. Supply volume will often be significantly different from production volume in a given year depending upon the storage of oil, refinery gains and other factors (Campbell and Heapes, 2008).
The EIA report supply and define it as:
“The production of crude oil (including lease condensate), natural gas plant liquids, and other liquids, and refinery processing gain (loss).” (EIA, 2008a)
This definition includes refining gains but does not appear to account for storage. In other cases, these terms are used with no stated definition.
Oil production is commonly reported on a volumetric basis (barrels of oil) but this can be misleading. For example, NGLs have a lower energy content per unit volume than crude oil, so a shift towards the former will reduce the energy available from a given volume of liquids supply. Changes in the energy return on investment may also be important (Box 2.1), but are not visible in the available data. Oil production at the country, regional or global level is normally measured in million barrels per day (mb/d) or billion barrels per year (Gb/year) while cumulative production is measured in billion barrels (Gb).
9
UK Energy Research Centre UKERC/WP/TPA/2009/016
Box 2.1 Energy return on energy invested (EROEI)
This is a measure of the net energy gain associated with the production of oil accounting for the energy used in its extraction and processing. It is typically measured in boe and may be estimated for either crude oil or refined products. The energy costs of oil production have increased over time as a consequence of accessing smaller fields in more difficult locations (e.g. deepwater) and shifting to unconventional sources that require substantially more energy to extract, transport and refine. For example, Cleveland (1992) estimates that the „energy return on energy invested‟ (EROEI) for US oil production fell from 24:1 in 1970 to only 12:1 in the early 1980s. However, relatively few estimates are available of the EROEI of different regions and fuel types and there are some important methodological challenges in developing such estimates. These include: defining the appropriate „system boundary‟ when estimating indirect energy use; 3 dealing with the „joint production‟ of two or more refined products; and properly accounting for the „quality‟ of different energy carriers (Cleveland, et al., 2000; Leach, 1975; Lenzen and Dey, 2000)
2.3.2 Reserves
Oil reserves are those quantities of oil in known fields which are considered to be technically possible and economically feasible to extract under defined conditions. Reserves must be distinguished from resources which are the total quantities estimated to exist, including those in known fields which are not considered economically feasible to extract as well as those in undiscovered fields.
As Mitchell (2004) notes:
“Petroleum reserves cannot be measured directly. They are estimates of future production under certain conditions which may or may not be well specified, but which include economic assumptions, knowledge of the feasibility of projects to extract the resources, and geological information. Judgement is involved and different estimates for the same field are legitimately possible.”
Reserve estimates are therefore inherently probabilistic and uncertain. As a result, conventions have been adopted to quantify the level of uncertainty associated with specific estimates. However, different conventions are used by different organisations for different purposes. A traditional distinction is between: a) proved reserves; b) proved and probable reserves; and c) proved, probable and possible reserves, also known as 1P, 2P and 3P. This classification reflects increasing levels of uncertainty, often expressed in terms of a 10% chance of ultimate recovery exceeding the 3P estimate, a 50% chance of it exceeding the 2P estimate and a 90% chance of exceeding the 1P estimate - leading to the alternative terms of P10, P50 and P90.
3 For example, should the indirect energy costs of an oil rig include the energy used to make the structural steel and mine the iron ore? This is referred to as the „truncation‟ problem because there is no standard procedure for determining when indirect energy consumption becomes small enough to neglect
10
UK Energy Research Centre UKERC/WP/TPA/2009/016
However, 1P, 2P and 3P estimates may not always correspond to this probabilistic interpretation and a number of alternative classification schemes are in use, such as those favoured in the former Comecon countries (expressed as A+B+C1and2 etc).
Public domain reserve estimates generally correspond to the 1P definition and hence provide a relatively conservative estimate of recoverable resources. Estimates of 2P reserves are routinely made by the oil industry, but are generally only available to third parties through the purchase of proprietary databases such as the IHS PEPS database (see Section 3). The distinctions between and relative usefulness of these two types of reserve estimates is a central issue in the peak oil debate (Bentley, et al., 2007).
2.3.3 Cumulative discoveries
The sum of cumulative production and reserves is commonly referred to as cumulative discoveries. Depending upon the data available, it may be possible to estimate cumulative 1P, 2P or 3P discoveries.
Unlike reserve estimates, cumulative discovery estimates will not be changed by production since this merely transfers resources from one category (reserves) to another (cumulative production). However, cumulative discoveries will be increased by the discovery of new fields and may be either increased or reduced by revisions to the reserve estimates for known fields. The latter is commonly referred to as reserve growth since estimates are normally revised upwards rather than downwards. However, a more accurate term is cumulative discovery growth, since reserves are continually being depleted by production. An alternative term is „ultimate recovery growth‟ since what is growing are the estimates of what will ultimately be recovered from the field or region.
A major source of confusion is the common practice of backdating cumulative discovery estimates. While some data sources record reserve revisions in the year in which they are made and make no adjustment to the data for earlier years, others backdate the revisions to the year in which the relevant fields were discovered (Figure 2.1). The logic of the first approach is that the reserves did not become „available‟ for production until the estimate was revised and therefore should only appear at the time of the revision (Mills, 2008).4 The logic of the second approach is that the reserves are contained in a field that was discovered many years earlier, so backdating provides a more accurate indication of what was „actually‟ found at that time as well as what will ultimately be recovered from that field. Both of these approaches have their merits, but the difference between them is not always appreciated.
4 For example, the world‟s largest gas field (in Qatar) was discovered in 1971 but the reserves
in the Iranian section were neither known nor accessible until they were drilled in 1991. For Mills (2008) backdating these revisions to 1971 is like ascribing the discovery of California to the landing of Columbus in the Bahamas in 1492.
11
UK Energy Research Centre UKERC/WP/TPA/2009/016
Figure 2.1 Current versus backdated estimates of cumulative discoveries – treatment of reserve revisions
Year of
field discovery
Year of
reserve revision
Current estimates of cumulative discoveries
Backdated estimates of cumulative discoveries
Time
Note: With current estimates, reserve revisions increase the cumulative discovery estimates in the current year. With backdated estimates, these revisions are backdated to the year in which the relevant field was discovered and hence increase the cumulative discovery estimates for all intervening years. The treatment of newly discovered fields is the same in both cases.
2.3.4 Discoveries
The term discovery is ambiguous since it may mean:
the recoverable resources contained in fields that are newly discovered within a particular time period; or
the change in cumulative discoveries from one period to the next.
These are not necessarily the same, since reserve growth at existing fields will contribute to „discoveries‟ under the second definition even if no new fields are found. Unfortunately, it is not always clear which definition is being used and most data sources do not allow the resources contained in newly discovered fields to be distinguished from reserve growth at existing fields.
2.4 Regional Definitions
One significant issue regarding oil market data concerns the definition of geographical regions. With the historical reclassification of typically aggregated regions such as the Former Soviet Union (FSU), the allocation of reserve or production figures can often lack transparency. Differences between data sources in the reporting of figures for a particular region can also create confusion. For example, the IHS PEPS database (see Section 3)
12
UK Energy Research Centre UKERC/WP/TPA/2009/016
reports reserve estimates for each of the seven Emirates that form the United Arab Emirates (UAE). The BP Statistical Review however, treats the UAE as a single country and reports one figure for UAE reserves, while World Oil presents separate figures for Abu-Dhabi and Dubai and includes reserve estimates for the other Emirates in a ‟Middle East, Others‟ figure. This can create difficulties when comparing data across sources.
The classification of OPEC as a producing region is another potential source of confusion. There are currently5 12 OPEC members, namely: Angola, Libya, Nigeria, Algeria, Iran, Iraq, Kuwait, Qatar, Saudi Arabia, UAE, Ecuador and Venezuela. But OPEC membership has changed significantly in recent years. For example, Ecuador resigned from OPEC in 1993 but rejoined in 2007, together with Angola. These additions were offset by Indonesia, which left the organisation in May 2008 after becoming a net importer of oil. This creates a problem for presenting time series data for OPEC producers. The BP Statistical Review 2008 includes Indonesia in its OPEC figures but excludes Ecuador. It is presumed that this classification is consistent throughout the time series though this is not explicitly confirmed. The IEA, however, allocates the reserve figures of OPEC members in the years they were members.6
5 OPEC member countries correct as of July 30
th 2009
6 More information on OPEC and the work of the OPEC Secretariat can obtain from
There are various sources of international oil industry data, from freely accessible published data to proprietary databases, available under contract. Typically the data for each of these sources is gathered through questionnaires to participating companies, government agencies and third parties, although alternative sources of information may also be used. It is interesting to note that, while many of the following data sources disagree, they often compare data collected from the same primary source (Karbuz, 2004). The following data sources are most commonly used.
3.1.1 International Energy Agency
The International Energy Agency (IEA) publishes a large amount of information relevant to the oil industry, including the monthly Oil Market Report (OMR) (IEA, 2007a), which covers the month by month aspects of oil production, to the annual World Energy Outlook (WEO) (IEA, 2007b), which includes forecasts of oil supply and demand in the medium to long term. For its forecasting purposes the IEA relies on third party assessment of recoverable reserves.
3.1.2 Energy Information Administration
The Energy Information Administration (EIA) focuses mostly on the US oil market though it also prepares international statistics. The most useful of these is the International Petroleum Monthly report (EIA, 2008a), which provides regional and global production data together with data on oil demand, trade and stocks.
3.1.3 BP Statistical Review
The BP Statistical Review(BP, 2008b)provides a comprehensive compilation of global energy statistics, including oil, coal, natural gas and nuclear power. The data is gathered through combination of primary sources, third party sources, other data providers (particularly OGJ and World Oil) and independent assessment (e.g. Russian reserve estimates). The review is a high profile resource which is often quoted in the assessment of oil markets. However, BP note that it “...does not … necessarily represent BP's view of proved reserves by country”(BP, 2008b).
3.1.4 Oil and Gas Journal
The weekly Oil and Gas Journal (OGJ) provides a great deal of information on the oil and gas industry including oil supply and reserves data which is published in the final issue of each year (Radler, 2007). The OGJ reserve estimates are commonly quoted by other sources.
3.1.5 World Oil
The magazine „World Oil‟ publishes oil industry data on oil production and reserves in August or September every year (WorldOil, 2007).
14
UK Energy Research Centre UKERC/WP/TPA/2009/016
3.1.6 Organisation of Petroleum Exporting Countries (OPEC)
The OPEC Secretariat maintains its own figures regarding members reserve and production figures. This data is used by most other data sources as they do not have direct access to the companies in question, which are often nationalised (OPEC, 2008).
3.1.7 Industry databases
Comprehensive databases covering the majority of the world's fields are provided by Wood Mackenzie and IHS Energy.
IHS Energy maintains a database of oil industry statistics which it provides access to on a contractual basis. The database is comprehensive and includes data relating to specific fields, countries and regions. For the purposes of this project, we obtained access to the Petroleum Economics and Policy Solutions (PEPS) database, which provides access to country-level data on oil and gas production, 2P reserves and exploration and development drilling. This database is the continuation of statistics maintained by Petroconsultants before its purchase by IHS, which in turn provided the basis for the subsequent work of Colin Campbell. The information in the IHS database derives from a variety of sources including published information and expert assessments. It is widely recognised as an authoritative and valuable source of information on the global oil and gas industry, but there are strict restrictions on the use and publication of the data by subscribers. The IEA utilise the IHS PEPS database in their WEO.
The IHS database reports “Liquid” volumes and defines these as follows:
“Liquids estimates include estimates of NGL/condensate. The estimates may include LPG, heavy oils (less than 10 degrees API) or oil sands but do not include shale oil or synthetic fuels such as gas, coal or biomass to liquids (GTL, CTL, BTL). Condensate estimates are included if test data indicate that condensate is present in a gas deposit even though released information fails to include a separate liquids estimate. Oil, condensate and NGLs have been
grossed to arrive at an overall figure.” (IHS, 2008)
3.1.8 Comparison of data sources
Table 3.1 compares the coverage of the public domain data sources with that of the PEPS database provided by IHS Energy. In addition to those listed in Table 3.1, there are additional data sources providing production and reserve data for individual regions and/or other types of oil industry information. These include the American Petroleum Institute (API), Baker Hughes, the Independent Petroleum Association of America (IPAA), the International Tanker Owners Pollution Federation (ITOPF), the US Bureau of Census, UN Energy Statistics Yearbook and the Department of Energy and Climate Change (DECC) in the UK.
15
UK Energy Research Centre UKERC/WP/TPA/2009/016
Table 3.1 Comparison of global data sources on oil production and reserves
Source Reserves Data
Grouping of liquids in production data Liquids excluded
OPEC Annual Statistical Bulletin and Oil Market Report
Proved Crude oil, condensate, NGLs5
(aggregated)
Refinery gains
CTLs, GTLs, biofuels
IHS Energy PEPS database
Proved and
probable
Liquids (crude oil, condensate, NGLs, LPG, heavy oil, syncrude)
CTLs, GTLs, biofuels
Source: IEA (2009), EIA(2008a), BP(BP, 2008b), IHS(2008), Oil & Gas Journal, World Oil Magazine
Notes: Precise definition and coverage of liquids is not always made clear.
1. NGLs reported separately for OPEC. 2. Including biofuels, oil sands, oil shales, CTLs, GTLs and blending components such
as MTBE. 3. Biofuels from sources outside Brazil and US. 4. Biofuels, CTLs, non-oil inputs to methyl tertiary butyl ether (MTBE), orimulsion and
other hydrocarbons (EIA, 2008a) 5. NGLs reported separately for OPEC.
Key differences between the public domain sources and the industry databases are that:
the former provide 1P reserve estimates while the latter provide 2P estimates;
the former provide current estimates of cumulative 1P discoveries while the latter provide backdated estimates of cumulative 2P discoveries;7 and
the former rely heavily upon data supplied by national governments, while the latter derive information from a wider range of sources, with more attempt to verify their accuracy.
7 An important consequence of backdating reserve revisions is that a time-series of „current‟
2P reserves can only be constructed using successive editions of the industry databases.
16
UK Energy Research Centre UKERC/WP/TPA/2009/016
The relative merits of these different data sources is much debated (Bentley, et al., 2007), but the cost and confidentiality of the industry databases makes comparison difficult. Many analysts of global oil supply rely upon their own, proprietary databases which are even less accessible to third parties (Campbell and Heapes, 2008; Miller, 2005; Smith, 2008). Since these are based in part on the industry databases, they contain backdated 2P estimates of cumulative discoveries.
The data compiled by these sources can largely be classified in two categories: reserve estimates; and production data. These are discussed in Sections 4 and 5.
17
UK Energy Research Centre UKERC/WP/TPA/2009/016
4 Reserve Estimates
Most authors use three main sources of oil reserve data, namely: the BP Statistical Review; the OGJ; and World Oil magazine. Each of these provides proved (1P) reserve estimates, which are in turn used by the IEA, EIA and OPEC. The IHS PEPS database also contains reserve estimates (referred to as „resources‟), but these mostly correspond to proved and probable reserves (2P). Hence, estimates of 2P reserves are not directly available in the public domain. These 2P estimates are also used by the IEA in the WEO. This section highlights some issues relevant to both types of estimate.
4.1 Proved Reserves Comparison
There is some disagreement between the three main sources of proved reserves estimates. The OGJ and World Oil data are both compiled with the aid of government agencies, industry associations, oil companies and private sources. The BP Statistical Review includes these sources, as well as acknowledging the use of OGJ and World Oil published data. However, despite this interdependence, there are significant discrepancies between the time series of global reserve estimates from each source - as illustrated in Figure 4.1.
Figure 4.1: Proved global reserves as presented in BP Statistical Review, Oil and Gas Journal and World Oil
600
700
800
900
1000
1100
1200
1300
1400
1975 1980 1985 1990 1995 2000 2005 2010
Year
Vo
lum
e (G
b)
BP WorldOil OGJ
The first phase of this comparison, between 1980 and 1990 represents the period in which many Middle East producers significantly increased their published reserve estimates (Bentley, et al., 2007). These adjustments may have derived, in part, from the correction of previous under-estimates, but are more likely to have been linked to the quota negotiations within the OPEC cartel (Robelius, 2005). Figure 4.2, Figure 4.3 and Figure 4.4 illustrate this upgrading in the case of Kuwait, Saudi Arabia and Iraq respectively. These
18
UK Energy Research Centre UKERC/WP/TPA/2009/016
upgrades are reflected in the global reserve estimates from all three sources, illustrated in Figure 4.1. During this period, all sources are in close agreement.
Figure 4.2: Proved Kuwait reserves as presented in BP Statistical Review, Oil and Gas Journal and World Oil
Figure 4.3: Proved Saudi Arabia reserves as presented in BP Statistical Review, Oil and Gas Journal and World Oil
19
UK Energy Research Centre UKERC/WP/TPA/2009/016
Figure 4.4: Proved Iraq reserves as presented in BP Statistical Review, Oil and Gas Journal and World Oil
The first apparent disagreement between the data sources with regards to global proved oil reserves comes between 1990 and 1995. During this period, World Oil proved reserve figures are significantly higher than those provided by the BP Statistical Review or the OGJ. This discrepancy may in part be explained by examining the figures for Russia.
Russia‟s published reserves estimates are presented in Figure 4.5. Russia has a complicated reserve reporting history which is reflected in the data presented here. Since 1998, proved reserves for a collection of former Soviet Union countries have been reported in the BP Statistical Review as the Russian Federation. World Oil and the OGJ have been reporting figures for the region for longer and, as a result, under several classifications. The OGJ reported figures for the USSR until 1991, the Commonwealth of Independent States (CIS) from 1991 to 1997, and Russia from 1997 till present. Over this period the reserves estimates for these groups changed. Though described as “explored” reserves throughout, the interpretation of this definition changed in 1995. Before this date, CIS and USSR reserve figures were described as being equivalent to “proved, probable and some possible”, but this was changed in 1995 to be “proved and some probable”. OGJ reserve figures for CIS can be seen to correspondingly drop in 1996.
When examining World Oil reserve figures for the same region we can see a more abrupt variation in the time series. In the years from 1991 to 1995, World Oil reports reserve estimates that are twice those seen in previous or subsequent years. The reserve estimates reported over this period are described as being A+B+C1 (Cronquist, 1991), which was a reserve reporting system used by Eastern Bloc states. World Oil describes this oil reporting format (rather unhelpfully) as equivalent to “proven and partially possible”. It is
20
UK Energy Research Centre UKERC/WP/TPA/2009/016
this period of alternative reserve reporting which appears to drive the discrepancy in World Oil global reserve figures highlighted previously.
Figure 4.5: Proved Russia reserves as presented in BP Statistical Review, Oil and Gas Journal and World Oil
Finally, a distinct step-change in global reserve figures can be seen in the OGJ between 2001 and 2002. This is not in step with either BP Statistical Review figures or World Oil figures over the same period and can be explained in part by examining the 1P reserve estimates for Canada (Figure 4.6). The significant step-change in OGJ reserve estimates in 2002 corresponds to the inclusion of the first time of Alberta oil sands reserves in their Canada 1P totals. The value included by OGJ is 174.8 Gb in 2002 which is consistent with more recent assessments of proved Canadian oil sand reserves (AEUB, 2005). It is not clear how this measure compares to probability measures such as 1P or 2P. This practice is not replicated in either the BP Statistical Review or World Oil figures, both of which include only 21 Gb of oil sand reserves in their present Canadian totals, corresponding to an estimate of the oil sands “under active development”.
21
UK Energy Research Centre UKERC/WP/TPA/2009/016
Figure 4.6: Proved Canada reserves as presented in BP Statistical Review, Oil and Gas Journal and World Oil
4.2 ‘Proved’ versus ‘Proved and Probable’
Much has been written in the literature regarding the limited usefulness of proved (1P) reserve estimates when trying to forecast future oil supply (Bentley, et al., 2007). It has been suggested that some of the problems associated with 1P reserves can be overcome through the use of “proved and probable” or 2P reserve estimates (Bentley, et al., 2007). For example:
“…..If one uses the proved plus probable (also called „2P‟) data held in industry datasets for measuring oil discovery, then these indicate that the resource-limited peak in the global production of conventional oil is imminent. But if proved reserves („1P‟) data are used a very different picture emerges, one that supports a cohesive economic view ruling out any near-term threat to global oil supply……. Reliance on 1P data has led to a number of misconceptions, including the notion that past oil forecasts were incorrect, that oil reserves grow very significantly due to technology gain, and that the global supply of oil is ensured provided sufficient investment is forthcoming to „turn resources into
reserves‟. …..” (Bentley, et al., 2007)
In principle, 1P estimates of oil reserves should be less than 2P estimates for two reasons. First, 1P reserve estimates are more conservative and so are more likely to be exceeded. Using the probabilistic interpretation, they imply a 90% probability that remaining resources will exceed this figure, as opposed to only a 50% probability in the case of 2P estimates. Second, the aggregation of 1P reserve estimates for different regions into an average (e.g. global) estimate is likely to make these estimates more conservative still – but the same should not apply to 2P reserve estimates. The reasons for this are explained further below.
However, in 2007 the BP (2008b) estimate of global 1P reserves were approximately the same as the IHS Energy estimate of global 2P reserves
22
UK Energy Research Centre UKERC/WP/TPA/2009/016
(1240 Gb) (IEA, 2008).8 The implication is that one or both of these estimates are incorrect, but the degree of under or over estimation is impossible to ascertain. This is of crucial importance for forecasts of future global oil supply, since the two time series lead to very different conclusions about the state of oil depletion.
Four factors which affect the suitability of 1P reserve data for forecasting future oil production are summarised below:
4.2.1 Under-reporting
Proved or 1P reserve figures are conservative by design. Their original purpose was to insulate investors against overly optimistic claims about oil reserves and they remain primarily suitable for securing loans, where a high confidence over future revenue streams is required. But in practice, the amount of recoverable oil remaining in a field at any time tends to be considerably larger than suggested by the 1P reserve estimate. Indeed, under the probabilistic interpretation there should be a 90% probability of it being larger. 1P data may be better interpreted as an estimate of the amount of oil that is just about to be brought to market, rather than the total amount of oil that remains to be recovered. In contrast, the 2P estimates implies only a 50% probability that remaining resources will be larger and suggests a corresponding probability that they will be smaller. Hence, they are much less likely to underestimate remaining resources.
4.2.2 Over Reporting
But while 1P reserve estimates should underestimate the amount of oil remaining in existing fields, some countries may have overestimated the amount of oil remaining by inflating their 1P reserve estimates. As demonstrated earlier (Figures 4 to 6), several Middle East OPEC members raised their 1P reserve estimates significantly in the late 1980s, without similar increases in reported discoveries. Comparison with industry estimates of 2P reserves suggest that, in each case the official 1P estimate now exceeds the industry 2P estimate. If reporting of 1P and 2P oil reserves is accurate, then 1P reserve should be below 2P reserves for any given year in any given region. The apparent over-reporting by some OPEC members has therefore led to claims of “political reserves”, with some authors reducing those estimates by a significant margin (Campbell and Heapes, 2008). At the same time, other authors have argued that such adjustments are unjustified. In the absence of third-party verification of OPEC reserve estimates, it is impossible to judge which perspective is valid. But it matters a great deal, because some 75% (BP, 2008b) of global 1P reserves are held by OPEC producers.
8 This hides large discrepancies in the estimates for individual countries. For example, the
IHS estimates are significantly smaller than BP‟s for UAE, Libya and Kuwait but greater for Russia and Saudi Arabia.
23
UK Energy Research Centre UKERC/WP/TPA/2009/016
4.2.3 Non-reporting
A third issue affecting the usefulness of 1P reserve data is the common practice of carrying previous years reserve estimates into subsequent years without any adjustment for ongoing production. This practice can result in time series which do not change for many years, implying that annual reserve additions exactly equal annual production in each year. This may occur as a result of countries failing to return survey data, or simply returning data which is identical to that from the previous year (Bentley, et al., 2007). This pattern is visible in Figure 4.2, Figure 4.3 and Figure 4.4, where reserve estimates are static for long periods.
4.2.4 Probabilistic Addition
Finally, the way in which individual well, field and country data is aggregated may lead to significant underestimates of 1P reserves. Proved reserve estimates should in principle be derived from probability distributions and correspond to a 90% probability that remaining resources exceed the quoted figure. In the case of 2P estimates, the corresponding probability is 50% and the alternative term is „P50‟. Since they are based upon a probability distribution, it is generally incorrect to simply sum the 1P estimates for individual fields to obtain a 1P estimate for all the fields combined (Pike, 2006). Such an addition is only appropriate when using the mean estimates of reserves from each field. In most cases, a simple summation of 1P reserve estimates from individual fields is likely to underestimate the actual 1P reserves for the fields combined. Put another way, the actual probability of the combined reserves exceeding the sum of the 1P estimates for the individual fields is likely to be more than 90%.
To clarify this further, take the example of throwing two dice (Pike, 2006). If a single dice is thrown, the probability of the outcome exceeding one is 83% (5 out of 6). In other words, the P83 figure is 1.0. But if two dice were thrown, the probability of the outcome exceeding two is 97% (35 out of 36). So the P97 figure is 2.0. The corresponding P83 figure is 4 (6 out of 36), or twice the simple arithmetic aggregation of the two individual P83 figures. Hence, by simply adding the individual P83 figures, the probability of the combined score exceeding two would be significantly underestimated (the probability is actually 97% and not 83%). In a similar manner, the sum of the 1P (P90) estimates of the oil reserves of two fields would be an underestimate of the actual 1P figure for the two fields combined
This is important because at every stage of aggregation of reserves data it is usual for the figures simply to be added together. When 1P reservoir data is aggregated to a whole field, field data to a whole company or country, and national data to the whole world, each time there is a systematic underestimation of the actual 1P reserves which would have been calculated from a consideration of the full probability distributions. Each addition increases the degree of underestimation, with the result that the global estimates are likely to be the most biased. Hence, not only do 1P estimates provide an particularly conservative estimate of likely recoverable resources,
24
UK Energy Research Centre UKERC/WP/TPA/2009/016
but the degree of conservatism is further reinforced by the aggregation process that is normally employed. The result is likely to be a set of numbers which significantly understate the amount of oil likely to be produced.
While similar difficulties also apply to the addition of 2P reserve estimates, the degree of inaccuracy is likely to be much less and the direction of bias is not clear. This is because a 2P reserve estimate is likely to be much closer to the mean estimate and may be either greater or less than the mean depending upon the particular shape of the probability distribution (which will vary from one field to another and from one region to another). Hence, aggregate 2P reserve estimates are likely to be much less misleading than an aggregate 1P reserve estimates.
According to Pike (2006), the underestimation associated with the aggregation of 1P estimates may lead the current estimates for global 1P reserves (1200 Gbs) to be less than half the actual 1P reserves (Connor, 2008). However, this neglects the potential overestimation of 1P reserves by some OPEC countries and since the underlying probability distributions are unknown, it is impossible to be precise about this figure.
4.3 Treatment of US Reserves in IHS PEPS
Another compounding factor in the confusion between 1P and 2P reserves is the differing treatment of US reserves in the IHS PEPS database. The US Lower 48 states would be an excellent example to use in the illustration of 1P and 2P reserve differences given its long and well documented oil market history and the relative maturity of its production cycle. However, the IHS PEPS database only presents what it describes as “proved/established” reserves for the US, which reflects the reporting rules of the Securities and Exchange Commission (SEC). Comparison of US 1P reserve estimates from BP and the corresponding estimates from the IHS database indicates that they have converged in recent years. This illustrates that the IHS data for US reserves must be interpreted differently from the IHS data for the rest of the world reserves, since the former is 1P and the latter are 2P. As a result, the IHS database may underestimate aggregate global 2P reserves – with US reserves currently representing 2.4% of the global total.
4.4 Summary
In sum, publicly available 1P reserve estimates provide an inadequate basis for assessing recoverable resources and can contribute to misleading conclusions about future global oil supply. While there are factors biasing these estimates both upwards and downwards, the net result at the global level remains unclear. Industry estimates of 2P reserves should provide a more useful indicator, but given the inherently probabilistic nature of such estimates and the lack of third-party verification from most OPEC countries, such estimates must remain highly uncertain. Moreover, the cost and confidentiality of the relevant databases presents an obstacle to the more widespread use of such data.
25
UK Energy Research Centre UKERC/WP/TPA/2009/016
5 Production data
5.1 Variation in Production Data
While oil production data do not suffer from many of the difficulties encountered with reserve estimates, there are still some difficulties which are worth examination.
The main consideration when examining oil production data is to identify the liquids included. It would seem intuitive to present figures for crude oil only, but this is impossible in most circumstances given the fact that lease condensate is usually mixed with the crude stream before transportation. This means that most oil production figures include crude oil and lease condensate as a minimum. In addition, NGLs, heavy oil, syncrude, deep water oil and shale oil are included in the production figures from some sources including BP Statistical Review, IEA, EIA and IHS.
Figure 5.1 compares global production figures from five data sources. It is clear from this that production figures from different sources agree more closely than do the reserve figures from the same sources, but there are still some important differences.
Figure 5.1: Global oil production data as presented in BP Statistical Review, World Oil, Oil and Gas Journal, IEA Oil Market Report, EIA International Petroleum Monthly and IHS PEPS database
50
55
60
65
70
75
80
85
90
1970 1980 1990 2000 2010
Pro
du
ctio
n V
olu
me
(m
b/d
)
YearBP World Oil OGJ IEA OMR EIA IPM IHS PEPS
Three distinct pairs of data can be identified in Figure 5.1:
OGJ and World Oil agree closely, largely because they only include crude oil syncrude and lease condensate in their production figures.
26
UK Energy Research Centre UKERC/WP/TPA/2009/016
BP Statistical Review and the IHS PEPS database also agree closely, owing largely to the inclusion of NGLs in addition to crude oil and lease condensate.
IEA and EIA also agree closely and provide the largest estimates of global oil supply. These two sources have the most inclusive coverage, including biofuels and refinery/processing gains in addition to NGLs, condensate and crude.9
On this basis it is reasonable to assume that the majority of the differences between the data sources can be attributed to the inclusion of different liquid types.
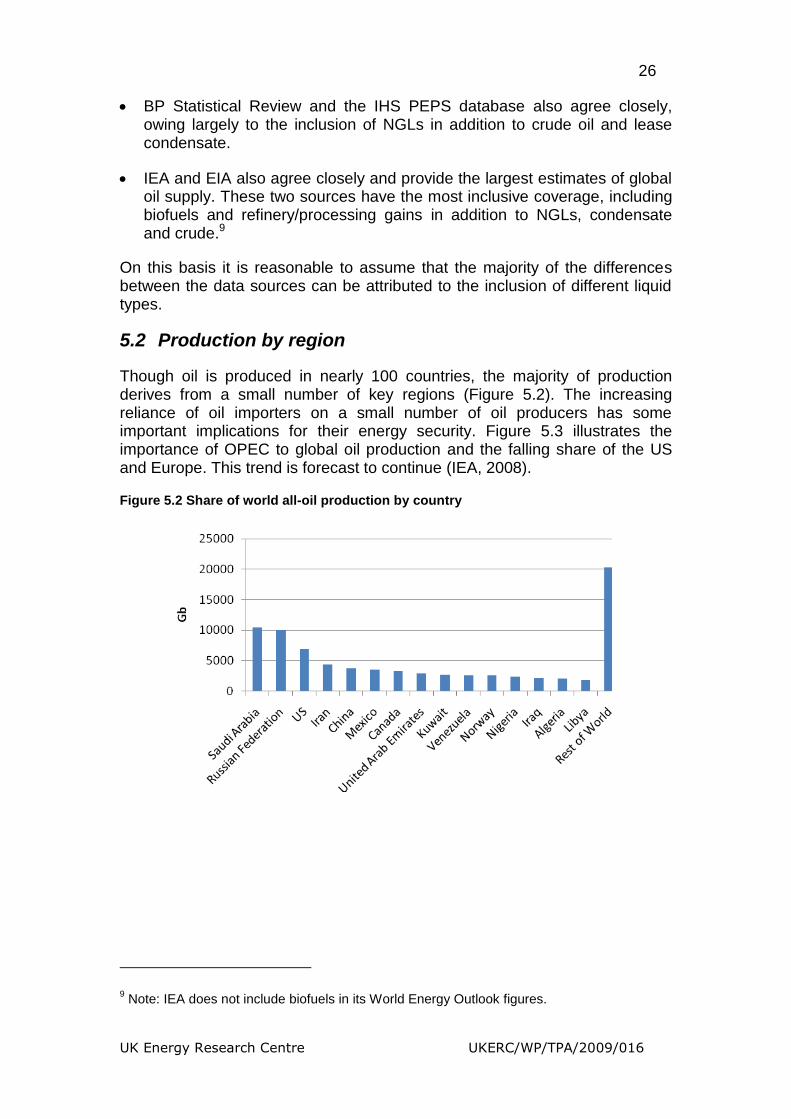
5.2 Production by region
Though oil is produced in nearly 100 countries, the majority of production derives from a small number of key regions (Figure 5.2). The increasing reliance of oil importers on a small number of oil producers has some important implications for their energy security. Figure 5.3 illustrates the importance of OPEC to global oil production and the falling share of the US and Europe. This trend is forecast to continue (IEA, 2008).
Figure 5.2 Share of world all-oil production by country
9 Note: IEA does not include biofuels in its World Energy Outlook figures.
27
UK Energy Research Centre UKERC/WP/TPA/2009/016
Figure 5.3: Share of world oil production for selected regions.
Note: European Union excludes Estonia, Latvia and Lithuania prior to 1985 and Slovenia prior to 1991.
Source: BP(2008a; b)
Table 5.1 ranks the top 49 oil producing countries in 2007 which together accounted for 98.9% of global liquids production. The table shows their share of global production and the change in production over the last five years. Here we can see the top 5 producers accounted for 43.4% of global production in 2007, with Saudi Arabia and Russia each accounting for 10%. Of these producers, the US has seen oil production decline since the early 1970‟s and recent reports suggest that Russia may be moving into a production decline of its own (Belton, 2008; Hoyos, 2008).
28
UK Energy Research Centre UKERC/WP/TPA/2009/016
Table 5.1: Top 49 oil producing countries representing 98.9% of global production.
Note: BP includes crude oil, shale oil, oil sands and NGLs in production data
Figure 5.4 illustrates the change in production over the last five years. Twenty one countries have experienced production declines over this period, including some large producers such as Mexico and Norway. Twenty eight countries have increased production over this period, with the largest increases coming from Russia. If Russian production goes into decline, this could significantly alter the balance of global oil production.
Figure 5.4: Change in oil production over the last 5 years for top 49 producing countries.
Source: BP (2008a; b)
Table 5.2: Liquids making up liquid petroleum production (kb/d)
Figures from EIA International Petroleum Monthly 3,4
Data from the IEA Oil Market Report 5Other Liquids: Liquids produced from coal and oil shale, non-oil inputs to methyl tertiary
butyl ether (MTBE), Orimulsion, and other hydrocarbons. 6Other liquids calculated as EIA total liquids minus crude oil and lease condensate, NGLs,
biofuels and refinery gains.
5.3 Net Production/Net Exports
It is common to focus primarily on a global production, or global supply of crude oil. However, for many purposes, a more relevant approach would be to assess the data on net exports.10
In recent years, many of the major oil exporting countries have experienced rapid increases in domestic oil consumption. This has had a significant effect on oil exports, reducing the proportion of total production that is available to the global market. For regions with declining oil production, these internal factors can lead oil exports to decline at a faster rate than domestic production. To illustrate this, Figure 5.5 presents consumption, production and net export data for Indonesia. It is clear that, even though production was reasonably stable between 1980 and 2000, domestic consumption rose significantly over the same period. This reduced the volume of oil available for export, leading to Indonesia becoming a net oil importer in 2008 and no longer fulfilling the criteria for membership of OPEC. This sustained growth in domestic consumption, at a time when domestic production was faltering, was driven by rising population, increasing economic prosperity and subsidised fuel prices - especially for transport. This combination of factors is common to many oil exporting countries and helps to increase domestic demand while interfering with price signals which may otherwise encourage some demand response.
10 In the following discussion, all illustrations will refer to net oil available. This represents only
a calculation of the difference between production and consumption for a country or region as reported in the BP Statistical Review 2008. As such these illustrations may not fully address issues such as volumes kept as strategic reserves or the balance of oil products.
31
UK Energy Research Centre UKERC/WP/TPA/2009/016
Figure 5.5: Indonesia oil production, oil consumption and net oil available for export
Source: BP Statistical Review 2008
The UK experience is also worth examining Figure 5.6 illustrates UK production, consumption and net oil available for export since 1970 and shows that consumption has remained relatively stable throughout this period – due in part to a relatively stable population, rising vehicle fuel taxes and the displacement of oil consumption from most non-transport sectors. As a result, the recent decrease in the oil available for export was driven mostly by falling production. As domestic production and consumption converged, net oil exports fell rapidly to zero, with the UK becoming a net importer in June 2007.
32
UK Energy Research Centre UKERC/WP/TPA/2009/016
Figure 5.6: UK oil production, oil consumption and net oil available for export.
Source: BP Statistical Review
One concern for oil importing countries is that many of the major oil exporting countries have comparable conditions to Indonesia, namely rising populations, improving economic prosperity and fuel subsidy regimes. If consumption in exporting countries increases significantly, the oil available for export could both peak before global oil production peaks and decline more rapidly.
33
UK Energy Research Centre UKERC/WP/TPA/2009/016
6 Summary
Understanding and forecasting future oil supply requires careful analysis of data on oil production and reserves. This data is collected and published by several different organisations and is subject to differing definitions and uncertainties. The conclusions of such studies depend very much on the accuracy and reliability of the data used and disputes over such data are a central feature of the peak oil debate.
This report has defined many of the terms relevant to interpreting oil industry data (Section 2), summarised and compared the main sources of data (Section 3), highlighted the particular difficulties in interpreting reserve estimates and the discrepancies between different data sources (Section 4) and summarised some basic information on the pattern of global oil production (Section 5). Common themes throughout included the lack of standardised definitions, the differing coverage of key liquids, the high-level of uncertainty associated with much of the data, the lack of third-party verification and the implied need for more standardised reporting. Overall, the present state of the data on the global oil industry is extremely unsatisfactory and creates considerable scope for both confusion and disagreement. Unfortunately, there seems little prospect of this improving in the near future.
34
UK Energy Research Centre UKERC/WP/TPA/2009/016
35
UK Energy Research Centre UKERC/WP/TPA/2009/016
7 References
AEUB. (2005). "Alberta's Energy Reserves 2005 and
Supply/Demand Outlook 2006-2015." Alberta Energy and Utilities Resources Board.
Belton, C. C., E.;. (2008). "Russian oil at its peak, says Dudley." Financial Times.
Bentley, R. W., S. A. Mannan, and S. J. Wheeler. (2007). "Assessing the date of the
global oil peak: the need to use 2P reserves." Energy Policy, 35:12, pp. 6364-82.
BP. (2008a). "BP Statistical Review of World Energy." BP: London.
BP. (2008b). "Statistical Review of World Energy 2008 ". BP plc: London.
Campbell, C. J. and S. Heapes. (2008). An atlas of oil and gas depletion. Huddersfield:
Jeremy Mills Publishing.
Cleveland, C. J. (1992). "Energy surplus and energy quality in the extraction of fossil
fuels in the U.S." Ecological Economics, 6:2, pp. 139-62.
Cleveland, C. J., R. K. Kaufmann, and D. I. Stern. (2000). "Aggregation and the role
of energy in the economy." Ecological Economics, 32, pp. 301-17.
Connor, S. (2008). "Oil shortage a myth, says industry insider." Independent.
Cronquist, C. (1991). "Reserves and probabilities - synergism or anachronisim?"
Journal of Petroleum Technology, 43:10, pp. 1258-64.
EIA. (1998). "Monthy Energy Review - September." Energy Information
Administration: Washington D.C.
EIA. (2006). "Definitions of Petroleum Products and Other Terms." U.S. Energy
Information Administration: Washington DC.
EIA. (2008a). "International Petroleum Monthly." Energy Information Admin.
EIA. (2008b). "What Fuels Are Made From Crude Oil?", Vol. 2008. EIA.
Hoyos, C. B., J.;. (2008). "Fears Emerge ove Russia's oil output." Financial Times.
IEA. (2007b). World Energy Outlook 2007: Intl Energy Agency.
IEA. (2008). "World Energy Outlook 2008." International Energy Agency, OECD:
Paris.
IEA. (2009). "Oil Market Report." 10 April. International Energy Agency.
IHS. (2008). "Petroleum Exploration and Production Statistics." IHS.
36
UK Energy Research Centre UKERC/WP/TPA/2009/016
Karbuz, S. (2004). "Conversion factors and oil statistics." Energy Policy, 32:1, pp. 41-
45.
Koppelaar, R. (2009). "Oilwatch Monthly February 2009." ASPO Netherlands.
Leach, G. (1975). "Net energy analysis — is it any use?" Energy Policy, 3:4, pp. 332-
44.
Lenzen, M. and C. Dey. (2000). "Truncation error in embodied energy analyses of
basic iron and steel products." Energy, 25:6, pp. 577-85.
Miller, R. G. (2005). "Global oil supply to 2030." Unpublished Manuscript.
Mills, R. M. (2008). The myth of the oil crisis. Westport, CT, USA: Praeger
Publishers.
Mitchell, J. (2004). "Petroleum reserves in question." Chatham House.
OPEC. (2008). "OPEC Secretariat Web Page." Vol. 2008. OPEC: Austria.
Pike, R. (2006). "Have we underestimated the environmental challenge?" Petroleum
Review, June, pp. 26-27.
Radler, M. (2007). "Oil, gas reserves inch up, production steady in 2007." Oil & Gas
Journal, 105:48, pp. 22-23.
Robelius, F. (2005). "Giant Oil Fields and Their Importance for Peak Oil." Licentiate
thesis from Uppsala University.
Smith, M. (2008). "EnergyFiles Forecasting Model - Oil production." EnergyFiles Ltd.
WorldOil. (2007). "Operators ride the crest of the global wave." World Oil, 228:9, pp.
4.
37
UK Energy Research Centre UKERC/WP/TPA/2009/016
Annex 1: Hydrocarbon chemistry
Some basic facts about hydrocarbon chemistry may be helpful. Hydrocarbons are any compound of hydrogen and carbon. Carbon has four chemical bonds while hydrogen has one. The simplest hydrocarbon is methane, CH4 in which the four carbon bonds are attached to four hydrogen atoms. The next simplest is ethane, C2H6 which is used both as a refinery fuel and chemical feedstock.
A whole class of hydrocarbons can be defined by extending the relationship between methane and ethane. These molecules are called paraffins and are straight chain compounds with the formula CnH2n+2. Examples are propane (C3H8), normal butane (C4H10) and normal pentane (C5H12). The normal prefix is necessary as there are several ways to arrange the atoms in compounds such as butane. One arrangement, which has a branch structure is called iso-butane. Similarly we can have iso-pentane. These compounds have the same chemical formula but have different evaporation temperatures and specific gravities (since they are packed differently), and cause different chemical reactions.
Napthenes are ring or cyclic compounds, in contrast to the paraffin chains. When five carbon atoms are linked in a ring, the compound is cyclopentane (C5H10). There are fewer hydrogen atoms in this than the corresponding pentane. An infinite variety of compounds up possible by combining paraffin and napthenes.
It is possible to have compounds with two carbon atoms and only four hydrogen atoms. This occurs through the carbon atoms being linked with a double bond. The resulting compound is called ethylene, C2H4. Similarly we have propylene (C3H6) and butylene (C4H8). The generic name for this family of compounds is olefins, with the general formula CnH2n. The key characteristic is the absence of two hydrogen atoms from an otherwise saturated paraffin. The double bond is weaker than a single bond, making these compounds unstable. They therefore bond easily with other compounds or elements. For example, ethylene can bond with itself to form polyethylene.
Aromatic compounds have double bonds within the napthene ring structure. Every other bond within the ring is a double bond. The primary example is benzene (C6H6). Toulene (C7H8) is a similar compound with one hydrogen atom replaced by the methyl radical CH3. Similarly, xylene (C8H10) has two hydrogen atoms replaced in this way. The double bonds in the benzene ring are very unstable and chemically reactive. Hence benzene is a popular building block in the chemical industry.
38
UK Energy Research Centre UKERC/WP/TPA/2009/016
39
UK Energy Research Centre UKERC/WP/TPA/2009/016
Annex 2: Oil products
The primary products of the oil industry fall into three broad groups: fuels; finished non-fuel products and chemical feedstocks. Petroleum products are used as a primary input to a vast number of products, including: fertilisers; pesticides; paints; waxes; thinners; solvents; cleaning fluids; detergents; refrigerants; anti-freeze; plastics and synthetic fibres. About 90% of the petroleum products used in the UK are fuels, with gasoline accounting for around 31% of the total.
The following paragraphs briefly introduce the main product groups
Fuels
Propane (C3H8): Gaseous at normal temperature but normally transported and stored under pressure as a liquid (liquefied petroleum gas or LPG). Used mainly for industrial purposes and some domestic heating and cooking.
Butane (C4H10): Used as LPG for domestic purposes and additionally as a constituent of gasoline to increase vapour pressure.
Naphtha: Petroleum distillate boiling predominantly below 200oC and used primarily as a feedstock to other refinery processes.
Aviation spirit: Light hydrocarbon oil intended for use in aviation piston-engine power units, whether in the air, on land or on water. Blending with a range of hydrocarbons (isopentane, alkylate etc.) is necessary to obtain the required combustion performance.
Gasoline: Formed from blended light oils and used as a fuel in spark ignition engines other than aircraft engines. The two critical variables for gasoline are: i) vapour pressure, which is a measure of the surface pressure it takes to keep it from evaporating (standardised at 60oC); and ii) octane number, which is a measure of how easily gasoline will self ignite (knock) when compressed in an engine (Leffler, 1985). The required characteristics are obtained through additives and blending.
Kerosene: This is intermediate in weight and volatility between gasoline and gasoil. There are two main categories: aviation turbine fuel and burning oil. The former is used in aviation gas-turbine power units, while the latter is used for domestic heating. The sulphur content of kerosene is typically <0.05%, while burning oil is ~0.02%.
Gasoil/automotive diesel: This can be divided into three categories: Derv (diesel engine road vehicle) fuel, used in high speed compression ignition engines in vehicles subject to Vehicle Excise Duty (VED); Gasoil, used as a burner fuel in boiler installations, for industrial gas turbines and as for derv in vehicles not subject to VED; and Marine diesel, which is a heavy type of gasoil, or gasoil/HFO blend, suitable for heavy industrial and marine compression ignition engines. The two critical variables for diesel are cetane
40
UK Energy Research Centre UKERC/WP/TPA/2009/016
number, which is a measure of the rapidity of ignition; and wax content which relates to the performance of the fuel at low temperature.
Heavy Fuel Oil (HFO): This is a heavy blend of petroleum residues used in power stations, large industrial boilers and heavy duty marine diesel engines. The marine market is termed bunker fuel. HFO is highly viscous and usually requires pre-heating before combustion. Sulphur content has historically been high (particularly for bunker fuels), but is increasingly subject to regulation throughout the world.
Non-fuel products
White spirit: A highly refined distillate with a boiling range of 150-200oC used as a paint solvent and for dry cleaning purposes.
Industrial spirit: Refined petroleum fractions with boiling ranges up to 200oC depending upon the use to which they are put - e.g. seed extraction, rubber solvents, perfume etc
Lubricating oils: Refined heavy distillates obtained from the vacuum distillation of petroleum residues. Lubricating oils are classified both by their viscosity, which varies widely with the application, and their viscosity index, which is a measure of how viscosity changes with temperature.
Bitumen: The residue left after the production of lubricating oil distillates and vacuum gas oil. Used mainly for road making and building construction purposes.
Petroleum wax: Includes paraffin wax, which is a white crystalline hydrocarbon material of low oil content normally obtained during the refining of lubricating oil distillate. Used for candle manufacture, polishes, food containers, wrappings etc.
Petroleum coke: Solid material whose uses include electrode manufacture. A quantity of this product is used as a fuel, primarily in cement production.
41
UK Energy Research Centre UKERC/WP/TPA/2009/016
Annex 3: Refining crude oil
The refining of crude oil into petroleum products is a complex activity involving a wide range of industrial processes. The first stage is to separate the feedstock, which is typically a blend of crude oils from more than one source, into fractions of different boiling points. This is achieved through either atmospheric or vacuum distillation. Each fraction is then treated differently to upgrade its quality into saleable products. These conversion processes include cracking, to break down long chain hydrocarbon molecules to lighter compounds, and hydrotreating, to remove sulphur.
Refineries use very complex series of multiple operations, the pattern of which depends upon the properties of the crude mix and the portfolio of products required. As a consequence, no two refineries are alike and refineries may differ considerably in their level of complexity. The smaller and simpler refineries are characterised by the use of physical separation processes, such as distillation, with only limited use of conversion. The US term for this type of refinery is hydroskimming, referring to the use of hydrogen to upgrade the distillates skimmed from the crude. In contrast, complex refineries make extensive use of energy intensive conversion processes such as „severe‟ hydrotreating and catalytic cracking. Historically, the aim has been to maximise production of the lighter, high value products such as gasoline, and to minimise the production of the heavy, low value residues – although with the shift from gasoline to diesel in the passenger car market of many countries, these priorities have changed.
Sometimes a third classification of very complex refineries is used, where advanced technology is employed to either break residual fuel (HFO) into lighter components or to derive petrochemical feedstocks. The following table indicates the typical yield of each refinery type.
42
UK Energy Research Centre UKERC/WP/TPA/2009/016
Table A.3.1 Typical percentage yields from different types of refinery
Simple Complex Very complex
Gasoline 30 50 65
Kerosene 10 19 20
Gasoil 20 17 25
Residual 35 20 0
Source: Leffler, 1985
The complexity of a refinery is often expressed numerically as a complexity factor (Leffler, 1985, p134). A distillation unit has, by definition, a complexity factor of 1.0. The add-on complexity of the rest of the refinery is calculated by multiplying the defined complexity factor of each unit by its relative throughput. For example, hydrotreating has a complexity of 0.5 and treats 35% of the flow, so it adds 0.175. Using this scheme a typical hydroskimming refinery has a complexity of around 2.5. In contrast, a complex refinery will have a complexity of around 9-10. At the extreme end of the range are refineries that have facilities to produce the high value added products such as petrochemicals. For example, an aromatics recovery unit has a complexity factor of 33, although it only treats a small portion of the flow. This type of refinery can have a complexity factor of around 16.
Following distillation, the key refinery processes can be classified as follows:
Cracking (thermal cracking, catalytic cracking, visbreaking, hydrocracking and coking). These processes break down large hydrocarbon molecules into smaller components.
Combining (alkylation, polymerisation). These processes combine small chain molecules into larger ones.
Rearranging (catalytic reforming, isomerization). These processes alter the arrangement of hydrocarbon molecules.
Treating (hydrotreating, chemical treating). These processes remove sulphur and other contaminants.
Blending. These processes combine intermediate products in various quantities to produce final products of the required specification.
In addition, there is a range of supporting operations including: water treatment; sulphur recovery; flares; fuel systems and combustion processes; and hydrogen production. Finally, there are facilities for loading and storing crude and finished products.