THIS REPORT CONTAINS ASSESSMENTS OF COMMODITY AND TRADE ISSUES MADE BY
USDA STAFF AND NOT NECESSARILY STATEMENTS OF OFFICIAL U.S. GOVERNMENT
POLICY
Required Report - public distribution
Date: 2/3/2010
GAIN Report Number: UP1003
Ukraine
Retail Foods
Slow Down after Rapid Expansion
Approved By:
Ann E. Murphy, Agricultural Attaché
Prepared By:
Alexander Tarassevych, Agricultural Specialist
Report Highlights: Throughout 2009 the Ukrainian retail sector experienced difficulties that followed from the excessive growth of 2002-2008.
Consumers responded to shrunken incomes and steep loan repayment terms. Credit vanished. For 2010 projected sales are
expected to stabilize or to grow insignificantly. Retail chain expansion is expected to stop with few new stores opening in
major urban centers. Price-cautious consumers have retreated to open-air markets, smaller stores and cheaper stores. Sales
of imported products will likely continue to sink with sales margins down.
Post:
Kiev
Executive Summary: SECTION I. MARKET SUMMARY
Ukrainian retail trade in food products developed rapidly over the past 7 years. This growth had
been driven by a strong economy and by an increase in consumers’ incomes. Some changes in
the expansion pattern were observed in 2007 – early 2008 with more emphasis on small retail
formats, shopping malls development and expansion of chains into the regions. The October
2008 financial crisis ended these rapid expansion trends and opened a whole new period in
Ukrainian retail development. The Ukrainian currency the Hryvna (UAH) lost 63% of its value
against the US dollar before stabilizing in the early fall of 2009. The country’s expected GDP contraction was 14.7% in 2009, which resulted in a sharp 20%
decline in retail turnover and an even more drastic 34% decline in retail chains and stores. The
performance of the retail sector will be tied to performance of the rest of the economy and
consumers’ incomes. Developments of 2009 promise a quite turbulent 2010: for political reasons
the GOU has maintained expensive socially-oriented programs which are likely to be reduced or
eliminated in 2010. Although these programs cushioned the impact of the financial crisis on
population they also postponed much needed structural reforms. The GOU and international
organizations agree on modest 2.5-4.5% GDP growth forecast in the next year. Together with
social program reductions, this forecast gives little chance for consumer incomes growth and
retail trade recovery. In 2010 financially sound retailers will continue their efforts on M&A market seeking to gain
control over regional, small or heavily indebted chains. Some foreign chains may use the
situation to their favor looking for attractive assets among local chains or acquiring attractive
locations of bankrupt Ukrainian retailers. The financial condition of the majority of Ukrainian
retailers will remain difficult due to massive debt repayments. Suppliers of food products to Ukrainian chains will continue to face payment problems limiting
sales and assortment. The share of foreign food products will continue to decline as well as the
number of distributors ready to work in the extremely difficult environment.
Author Defined:
Developments Prior to Crisis Period
In 2007 and 2008 the Ukrainian food retail sector quickly grew with increases in turnover of trade
at 29% and 27% respectively. The share of unorganized trade in open-air markets decreased
from 29% to 22% over those two years. The share of chains rapidly grew from 26% to 33% for
the same time period. Retailers’ expectations were that the market would continue to grow at 20-
25% until 2011-2012 when some saturation point was foreseen. After capturing the big cities with
population over 1 million retailers concentrated on regional expansion. Growth in big urban
centers remained attractive, but expansion costs were too high. An overheated real-estate
market, problems with building permits, distribution of land plots and widespread corruption made
development of supermarkets problematic. Many multinational chains considered the
environment in Ukraine to be too hostile for market entry. This situation was reflected in A.T.
Kearney’s Global Retail Development Index (GRDI). In 2005 Ukraine received 87 points (out of
100) and was ranked 4th among countries where international retailers were recommended to do
business. The country slipped to 17th place in 2008, but kept this position in the 2009 report. In
the capital many chains concentrated on a smaller format as an adjustment to fewer available
locations. Most self-service grocery stores were opened as replacements of old soviet-style stores
where clerks served customers from behind the counter.
Regional development brought new challenges for national retail chains. Strong local competitors
were reluctant to give up market share without a fight when nation-wide chains entered their
ground in 2005. All national chains started in the capital Kyiv where market size and consumer
incomes were the largest. In the past 3 years competition fought for market dominance by
fighting for the most advantageous real estate. Chains almost gave up trying to win over
customers based on satisfaction of consumer preferences. Despite relatively low saturation of the
Kyiv market, high rents and the cost of real estate drove Ukrainian retail business to expand
regionally.
Still, the development of retail in Ukraine continued at a fast pace with no clear distinction of
supermarket formats. Any self-service store of 200-300 square meters would declare itself a
“supermarket” with competition through low price offers. Some self-organization started only in
2008-2009 with international retailers entering the market and growing. Prior to the financial
crisis many retailers saw the following formats worth attention: convenience stores, shopping
malls, hypermarkets, and the gourmet grocery store niche. Convenience stores succeeded mostly
due to low barriers to entry, abundance of locations and low risks. Trade developments of 2009
suggest that over the crisis period convenience grocery stores will remain viable in the near
future, but longer industry trends suggest hypermarkets and shopping mall formats are likely to
succeed.
Regional expansion was not an easy task for Kyiv retailers. Many sale practices successful in Kyiv
proved to be inefficient in the Ukrainian regions. Many good locations were already occupied by
local competitors unwilling to give up profitable plots cheaply. Many local chains started their own
expansion programs by offering to sell their business to foreign chains or to nationwide
competitors at the highest price. This development in turn led to real estate price growth in many
regional markets. The local consumers happened to be loyal to local retailers and only significant
price discounts could persuade them to switch. The product sets in many regions were very
different form those in Kyiv with consumers preferring their local brands and local suppliers. Many
regional retailers were quite successful and started their expansion into neighboring markets and
even in Kyiv. Regional chains like Amstor, ATB and Pakko can be considered nationwide now.
State Regulation of the industry was quite messy. On one hand the Government of Ukraine
attempted to support farm incomes, but also acted to limit food product costs to benefit
consumers. After significant food price surges in early 2008, these controversial goals resulted in
a law that limited trade margins to 15% for many food items. The list included bread, wheat flour,
dairy products, buckwheat groats, meats and some other staple foods. This law was adopted on
May 16, 2008. Trade margins of many Ukrainian discount hypermarkets remained under the 15%
threshold prescribed by law. On the other hand, convenience stores in city centers would not stay
in business if operated at a 15% margin. Many of them paid high rent for their space and would
have to quit business should the law be enforced. In the end, all Ukrainian retailers found ways to
get around the 15% strictures of the law.
Mergers, Acquisitions and International Expansion
Ukraine did not provide good grounds for international chains to expand retail businesses. Rather,
Ukrainian investment expanded into some less developed foreign markets. Many Russian retailers
viewed Ukraine as a good territory for business development, but none of them met with
success. Russian Prekrestok, Piaterochka and Patterson opened their stores in different
cities. Patterson sold their business to the Ukrainian chain “Eco” in 2007. Another Russian
retailer, Paterson, announced an ambitious plan in 2005, but did not move much
further. Piaterochka sold their locations in Eastern Ukraine to local competitors at the end of
2007. Prekrestok was able to open 6 locations in Kiev and surrounding cities, but stopped further
expansion. Existing stores did not attract sufficient buyers, operating in a “conventional
supermarket” format.
Facing a shortage of potentially profitable locations, heavy competition from local chains, political
obstacles at the local authority level (in bids for land plots) and crisis developments in Ukrainian
retail, Russian chains started M&A negotiations with some Ukrainian retailers. The price range
given by current owners did not satisfy the Russians and no deals were done in 2008-2009. It is
not clear whether Russian chains will be able to enter the Ukrainian market on the back of the
financial crisis since they experience liquidity problems themselves. Downward trends in retail
business are evident at the time of this writing, and no blocks of controlling shares of national-
wide chains are yet for sale. Regional retailers available for sale now are of less interest to big
players.
Ukrainian expansion into neighboring countries was more successful. Two of the biggest Ukrainian
retailers entered the Moldova market. Kviza Trade (Velyka Kyshenia TM) now owns 9
supermarkets (through the purchase of the local chain Green Hills) and Furshet Ltd (La Furshet
TM) also owns 9 supermarkets under its own brand, all in Moldova.
Due to market entry obstacles one international retailer decided to cooperate with one of the local
chains. The joint venture of Furshet and Auchan Group (France) was established in March of
2007. The French retailer agreed on portfolio investment into the La Furshet chain. The deal is
not completely public, but FAS/Kiev is aware that Auchan Group purchased a 20% share of
Furshet chain in exchange for an unknown sum of money plus 34% share of Furshet in any
Auchan hypermarket store opened in Ukraine or Moldova. Furshet Ltd. also agreed to facilitate
Auchan Group’s search for new locations (one plot was provided in Kiev right after the deal) and
lobbying its interest at the regional level. Another joint stock company (Auchan Group -60%,
Furshet management -30%, independent investor – 10%) will start development of shopping
malls in Ukraine.
Auchan market entry is the first western chain entry after Metro Group AG 5 years ago. The 4
Auchan stores in Kiev so far are quite successful. The chain management claims that products are
offered for sale with 15% price discount to other chains; suppliers are not charged any marketing
cost and paid within 2 weeks after the product is sold.
The biggest portfolio investment proposal came from one of the biggest Ukrainian retailers – Kviza
Trade Ltd. (Velyka Kyshenia Chain). Facing $135 million debt, the company put on sale
considerable minority share (slightly under 50%) at the end of 2008, looking for $200-250 million
investment. Ukrainian investment brokerage Dragon Capital and British Royal Bank of Scotland
were chosen as sales consultants. The results of the year-long sale are not yet known, but many
believe that the company significantly overestimated its value due to plummeting real restate
prices and sales drop. According to some sources the company is looking for a strategic investor
in Russia with X5 being the most probable buyer.
Some smaller M&A deals in retail industry have concluded. The financial indicators show that
nowadays it is clearly a buyer’s market. Expensive mergers and acquisitions of 2005-08 are in
the past. Unable to find strategic or portfolio investors some retailers went bankrupt. O’key-
Ukraine Chain (owned by the Expert Capital SA, Luxembourg) went bankrupt in early 2009
leaving hundreds of suppliers unpaid. Auchan Group used the opportunity for further
expansion. It purchased equipment and one attractive location of a bankrupt retailer. O’key-
Ukraine restructured approximately UAH 400 million ($50 million) of its debts to banks and
suppliers with another over UAH 100 million ($12.5 million) of unpaid debt.
Two other international retailers saw a silver lining in the cloud of Ukraine’s crisis. German Metro
Group launched Real supermarket chain in Southern Ukraine. Austrian Billa probably is not
interested in big-scale M&As, but is quickly developing a local network buying separate locations
from local chains.
In 2009 some supermarket chains defaulted on their obligations to local investors. Karavan Ltd.
(Karavan TM) in March of 2009 announced default on coupon and principal of local bonds in
circulation for UAH 160 million ($20 million). Investors allege that the chain attempted to move
assets to a different company leaving an empty shell company responsible for the debt.
At the end of 2008 the Midland Group sold its retail business to one of the distributing
companies. The MD Retail chain of 47 grocery shops in eastern Ukraine was sold for
approximately $20 million. The new owner (Ns Ltd.) announced an ambitious expansion program,
but did not settle disagreements over this acquisition by early 2010. Intermarket Ltd. (Arsen
chain) was acquired by rival Eurotech Group (EcoMarket chain) in spring of 2009. Troubled
Intermarket lost their Barvinok grocery chain in 2008, but was not able to manage excessive debt
of over $21 million on the remaining facilities. According to market analysts the Eurotech did not
do very well itself, but managed to attract an external loan form Horizon Capital Fund. Many
believe that owners were not able to benefit from the deal.
According to various mass media, controlling shares sales or minority share sales are announced
by the following regional chains: Nash Kraj, Pakko and Agrokontract from western Ukraine,
Amstor from the east and Bolshaja Lozhka from central Ukraine. Potential buyers sense market
weakness and probably will purchase regional retailers at a significant discount. Big nation-wide
chains are experiencing problems by themselves and probably will not actively participate in
mergers and acquisitions this year.
Retail in Crisis
Caught in the middle of rapid expansion programs many Ukrainian retailers were not able to
service bank loans or to pay their suppliers. Many business growth strategies did not foresee the
financial or economic downturn and retailers had no backup plans. Significant problems started in
early 2008, when financial resources became scarce and very expensive due to a National Bank of
Ukraine policy change. The values of the UAH is about half of what it was in the fall of 2009, so
dollar denominated loans became significantly more expensive to repay. The UAH devaluation has
brought unwelcome consequences for chains, which expanded based on finances that changed
radically in 2008 or 2009. The burden was so significant that many retailers started a strategic
investors search offering controlling-share acquisitions. Limited in financial resources small
Ukrainian grocery store chains were the first to suffer. Some companies decided to keep control
over their business and proposed only minor shares to address current liquidity problems. Many
nation-wide chains are looking for financial support of this type.
Despite very pessimistic forecasts announced by industry experts in early 2009, the majority of
retailers managed to restructure their debt to keep their companies afloat. Chains conducted big
cost cutting programs, reviewed assortment, contracts with suppliers and operational procedures.
Major lenders had no other option but to agree on debt restructuring to avoid greater losses.
Bankruptcies of major chains would result in significant losses due to multiple loopholes in
bankruptcy legislation and a corrupt judicial system in Ukraine. Besides, banks were interested in
keeping chains as clients with good cash flows. In the past many banks attracted syndicated loans
from abroad to finance Ukrainian retail. Throughout 2009 foreign banks were rather flexible in
debt restructuring issues receiving massive support from their governments. Banks were so
cooperative that many chains (see the last paragraph of the M&A section) started withdrawals of
their initial shares offers.
Many believe that debt restructuring of 2009 only postponed the problems of the industry, rather
than resolving them. Problems of major chains may continue in 2010-11 should the economic
crisis in Ukraine deepen.
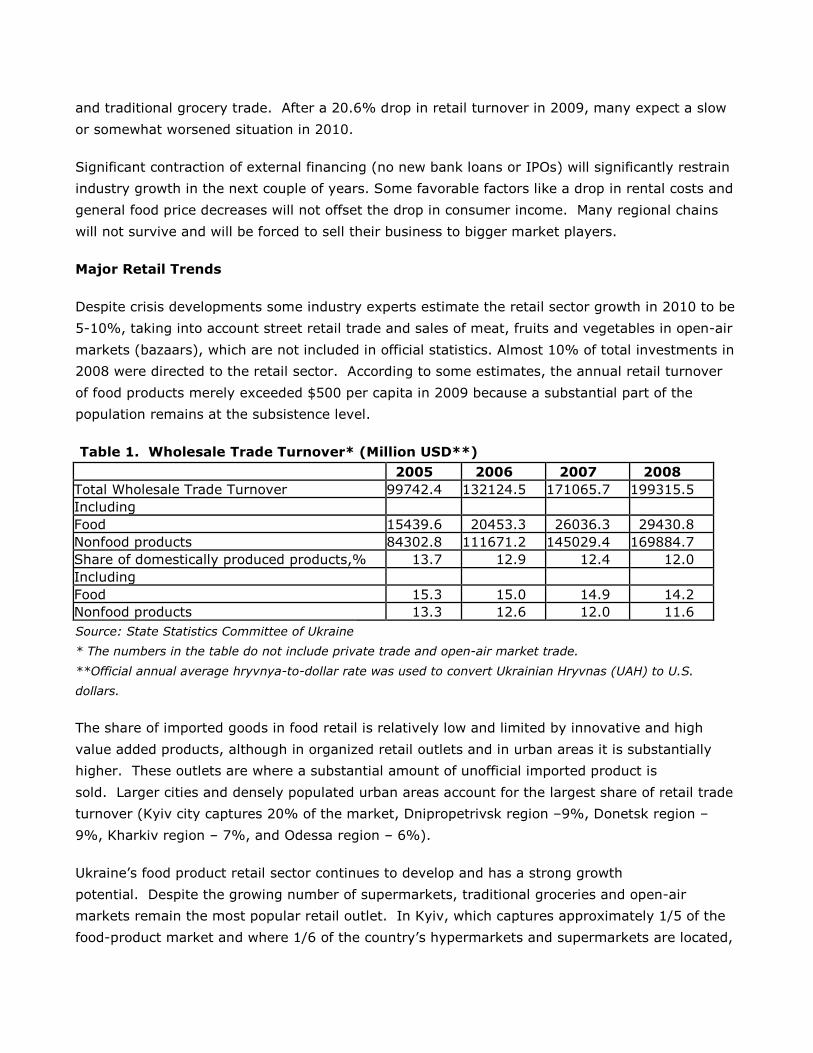
Ukraine’s Retail Turnover*
*Both food and non-food items
** Forecast
Crisis developments have already led to significant payment delays to food producers and
importers. Even before the crisis many suppliers complained about contract terms that allowed
for late payments (sometimes 60-90 days). For this reason many producers used distributors or
limited their cooperation with Ukrainian retail. Now payment delays extended to 150-180 days.
This way chains are trying to collect some extra cash to insure timely loan payments. Some
importers are seeking justice in Ukraine’s court system, some stopped supplies to the chains, but
the vast majority gave up and agreed on new discriminatory payment terms.
The Crisis decreased the volume of imported food and led to a renaissance of the open-market
and traditional grocery trade. After a 20.6% drop in retail turnover in 2009, many expect a slow
or somewhat worsened situation in 2010.
Significant contraction of external financing (no new bank loans or IPOs) will significantly restrain
industry growth in the next couple of years. Some favorable factors like a drop in rental costs and
general food price decreases will not offset the drop in consumer income. Many regional chains
will not survive and will be forced to sell their business to bigger market players.
Major Retail Trends
Despite crisis developments some industry experts estimate the retail sector growth in 2010 to be
5-10%, taking into account street retail trade and sales of meat, fruits and vegetables in open-air
markets (bazaars), which are not included in official statistics. Almost 10% of total investments in
2008 were directed to the retail sector. According to some estimates, the annual retail turnover
of food products merely exceeded $500 per capita in 2009 because a substantial part of the
population remains at the subsistence level.
Table 1. Wholesale Trade Turnover* (Million USD**)
2005 2006 2007 2008
Total Wholesale Trade Turnover 99742.4 132124.5 171065.7 199315.5
Including
Food 15439.6 20453.3 26036.3 29430.8
Nonfood products 84302.8 111671.2 145029.4 169884.7
Share of domestically produced products,% 13.7 12.9 12.4 12.0
Including
Food 15.3 15.0 14.9 14.2
Nonfood products 13.3 12.6 12.0 11.6
Source: State Statistics Committee of Ukraine
* The numbers in the table do not include private trade and open-air market trade.
**Official annual average hryvnya-to-dollar rate was used to convert Ukrainian Hryvnas (UAH) to U.S.
dollars.
The share of imported goods in food retail is relatively low and limited by innovative and high
value added products, although in organized retail outlets and in urban areas it is substantially
higher. These outlets are where a substantial amount of unofficial imported product is
sold. Larger cities and densely populated urban areas account for the largest share of retail trade
turnover (Kyiv city captures 20% of the market, Dnipropetrivsk region –9%, Donetsk region –
9%, Kharkiv region – 7%, and Odessa region – 6%).
Ukraine’s food product retail sector continues to develop and has a strong growth
potential. Despite the growing number of supermarkets, traditional groceries and open-air
markets remain the most popular retail outlet. In Kyiv, which captures approximately 1/5 of the
food-product market and where 1/6 of the country’s hypermarkets and supermarkets are located,
open-air market sales account for between 30-35% of prepared food products and 70-80% of
fresh meat. Open-air outlets account for 22% of national retail sales for the entire country
although some experts give them significantly higher share.
Despite current sluggish development of the big retail formats, hyper- and supermarkets are
expected to account for 50% of retail food sales by 2013; chain convenience stores/discounters
will capture 20-30% share, open-air markets 15%, soviet style stores (groceries, over-the-
counter trade stores) 10-15%, and other outlets 10%.
“La Furshet” supermarket chain is a good example to demonstrate the rapid growth of the
industry. La Furshet consisted of 15 outlets in 2002 reaching 150 by January 2009 (10 times
growth in 7 years). Nearly 550 mini-, super-, and hypermarkets were operational in Ukraine in
2001. That number increased to approximately 616 stores in 2002, 690 stores in 2003 and to
1,441 in 2007. The payback period for the average retail outlet is 5 to 7 years in Ukraine (for
2009) compared to 10-15 years in EU countries. In 2006, some large chains began CAP software
installation to optimize logistics and promotion programs.
Many Ukrainian supermarkets launched discount programs to encourage frequent buyers, low-
income consumers or retirees. Many still operate simple discount programs (the cheapest to
introduce and retain) while big nationwide chains switched to western-like bonus programs. Some
(La Furshet http://furshet.ua/ and Megamarket http://www.megamarket.ua) offer on-line services
with office or home deliveries. Others offer telephone shopping service.
The largest chains have their own kitchens, mini-bakeries and processing shops. These
departments allow chain stores to offer customers a variety of ready-made food products and
semi-finished products. This includes various ready-made salads, bakery products, packaged
meat cuts, fish and frozen semi-finished products. Supermarkets are also used as anchor stores
in shopping centers and malls. In Ukraine shopping centers usually include boutiques, movie
theaters, cafes, and restaurants (often connected to the food court). Due to the slow
development of shopping centers, many retailers have rented out space to other non-food
vendors.
Ukraine is one of the most populated countries in Europe with 46 million people. A steady
increase in personal incomes before 2008 has had a positive impact on the development of the
retail sector (an increase of 25% in 2008). Per capita income growth rates and the growth in the
retail sector coincided. Over the past 8 years, only 3 large European retailers (Billa, Metro and
Auchan) entered the Ukrainian market to benefit from the strong growth. Usually, retailers enter
markets in large urban areas, followed by expansion into smaller cities and towns. Although local
supermarket chains still outpace foreign companies in terms of the number of outlets, foreign
outlets have much better logistics, tested market-entry strategies, excellent personnel-training
techniques, well-established connections to suppliers and solid financial support. All these lead to
a situation when 3 western companies are responsible for over 40% of Uktraine’s organized large
scale retail market.
Advantages and Problems for US Exporters
Advantages Problems
Population of 45.9 million people; a
number of consumers can afford
purchasing high-quality food products
Due to economic crisis and erosion of incomes,
majority of consumers continue to save money on
food or rely on home produced foodstuffs.
Demand for higher quality food products
is growing.
Volume of sales of higher quality food products is
expected to shrink.
Ukraine’s retail sector is on the rise,
which creates a number of opportunities
for prospective U.S. exporters.
Frequently changing trade legislation and policies
often impact trade. Import tariffs were lowered by
WTO accession but threatened with hikes “to
protect Balance of Trade.”
Urban life style changes increase
demand for semi-finished and ready-to-
cook products
Rapid development of local manufacturers of ready-
to-cook products creates tough competition for
similar imported goods
American-made food and drinks are still
new for the majority of the population,
but rather popular among the younger
generation;
Growing number of domestically produced generic
products; lack of knowledge of American products
In general retailers are open to new
products in order to attract customers
Strong competition with suppliers of similar
products from Russia and European Union
Existence of large importers experienced
in importing food products to Ukraine
High corruption, difficulties in finding a reliable
partner or distributor
Biotech as a means of food production is
practiced, but is illegal in Ukraine.
In 2010 restrictive mandatory labeling of biotech is
expected.
SECTION II. ROADMAP FOR MARKET ENTRY
ENTRY STRATEGY
Every company must choose its own market-entry strategy that is dependent on preliminary
market research results and the type of promoted product. The strategy is also dependant on the
company’s financial strength. However, some basic strategy trends exist for products entering
the Ukrainian market:
A prospective entrant is advised to estimate market perspectives of the product with
respect to consumer preferences and incomes, local competition and sales channels
(marketing research from a specialized consulting firm may be required).
A visit to a food product fair in Ukraine may be very helpful. These events can provide a
market snapshot, as well as identify prospective importers and wholesale vendors. Usually
only large companies participate in these fairs.
Meetings with representatives of state regulatory bodies in order to obtain additional
information on import requirements. Companies are advised to use services provided by
the US Foreign Commercial Service, consultants and foreign partner companies already
doing business in Ukraine.
In order to make the first delivery, usually a large local import company is chosen. The
company should have a good reputation and experience in customs clearance, and must
have storage facilities and a developed distribution network. Make sure the company has
experience working with Western suppliers and has experience in arranging regular
supplies of food products. Western companies that strive to supply directly, circumventing
Ukrainian mediators, often sustain losses due to lack of local market knowledge. A large
domestic import company is usually bettered adjusted to local conditions, with established
trade ties and contacts in state structures. Ukraine remains a country where personal
contacts play an important role in business.
Should the exporting company decide to open a representative office, it is should be
located in Kyiv, where government authorities are concentrated. Other large cities may
also be considered.
Ukrainian import duty rates for food products are very uneven. Import duties for
unprocessed goods or goods in large packages are often zero. Often these commodities
require only minimal processing (frying, adding salt, packaging for retail trade). Duties for
packaged and ready for sale products are higher. Many companies test the market with
finished products, and then look to process and package locally if the product is a
success. This way they manage to reduce custom clearance costs. Many importers
package tea, muesli, chocolates, chips, roast nuts and coffee beans in Ukraine. Packaging
or production is often conducted in Russia or other Commonwealth of Independent States
(CIS) countries. The commodity can be imported from these countries under Free Trade
Agreements (FTA). FTAs are in place for 11 CIS countries. However, a potential importer
should weigh transportation and certification costs.
Supermarket entry costs vary greatly in Ukraine. Charges include a company’s entrance
fee, a shelving fee for each commodity, designated shelf fees, and a fee for positioning a
pallet in the sales area. Entrance fees, designated shelves and pallets would amount to
approximately $100-250 each. Some payments are made once, and others are monthly
charges. The exporter should be ready to pay the retailer a percentage of the trade
turnover (calculated from sales or per 1 meter of shelf space). These payments are also
made on monthly, quarterly or annual basis. There will be some payments associated with
retail chain marketing costs, advertising booklets and in-store promotion actions. The total
sum for all services and fees will range from $1,000 to $1,500, per commodity per
store. All fees are negotiable and depend on a product type.
MARKET STRUCTURE
Food Retail Distribution Channels
Distribution Channels
The vast majority of importers/distributors have offices in Kyiv or in the large Black Sea port of
Odessa. Portside offices are often used solely for customs clearance procedures. Following arrival
at port, the product is then shipped to Kyiv. From Kyiv the consignment is then distributed to the
regions or directly delivered to regional distributors. Some importing companies purchase goods
on CIP Kyiv terms and then customs clear in Kyiv. Truck deliveries from Western European ports
are much more expensive and rarely practiced. Typically large importers supply a number of
commodities to Ukraine. Some companies have exclusive contracts for distribution of food
products in Ukraine, however there are cases of several distributors having the right to distribute
a single product. Often Ukrainian representative offices finalize agreements to be the exclusive
supplier of goods to certain regional distributors. Retailers can cancel a direct supply contract
with the representative office when it is unprofitable for a regional distributor to supply the
retailer. There are several companies in Ukraine that pretend to be national distributors capable
of regular deliveries of goods to retail trade companies all over Ukraine, however, these
companies don’t have such an efficient or far reaching distribution system.
Types of Retailers
As reported by the State Statistics Committee of Ukraine, the number of retail trade outlets selling
food products reached 27,719 in 2007. Over the past few years, the number of retailers was on
the decline (5%-10% annually), while the average floor space increased 4-7% annually. Many
small food shops continue to go out of business.
Due to the quickly growing number of super- and hypermarkets in 2001-2009, experts estimate
their market share at 43%, and it will continue to grow in the future. Traditional retailers in big
cities are losing their clientele due to new and improved services that are provided by big
retailers. Open-air markets and kiosks cannot compete due to low quality products (this is a
major channel for uncertified and counterfeit goods), while traditional grocery stores cannot offer
a wide assortment of products at low prices. Supermarkets are not completely driving out open-
air wholesale markets and Soviet-type grocery stores, but forcing them to modernize equipment
and marketing techniques.
Supermarkets, Hypermarkets
Their staff privatized the majority of retail outlets during the first wave of Ukrainian privatization
in the early 1990’s. Large trade centers with a self-service system (the Soviet counterpart to
supermarkets) built in the time of the Soviet Union ceased to exist after the first year of Ukraine’s
independence. Later, individuals or businesses purchased these food stores. In order to survive,
the overwhelming majority of these stores sold both non-food and food products.
The stabilization of the national economy helped to create the current retail structure. The first
domestic supermarket chains emerged to satisfy the new and growing demand in early
2000s. These stores began to emulate western standards on floor space, product assortment,
and quality of service.
The average floor space of a Ukrainian supermarket grew from 822 square meters in 2005 to 914
square meters in 2007 and 1200 square meters in 2009. The first Ukrainian mall – “Karavan” (is
still classified as hypermarket by the State Statistics Committee) was built in Ukraine in 2004 with
a total area of 13,000 square meters and total floor space of 8,000 square meters. According to
Karavan’s management, they built the hypermarket hoping to sell it to foreign operators/investors
(supposedly to Auchan or Tesco), should these companies enter the Ukrainian market. The small
floor space of many Ukrainian supermarkets is a result of limited capital and limited availability of
buildings or land plots in proper locations suitable for such operations. Only Western investors
and very few Ukrainian companies are capable of full-scale construction projects from the ground
up.
According to supermarket owners, stock lists of smaller stores include 30–70,000 items. 80-90%
of these items are of Ukrainian origin. Dairy and fish products, meat, bakery and spirits are
widely represented. Supermarkets often cut their margins to attract as many customers as
possible. The largest chain supermarkets use over 1,000 different suppliers represented by large
wholesale companies, producers and importers. Local chains are adopting foreign practices and
standards, and introducing production quality control departments and distribution centers. Many
supermarkets are open round-the-clock.
There are several factors contributing to the rapid success of hypermarkets and supermarkets in
Ukraine. First, retail chains guarantee higher quality goods. Second, the majority of chains offer
attractive prices through improved logistics and substantial supplier discounts in return for
guaranteed large procurements. These advantages attract customers from traditional wholesale
open-air markets and grocery stores. Third, supermarkets guarantee comfortable shopping
conditions (free parking, etc.), additional discounts for regular customers (discount cards), and
additional services for goods purchased (home deliveries, Internet shopping, etc.).
Due to the rapid market development and abundance of retail formats, local retail chains have
had little competition from foreign companies. Today, Kyiv commands approximately one-fifth of
all retail trade in food products conducted by specialized and non-specialized stores, as reported
by official statistics. Meanwhile, according to some retailers these supermarket chains are only
satisfying 45-50% of all demand. Operators agree that the market for larger stores will continue
to develop in the near-term despite the economic slow-down. Now supermarkets do not compete
with each other, but with traditional open-air markets. The latest trend in supermarket
development is to locate these trade outlets in shopping malls, which reduces construction costs
and attracts additional customers. Construction of movie theaters also opens new possibilities for
supplying the “American way of life” (popcorn, soft drinks and different snacks).
Table 2. Hypermarkets and Supermarkets Chains in Ukraine (2 or More Outlets)
Retailer
Name and
Outlet Type
Ownership Sales
in
2008
million
US
dollars
No. of
outlets
as of
2009
Locations Purchasing Agent Type
Sil’po
supermarket
Fozzy Group
Over
1.5
Billion
in 2007
150 Nation -
wide
Direct/importer
Fozzy, C&C 4 Nation -
wide
Metro, C&C Metro Cash
and Carry
(“Metro AG”
Germany)
~1.4
billion
in 2009
25 Nation-
wide
Direct/importer
Furshet,
supermarket
LLC Garantiya
- Trade
0.9
billion
in 2007
105 Nation-
wide
Direct/wholesaler/importer
Auchan Auchan Group
(France) and
Furshet JV
n/a 4 Nation-
wide
Direct/importer
Velyka
Kishenya,
supermarket
Retail Group
Holding
~ 560
million
in 2009
58 Nation-
wide
Direct/importer
Amstor Midland ~600 23 Eastern Direct/importer
Resources
Holding Ltd
in 2008 Ukraine
Tavriya-V,
supermarket
(5),
hypermarket
(2)
Tavriya-V LLC n/a 9 Southern
Ukraine
Wholesaler/Direct/importer
Billa,
supermarket
Billa-Ukraine
(Reve Group
Austria,)
n/a 18 Nation-
wide
Direct/importer
PAKKO,
supermarkets
Pakko Corp. 300
million
in 2008
71+9 Western
Ukraine
Direct/importer
Vopak, C&C
Nash Kraj Own stores of
VolWest
Group and
Franchisees
55.9
million
in 2009
55 Nation
Wide
Direct/importer
Perekrestok-
Ukraine
X5 Retail
Group
(Russia)
n/a 8 Central
Ukraine
Direct/importer/wholesaler
ECO-Market
supermarket
Bayadera Ltd. n/a 67 Nation
Wide
wholesaler/direct/importer
Mega-
Market,
supermarket
Founder -
Victor
Yushkovskiy
N/A 4 Kyiv Direct/importer
Big Spoon,
supermarket
Reardy PC
62 in
2009
28 Central
Ukraine
wholesaler/direct/importer
Natalka-
Market,
supermarket
“Natalka-
Market” CJSC
n/a 7 Odessa wholesaler/direct/importer
*Sources: Companies own information, expert estimates, FAS/Kyiv estimates
Kiosks and Gas Marts
The number of kiosks, which were popular trade outlets in the early 1990’s, has gradually
diminished. The typical kiosk operates 24 hours a day and sells cheap alcohol, cigarettes and a
limited number of food products. Limited floor space (usually 8-25 square meters) and a
relatively wide stock list (on the order of 100-200 kinds of goods), as well as minimal required
capital and operation costs ensures their existence. Competition from larger private stores and
supermarkets that offered lower prices resulted in a reduction in the number of kiosks. They
survive at road intersections, bus stops, underground stations, near open-air markets, in bedroom
communities, and in rural areas. Kiosks offer a variety of the cheapest living essentials including
food products. Lately, kiosks are becoming more specialized. For example, producers of meat
and bakery products have opened kiosks to sell their own products near public transportation
stops.
The number of modern gas stations continues to grow rapidly in Ukraine. Approximately 10-15%
of all Ukrainian gas stations have stores that sell packaged food products. This includes mainly
soft drinks, cookies, chocolates, and various snacks. These gas station stores account for 1-2% of
all food stores. The service-store network is under development and is not viewed as a major
revenue source by gas station managers. The developing network has good prospects and may
increase its share of retail sales.
Table 3. Kiosks and Gas Stations in Ukraine (ths.)*
2001 2002 2003 2004 2005 2006 2007 2008
Number of kiosks (stalls)
24.1 22.5 21.5 20.2 19.4 18.9 19.6 19.7
Share of kiosks in convenience
goods market, %
8 7 6 5 3 2 2 3
Number of gas stations 4.4 4.7 5.1 5.2 5.5 5.9 6.3 -
Source: State Statistics Committee of Ukraine
Chain Convenience Stores and Self-service Groceries
Chain grocery stores are not yet very common in Ukraine, although becoming more so. The
shortage of suitable land plots makes many retailers consider smaller formats. The Fozzy Group is
developing a network of Fora and Bumi-market grocery stores. According to management, the
chain may slow down development of its Silpo supermarkets chain, but will not cut back on its
Fora chain despite economic downturn. The Rainford group also has a network of 32
“convenience stores”. Their competitor in the Dnipropetrivsk region, ATB Corporation, has a
network of 372 stores, although these stores are quite close to supermarkets in size. Usually
groceries are located in suburbs, offer a narrow product range and have limited floor
space. These new groceries are quickly replacing the Soviet-style food stores. The average floor
space varies from 300 to 500 square meters. Stock lists include an average of 1,500 to 3,500
items. Grocery outlets have became rather popular among pension-age consumers who prefer to
shop close to home. Retirees often make small purchases throughout the week. These outlets
also target consumers with below average incomes and who generally purchase goods
daily. These products tend to have a short shelf life (bread, dairy products, fruits and vegetables,
etc.). Market analysts note that convenience stores lack regular customers and their market
share is small. Nevertheless, grocery stores are very successful in small Ukrainian towns.
Table 4. The Largest Convenience Store Chains in Ukraine
Chain
Name
Owner/mana
ging
company
Type of the
company
Trade
outlet
type
Numb
er of
outlet
s
Location
ATB Corporation
ATB (Ukraine)
There are also
discounters
working under
the same
brand
Direct/wholesaler/i
mporter
Convenie
nce store
372 Nation-wide
Fora,
Bumi
Fozzy Group
(Ukraine)
Direct / importer Grocery /
Discount
er
135 Nation-wide
Brusnyt
sia,
Olivie,
Varus
Ukrainian
Retail
Direct / importer Grocery /
convenie
nce
83 wholesaler/direct/im
porter
Rainford Trade and
industrial
group Rainford
Wholesaler /
importer
Grocery /
Convenie
nce store
Over
30
Central Ukraine
Barvino
k
Abris Capital
Partners
(Poland)
Wholesaler/ direct/
importer
Grocery 24 Western Ukraine
Torgovyi
Svit
Roveks Wholesaler/ direct/
importer
Grocery 17 Western Ukraine
Mars Trade House
Mars
Wholesaler/direct/i
mporter
Grocery 14 Eastern Ukraine
Natalka
Market
Natalka Trade Wholesaler/ direct/
importer
Grocery 7 South Ukraine
Obzhora N/A Wholesaler/importer Grocery 8 Donetsk city
Kopeyka Vit Almi LLC
(Ukraine)
Wholesaler/importer Convenie
nce store
9 8 – Odessa
1 – Izmail
*Sources: Companies own information, open press, FAS Estimates
Traditional Outlets: Independent Grocery Stores and Open-Air Markets
Soviet-style stores with behind-the-counter sales (traditional groceries) are quite common in
Ukraine. Some of these groceries are situated in central districts selling food products to office
employees during the workweek and to a small number of urbanites. These stores have often
been taken over by chain convenience store companies and converted into modern self-service
convenience stores. Other traditional grocery stores survived in suburban communities in large
cities. These stores are likely to leave the market due to fierce competition with supermarkets
and modern convenience stores. They are losing clientele due to their limited product line, higher
prices, poor customer service, and unprofessional vendors. In order to survive, many offer round-
the-clock operations and lease some floor space to sellers of industrial goods (DVD and CD sales)
and services (photo development). Some are operating successfully in distant small districts of
large cities and small provincial towns where the construction of supermarkets or modern chain
convenience stores is economically unjustified.
Grocery stores, especially those operating 24 hours a day, can be of certain interest to potential
U.S. exporters. These outlets may become outlets for less expensive food products,
manufactured abroad with a long shelf life: alcohol drinks, assorted snacks, confectionery
products, meat goods, canned goods, goods for elderly people. The overwhelming majority of
these stores (except small ones with 150-200 square meter floor space) procure products through
wholesale companies. Smaller ones buy products in Cash&Carry stores or from large wholesale
open-air markets.
As reported by the State Statistics Committee of Ukraine, there were 2,785 open-air markets
(bazaars) of all types in Ukraine in 2009, including almost 500 food product open-air
markets. Twenty five food open-air markets are located in Kyiv. At the same time, mixed open-
air markets (rynoks) trading in both foodstuffs and non-food goods prevail in Ukraine and account
for approximately 55% of the total number of markets of all types in Ukraine. The largest number
of food product open-air markets in Ukraine are concentrated in the most populated
regions. Typical Ukrainian open-air markets would include a space for farmers, while behind-the-
counter kiosks sell packed and processed products. The open-air market kiosks zone would trade
in low and middle cost products. Many people think that food products in traditional open-air
markets are cheaper than in supermarkets. Elderly consumers are also confident in the high
quality of products offered at these wholesale open-air markets.
According to experts’ estimates, in 2009, approximately 20% of food products in Ukraine were
sold through this channel. For meat products this indicator reached 90%. These trade outlets are
leading sellers of vegetables, fruits, meat, honey and dried fruits. At the same time, sales of dairy
products, sunflower oil, and alcoholic drinks are gradually moving from open-air markets to
outlets of other types. Open-air markets provide poor customer service, lack storage equipment
and often sell low quality products for a price that is often higher than in supermarkets.
Improvement of service standards in open-air markets would lead to a marginal increase in
competitiveness, but long-term prospects are still not very promising. Some renovated central
open-air markets for food products in large cities were transformed into traditional elite
supermarkets offering high-quality products. Bessarabskiy and Volodymyrskiy bazaars in Kyiv are
good examples. These open-air markets located in the historical part of the city serve as
shopping destinations for foreigners living in Kyiv and the Ukrainian elite. This category of
markets can be interesting for American exporters of specialty meat products, seafood, semi-
finished goods, microwaveable foods, mixtures of exotic dried fruits, nuts, confectionery goods,
alcohol drinks, and traditional U.S. consumer food products, which ordinary supermarkets find
inconvenient to stock due to low demand.
Table 5. Number of Markets (bazaars) Offering Consumer Goods in Ukraine
2000 2001 2002 2003 2004 2005 2006 2007 2008
Total 2,514 2,715 2,863 2,891 2,869 2,886 2,890 2,834 2,785
Food products 634 772 666 597 - - - 477 -
Non-food
products
511 608 725 708 - - - 712 -
Mixed 1,369 1,335 1,472 1,586 - - - 1,645 -
Source: State Statistics Committee of Ukraine
It is quite likely that the number of traditional groceries, kiosks, and bazaars will decrease in the
future, while the number of hypermarkets, supermarkets and self-service convenience stores
would grow. Open-air markets together with “vegetable-fruit” stalls will compete strongly with
modern stores in retail sales of fruits and vegetable-s. The number of kiosks will likely also
diminish.
MARKET TRENDS
Private Label
Over the last 2 years all nation-wide retail chains developed their own private-label programs. In
most cases chains offer cheap and mid-price products in fruit juice, canned vegetables, dry fruits,
grocery, frozen dumplings and seafood product groups. Many chains sale products produced on
their own premises (mostly frozen products) that are not clearly labeled as the supermarket’s
private label or sold as no-name white label products. Own ready-to-eat products produced on
sites are also not “private-labeled”.
Most chains sell only food private labels, but Silpo Chain has offered some non-food items under
“Premia” private label. In 2008 Metro C&C Ukraine also launched its “H-Line” label with over 60
food and non-food items. The price difference compared to branded competitors is 5% - 20%
less.
Retailers see having a private label as a means to exclude of third party distributors from the
logistics chain as well as a means to minimize promotion costs. Some cost is also saved during
the bidding process when a supplier is chosen. It is too early to estimate the success of private-
label programs in Ukraine since they are relatively new and coincided with significant changes in
loyalty programs run by many big chains. Common for the western markets reliance on grocery
items for private-label program is not evident in Ukraine. Private label bundles are quite diverse
and do not coincide from chain to chain.
Modern Trade Promotion Methods
Chain stores regularly train their personnel and experiment with product layout, in order to
maximize profits from one square meter of floor space. Many supplier companies have their own
display schemes, for example, “Hipp Gmbh” infant food producer. Instore new product tasting
and promotion campaigns are also quite frequent.
Many supermarkets are equipped with television screens for demonstrating commercials
promoting goods and services. Traditional poster and panel advertisements are also popular. The
largest supermarkets issue their own advertising booklets and discount coupons. They also
practice direct-mail distribution of these booklets to potential customers and publish
advertisements devoted to products or one specific country. In particular, one such edition
published by Furshet was devoted to products of German origin. These methods can be applied to
U.S. product advertisement.
Loyalty programs dedicated to specific brands were launched in 2006. The goal of these
programs is to create long-term brand loyalty. Producers attempt to reduce marketing costs by
developing marketing campaigns that represent more than one company. The main incentive tool
used by program members is targeted coupons.
Digital technologies, such as mobile marketing, are widely used for Sales Promotion
purposes. Scratch cards enable producers to link promotions with retail outlets. There are a
number of in-store marketing technologies, which were purchased from the United States in
2006. Among them are in-store couponing (operated by Coupon Management System company
from the Prospects Group) and on-floor stickers (operated by Floorgrafics, U.S.). Different
refunds and rebate schemes have bee tested by Prospects Company over the past three years.
Market Power
In the early days of the Ukrainian retail (2000 – 2002) sector, producers of food and agricultural
products could dictate to supermarkets terms for positioning, marketing and payments of
goods. Food products were viewed as anchor commodities attracting consumers to new
supermarkets. The situation changed rapidly in 2004-2007, when retail chains acquired a
significant market share in larger cities, attracting middle and high-income consumers. Retailers
quickly realized that control over targeted consumers gave them control over
producers. Producers of hard liquors, vodka and dairy products publicized these new problems,
while many other supplies preferred to keep these issues quiet. Most problems were related to
retailer recommended prices and price discounts, some to product placement and associated
fees. The threshold used to introduce products in Ukrainian supermarkets remains quite low if
compared to Western chains, but it seems excessively high to many Ukrainian producers.
SECTION III. COMPETITION
The Government of Ukraine took a number of steps to protect domestic producers of food
products in the mid-1990s. This resulted in high import tariffs and a complicated system of
sanitary and phytosanitary requirements. The economic crisis of 1998 abruptly decreased
individual incomes and drove consumers to purchase cheaper domestically produced products. All
of these factors contributed to the robust development of the domestic food-products
industry. Production of dairy and meat products (sausages, smoked foods), soft drinks, mineral
water, juices, beer, confectionery, various appetizers, and chilled chicken meat is still on the
increase. Introduction of high import duties made legal imports of many foreign food products
unprofitable, while the Ukrainian market remained open to food products originating in Russia and
other CIS countries. The Free Trade Agreement among CIS countries facilitated trade. Russian-
made products were charged only the value-added tax, which make their price comparable to
similar Ukrainian products. Many imports from the EU and the United States cannot compete on
price with CIS goods.
Table 6. Main Delivery Sources and Volumes of Specific Product Imports to Ukraine
Product
Category
Major Supply Sources Strength of Key
Supplying
Countries
Advantages and
Disadvantages
of Local
Suppliers
Poultry
Net
Imports:
196 ths.
tons
US 117
ths. tons
1. USA 69%
2. Germany 13%
3. Netherlands 6%
USA MDM and
offal is much
cheaper;
Brazilians have
price advantage in
whole birds
supplies, EU in
geographical
proximity
Production is
rapidly
growing. Produc
ers can supply
chilled product;
supply of
domestic
chicken is
insufficient.
Pork
Net
Imports:
138 ths.
tons
US 8 ths.
tons
Brazil 40%
Poland 20% Germany 16%
Much lower prices,
stable quality
Highly inefficient
pork production
in private
households and
in majority of
industrial farms;
Some production
rebound in 2006
based on
renewed
technologies.
Beef
Net
Imports:
8 ths. tons
US – No
Supplies
Brazil 90%
Much lower prices,
stable quality
Highly inefficient
beef production
in private
households and
on industrial
farms, lack of
beef cattle and
lack of high-
quality beef
Fish and
Seafood
Net
Imports:
388 ths.
Norway 46%
Vietnam 10%
Iceland 8%
Norway supplies a
wide range of
products and
secures regular
deliveries. Norwe
gian exporters use
Outdated cold
storage facilities
and fleet,
outmoded
processing
facilities,
tons
US 14.6
ths. tons
state promotion
programs
problems with
securing quotas
for fishing in
international
waters
Fresh
vegetables
Net
Imports:
20 ths.
tons
US 0. ths.
Tons
Netherlands
29% Spain 27% Poland
12%
High stable quality
of vegetables
produced in
Western European
countries, low
prices for the
products
originated from
the CIS states
A lot of people
grow vegetables
on their
household plots;
Bigger farms
lack modern
storage and
processing
facilities; stable
supplies of the
produce to the
retail trade
networks are
complicated
Frozen
vegetables
Net
Imports:
3 ths. tons
US 0 ths.
tons
Poland 64%
Russia 6%
Polish companies
dominate on the
market due to
high quality,
recognition of
trademarks and
distribution
system
Inefficient
production;
growing demand
in large cities
Fruits
fresh and
dried
Net
Imports:
652 ths.
tons
US 1 ths.
tons
Ecuador 34%
Turkey 22%
Egypt 6%
Moldova 6%
Countries of South
America, Spain,
Georgia, and
Azerbaijan supply
citrus fruits at
right price/quality
ratio
Essential volume
of smuggling
especially from
Poland and the
CIS states as
well as lack of
storage
facilities; low
cost of local
production
Tree nuts
(peanuts
excluded)
Net
Imports:
8 ths. tons
US 1 ths.
tons
Turkey 39%
Azerbaijan 17%
Germany 15%
USA 5%
Turkey mainly
supplies hazelnut
and pistachios at
low prices,
Azerbaijan –
hazelnut, and the
USA - almonds
Lack of large-
scale industrial
production of
nuts; Intensively
developing
confectionery
industry
Canned
vegetables
and fruits
Uzbekistan 20% Russia 16%
Netherlands12%
Well established
trade relations and
well known
Local producers
quickly update
the facilities
Net
Imports:
138 ths.
tons
US 0 ths.
tons
trademarks;
abundance of
smuggled import;
Hungary
(vegetables) and
Spain (olives)
dominate on the
market
availability of
cheap raw
materials,
traditional local
brands
Fruit
juices and
concentrat
es
Net
Imports:
50 ths.
tons
US 112
tons
Netherlands21%
Russia 20%
Moldova 10%
Western countries
supply products of
very high quality.
Russian products
are of low price
and good quality
Local production
of apple
concentrate,
tomato paste,
and berries
partially satisfy
domestic
demand; high
dependence on
imported
concentrates;
High competition
with ready-made
Russian juice;
growing demand
for juices,
healthy drink
image of juice
Wine
Net
Imports:
23 million
liters
US 8 ths.
liters
Moldova 70%
Hungary 10%
Georgia 12%
France 2%
USA <1%
CIS origin wine is
reasonably priced
and has traditional
brands. Western
Wines are occupy
the upper
segment and
perceived as high
quality ones
Steady demand
for locally
produced wines;
production
experience;
broad
assortment and
low prices; poor
positioning of
high quality
vintage wines;
traditional
preference to
sweetened wines
Liqueurs,
other hard
alcohol
drinks
Net
Imports:
5.2 million
liters
US 16 ths.
liters
Azerbaijan 31%
Georgia 30%
Armenia 9%
Good quality,
reasonable prices
for traditional
Armenian,
Georgian and
Bulgarian
cognacs; High
demand for not
traditional
beverages
(tequila, whisky,
rum, and gin).
High quality and
broad
assortment of
locally
manufactured
alcohol drinks;
dependence on
imported cognac
spirits; black
market of hard
alcogol drinks;
low quality of
low price
segment
product.
Pet food
Net
Imports:
31 ths.
tons
US 6 ths.
tons
Hungary 27%
Russia 26%
USA 18%
Exports of well-
known pet food
trademarks from
Russia dominate
in low segment.
U.S. brands are
perceived as high
quality ones
Traditionally
high number of
home pets, large
market
potential; low
demand for
industrially
produced pet
food
Sources: State Statistics Committee of Ukraine, expert estimates
SECTION IV. BEST PRODUCT PROSPECTS
Category A: Products Present on the Market With Good Sales Potential
Product 2009
Market
volum
e
2009
Impor
t
volum
e
Average
growth
of import
over the
last 3
years
Import
taxes
Main factors
hindering
import
developmen
t
Attractivenes
s of the
market for
the USA
Poultry 592
ths.
tons
195
ths.
Tons
14% 5-15% for
poultry
parts and
whole
birds;
Competition
with Brazilian
and EU
producers;
Quick growth
of domestic
production;
Perception of
U.S. product
as cheap and
of low
quality.
U.S. product
has well-
established
positions;
Low prices
attract a lot of
buyers. Local
producers will
not be able to
satisfy demand
in near future.
Beef 433
ths.
tons
18 ths.
Tons
5% 15% Consumer
unawareness
of U.S. high
quality beef;
Sizable
domestic
production,
Complicated
import
procedures.
Insignificant
specialized
beef
production;
Constantly
growing beef
prices; Niche
markets for
meat delicacies
(steak, etc.)
and meat
offal; Fast HRI
development.
Pork 652 140 Over 10-12% Competition Shortage of
ths.
tons
ths.
tons
80% from
Brazilian pork
and Polish
smuggled
pork,
complicated
import
procedures.
pork in the
country;
declining
production;
high prices;
Demand for
stable
deliveries of
both cheap
and high
quality
product.
Fish and
Seafood
640
ths.
tons
360
ths.
Tons
10-20% 0 – 5% for
all frozen
fish; 10%
for
prepared
fish, live
fish,
Mackerel,
Trout, some
Crustaceous
, Anchovy,
Salmon and
Lobsters.
Regular
deliveries of
high quality
product from
Norway;
Shortage of
suitable
equipment at
retail trade
outlets;
Deficit of
proper
storage
facilities with
below –20C
temperature.
Growing
demand for
higher quality
seafood from
consumers;
Very modest
assortment in
markets;
Significant
demand from
supermarkets
and HRI
sector.
Dried
fruits and
nuts
(exclude.
peanuts)
115
ths.
tons
8.1 ths.
tones
20-30% From 0% to
20%
Sharp
competition
with Iran and
Turkey.
Desire of
packers to
save on raw
stock,
procuring low
quality stock
from Iran,
Uzbekistan,
and
Afghanistan
Intensive
development
of
confectionery
industry and
start of retail
sales of rare
dried fruits
(exceed world
prices by 3 – 6
times).
High quality of
U.S. product;
Development
of premium-
class
confectionery
products
Canned
fruits and
vegetable
s
413
ths.
tons
128
ths.
tons
35% 5-15%
Depending
on Product
Type
High
competition
form EU
products;
Smuggling;
Cheap
High and
growing
demand for
value added
imports at the
expense of,
canned food
niche
occupied by
Ukrainian
trademarks.
The majority
of population
is inclined to
supply its
own needs
with home-
made canned
fruits and
vegetables
and gradual
rejection of
home-
produced
products;
High-quality
product niche
is not
completely
filled.
Wine and
spirits
250
million
liters
27
million
liters
Contracte
d by 15%
Significantly
Varies by
product
High import
duties, tough
competition
with
Ukrainian-
made spirits
and drinks
produced in
the CIS
states
Relatively high
level of alcohol
consumption;
Demand for
exotic drinks
(whiskey, gin,
rum, bourbon).
Pet food N/a 50 ths.
tons
20-30% 5-10% Large supply
of Russian-
made cheap
pet food;
Smuggling;
Strong
tradition of
feeding pets
with table
scraps;
Long
registration
and
certification
procedures.
Traditionally
large number
of home pets;
Increased
population
incomes
followed by
growing
demand for
ready to use
pet food.
Comparatively
low import
duty
* All imported products are subject to 20% VAT tax.
Category B: Products Not Present in Large Quantities but with Good Sales Potential
Premium-class food products: meat specialties (meat for further cooking – steaks, fillet,
etc.), smoked meat, cheese;
Exotic seafood, ready-made high-quality canned fish;
Cereals: muesli, instant porridge, ready-made rice, different sorts of ready-made packed
rice;
Food for diabetics;
Specialized infant food, canned vegetables and infant fruit food;
Exotic drinks/juices (from exotic fruits, energy drinks, vitamin drinks, root beer), drink
concentrate, traditional drinks with different additives (tea/hot chocolate with additives);
Semi-prepared goods, ready-made frozen food, microwaveable food;
Packed food ingredients of high quality for cooking (brown sugar, sugar powder, high-
quality spices, etc.)
High-quality beer snacks (a rapid increase in beer consumption over the last several years
and stable forecasts regarding beer consumption growth in the future).
The future aging of the population creates a niche market for this category of
costumers. The low current incomes of this category make this market profitable only in
the future.
Category C: Products Not Present Because They Face Significant Barriers (with barriers
indicated)
Mid range ready-to-eat meat products (smoked meat, sausages, hotdogs) – high import
duties (30%, but not less than 1.2 EUR/kg + 20% VAT) – high competition of similar
Ukrainian products;
Inexpensive imported chocolates - high import duties (0.5 EUR/kg + 20% VAT) – high
competition from similar Ukrainian products;
Food products containing biotech ingredients which are not yet on the sate registry of
biotech approved events. Labeling of such was introduced at the end of 2009 and
scheduled for implementation in 2010.
SECTION V. ATTACHMENTS
Annual Foodstuffs Sales in Retail Trade (1000 Tones)
1990 2001 2005 2006 2007 2008
Meat and products 2384 208 325 389 443 453 Butter 318 27 32 35 36 36 Vegitable oil 228 36 66 77 91 102 Cheese and soft cheese 147 18 42 51 63 71 Eggs, million 6883 1113 1341 1649 1791 2194 Sugar 1802 100 129 130 155 177 Conditerey 997 164 225 252 275 288 Tea 24 3 7 9 12 13 Bear and products (in wheat floure equivalent) 7568 1318 953 952 948
933
Potato 1372 83 78 76 91 101 Vegitables 2342 131 151 183 205 210 Fruits and berries and nuts 449 63 148 203 230 237
Source: State Statistics Committee of Ukraine
Foodstuffs Consumption by Household
(in average per month as calculated for one person, kg)
2000 2007 2008
All
house
Including
those residing
in
All
house
Including
those residing
in
All
house
Including
those residing
in
holds towns
Rural
area holds towns
Rural
area holds towns
Rural
area
Meat and
products 3.30 3.30 3.20 5.10 5.50 4.10 5.10 5.5 4.1 Milk and dairy 17.10 15.40 20.50 22.10 21.70 22.80 22.60 22.2 23.3 Eggs (pieces) 18.00 20.00 16.00 20.00 21.00 18.00 20 21.0 18.0 Fish and
seafood 1.30 1.40 1.10 1.90 2.00 1.70 2.10 2.2 1.9 Sugar 3.50 3.50 3.50 3.20 3.10 3.40 3.40 3.3 3.6 Oil and
other vegetable fats 1.80 1.90 1.60 1.70 1.70 1.70 1.80 1.8 1.8 Potato 10.40 9.00 13.10 8.30 7.10 11.00 8.40 7.2 11.1 Vegetables and melons 9.50 9.70 9.30 8.70 8.60 8.90 9.30 9.2 9.5 Fruits, berries, nuts, grape 2.50 2.70 1.90 33.60 44.20 22.10 3.70 4.9 2.4 Bread and bakery 10.70 10.50 11.20 9.60 8.70 11.40 9.60 8.7 11.4
Source: Households Income Survey, State Statistics Committee of Ukraine, own estimates
Sales of Major Food Product Through the Retail Sector in 2007-08
Food Product Volume Sales 2008
% to 2007
Per capita (kg, pcs., litres) 2007 2008
Meat, poultry and fresh
frozen 1000 T 211.4 216.1 102.2 4.673 Meat, smoked and salted
meats " 159.7 160.0 100.2 3.459 Canned, prepared meat products " 31.9 36.8 115.5 0.796 including semi-finished meat " 17.7 19.7 111.0 0.426 Fish and seafood " 94.7 105.7 111.6 2.285 Canned, ready to eat fish products " 37.9 41.4 109.2 0.895 including semi-finished " 6.3 8.1 127.9 0.175 Ice-cream " 29.4 29.3 99.9 0.634 Hard cheese, soft and
melted cheese " 63.1 71.3 113.0 1.542
Butter " 36.0 35.8 99.6 0.774 Eggs and egg products Million pcs. 1791.4 2193.7 122.5 47 Oils and Fats 1000 T 91.1 102.2 112.1 2.209 Margarine " 40.6 34.3 84.6 0.742 Sugar " 155.2 176.6 113.8 3.818 Confectionery sugar " 143.3 145.6 101.5 3.147 Confectionery flour " 131.8 142.1 107.8 3.072 Flour " 126.5 131.9 104.3 2.852 Bakery products (except confectionery) " 697.8 678.3 97.2 14.663 Groats and Beans " 166.0 178.5 107.5 3.860 Noodles " 120.2 118.9 99.0 2.571 Potatoes " 90.9 101.0 111.1 2.183 Vegetable " 205.0 210.1 102.5 4.542 Fruits, berries, grapes, nuts " 205.3 210.0 102.3 4.539 Watermelons and Melons " 24.7 26.7 108.2 0.577 Canned vegetables " 65.7 68.0 103.4 1.470 Canned fruit and juice " 26.4 22.4 84.7 0.483 Vodka and other spirits products
1000 deciliters 19298.1 21245.6 110.1 4.593
Alcopops deciliters 558.1 691.2 123.8 1.494 Wines " 1073.9 1161.0 108.1 2.510 Brandy " 223.1 264.7 118.6 0.572 Sparkling wine (champagne) " 402.1 411.5 102.3 0.890 Beer " 6414.5 6583.1 102.6 14.231 Tea 1000 tones 12.0 13.0 109.0 0.282 Coffee " 12.1 12.5 103.3 0.271 Sault " 73.9 65.6 88.8 1.418 including iodinated kitchen salt " 17.7 16.1 91.2 0.348 Soft drinks deciliters 8519.9 8102.0 95.1 17.515 including juices " 2403.2 2370.5 98.6 5.124 Mineral water " 5850.6 6424.9 109.8 13.889 Tobacco million pcs 5073.5 4538.2 89.4 981
Restaurants sales
Vodka and liquor products 1000
deciliters 1078.7 977.2 90.6 0.211 Alcopops " 263.5 232.1 88.1 0.050 Wines " 541.4 492.8 91.0 0.107 Cognac " 118.6 118.3 99.7 0.026 Sparkling Wine (champagne) " 186.1 178.5 95.9 0.039 Beer " 4267.1 3954.3 92.7 0.855 Tobacco products million pcs 598.7 564.5 94.3 12
Source: State Statistics Committee of Ukraine