50
© ABB | Slide 1 Strong foundation, solid momentum Ulrich Spiesshofer, CEO; Eric Elzvik, CFO, ABB Ltd, February 5 th , 2015 Full-year and Q4 2014 February 5, 2015
© ABB| Slide 1
Strong foundation, solid momentumUlrich Spiesshofer, CEO; Eric Elzvik, CFO, ABB Ltd, February 5th, 2015
Full-year and Q4 2014
February 5, 2015
© ABB| Slide 2
Important notices
This presentation includes forward-looking information and statements including statements concerning the outlook for ourbusinesses. These statements are based on current expectations, estimates and projections about the factors that may affectour future performance, including global economic conditions, and the economic conditions of the regions and industries thatare major markets for ABB Ltd. These expectations, estimates and projections are generally identifiable by statementscontaining words such as “expects,” “believes,” “estimates,” “targets,” “plans,” “outlook” or similar expressions.
There are numerous risks and uncertainties, many of which are beyond our control, that could cause our actual results todiffer materially from the forward-looking information and statements made in this presentation and which could affect ourability to achieve any or all of our stated targets. The important factors that could cause such differences include, amongothers:
business risks associated with the with the volatile global economic environment and political conditions costs associated with compliance activities raw materials availability and prices market acceptance of new products and services changes in governmental regulations and currency exchange rates, and, such other factors as may be discussed from time to time in ABB Ltd’s filings with the U.S. Securities and Exchange
Commission, including its Annual Reports on Form 20-F.
Although ABB Ltd believes that its expectations reflected in any such forward-looking statement are based upon reasonableassumptions, it can give no assurance that those expectations will be achieved.
This presentation contains non-GAAP measures of performance. Definitions of these measures and reconciliations betweenthese measures and their US GAAP counterparts can be found in “Supplemental Financial Information” under “Financialresults & presentations” – “Quarterly results & annual reports” on our website at www.abb.com/investorrelations
February 5, 2015
© ABB| Slide 3
Agenda
Financial results Full-year 2014 Q4
Next Level implementation
Outlook
Q&A
February 5, 2015

© ABB| Slide 4
Agenda
Financial results Full-year 2014 Q4
Next Level implementation
Outlook
Q&A
February 5, 2015

© ABB| Slide 5
2014 – strong foundation, solid momentumRobust order growth, PS1 break-even, increased dividend
+10% orders growth2, up in all regions and divisionsBase orders +5%2, large orders +50%2, book-to-bill 1.04xImproved customer satisfaction, NPS3 index at 44, up by 9 pointsStrategic partnerships to expand market presence
Power Systems full-year break-even4
$1.1 bn cost savingsSuccessful portfolio pruningFree cash flow +9%, conversion rate at 110%Performance-based compensation model finalized
Market-focused organization implemented Undiluted global business line responsibilities established Customer-oriented, leaner regional organizationTop 1‘000 positions filled
1PS: Power Systems; 2Change on a like-for-like basis; 3NPS: Net Promoter Score; 4As measured by operational EBITDA
Dividend increase and share buyback show confidence in Next Level strategy
Business-led
collaboration
Relentless execution
Profitable growth
Delivering along our three focus areas
February 5, 2015

© ABB| Slide 6
Full-year 2014 resultsStrengthening the order backlog for 2015 and beyond
FY 14 FY 13 Change$ mn unless otherwise indicated
Orders 41’515 38’896 +10%1
Order backlog (end December) 24’900 26’046 +5%2
Revenues 39’830 41’848 -2%1
Operational EBITDA 5’400 6’075 -11%Op. EBITDA as % of operational revenues 13.5% 14.5%
Operational EBITA 4’475 5’147 -13%Op. EBITA as % of operational revenues 11.2% 12.3%
Net income 2’594 2’787 -7%Basic earnings per share ($) 1.13 1.21Cash flow from op. activities 3’845 3’653 +5%Free cash flow 2’857 2’632 +9%as % of net income 110% 94%
Dividend per share (CHF) 0.72 0.70CROI % 12.7% 11.6%
1Changes on a like-for-like basis. For US$ and local currency changes, refer to slide 40; 2Local currency change
February 5, 2015
© ABB| Slide 7
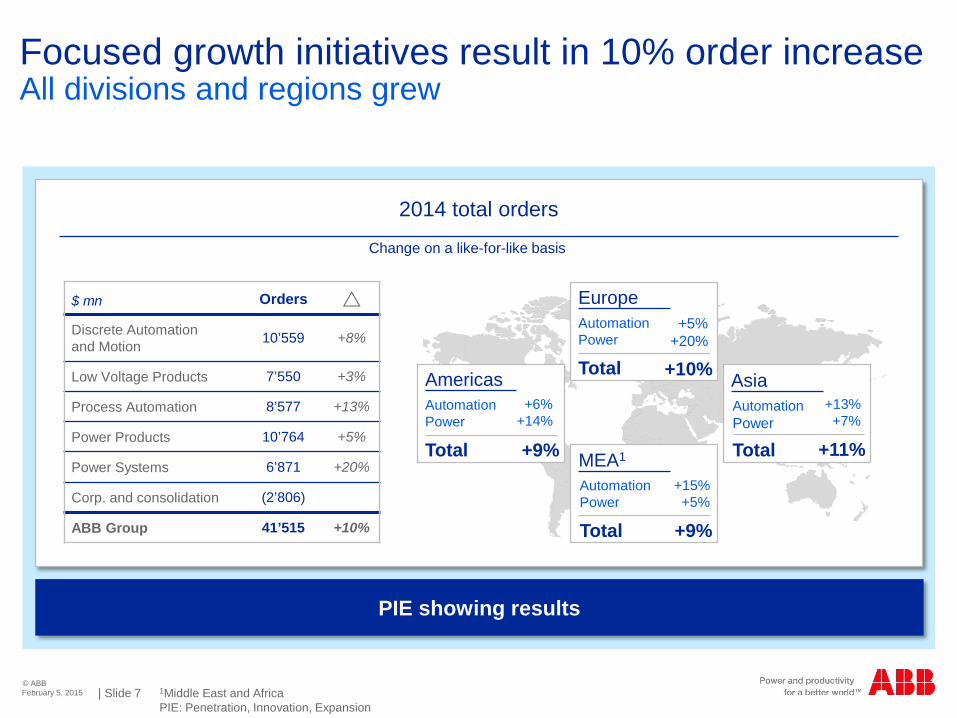
Focused growth initiatives result in 10% order increaseAll divisions and regions grew
$ mn Orders Discrete Automation and Motion 10’559 +8%
Low Voltage Products 7’550 +3%
Process Automation 8’577 +13%
Power Products 10’764 +5%
Power Systems 6’871 +20%
Corp. and consolidation (2’806)
ABB Group 41’515 +10%
2014 total orders
Change on a like-for-like basis
PIE showing results
AmericasAutomation Power
Total
+6%+14%
+9%
EuropeAutomationPower
Total
+5%+20%
+10%
AutomationPower
Total
+15%+5%
+9%
AsiaAutomationPower
Total
+13%+7%
+11%MEA1
1Middle East and AfricaPIE: Penetration, Innovation, Expansion
February 5, 2015
© ABB| Slide 8
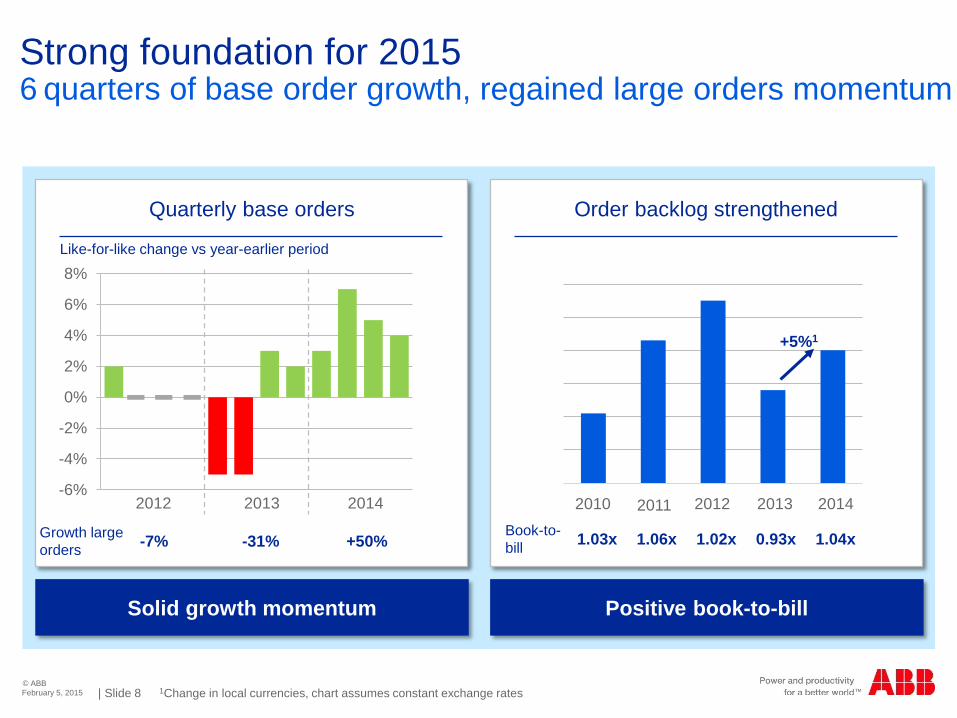
Strong foundation for 20156 quarters of base order growth, regained large orders momentum
1Change in local currencies, chart assumes constant exchange rates
Quarterly base orders Order backlog strengthened
1 2 3 4 5-6%
-4%
-2%
0%
2%
4%
6%
8%
2012 2014
Growth large orders
Book-to-bill-7% -31% +50% 1.03x 1.06x 1.02x 0.93x 1.04x
Solid growth momentum Positive book-to-bill
2013
Like-for-like change vs year-earlier period
+5%1
2010 2011 2012 2013 2014
February 5, 2015

© ABB| Slide 9
Customer satisfaction increasing
Net Promoter Score development Improved coverage and results
16
22
29
35
44
1 2 3 4 5
NPS is a key parameter of performance management and compensation
9 point increase of customer satisfaction
> 30,000 customer feedbacks
+14% increase of number of responses
Improvement highlights On time delivery Technical support Project management and engineering
2010 2011 2012 2013 2014
February 5, 2015
© ABB| Slide 10
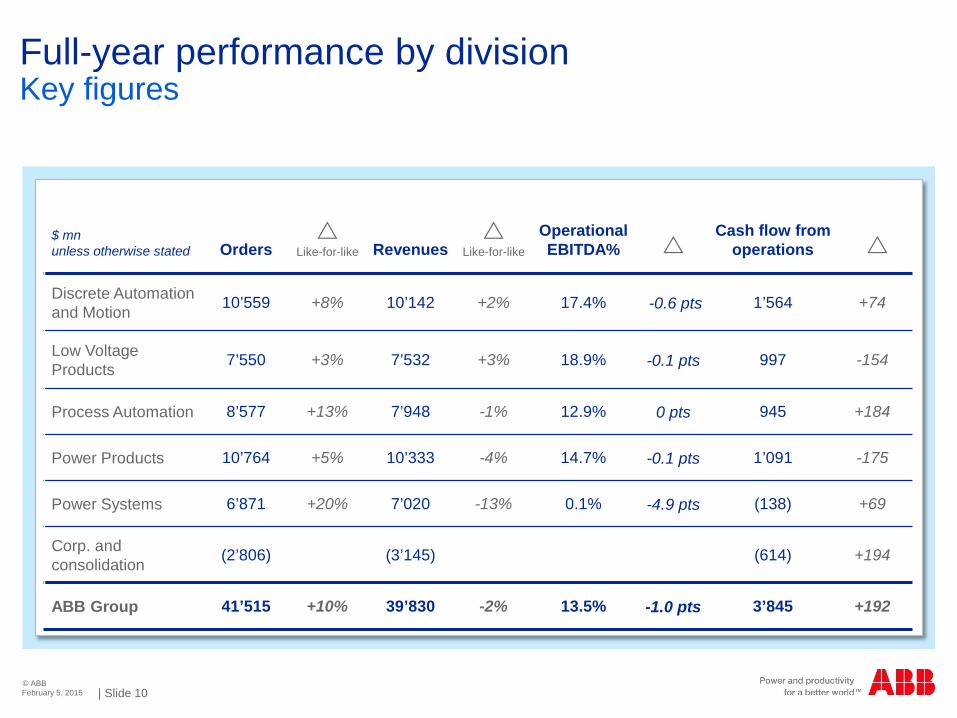
Full-year performance by divisionKey figures
$ mnunless otherwise stated Orders
Like-for-like Revenues
Like-for-like
Operational EBITDA%
Cash flow from operations
Discrete Automation and Motion 10’559 +8% 10’142 +2% 17.4% -0.6 pts 1’564 +74
Low Voltage Products 7’550 +3% 7’532 +3% 18.9% -0.1 pts 997 -154
Process Automation 8’577 +13% 7’948 -1% 12.9% 0 pts 945 +184
Power Products 10’764 +5% 10’333 -4% 14.7% -0.1 pts 1’091 -175
Power Systems 6’871 +20% 7’020 -13% 0.1% -4.9 pts (138) +69
Corp. and consolidation (2’806) (3’145) (614) +194
ABB Group 41’515 +10% 39’830 -2% 13.5% -1.0 pts 3’845 +192
February 5, 2015

© ABB| Slide 11
Divisional highlightsNext Level in action across business portfolio
Business-led
collaboration
Relentless execution
Profitable growth
DM LP PA PP PS
YuMi® robot market introduction
Double digit service growth
Penetration of US channels through
T&B
Philips partnership for building automation
Record orders in marine
Energy harvesting sensor
Strong growth in industry sector and
service
Key HVDC wins in Canada and UK
Return to positive base order growth
Improved net working capital
New regional distribution centers
Full Service portfolio pruning
Margin resilience through
operational excellence and
cost savings
“Step change” on track
Break-even achieved for full-
year
Cross-business industry initiatives for F&B1, marine
Market-oriented front-endalignment
Cross-divisional sub-sea program
Cross-divisional collaboration
resulting in record rail orders
Micro-grids: collaboration across ABB portfolio and geographies
1F&B: Food and BeverageFebruary 5, 2015

© ABB| Slide 12
PS: “step change” on track, full-year break-evenDelivered on commitment and ambition
What we said What we did
Full-year break-even achieved after H1 losses
Changes on four leadership layers
Strong progress, 2 out of 3 energized
Backlog successfully executed, target achieved
HVDC partnership with Hitachi for Japan
+ 4% base orders growth
New business model, “step change” on track
Solid “step change” progress, stronger team, better grip
Aim for full-year profitability
Strengthen leadership team
Complete off-shore wind projects
Exit solar EPC, commit to 90% completion
New partnerships
Grow base business
De-risk business model, improved risk mgmt.
February 5, 2015
© ABB| Slide 13
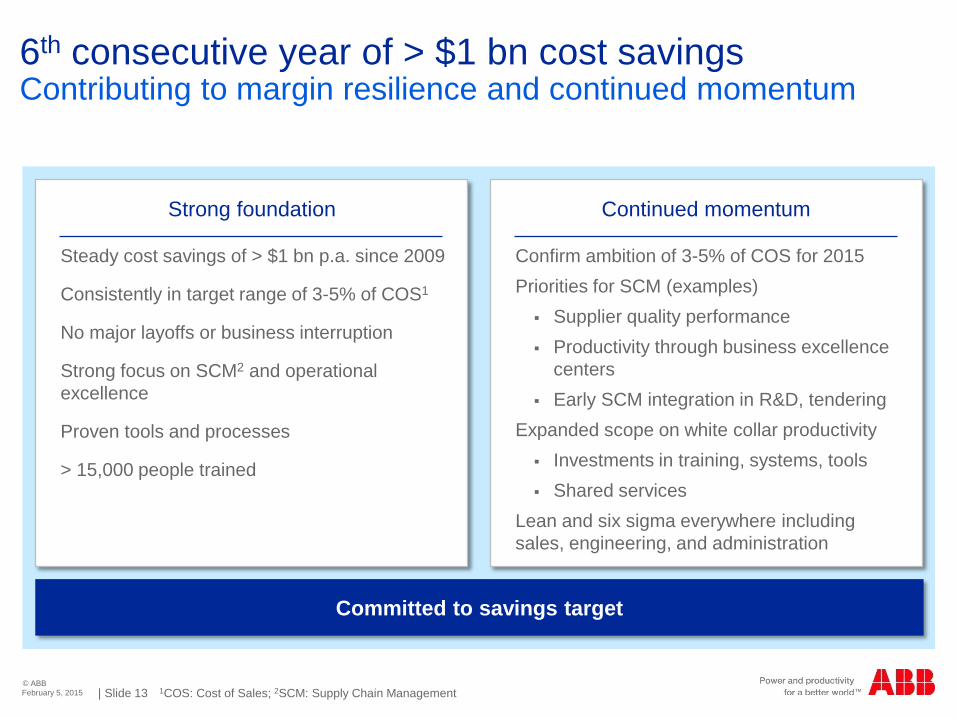
6th consecutive year of > $1 bn cost savingsContributing to margin resilience and continued momentum
Confirm ambition of 3-5% of COS for 2015Priorities for SCM (examples) Supplier quality performance Productivity through business excellence
centers Early SCM integration in R&D, tendering
Expanded scope on white collar productivity Investments in training, systems, tools Shared services
Lean and six sigma everywhere including sales, engineering, and administration
Steady cost savings of > $1 bn p.a. since 2009
Consistently in target range of 3-5% of COS1
No major layoffs or business interruption
Strong focus on SCM2 and operational excellence
Proven tools and processes
> 15,000 people trained
Strong foundation Continued momentum
Committed to savings target
1COS: Cost of Sales; 2SCM: Supply Chain ManagementFebruary 5, 2015

© ABB| Slide 14
Portfolio pruning2014 divestments in line with continuous portfolio optimization
1 2014 estimated revenues (disclosed in buyer press release)
Closed May 2014 Jun. 2014 Aug. 2014 Dec. 2014
Estimated annual 2014 revenues ~$160 mn ~$250 mn ~$325 mn1 ~$300 mn
Approx. proceeds $260 mn $120 mn $600 mn Not disclosed
Entity divested
Full-serviceT&B HVAC Power-Onepower solutions
T&B steel structures
Divestments generated more than $1 bn in pre-tax proceeds
February 5, 2015

© ABB| Slide 15
Agenda
Financial results Full-year 2014 Q4
Next Level implementation
Outlook
Q&A
February 5, 2015

© ABB| Slide 16
Q4 2014 key takeawaysHigher base orders in all regions despite volatile market
6th consecutive quarter of base order growth, steady1 total ordersBase orders up in all regions, steady to higher in all divisionsLower large orders reflect timing of awardsHitachi partnership to expand power presence in Japan
Business-led collaboration
Relentless execution
Profitable growth
Commitment to PS profitability delivered Op. EBITDA margin steady to higher in DM, LP, PA; PP solid industry leading positionContinued cost savings, future cost down locked inMore balanced cash flow generation across the quarters
Next Level organizational changes smoothly implemented, communications completedTop 1,000 leadership positions filledPerformance management tools globally developed
1Change on a like-for-like basis
Delivering along our three focus areas
February 5, 2015
© ABB| Slide 17
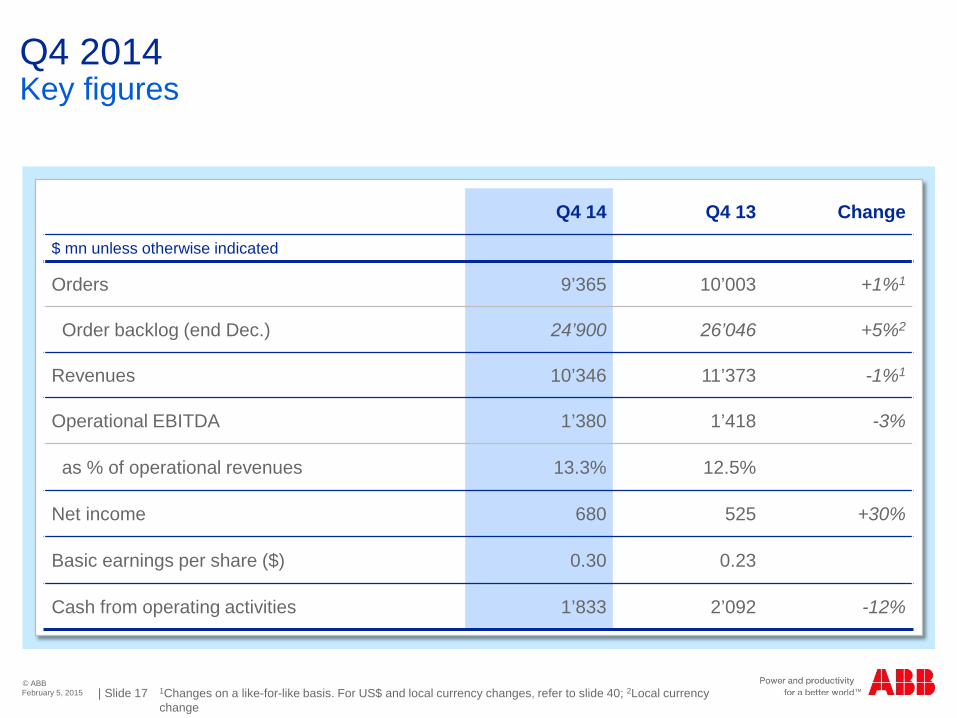
Q4 2014Key figures
Q4 14 Q4 13 Change
$ mn unless otherwise indicated
Orders 9’365 10’003 +1%1
Order backlog (end Dec.) 24’900 26’046 +5%2
Revenues 10’346 11’373 -1%1
Operational EBITDA 1’380 1’418 -3%
as % of operational revenues 13.3% 12.5%
Net income 680 525 +30%
Basic earnings per share ($) 0.30 0.23
Cash from operating activities 1’833 2’092 -12%
1Changes on a like-for-like basis. For US$ and local currency changes, refer to slide 40; 2Local currency change
February 5, 2015

© ABB| Slide 18
Continued base orders growthRegional order pattern reflects timing of large orders
Change on a like-for-like basis
2014 Q4 total order growth by region
Base orders up 4% in a challenging environment
Brazil +22%
Canada +14%
China +4%
Finland +57%
India +43%
Italy +7%
Japan +59%
Saudi Arabia +5%
Switzerland +6%
UK +12%
AmericasAutomation +7%Power -18%
Total -4%US -8%Canada -15%Brazil -1%
AsiaAutomation +1%Power +21%
Total +7%China +6%India +49%Japan +59%
EuropeAutomation +8%Power 0%
Total +5%Germany +1%Sweden +65%Italy +7%
MEA1
Automation -18%Power -5%
Total -11%Saudi Arabia +33%South Africa +47%
2014 Q4 base order growth2
Change on a like-for-like basis
1MEA: Middle East and Africa; 210 fastest-growing countries from among Top 20 countries February 5, 2015
© ABB| Slide 19
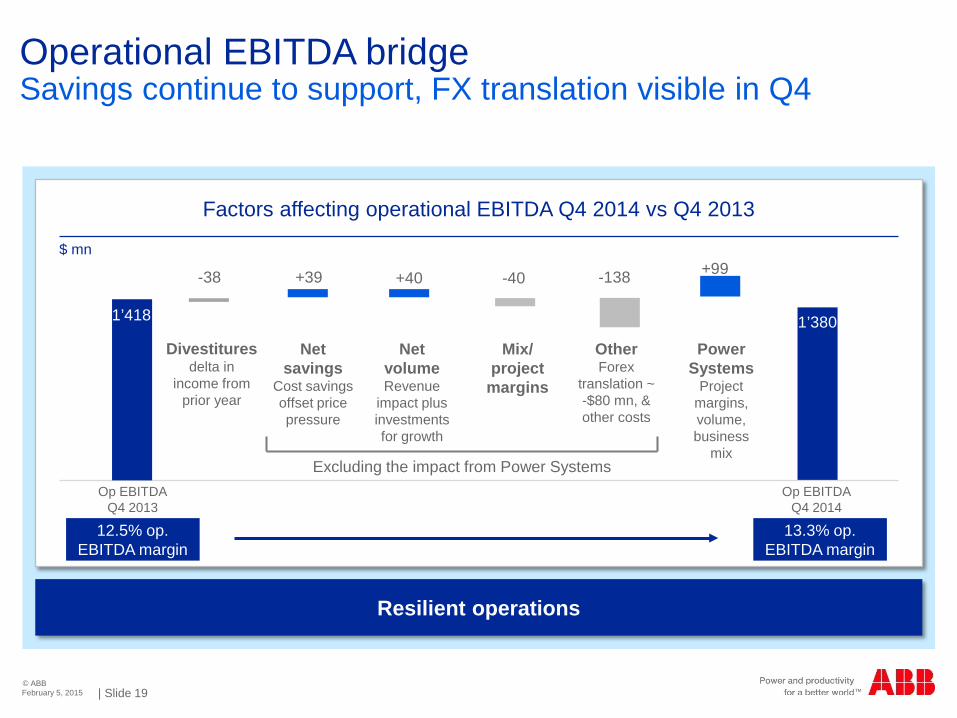
Operational EBITDA bridgeSavings continue to support, FX translation visible in Q4
Factors affecting operational EBITDA Q4 2014 vs Q4 2013
$ mn
Op EBITDAQ4 2013
Op EBITDAQ4 2014
Net savings
Cost savings offset price pressure
Net volumeRevenue
impact plus investments for growth
OtherForex
translation ~-$80 mn, & other costs
+39 -138+40
Mix/ project
margins
-40 +99
Power Systems
Project margins, volume, business
mixExcluding the impact from Power Systems
-38
Divestituresdelta in
income from prior year
1’380
12.5% op. EBITDA margin
13.3% op. EBITDA margin
1’418
Resilient operations
February 5, 2015

© ABB| Slide 20
Power & Automation
ABB well positioned to manage forex volatilityForeign exchange exposures – overview
Structural effectUSD appreciation
Transaction
Translation to USD
Medium-term Inc. from op. ~$200-400 mnInc. from op.% ~0.5-1% point
Net exporter from EUR-zone to $-zone
Medium-term Inc. from op. $100-200 mnInc. from op.% ~0.25-0.5% point
Mitigated by sourcing and cost optimization
Immediate Minor ~ fully hedged, but some valuation timing differences
Policy to hedge all exposures
Immediate Inc. from op./orders/revenues ~9%
> 50% of revenues from non-$ zones
Timing Estimated impact
15% appreciation of USD15% appreciation of CHF vs EUR
Structural effectCHF appreciation
Actions / Drivers
Example:
Limited economic impact due to footprint and proactive actions
February 5, 2015

© ABB| Slide 21
Improved cash flowCash metrics reflect solid execution
Cash from operations, $ mn, quarterly build-up
-223 -45
1’241
2’092
2013 2014
3’653YTD
3’845YTD
Q2
Q3
Q4
Q1543
888
1’169
1’833
Strong cash conversion
Free cash flow and conversion rate, $ bn and %
CROI1 now moving in the right direction
2.6
2.6
2.9
94% 94%110%
1 2 3
12.1%11.6%
12.7%
1 2 3
1CROI: Cash Return on Investment; 2NWC: Net Working Capital
NWC2 measures also drive more balanced cash generation over the year
A solid, more balanced, cash generator
2012 2013 2014
2012 2013 2014
February 5, 2015
© ABB| Slide 22
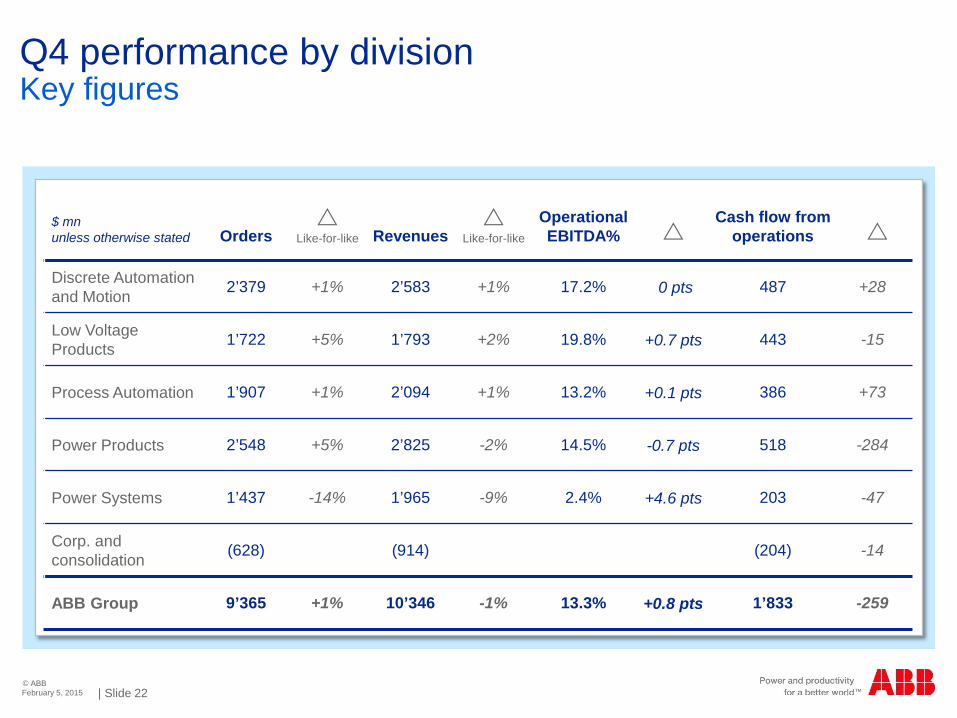
Q4 performance by divisionKey figures
$ mnunless otherwise stated Orders
Like-for-like Revenues
Like-for-like
Operational EBITDA%
Cash flow from operations
Discrete Automation and Motion 2’379 +1% 2’583 +1% 17.2% 0 pts 487 +28
Low Voltage Products 1’722 +5% 1’793 +2% 19.8% +0.7 pts 443 -15
Process Automation 1’907 +1% 2’094 +1% 13.2% +0.1 pts 386 +73
Power Products 2’548 +5% 2’825 -2% 14.5% -0.7 pts 518 -284
Power Systems 1’437 -14% 1’965 -9% 2.4% +4.6 pts 203 -47
Corp. and consolidation (628) (914) (204) -14
ABB Group 9’365 +1% 10’346 -1% 13.3% +0.8 pts 1’833 -259
February 5, 2015
© ABB| Slide 23
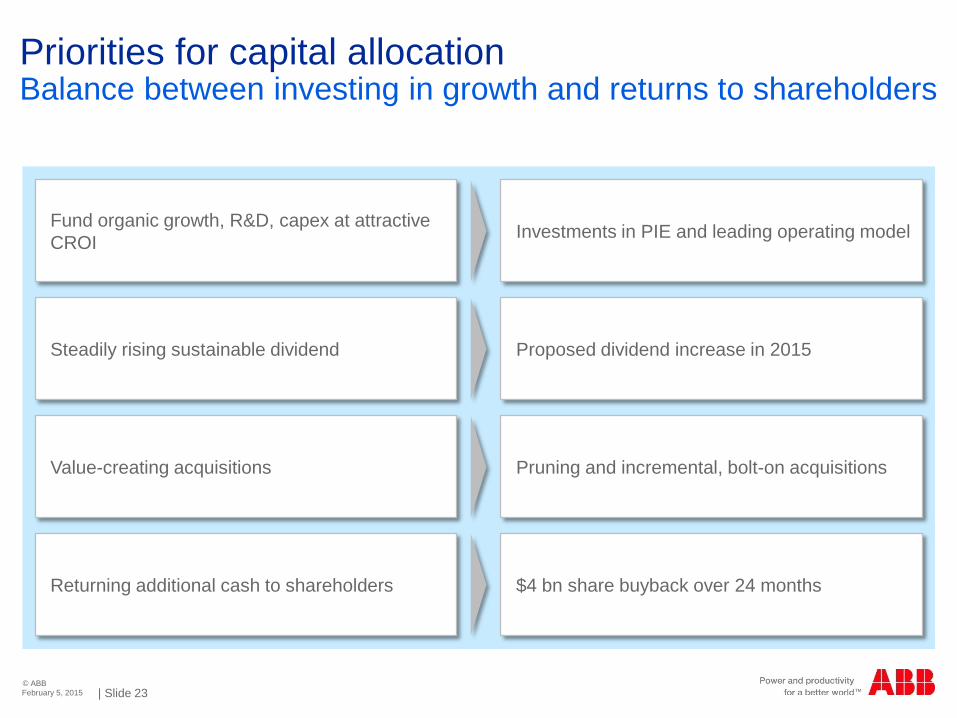
Priorities for capital allocationBalance between investing in growth and returns to shareholders
Fund organic growth, R&D, capex at attractive CROI
Steadily rising sustainable dividend
Value-creating acquisitions
Returning additional cash to shareholders
Investments in PIE and leading operating model
Proposed dividend increase in 2015
Pruning and incremental, bolt-on acquisitions
$4 bn share buyback over 24 months
February 5, 2015
© ABB| Slide 24
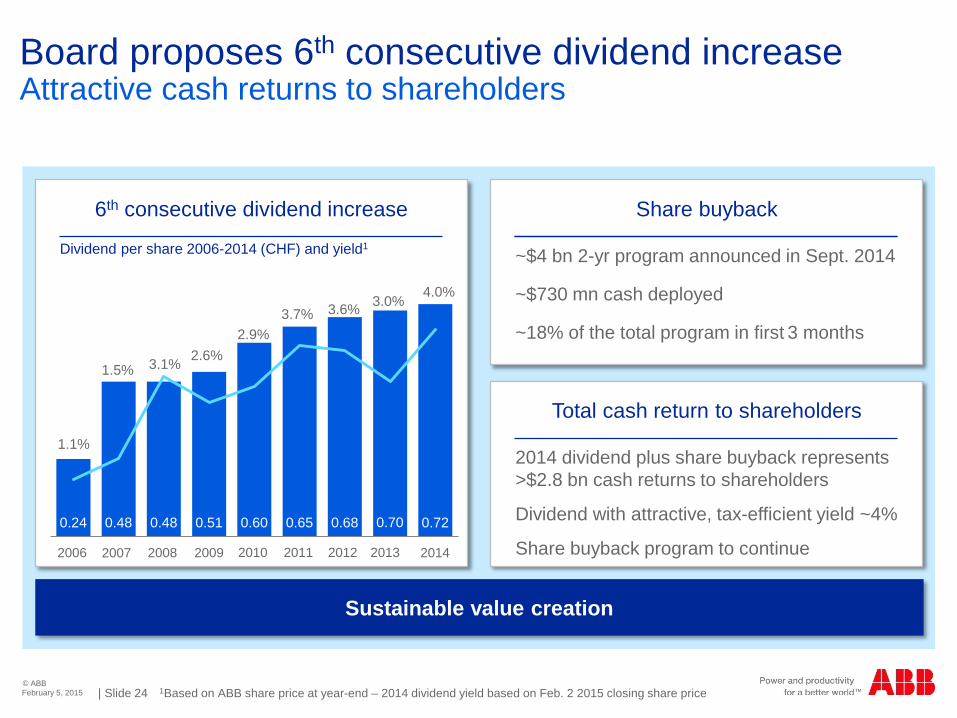
~$4 bn 2-yr program announced in Sept. 2014
~$730 mn cash deployed
~18% of the total program in first 3 months
Share buyback
Board proposes 6th consecutive dividend increase Attractive cash returns to shareholders
6th consecutive dividend increase
0.24 0.48 0.48 0.51 0.60 0.65 0.68 0.72
1.1%
1.5% 3.1% 2.6%2.9%
3.7% 3.6% 3.0% 4.0%
1 2 3 4 5 6 7 8 9
Dividend per share 2006-2014 (CHF) and yield1
0.20
2014 dividend plus share buyback represents >$2.8 bn cash returns to shareholders
Dividend with attractive, tax-efficient yield ~4%
Share buyback program to continue
Total cash return to shareholders
1Based on ABB share price at year-end – 2014 dividend yield based on Feb. 2 2015 closing share price
Sustainable value creation
0.70
2006 2007 2008 2009 2010 2011 2012 2013 2014
February 5, 2015
© ABB| Slide 25
Agenda
Financial results Full-year 2014 Q4
Next Level implementation
Outlook
Q&A
February 5, 2015

© ABB| Slide 26
ABB – our Next Level strategyShaping a global leader in power & automation
Attractive markets
Well positioned
Shifting the center of gravity Strengthening competitiveness Driving organic growth momentum Lowering risk
Incremental acquisitions and partnerships
Leading operating modelDriving change through 1’000-day programsLinked strategy, performance management and compensation
Simplifying how we work togetherStreamlining market focused organizationLeadership development
Profitable growth
Relentless execution
Business-led collaboration
Delivering attractive shareholder returns
2014-2016 share buy-back
Accelerating sustainable value creation
Presented September 9th, 2014
February 5, 2015
© ABB| Slide 27
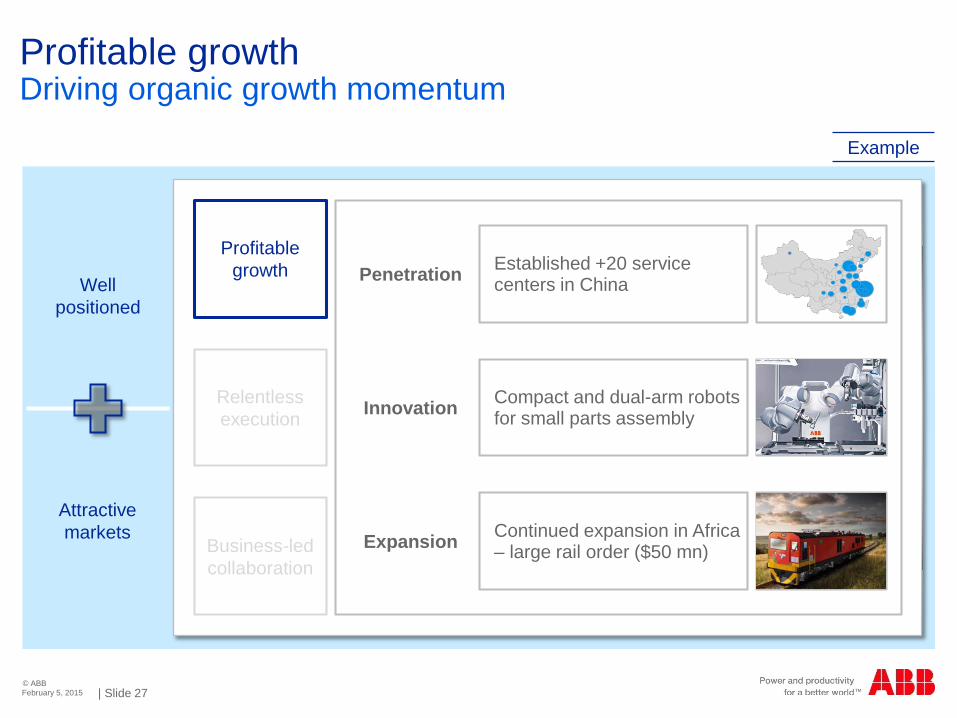
Profitable growthDriving organic growth momentum
Attractive markets
Well positioned
Profitable growth
Relentless execution
Business-led collaboration
Example
Penetration
Innovation
Expansion
Established +20 service centers in China
Compact and dual-arm robots for small parts assembly
Continued expansion in Africa – large rail order ($50 mn)
February 5, 2015
© ABB| Slide 28
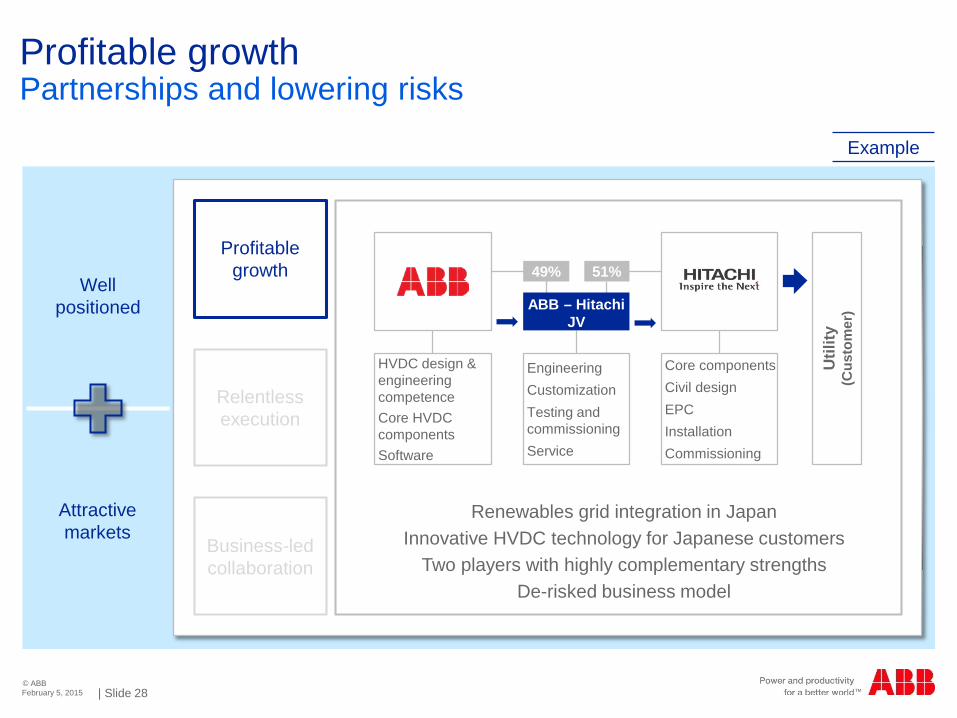
Profitable growthPartnerships and lowering risks
Attractive markets
Well positioned
Renewables grid integration in JapanInnovative HVDC technology for Japanese customers
Two players with highly complementary strengthsDe-risked business model
Profitable growth
Relentless execution
Business-led collaboration
Util
ity
(Cus
tom
er)
HVDC design & engineering competence Core HVDC componentsSoftware
EngineeringCustomizationTesting and commissioningService
Core componentsCivil designEPCInstallationCommissioning
ABB – Hitachi JV
49% 51%
Example
February 5, 2015
© ABB| Slide 29
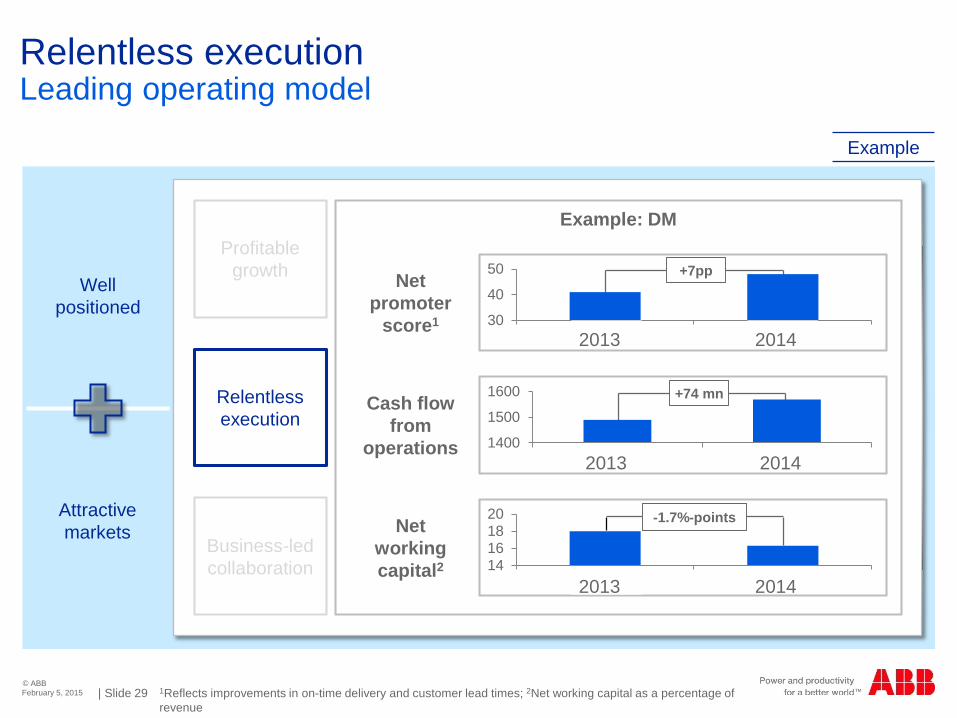
Relentless executionLeading operating model
Attractive markets
Well positioned
Profitable growth
Relentless execution
Business-led collaboration
1Reflects improvements in on-time delivery and customer lead times; 2Net working capital as a percentage of revenue
Cash flow from
operations
Net working capital2
Net promoter
score1
Example: DM
+7pp
30
40
50
1 2
+74 mn
1400
1500
1600
1 2
-1.7%-points
14161820
1 2
Example
2013 2014
2013 2014
2013 2014
February 5, 2015
© ABB| Slide 30
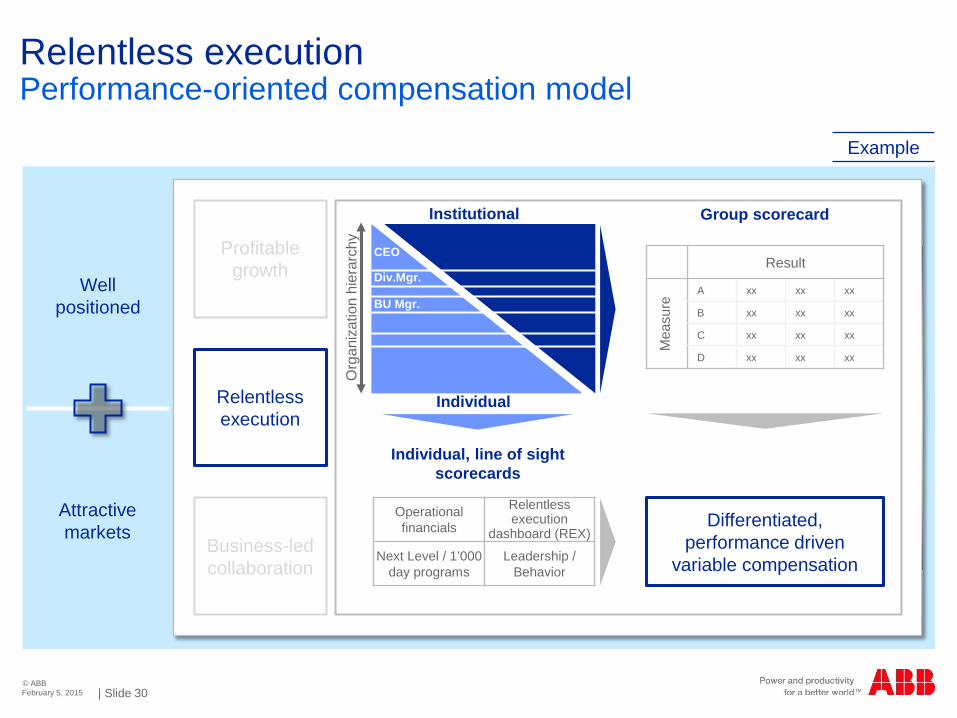
Relentless executionPerformance-oriented compensation model
Attractive markets
Well positioned
CEO
Div.Mgr.
BU Mgr.
Org
aniz
atio
n hi
erar
chy
Individual, line of sight scorecards
Operational financials
Relentless execution
dashboard (REX)
Next Level / 1’000day programs
Leadership / Behavior
Differentiated, performance driven
variable compensation
Group scorecard
Result
Mea
sure
A xx xx xx
B xx xx xx
C xx xx xx
D xx xx xx
Institutional
Individual
Profitable growth
Relentless execution
Business-led collaboration
Example
February 5, 2015
© ABB| Slide 31
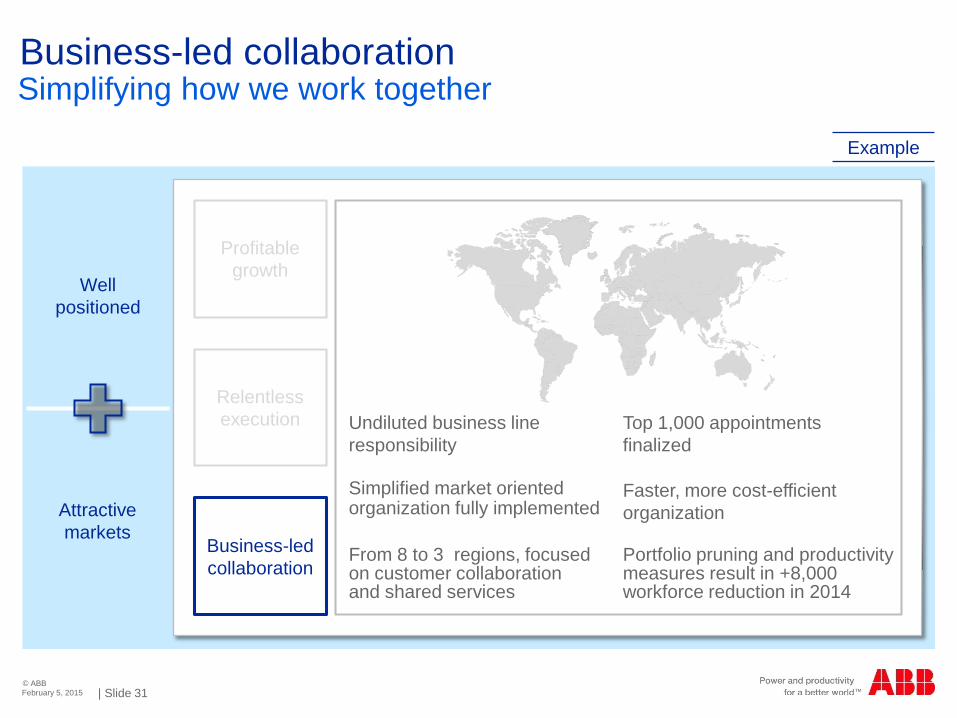
Business-led collaborationSimplifying how we work together
Attractive markets
Well positioned
Profitable growth
Relentless execution
Business-led collaboration
Undiluted business line responsibility
Simplified market oriented organization fully implemented
Top 1,000 appointments finalized
Faster, more cost-efficient organization
Portfolio pruning and productivity measures result in +8,000 workforce reduction in 2014
From 8 to 3 regions, focused on customer collaboration and shared services
Example
February 5, 2015

© ABB| Slide 32
2014 – delivered on our commitmentsA solid foundation for the future
Organic growth momentum: +10% orders
Changes in center of gravity
Partnerships for growth
Delivered on cash and costPS break-even achievedPortfolio pruningPerformance management and compensation model
Lean market-oriented organization
Roles and responsibilities clarified
Top 1‘000 positions filled
Business-led collaboration
Relentless execution
Profitable growth
Next Level and 2020 targets in place
February 5, 2015

© ABB| Slide 33
Agenda
Financial results Full-year 2014 Q4
Next Level implementation
Outlook
Q&A
February 5, 2015
© ABB| Slide 34
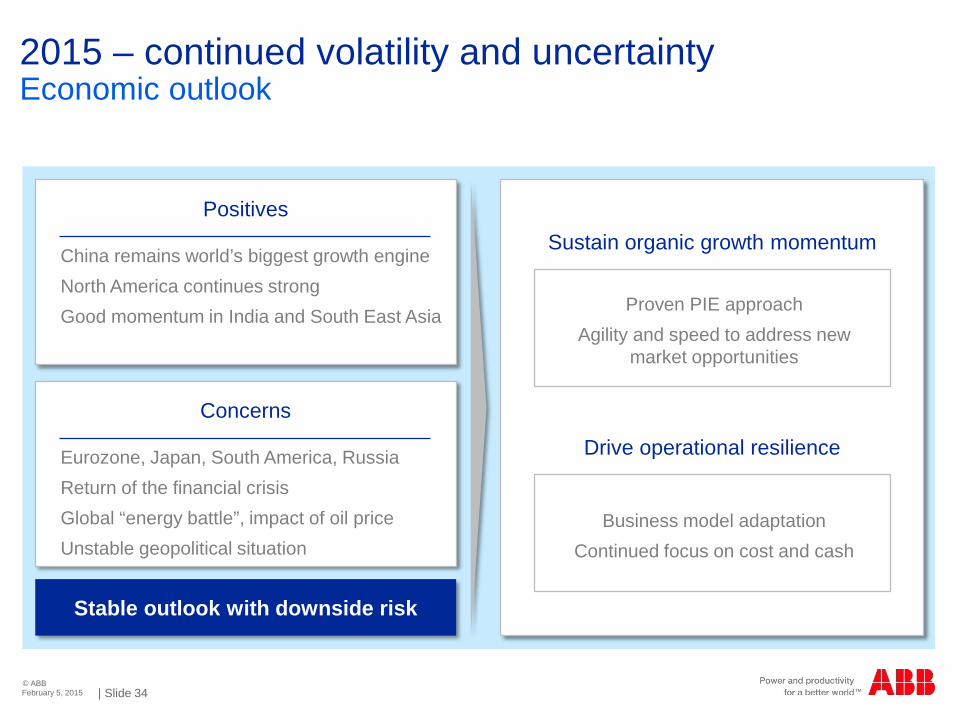
2015 – continued volatility and uncertaintyEconomic outlook
Title
China remains world’s biggest growth engineNorth America continues strongGood momentum in India and South East Asia
Eurozone, Japan, South America, RussiaReturn of the financial crisisGlobal “energy battle”, impact of oil priceUnstable geopolitical situation
Stable outlook with downside risk
Positives
Concerns
Proven PIE approachAgility and speed to address new
market opportunities
Sustain organic growth momentum
Business model adaptationContinued focus on cost and cash
Drive operational resilience
February 5, 2015

© ABB| Slide 35
Mainly capexreductions
Mainly on greenfield projects
Oil & Gas
Upstream Mid- / Downstream
Key topic: oil priceLow oil price impacts global spending in different ways
Low oil price
Reallocation of oil subsidies to
infrastructure
Governments
Several industries benefit, e.g.,
automotive, marine
Industries1
1Except Oil and Gas
~6% of ABB business exposed Potential downside Potential upsidePotential upside
February 5, 2015
© ABB| Slide 36
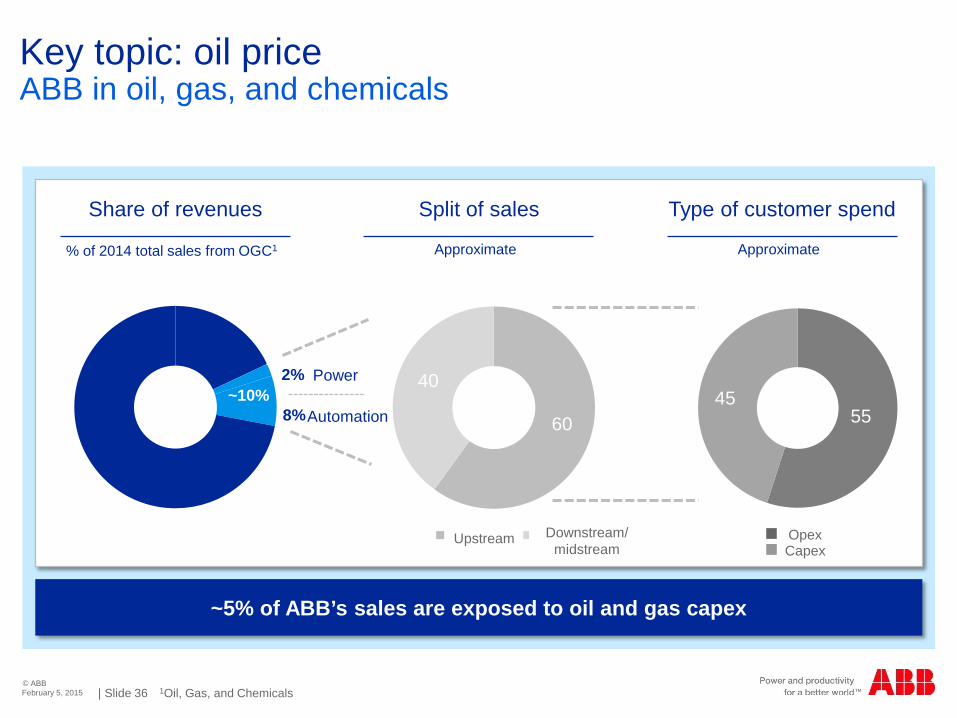
Key topic: oil priceABB in oil, gas, and chemicals
Share of revenues Split of sales Type of customer spend
~5% of ABB’s sales are exposed to oil and gas capex
8%
% of 2014 total sales from OGC1 Approximate
2
~10%
1 2
40
6045
55Automation
Power2%
Approximate
1Oil, Gas, and Chemicals
x xUpstream Downstream/ midstream
OpexCapex
February 5, 2015
© ABB| Slide 37
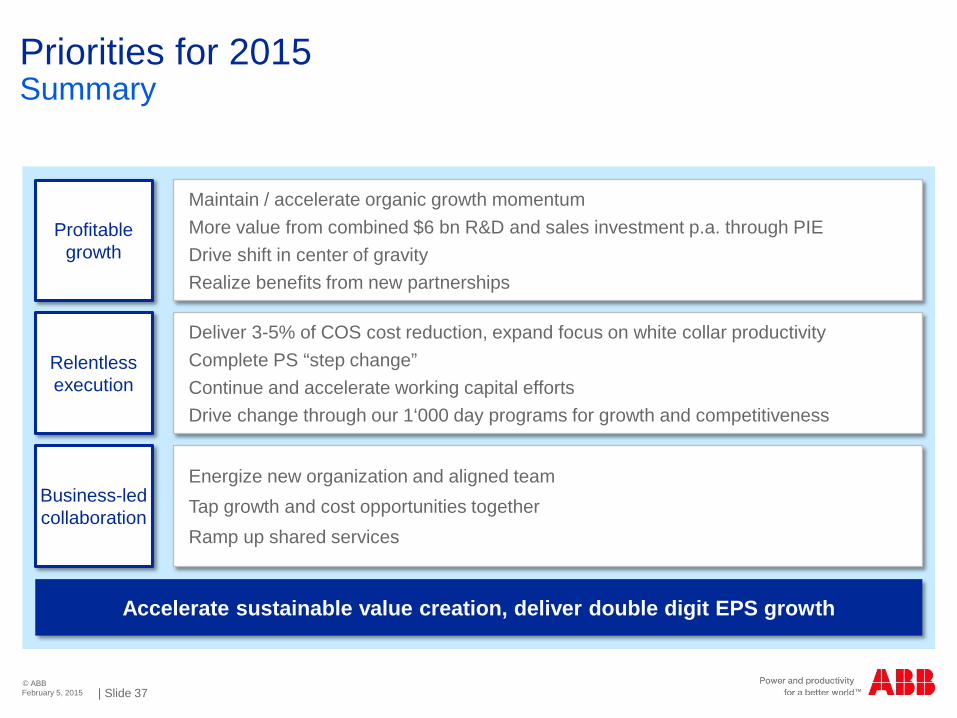
Priorities for 2015Summary
Maintain / accelerate organic growth momentumMore value from combined $6 bn R&D and sales investment p.a. through PIEDrive shift in center of gravity Realize benefits from new partnerships
Deliver 3-5% of COS cost reduction, expand focus on white collar productivityComplete PS “step change”Continue and accelerate working capital effortsDrive change through our 1‘000 day programs for growth and competitiveness
Energize new organization and aligned teamTap growth and cost opportunities together Ramp up shared services
Business-led collaboration
Relentless execution
Profitable growth
Accelerate sustainable value creation, deliver double digit EPS growth
February 5, 2015

© ABB| Slide 38
Agenda
Financial results Full-year 2014 Q4
Next Level implementation
Outlook
Q&A
February 5, 2015
© ABB| Slide 39
Chart 39

© ABB| Slide 40
Key figures Q4 and FY 2014
Q4 14 Q4 13 Change FY 14 FY 13 Change
$ mn unless otherwise indicated $ Local
currencyLike-
for-like $ Local currency
Like-for-like
Orders 9’365 10’003 -6% -1% +1% 41’515 38’896 +7% +9% +10%
Order backlog (end December) 24’900 26’046 -4% +5% 24’900 26’046 -4% +5%
Revenues 10’346 11’373 -9% -3% -1% 39’830 41’848 -5% -2% -2%
Income from operations 1’049 823 27% 4’178 4’387 -5%
as % of revenues 10.1% 7.2% 10.5% 10.5%
Operational EBITDA 1’380 1’418 -3% 5’400 6’075 -11%
as % of operationalrevenues 13.3% 12.5% 13.5% 14.5%
Net income 680 525 +30% 2’594 2’787 -7%
Basic earnings per share ($) 0.30 0.23 1.13 1.21
Cash from operating activities 1’833 2’092 -12% 3’845 3’653 +5%
February 5, 2015

© ABB| Slide 41
Order backlog by division
2014 2013 Change %
Order backlog (end December)$ mn $ Local currency
Discrete Automation and Motion 4’385 4’351 +1% +9%
Low Voltage Products 891 1’057 -16% -9%
Process Automation 5’661 5’772 -2% +9%
Power Products 7’791 7’946 -2% +6%
Power Systems 8’246 9’435 -13% -4%
Consolidation and Other(incl. Inter-division eliminations) (2’074) (2’515)
Total Group 24’900 26’046 -4% +5%
February 5, 2015
© ABB| Slide 42
Operational EPS analysis
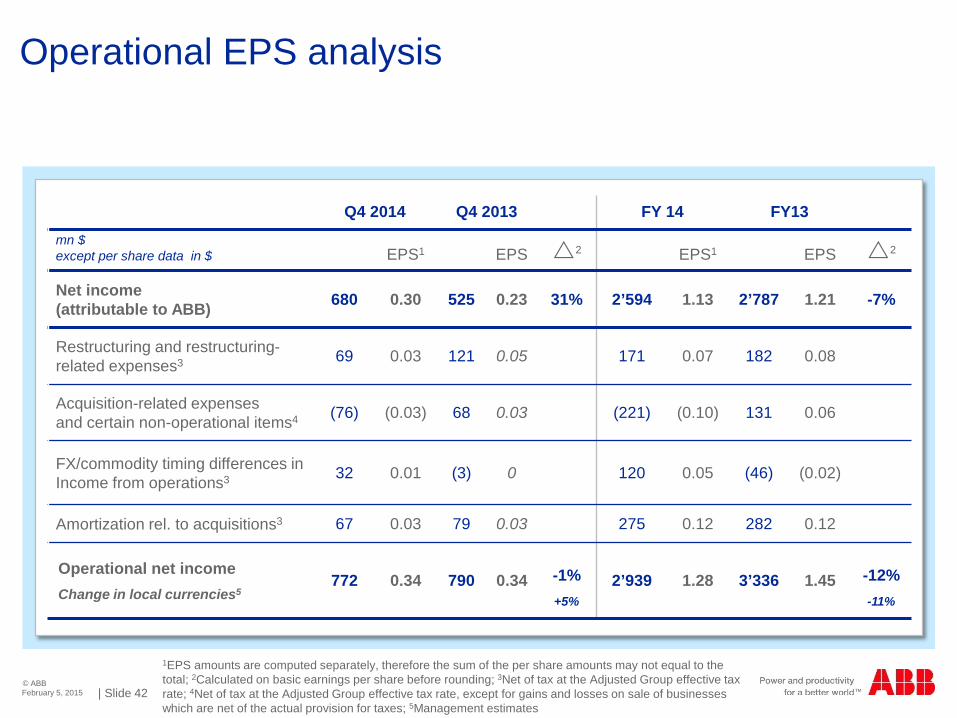
1EPS amounts are computed separately, therefore the sum of the per share amounts may not equal to the total; 2Calculated on basic earnings per share before rounding; 3Net of tax at the Adjusted Group effective tax rate; 4Net of tax at the Adjusted Group effective tax rate, except for gains and losses on sale of businesses which are net of the actual provision for taxes; 5Management estimates
Q4 2014 Q4 2013 FY 14 FY13mn $except per share data in $ EPS1 EPS 2 EPS1 EPS 2
Net income (attributable to ABB) 680 0.30 525 0.23 31% 2’594 1.13 2’787 1.21 -7%
Restructuring and restructuring-related expenses3 69 0.03 121 0.05 171 0.07 182 0.08
Acquisition-related expensesand certain non-operational items4 (76) (0.03) 68 0.03 (221) (0.10) 131 0.06
FX/commodity timing differences in Income from operations3 32 0.01 (3) 0 120 0.05 (46) (0.02)
Amortization rel. to acquisitions3 67 0.03 79 0.03 275 0.12 282 0.12
Operational net incomeChange in local currencies5
772 0.34 790 0.34 -1%+5%
2’939 1.28 3’336 1.45 -12%-11%
February 5, 2015
© ABB| Slide 43
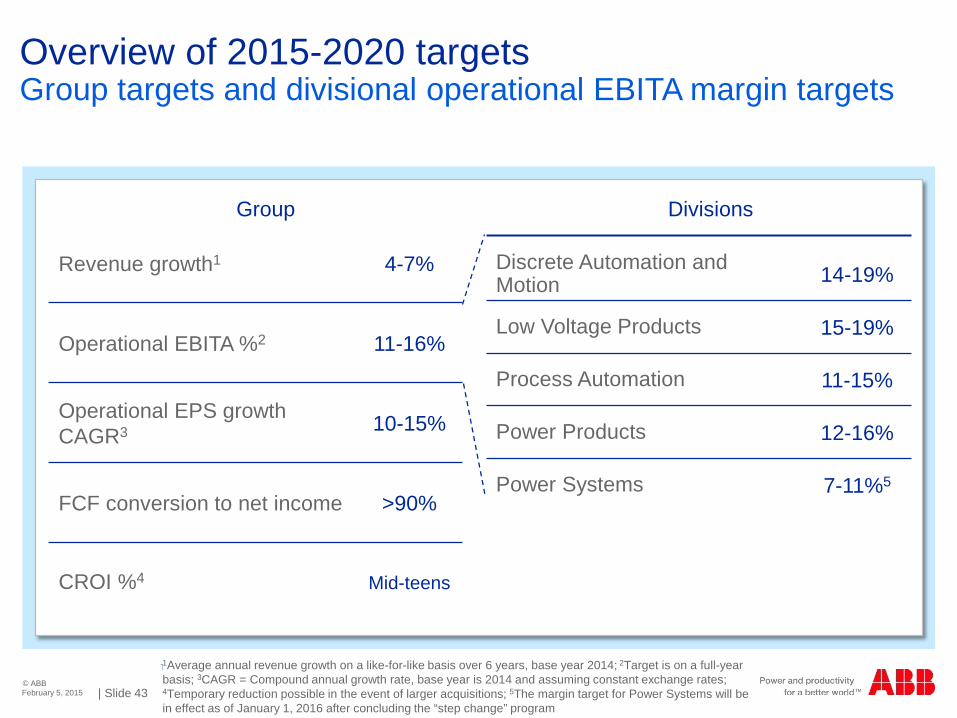
Overview of 2015-2020 targetsGroup targets and divisional operational EBITA margin targets
Revenue growth1 4-7%
Operational EBITA %2 11-16%
Operational EPS growth CAGR3 10-15%
FCF conversion to net income >90%
CROI %4 Mid-teens
Discrete Automation and Motion 14-19%
Low Voltage Products 15-19%
Process Automation 11-15%
Power Products 12-16%
Power Systems 7-11%5
Group Divisions
;1Average annual revenue growth on a like-for-like basis over 6 years, base year 2014 2Target is on a full-year basis; 3CAGR = Compound annual growth rate, base year is 2014 and assuming constant exchange rates; 4Temporary reduction possible in the event of larger acquisitions; 5The margin target for Power Systems will be in effect as of January 1, 2016 after concluding the “step change” program
February 5, 2015

© ABB| Slide 44
Regional share of total orders and revenues by divisionQ4 2014
Ord
ers
Discrete Automation and
Motion
Rev
enue
s
Low Voltage Products
Process Automation
Power Products
Power Systems
39%
33%
25%
3%
AsiaEurope
41%
29%
22%
8%
31%
24%
33%
12%
28%
28%
30%
14%
33%
22%26%
19%
36%
32%
28%
4%
39%
28%
25%
8%
32%
26%
33%
9%
32%
27%
31%
10%
37%
24%
18%
21%
Middle East and AfricaAmericasFebruary 5, 2015
© ABB| Slide 45
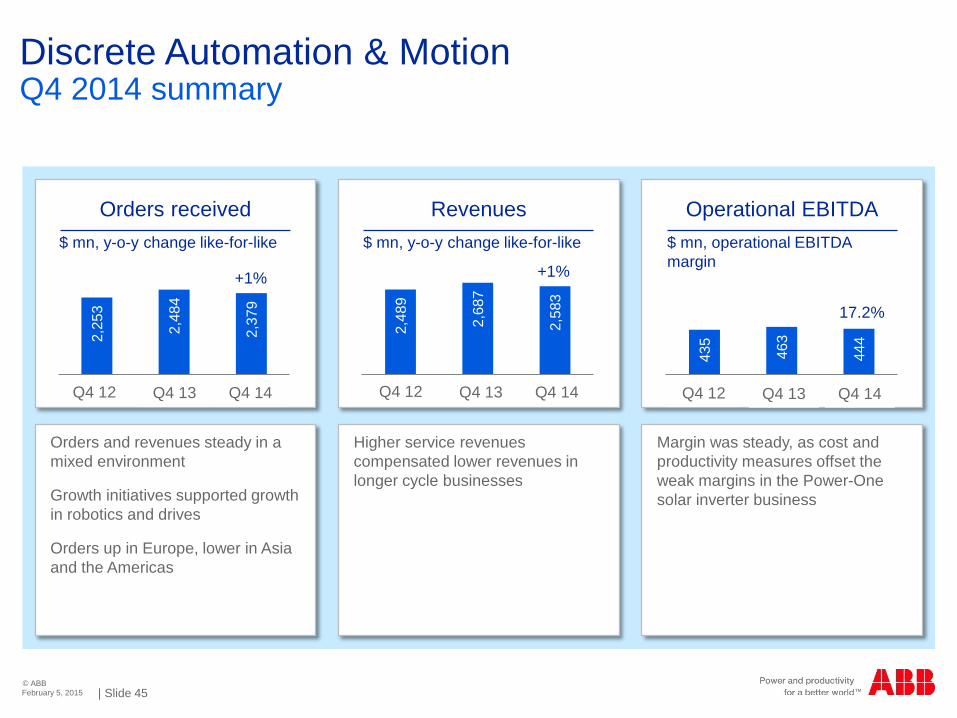
Discrete Automation & MotionQ4 2014 summary
Orders received Revenues Operational EBITDA
Orders and revenues steady in a mixed environment
Growth initiatives supported growth in robotics and drives
Orders up in Europe, lower in Asia and the Americas
Higher service revenues compensated lower revenues in longer cycle businesses
Margin was steady, as cost and productivity measures offset the weak margins in the Power-One solar inverter business
$ mn, y-o-y change like-for-like $ mn, y-o-y change like-for-like $ mn, operational EBITDA margin
2,25
3
2,48
4
2,37
9
1 2 32,
489
2,68
7
2,58
3
1 2 3
435
463
444
1 2 3
+1% +1%
17.2%
Q4 12 Q4 13 Q4 14 Q4 12 Q4 13 Q4 14 Q4 12 Q4 13 Q4 14
February 5, 2015
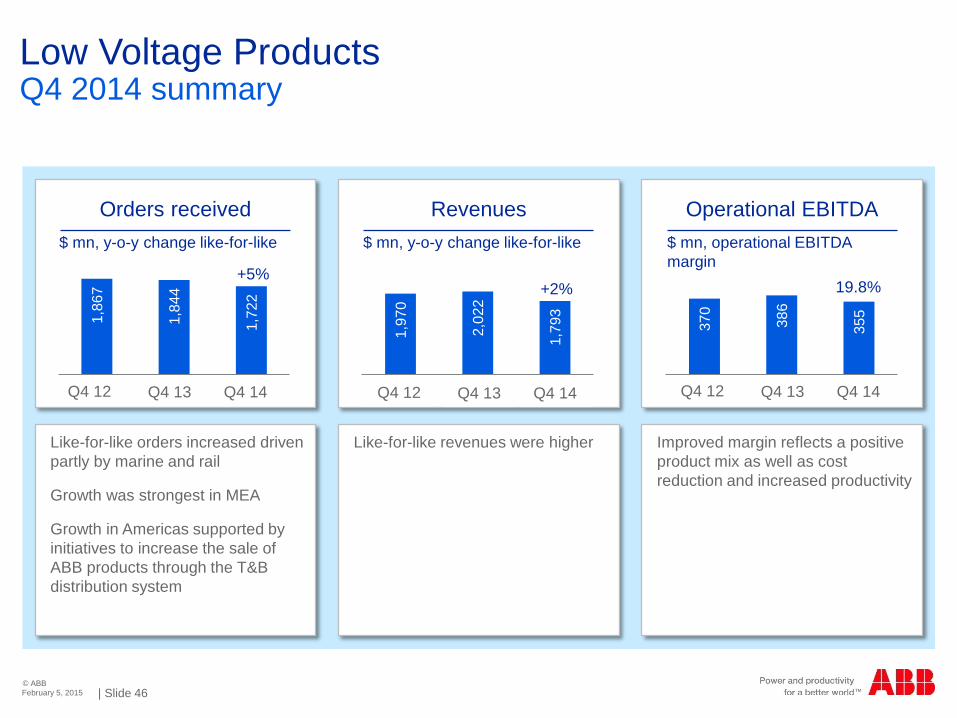
© ABB| Slide 46
Low Voltage Products Q4 2014 summary
Orders received Revenues Operational EBITDA
Like-for-like orders increased driven partly by marine and rail
Growth was strongest in MEA
Growth in Americas supported by initiatives to increase the sale of ABB products through the T&B distribution system
Like-for-like revenues were higher Improved margin reflects a positive product mix as well as cost reduction and increased productivity
$ mn, y-o-y change like-for-like $ mn, y-o-y change like-for-like $ mn, operational EBITDA margin
1,86
7
1,84
4
1,72
2
1 2 31,
970
2,02
2
1,79
3
1 2 3
370
386
355
1 2 3
+5%+2% 19.8%
Q4 12 Q4 13 Q4 14Q4 12 Q4 13 Q4 14Q4 12 Q4 13 Q4 14
February 5, 2015
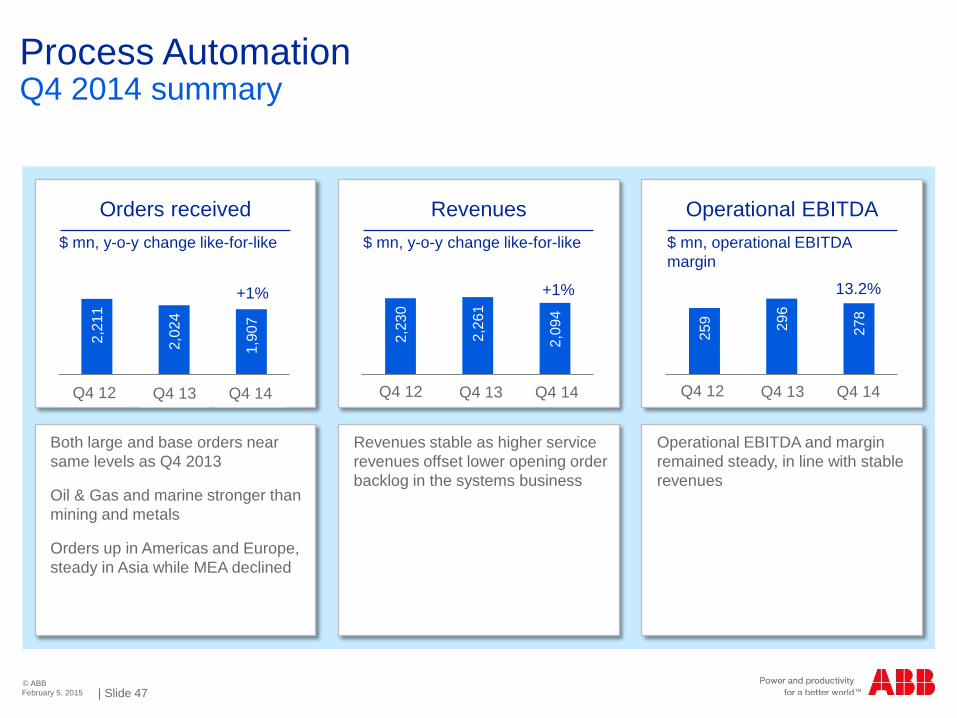
© ABB| Slide 47
Process AutomationQ4 2014 summary
Orders received Revenues Operational EBITDA
Both large and base orders near same levels as Q4 2013
Oil & Gas and marine stronger than mining and metals
Orders up in Americas and Europe, steady in Asia while MEA declined
Revenues stable as higher service revenues offset lower opening order backlog in the systems business
Operational EBITDA and margin remained steady, in line with stable revenues
$ mn, y-o-y change like-for-like $ mn, y-o-y change like-for-like $ mn, operational EBITDA margin
2,21
1
2,02
4
1,90
7
1 2 32,
230
2,26
1
2,09
4
1 2 3
259 29
6
278
1 2 3
+1% +1% 13.2%
Q4 12 Q4 13 Q4 14 Q4 12 Q4 13 Q4 14Q4 12 Q4 13 Q4 14
February 5, 2015
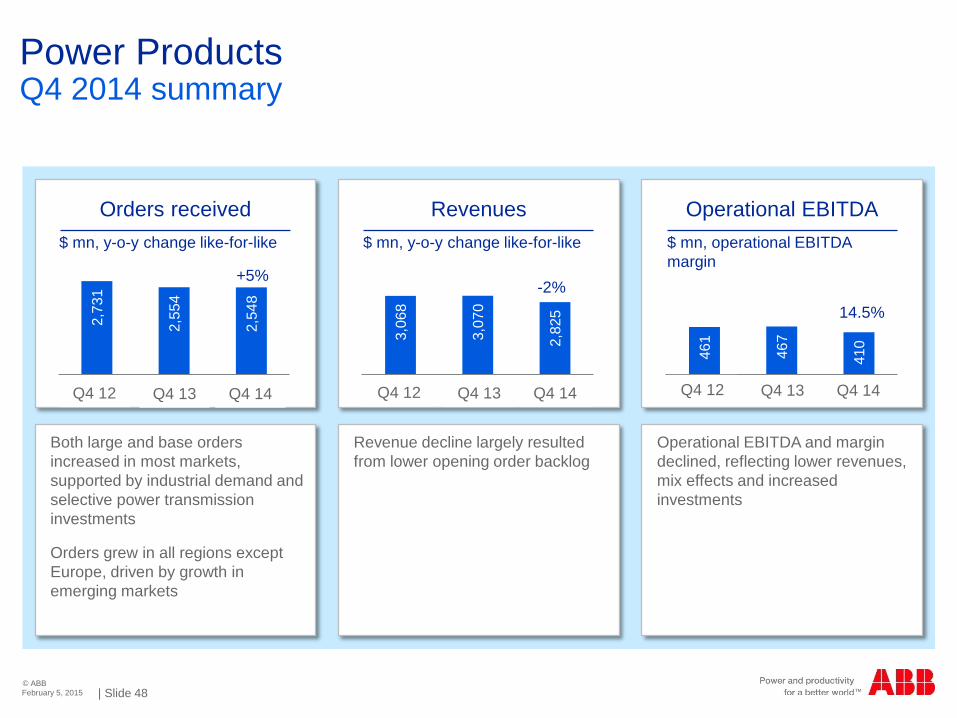
© ABB| Slide 48
Power ProductsQ4 2014 summary
Orders received Revenues Operational EBITDA
Both large and base orders increased in most markets, supported by industrial demand and selective power transmission investments
Orders grew in all regions except Europe, driven by growth in emerging markets
Revenue decline largely resulted from lower opening order backlog
Operational EBITDA and margin declined, reflecting lower revenues, mix effects and increased investments
$ mn, y-o-y change like-for-like $ mn, y-o-y change like-for-like $ mn, operational EBITDA margin
2,73
1
2,55
4
2,54
8
1 2 33,
068
3,07
0
2,82
5
1 2 3
461
467
410
1 2 3
+5%-2%
14.5%
Q4 12 Q4 13 Q4 14 Q4 12 Q4 13 Q4 14Q4 12 Q4 13 Q4 14
February 5, 2015

© ABB| Slide 49
Power SystemsQ4 2014 summary
Orders received Revenues Operational EBITDA
Higher base orders, reflecting in large part ongoing initiatives to reposition the business and focus on high value-added projects, were more than offset by a decrease in large orders compared to Q4 2013
Revenues were lower than the previous year, impacted by the lower opening order backlog
Operational EBITDA and margin improved significantly as measures to de-risk the business and focus on higher value-added projects continued
Partly offset by project-related costs in a small number of ongoing offshore wind orders
$ mn, y-o-y change like-for-like $ mn, y-o-y change like-for-like $ mn, operational EBITDA margin
2,36
0
1,78
9
1,43
7
1 2 32,
272
2,30
0
1,96
5
1 2 3
-55 -50
49
1 2 3
-14% -9%2.4%
Q4 12 Q4 13 Q4 14 Q4 12 Q4 13 Q4 14Q4 12 Q4 13 Q4 14
February 5, 2015
© ABB| Slide 50
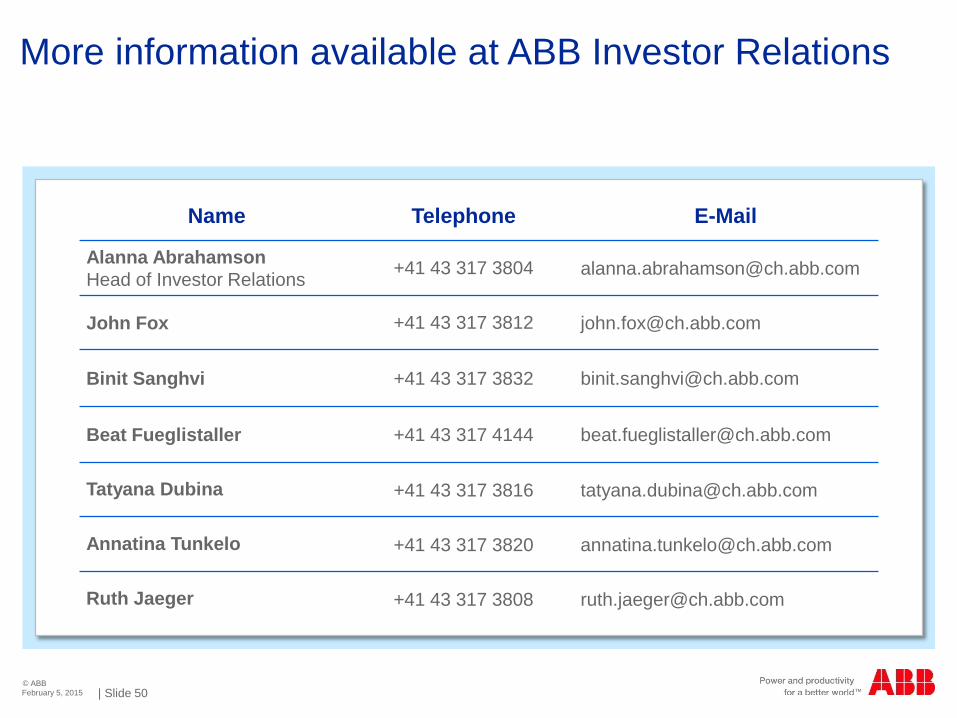
More information available at ABB Investor Relations
Name Telephone E-Mail
Alanna AbrahamsonHead of Investor Relations +41 43 317 3804 [email protected]
John Fox +41 43 317 3812 [email protected]
Binit Sanghvi +41 43 317 3832 [email protected]
Beat Fueglistaller +41 43 317 4144 [email protected]
Tatyana Dubina +41 43 317 3816 [email protected]
Annatina Tunkelo +41 43 317 3820 [email protected]
Ruth Jaeger +41 43 317 3808 [email protected]
February 5, 2015


