Ultra Petroleum Corp. Michael D. Watford Chairman, President and CEO May 2013 Ultra Petroleum Corp. is an independent exploration and production company focused on developing its long-life natural gas reserves in the Green River Basin of Wyoming – Pinedale and Jonah fields and is in the ongoing exploration and early development stage in the Appalachian Basin of Pennsylvania. Ultra Petroleum Corp. NYSE: UPL
Transcript
Ultra Petroleum Corp.Michael D. WatfordChairman, President and CEO
May 2013
Ultra Petroleum Corp. is an independent exploration and production company focusedon developing its long-life natural gas reserves in the Green River Basin of Wyoming –Pinedale and Jonah fields and is in the ongoing exploration and early development stagein the Appalachian Basin of Pennsylvania.
Ultra Petroleum Corp. NYSE: UPL
A Unique Energy Company
Ultra Petroleum Corp. NYSE: UPL 2
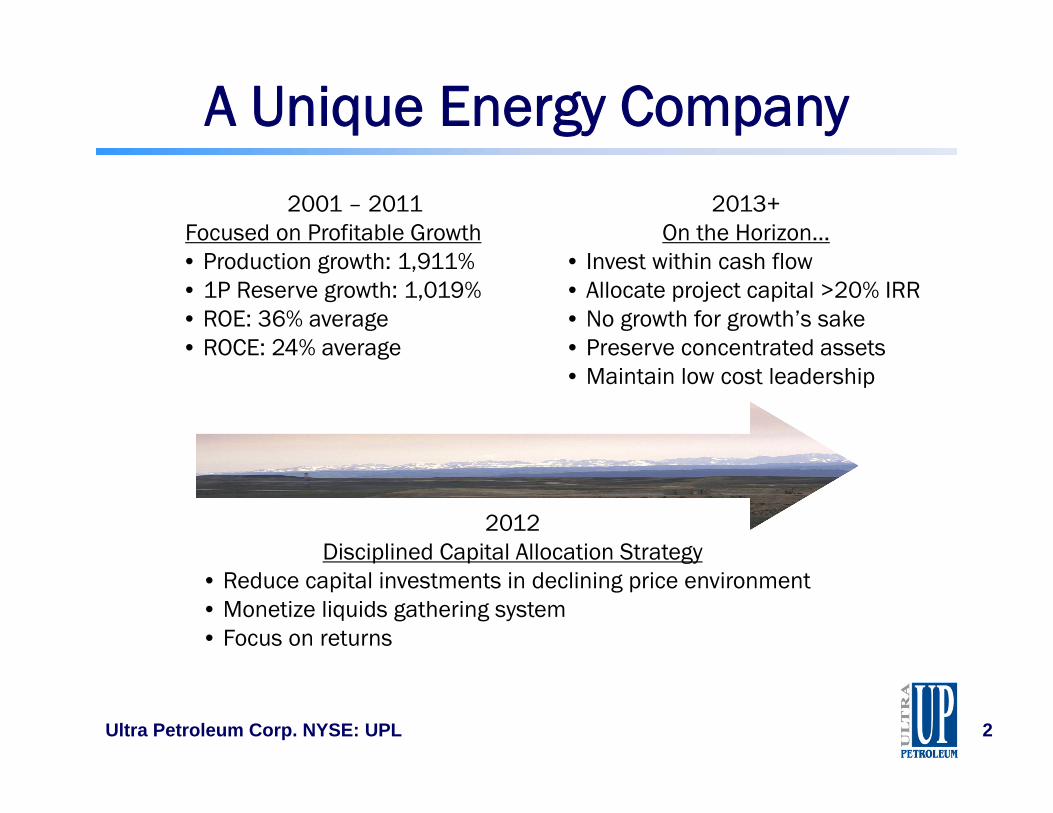
2012Disciplined Capital Allocation Strategy
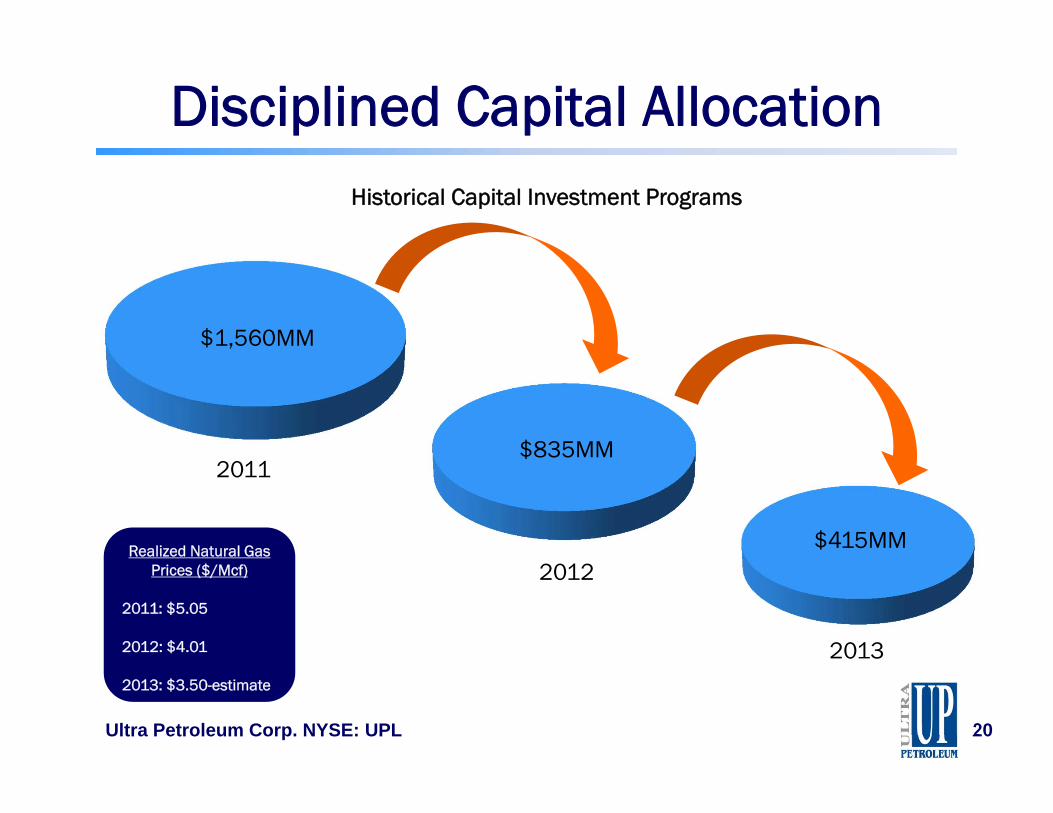
• Reduce capital investments in declining price environment• Monetize liquids gathering system• Focus on returns
2001 – 2011Focused on Profitable Growth• Production growth: 1,911%• 1P Reserve growth: 1,019%• ROE: 36% average• ROCE: 24% average
2013+On the Horizon…
• Invest within cash flow• Allocate project capital >20% IRR• No growth for growth’s sake• Preserve concentrated assets• Maintain low cost leadership
Strong Reserve Base
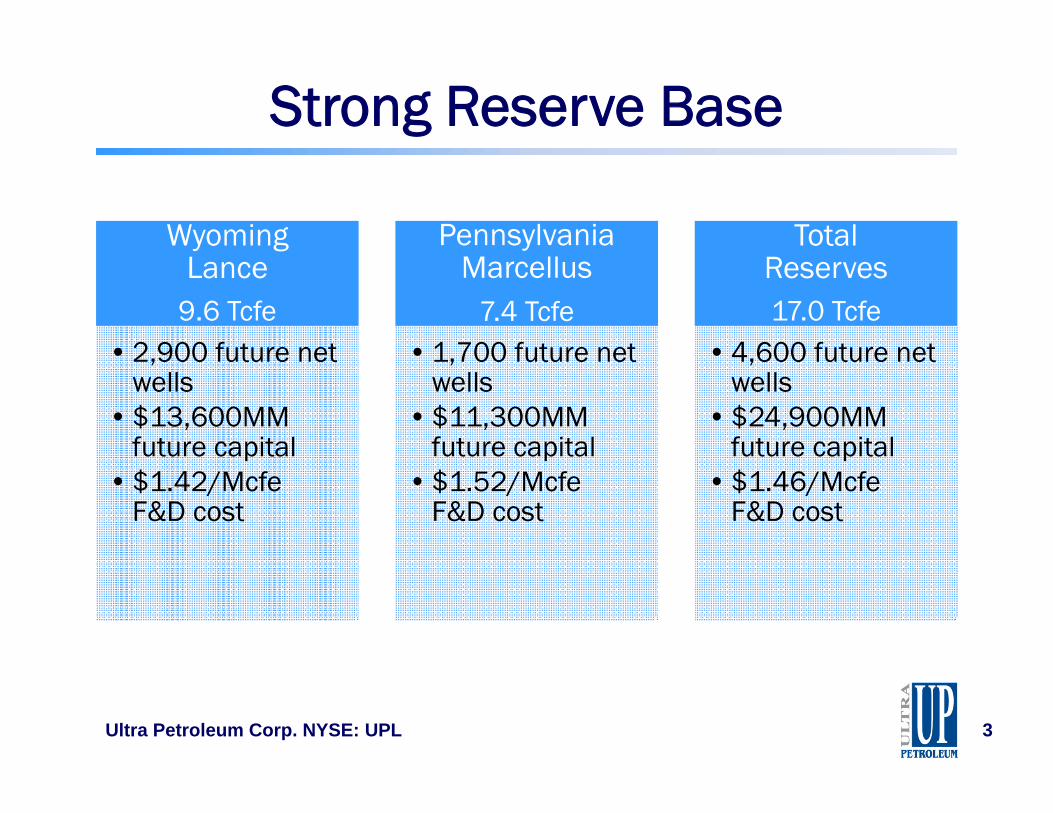
Wyoming Lance
9.6 Tcfe• 2,900 future net
wells• $13,600MM
future capital• $1.42/Mcfe
F&D cost
Pennsylvania Marcellus
7.4 Tcfe• 1,700 future net
wells• $11,300MM
future capital• $1.52/Mcfe
F&D cost
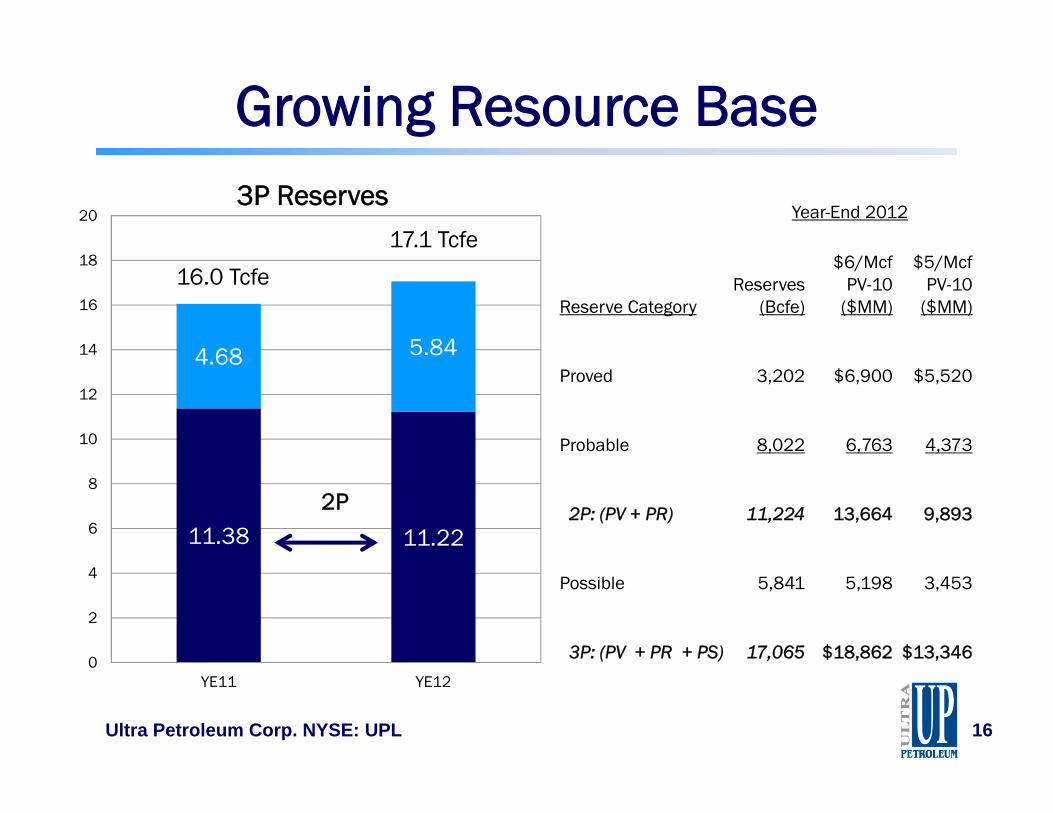
TotalReserves17.0 Tcfe
• 4,600 future net wells
• $24,900MM future capital
• $1.46/Mcfe F&D cost
Ultra Petroleum Corp. NYSE: UPL 3
Long-Life, Low-Cost, Lance Tight Gas
Ultra Petroleum Corp. NYSE: UPL 4
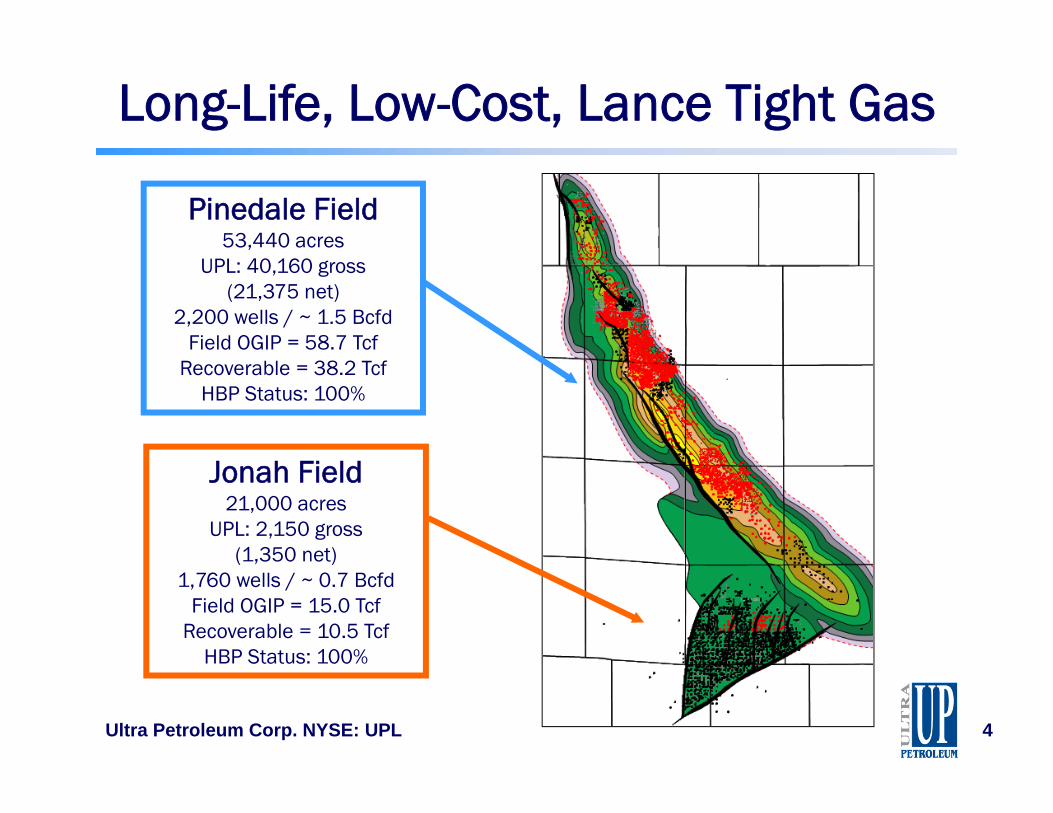
Jonah Field21,000 acres
UPL: 2,150 gross (1,350 net)
1,760 wells / ~ 0.7 BcfdField OGIP = 15.0 Tcf
Recoverable = 10.5 TcfHBP Status: 100%
Pinedale Field53,440 acres
UPL: 40,160 gross (21,375 net)
2,200 wells / ~ 1.5 BcfdField OGIP = 58.7 Tcf
Recoverable = 38.2 TcfHBP Status: 100%
Pinedale’s Profitable Well Economics
Ultra Petroleum Corp. NYSE: UPL 5
4.00Bcfe
5.00 Bcfe
6.00 Bcfe
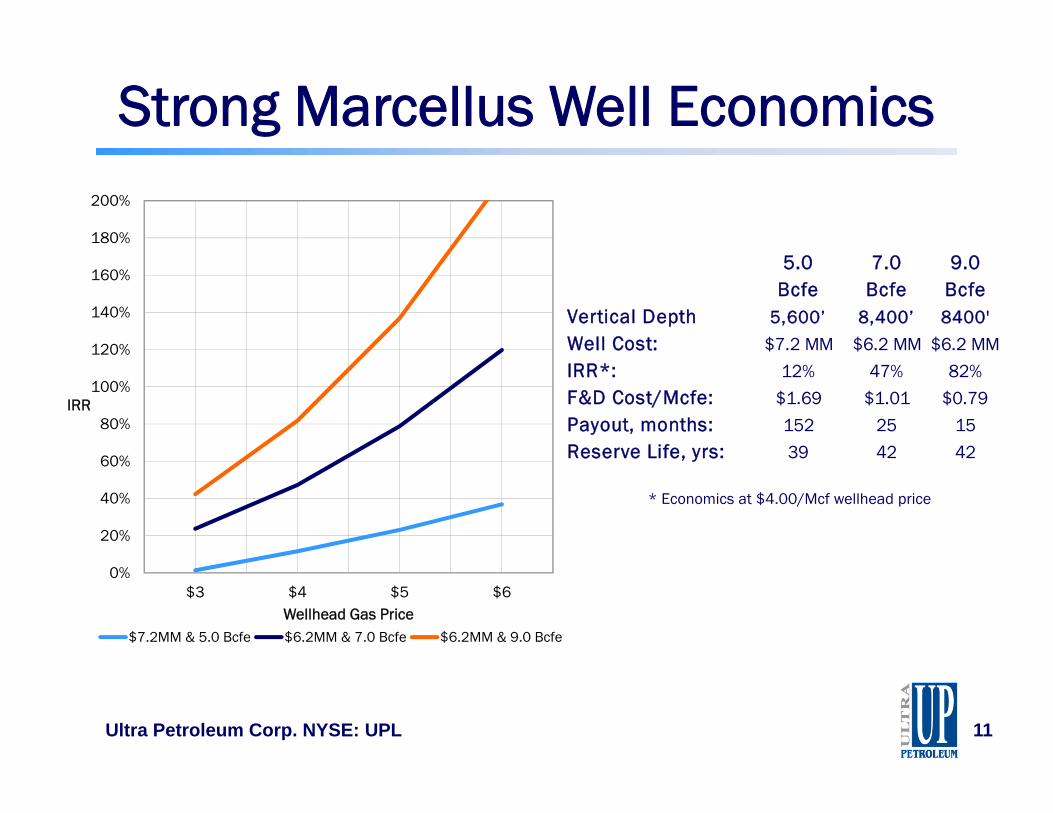
Vertical Depth 13,500’ 13,500’ 13,500’
Well Cost ($MM): $4.4 $4.4 $4.4
IRR*: 26% 44% 65%
F&D Cost/Mcfe: $1.35 $1.08 $0.90
Payout, months: 48 29 21
Reserve Life, yrs: 32 35 38
* Economics at $4.00/Mcf wellhead price0%
20%
40%
60%
80%
100%
120%
140%
160%
$3 $4 $5 $6
IRR
Wellhead Gas Price
6.0 Bcfe 5.0 Bcfe 4.0 Bcfe
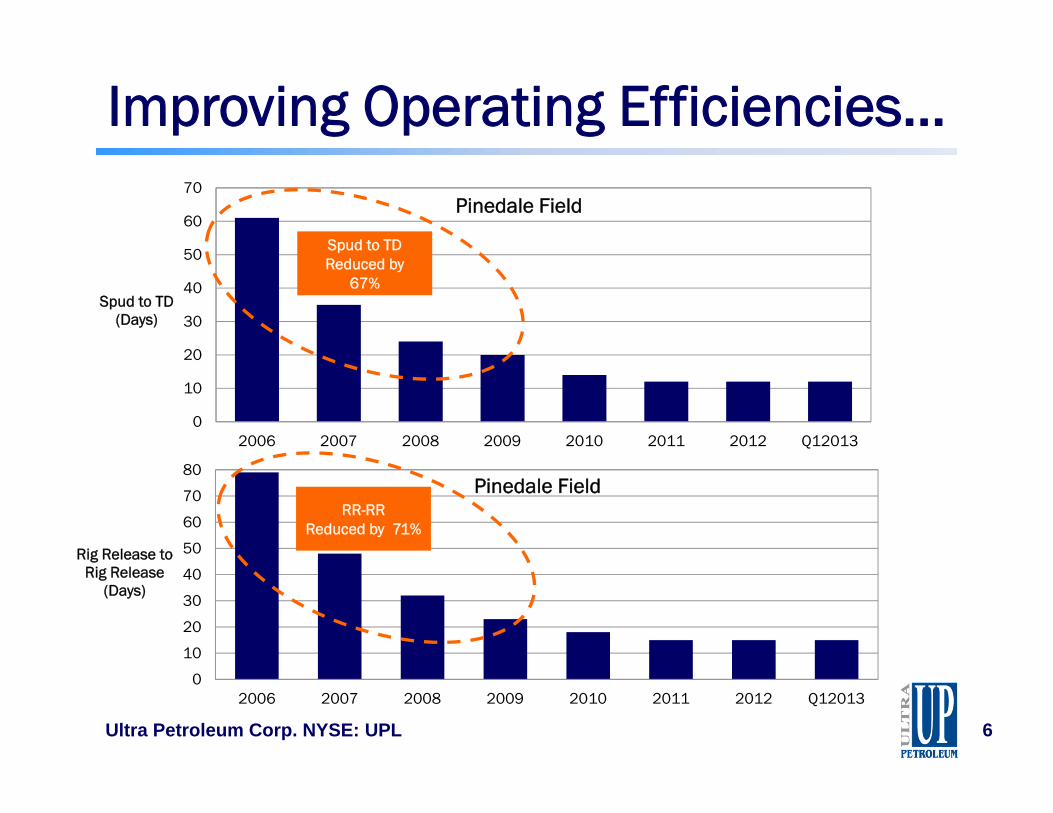
0
10
20
30
40
50
60
70
2006 2007 2008 2009 2010 2011 2012 Q12013
Spud to TD (Days)
Pinedale Field
0
10
20
30
40
50
60
70
80
2006 2007 2008 2009 2010 2011 2012 Q12013
Rig Release to Rig Release
(Days)
Pinedale Field
Improving Operating Efficiencies…
Ultra Petroleum Corp. NYSE: UPL 6
RR-RRReduced by 71%
Spud to TDReduced by
67%
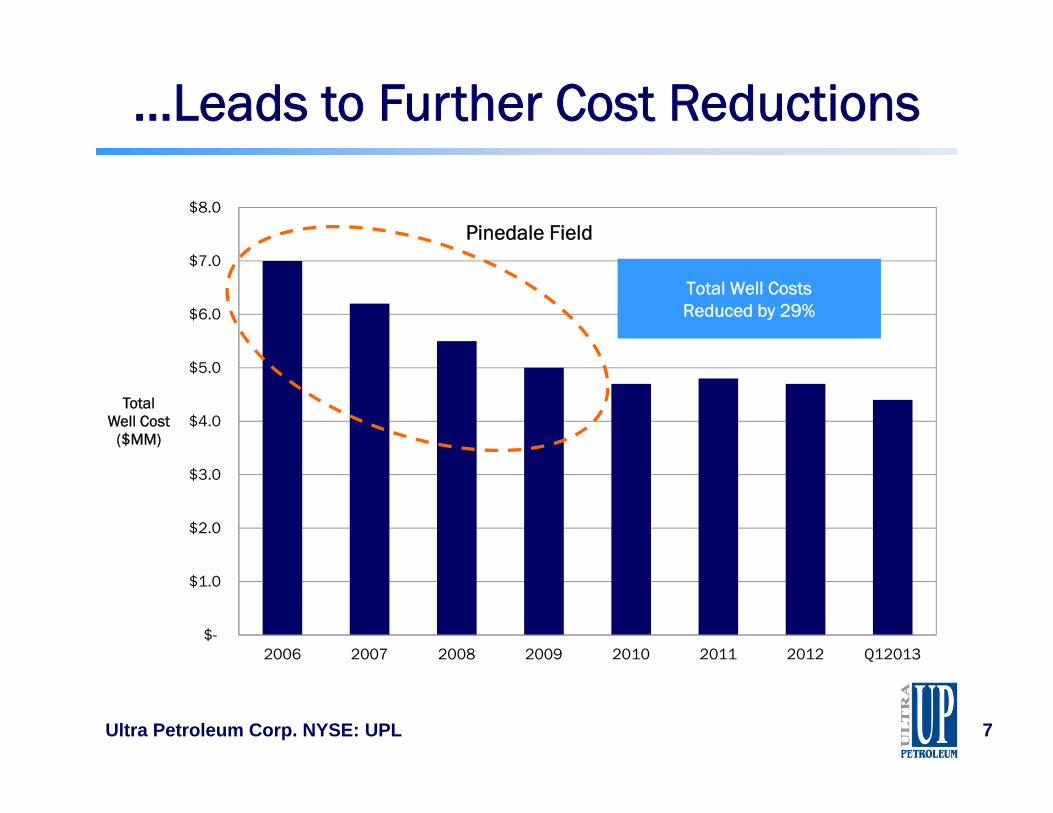
…Leads to Further Cost Reductions
Ultra Petroleum Corp. NYSE: UPL 7
$-
$1.0
$2.0
$3.0
$4.0
$5.0
$6.0
$7.0
$8.0
2006 2007 2008 2009 2010 2011 2012 Q12013
TotalWell Cost
($MM)
Pinedale Field
Total Well CostsReduced by 29%
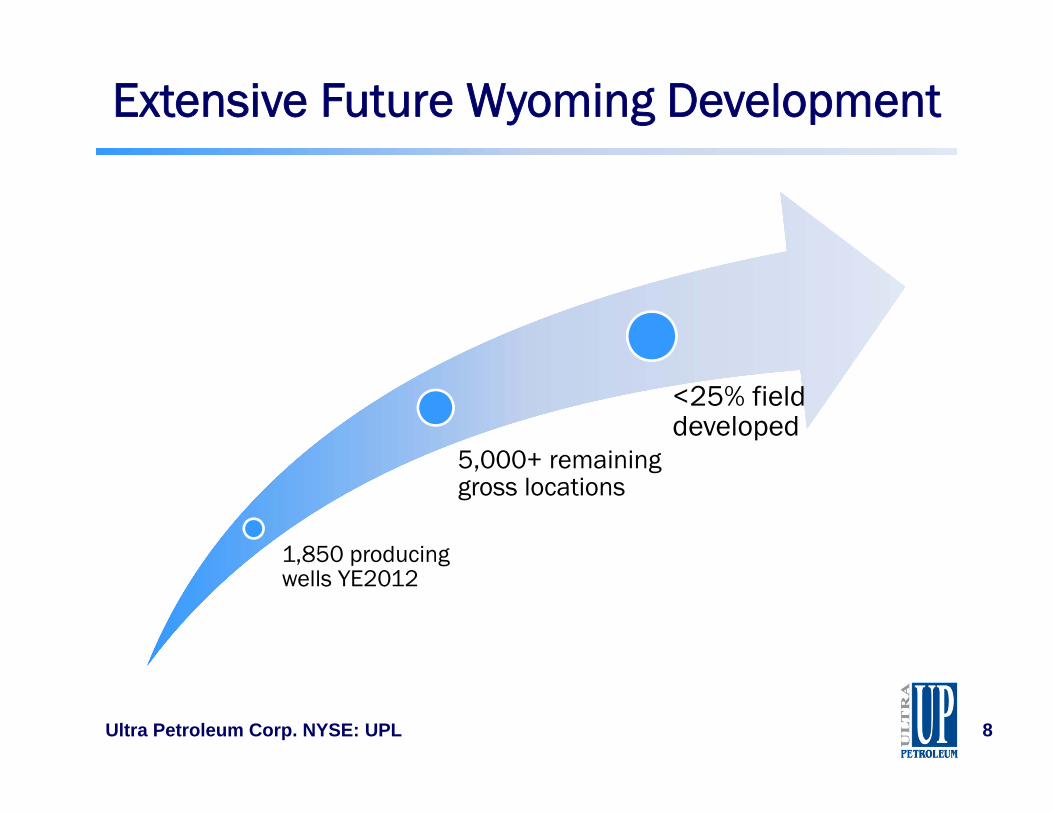
Extensive Future Wyoming Development
Ultra Petroleum Corp. NYSE: UPL 8
1,850 producing wells YE2012
5,000+ remaining gross locations
<25% field developed
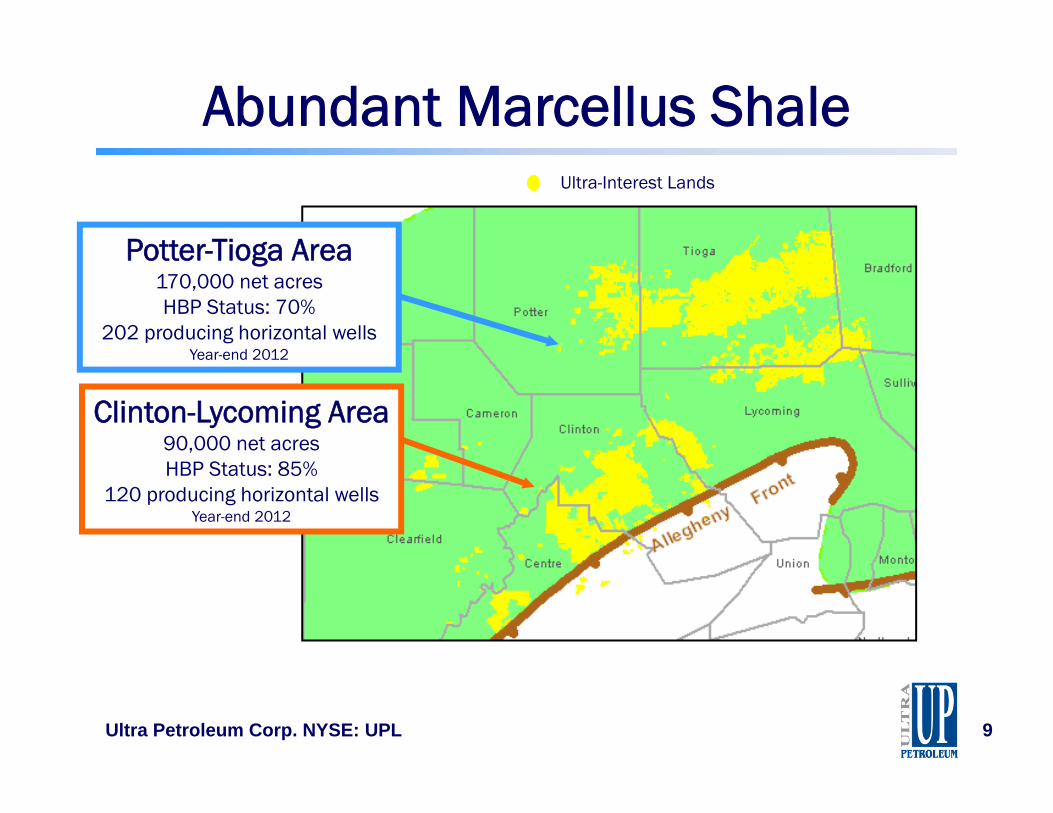
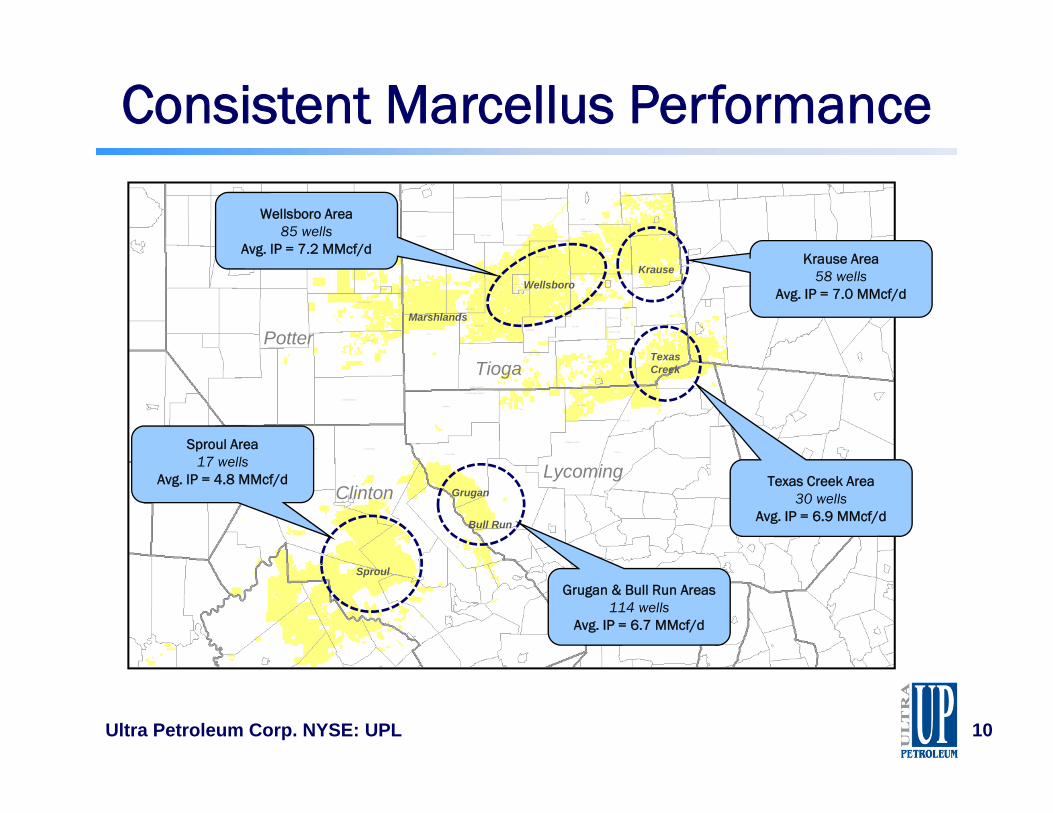
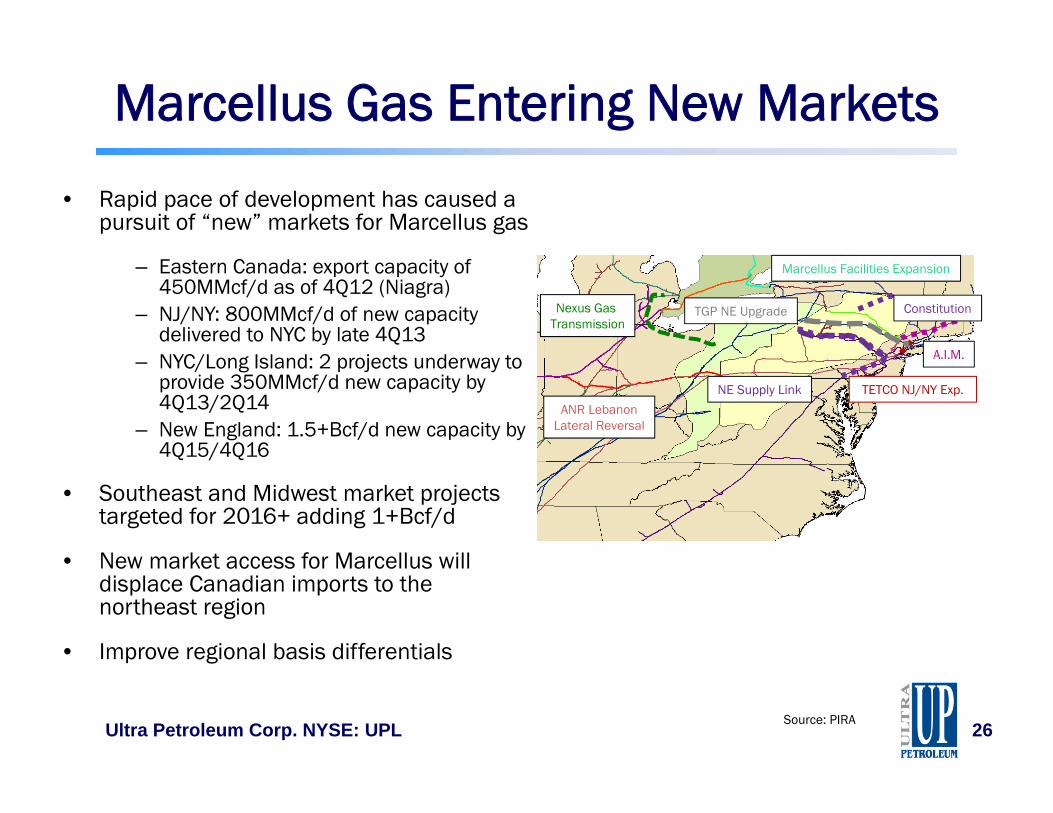
Abundant Marcellus Shale
Clinton-Lycoming Area90,000 net acresHBP Status: 85%
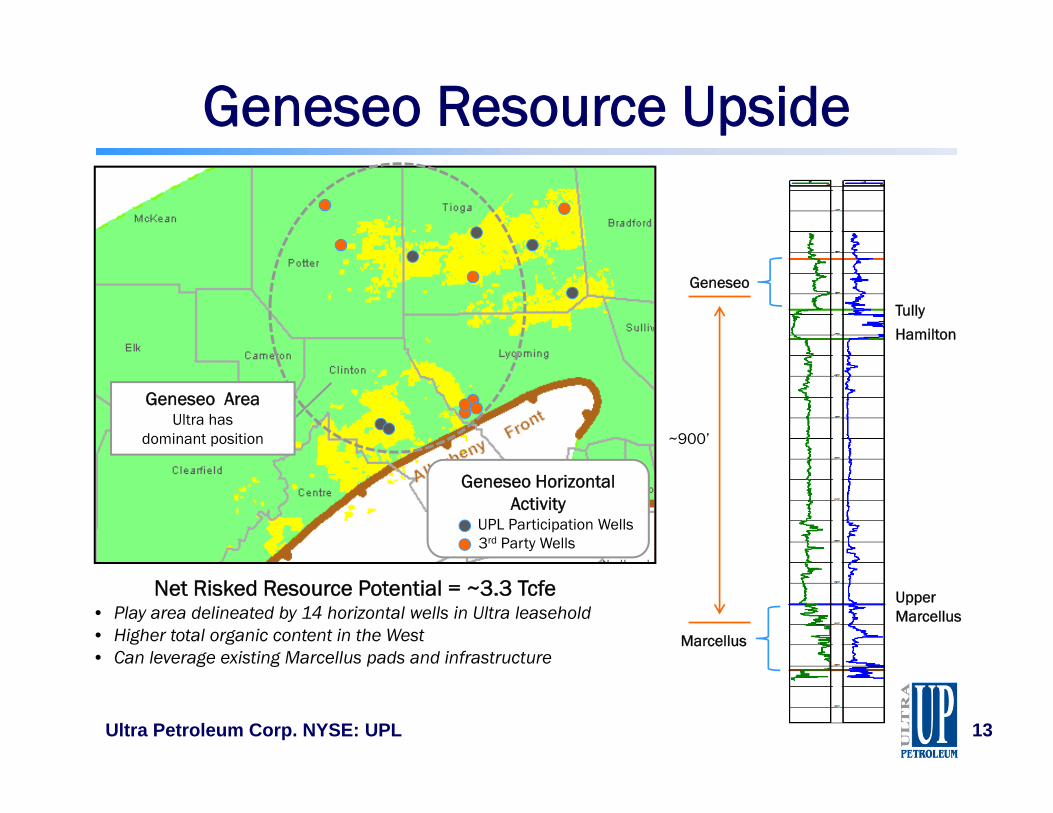
Net Risked Resource Potential = ~3.3 Tcfe• Play area delineated by 14 horizontal wells in Ultra leasehold• Higher total organic content in the West• Can leverage existing Marcellus pads and infrastructure
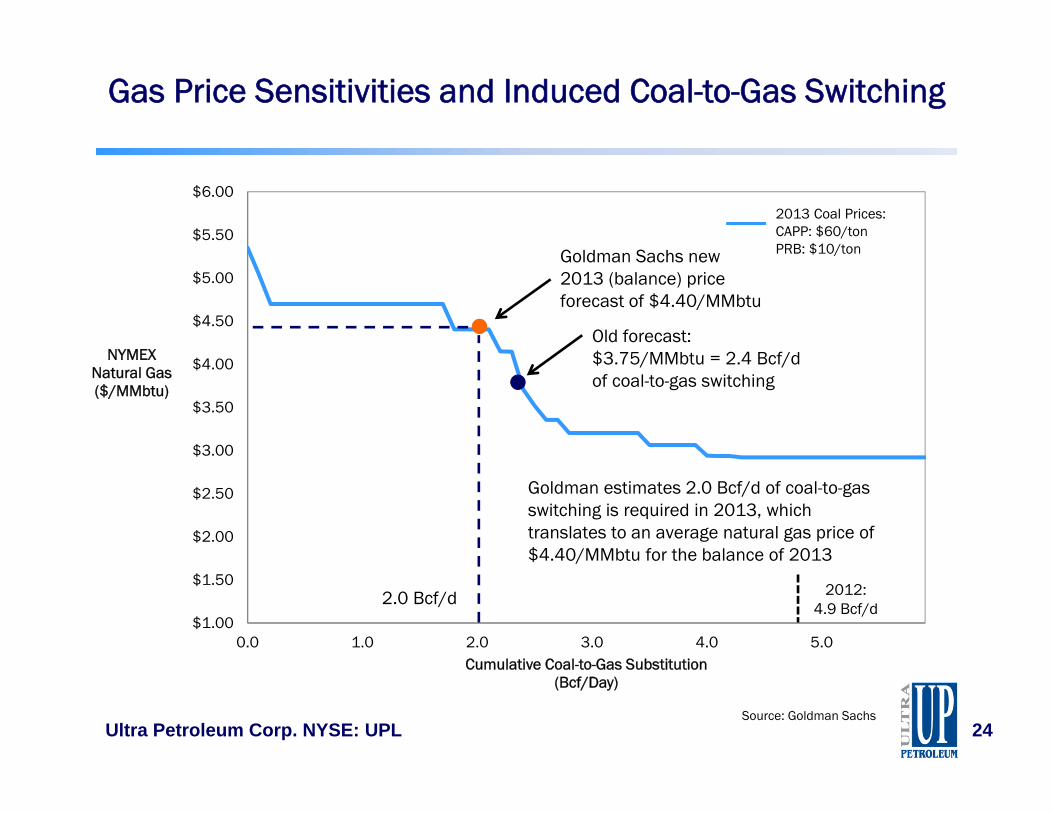
Gas Price Sensitivities and Induced Coal-to-Gas Switching
$1.00
$1.50
$2.00
$2.50
$3.00
$3.50
$4.00
$4.50
$5.00
$5.50
$6.00
0.0 1.0 2.0 3.0 4.0 5.0
NYMEX Natural Gas ($/MMbtu)
Cumulative Coal-to-Gas Substitution(Bcf/Day)
2.0 Bcf/d
Goldman estimates 2.0 Bcf/d of coal-to-gas switching is required in 2013, which translates to an average natural gas price of $4.40/MMbtu for the balance of 2013
2013 Coal Prices:CAPP: $60/tonPRB: $10/tonGoldman Sachs new
2013 (balance) price forecast of $4.40/MMbtu
2012: 4.9 Bcf/d
Old forecast: $3.75/MMbtu = 2.4 Bcf/d of coal-to-gas switching
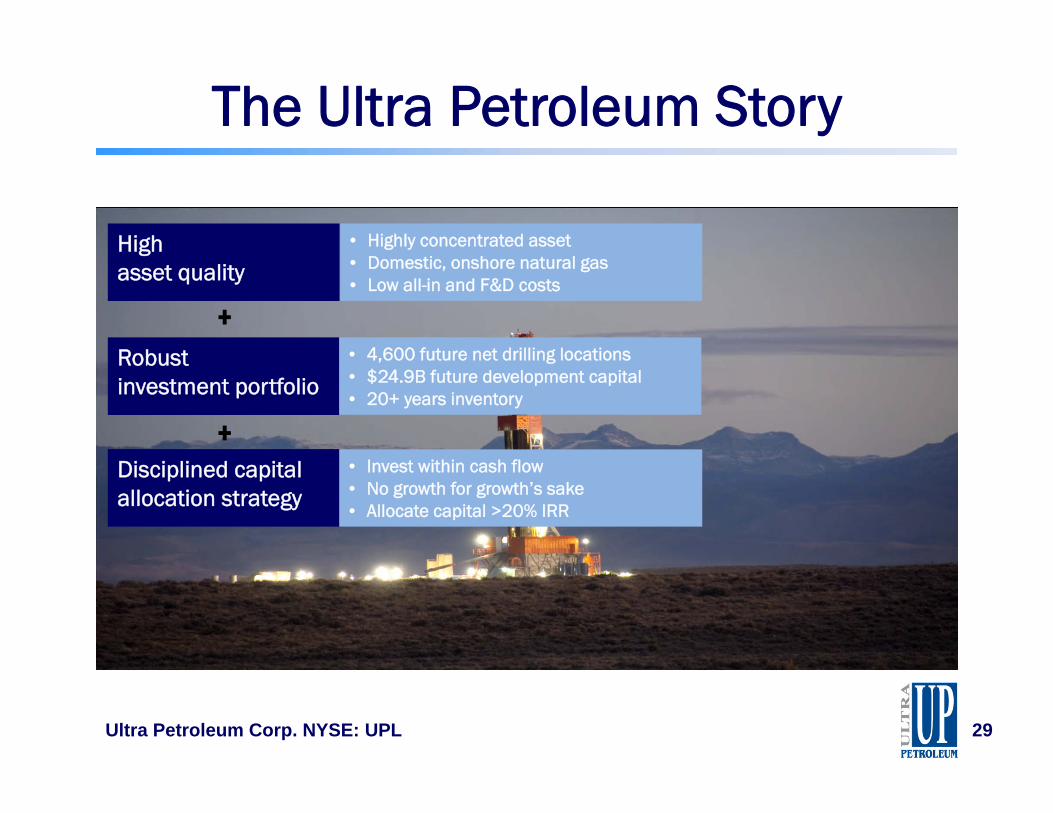
• Invest within cash flow• No growth for growth’s sake• Allocate capital >20% IRR
• 4,600 future net drilling locations• $24.9B future development capital• 20+ years inventory
Appendix
Ultra Petroleum Corp. NYSE: UPL 30
Production and Financial Guidance
Q2 2013 Guidance
• Q2 2013 estimated production– 57.0 – 59.0 Bcfe
• Q2 2013 realized pricing– Natural gas: 2 - 4% discount to NYMEX– Condensate: $7.00 discount to NYMEX
• Q2 2013 expense guidance– Assumes $4.11 per Mmbtu and $91.00 per Bbl– Total operating costs per Mcfe $2.85 - $3.01
Ultra Petroleum Corp. NYSE: UPL 31
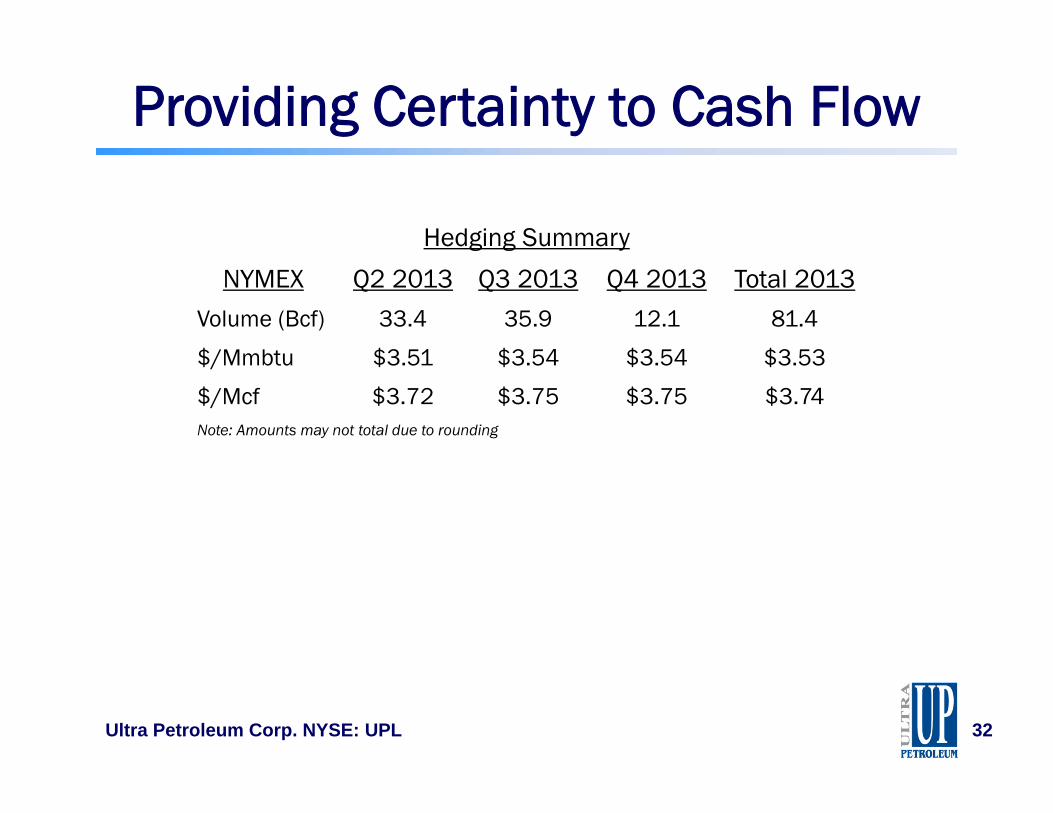
Providing Certainty to Cash Flow
Hedging Summary
NYMEX Q2 2013 Q3 2013 Q4 2013 Total 2013
Volume (Bcf) 33.4 35.9 12.1 81.4
$/Mmbtu $3.51 $3.54 $3.54 $3.53
$/Mcf $3.72 $3.75 $3.75 $3.74Note: Amounts may not total due to rounding
Ultra Petroleum Corp. NYSE: UPL 32
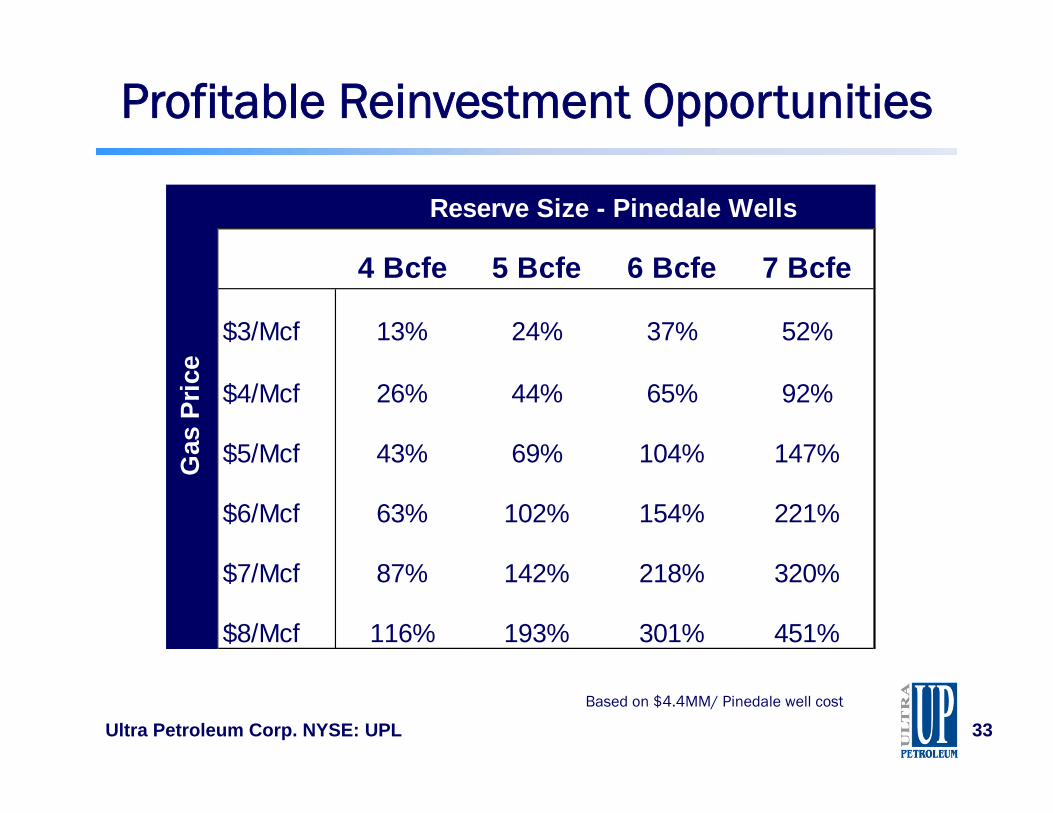
Profitable Reinvestment Opportunities
Ultra Petroleum Corp. NYSE: UPL 33Based on $4.4MM/ Pinedale well cost
4 Bcfe 5 Bcfe 6 Bcfe 7 Bcfe
$3/Mcf 13% 24% 37% 52%
$4/Mcf 26% 44% 65% 92%
$5/Mcf 43% 69% 104% 147%
$6/Mcf 63% 102% 154% 221%
$7/Mcf 87% 142% 218% 320%
$8/Mcf 116% 193% 301% 451%
Gas
Pric
eReserve Size - Pinedale Wells
Marcellus Technical Review Updates
• High-grading acreage to optimize returns– Utilizing seismic attributes to delineate resource sweet spots– Sweet spot EUR’s 2.5 times better than non-sweet spot– 944 sq-mi of UPL and partner 3D data (~70% of leasehold coverage)
• Studying correct well spacing – currently 110 acres per well– 6 increased density pilots completed and online– Development plan in one area downspaced to 750’
• Ongoing completion optimization– Evaluating stage count and frac volume reduction – Achieving comparable well performance with fewer stages
Actual Forecast Pipeline CapacitySource: Bentek Energy
Excess takeaway capacity ~4.3 Bcf/d
Ultra Petroleum Corp. NYSE: UPL 38
New Ventures Strategy
Ultra Petroleum Corp. NYSE: UPL 39
• Objectives:– Identify best geologic provinces and plays in North America– Develop detailed in-house familiarity with attractive plays– Identify entry points to plays of interest
• Focus on strategic / complementary fit– Targeting plays that leverage Ultra’s operational expertise– Prioritizing high ROR resource type plays– Focused on impact to existing returns in portfolio
Benefits of Using Natural Gas
• Domestic: Greater use of this clean, abundant, made–in-America energy source will create U.S. jobs and boost local economies, while advancing our national security
• Abundant: 2,543 Tcf of natural gas reserves and technically recoverable natural gas in the U.S. will power America for generations
• Clean: Represents the only clean energy option of adequate scale available today to start meaningful air quality improvements over the 10 years
• Jobs: Supported more than 2.8 million jobs in the U.S. in all 50 states
Ultra Petroleum Corp. NYSE: UPL 40
Innovative Employees • We value the multi-faceted skills and performance our talented
employees have to offer
• We have a unique, entrepreneurial, value-driven business culture
• We operate in a highly decentralized work environment where employees can see their projects come to fruition
• Responsibility and accountability go hand-in-hand for all employees at all levels; every employee is recognized for their contribution and performance
• All employees are challenged to deliver best-in-class results as normal everyday business practice
Ultra Petroleum Corp. NYSE: UPL 41
Safety and Environmental• We are committed to safe operations, and maintain high standards of
ethical conduct by employees, contractors and service providers
• We pursue our work with integrity and respect for the environment where we conduct our business
• We have established a leadership role in the development of industry best practices which is recognized by regulatory agencies
• We are active in incident management and response planning by working with local government and first responders to identify roles and responsibilities for a robust unified management approach to unique situations
• We are dedicated to maintain a safe and secure work environment for all our employees
Ultra Petroleum Corp. NYSE: UPL 42
Ultra Petroleum Corp.
• Market Data as of March 31, 2013Shares of Common Stock Outstanding: 152.9MM
• Investor ContactsKelly Whitley Julie DanversDirector, Investor Relations Manager, Investor Relations(281) 582-6602 (281) [email protected][email protected] presentation contains or incorporates by reference forward looking statements within the meaning of the federal securities laws. All statements otherthan statements of historical facts included in this document and other statements that include the words "believe", "expects", "anticipates", "intends","estimates", "projects", "target", "goal", "plans", "objective", "should", or similar words are forward looking statements and reflect the Company’s currentviews about future events and financial performance. No assurances can be given that such events or performance will occur as projected, and actualresults may differ materially from those projected.
Important factors that may cause actual results to differ from the forward-looking statements in this presentation include: increased competition; thetiming and extent of changes in prices for crude oil and natural gas; the timing and extent of discovery, development, production and estimation of oil andnatural gas reserves; the effects of weather and government regulation; the availability of oil field personnel and services and equipment; and other risksdetailed in the company’s SEC filings, particularly in its Annual Report on Form 10-K available from Ultra Petroleum Corp. at 400 North Sam HoustonParkway E., Suite 1200, Houston, TX 77060 (Attention: Investor Relations). You can also obtain this information from the SEC by calling 1-800-SEC-0330 orfrom the SEC’s website at www.sec.gov.
This presentation contains certain non-GAAP financial measures. Reconciliation and calculation schedules for the non-GAAP financial measures can befound on our website at www.ultrapetroleum.com.
SEC guidelines prohibit descriptions of potential reserves in filings with the SEC. We use the terms reserve “potential” or “upside” or other descriptions ofvolumes of reserves or resource that are potentially recoverable through additional drilling or recovery techniques that the SEC’s guidelines may prohibitus from including in filings with the SEC. These estimates are by their nature more speculative than estimates of proved reserves and accordingly aresubject to substantially greater risk of being actually realized by the Company.