1 Ultrafast response of plasma-like reflectivity edge in (TMTTF)2AsF6 driven by 7-fs, 1.5-cycle strong-light field Y. Naitoh 1 , Y. Kawakami 1 , T. Ishikawa 1 , Y. Sagae 1 , H. Itoh 1 , K. Yamamoto 2 , T. Sasaki 3 , M. Dressel 4 , S. Ishihara 1 , Y. Tanaka 5 , K. Yonemitsu 5 , and S. Iwai 1* 1 Department of Physics, Tohoku University, Sendai 980-8578, Japan 2 Department of Applied Physics, Okayama Science University, Okayama, 700-0005 Japan 3 Institute for Materials Research, Tohoku University, Sendai 980-8577, Japan 4 1. Physikalisches Institut, Universität Stuttgart, 70569, Stuttgart, Germany 5 Department of Physics, Chuo University, Tokyo 112-8551, Japan 71.27.+a, 75.30.Wx, 78.47.jg *[email protected]
Transcript
1
Ultrafast response of plasma-like reflectivity edge in
(TMTTF)2AsF6 driven by 7-fs, 1.5-cycle strong-light field
Y. Naitoh1, Y. Kawakami1, T. Ishikawa1, Y. Sagae1, H. Itoh1, K. Yamamoto2,
T. Sasaki3, M. Dressel4, S. Ishihara1, Y. Tanaka5, K. Yonemitsu5, and S. Iwai1*
1Department of Physics, Tohoku University, Sendai 980-8578, Japan
2Department of Applied Physics, Okayama Science University, Okayama, 700-0005
Japan
3Institute for Materials Research, Tohoku University, Sendai 980-8577, Japan
4 1. Physikalisches Institut, Universität Stuttgart, 70569, Stuttgart, Germany
5Department of Physics, Chuo University, Tokyo 112-8551, Japan
annihilation operator of a hole on the i th site with spin s, sss iii ccn +=, , and
å=s
s,ii nn . This model has on-site (U) and nearest-neighbor (V) repulsive
12
interactions and alternating transfer integrals ( , , , , 21211, ttttt ii =+ ). We use an
exact diagonalization method for the 16-site chain with the anti-periodic
boundary condition, and set 16.01 =t eV and 2.02 =t eV [21], which were
evaluated using first-principles band calculations. By numerically solving
the time-dependent Schrödinger equation after the photoirradiation of a
monocycle pulse with central frequency w = 0.7 eV and 1=weaF (a:
lattice spacing, F: field amplitude), we calculate the change in the electronic
structures.
We actually calculated six-lattice-spacing-distant off-diagonal density,
å ++ +-s
ssss 0660 cccc , as an index of the delocalized nature of the charges (or
equivalently the increase in m), by assuming that the molecules are
equidistant. We plot the time evolution of this density in Fig. 6. In the
noninteracting case of U=V=0 (black line), the density simply oscillates and is
almost undamped. The oscillation period corresponds to the charge
excitation energy ~ 22
212 tt + for small U. For large U, a dimerization gap of ~
( )2 12 t t- appears and is dominant [20]. With increasing U and V (red and
blue lines), the density is damped or more strongly suppressed. The time
average is reduced with increasing field amplitude F and interaction
strengths U and V (not shown). In other words, the field-induced suppression
of the electronic motion is enhanced by the interactions[22]. The damped
oscillation for intermediate (U/t2, V/t2) = (1.0, 0.55) (red line) [23] is similar to
the experimentally observed behavior of the plasma frequency. Moreover, the
oscillation period shown in Fig. 6 is ~2.5 times shorter than that for the time
13
profile of wp in Fig. 3(b). This comes from the fact that the calculated
excitation energy ~ 2 21 22 t t+ (using t1 and t2 from first-principles band
calculations for small U) is 2.5 times larger than the observed gap, which is
attributed to the dimerization gap ~ ( )2 12 t t- for more realistic U.
VII. Summary
A ~3% reduction in pw , reflecting a ~6% increase in m is induced by a 9.8
MV/cm instantaneous field in the organic conductor (TMTTF)2AsF6. The
coherent modulation of wp with a period of 20 fs indicates that wp is affected
by the lower energy gap nature. According to theoretical calculations, the
contribution from the Coulomb repulsion plays an important role in the
increase in m.
14
References
[1] D. N. Basov, R. D. Averitt, D. van der Marel, M. Dressel, and K. Haule,
Rev. Mod. Phys. 83, 471 (2011).
[2] S. Koshihara, and M. Kuwata-Gonokami (eds.) J. Phys. Soc. Jpn. 75,
011001-011008 (2006).
[3] K. Yonemitsu and K. Nasu, Phys. Rep. 465, 1 (2008).
[4] H. Aoki, N. Tsuji, M. Eckstein, M. Kollar, T. Oka, P. Werner, Rev. Mod.
Phys. 86, 780 (2014).
[5] D. H. Dunlap and V. M. Kenkre, Phys. Rev. B34, 3625 (1986).
[6] F. Grossmann, T. Dittrich, P. Jung, and P. Hanggi, Phys. Rev. Lett. 67, 516
(1991)
[7] Y. Kayanuma, and K. Saito, Phys. Rev. A77, 010101(R) (2008).
[8] K. Nishioka and K. Yonemitsu, J. Phys. Soc. Jpn. 83, 024706 (2014).
[9] K. Yonemitsu and K. Nishioka, J. Phys. Soc. Jpn. 84, 054702(2015).
[10] T. Ishikawa, Y. Sagae, Y. Naitoh, Y. Kawakami, H. Itoh, K. Yamamoto,
K. Yakushi, H. Kishida, T. Sasaki, S. Ishihara, Y. Tanaka, K. Yonemitsu and
S. Iwai, Nat. Commun. 5, 5528 (2014).
[11] T. Ishiguro, K. Yamaji, and G. Saito, Organic Superconductors,
(Springer, New York, 1998).
[12] C. S. Jacobsen, D. B. Tanner, and K. Bechgaard, Phys. Rev. B28, 7019
(1983).
[13] L. Balicas, K. Behnia, W. Kang, E. Canadell, P. Auban-Senzier, D.
Jerome, M. Ribault, and J. M. Fabre, J. Phys. I France, 4, 1539 (1994).
15
[14] A. Pashkin, M. Dressel, and C. A. Kuntscher, Phys. Rev. B74,
165118(2006).
[15] M. Dressel, M. Dumm, T. Knoblanch, and M. Masino, Crystals 2, 528
(2012).
[16] P. Monceau, F. Nad, S. Brazovskii, Phys. Rev. Lett. 86, 4080 (2001).
[17] M. Dressel and G. Gruner, Electrodynamics of Solids, (Cambridge
University Press, Cambridge, 2002 )
[18] Supplemental Material of this paper.
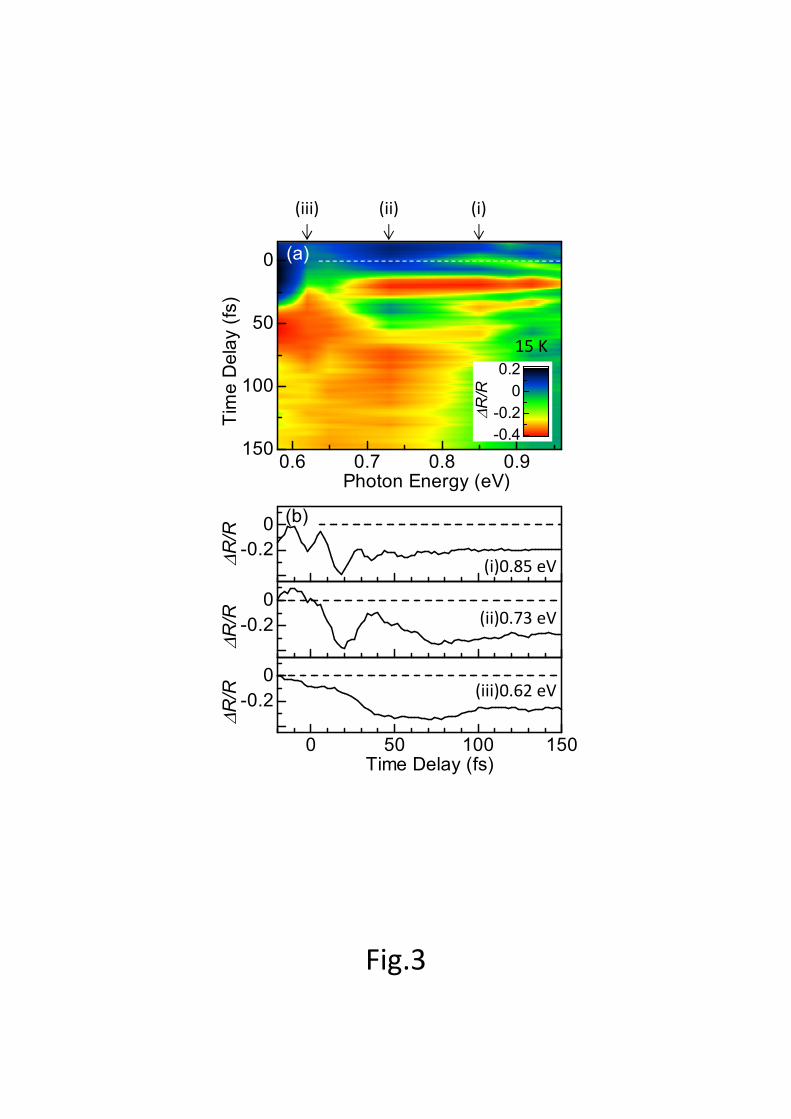
[19] /p pw wD has a large spectral component at 0.65-0.9 eV as shown in Fig.
2(c). So, the 20 fs oscillation should be detected all over this spectral area.
However, we also have the spectral dip at ~0.7 eV for td~30-60 fs which is
attributable to the interaction between the oscillating charges with
frequency pw and other charges and/or lattice modes. The spectral overlap
between the components of /p pw wD and the spectral dip results in the
absence of the 20 fs oscillation in 0.65-0.8 eV. In fact, /R RD was not
reproduced well for td~30-60 fs.
[20] J. Favand and F. Mila, Phys. Rev. B54, 10425(1996).
[21] K. Yoshimi, H. Seo, S. Ishibashi, and S. Brown, Phys. Rev. Lett.108,
096402 (2012).
[22] This is similar to the fact that the time -averaged double occupancy is
reduced by the (not too large) field amplitude and U in reference [9].
16
[23] The nearest-neighbor repulsive interaction V is regarded as an effective
one, to which intrachain and interchain intersite repulsive interactions
contribute.
17
Figure captions
Fig.1 (a) Optical conductivity (s ) spectra of (TMTTF)2AsF6 at 25 K and 150
K. The spectrum of the 7-fs pulse (orange shaded area) is also shown. (b)
Reflectivity (R) spectra at 25 K and 150 K with the Lorentz analysis (solid
lines). Inset shows the temperature dependence of /g gD .
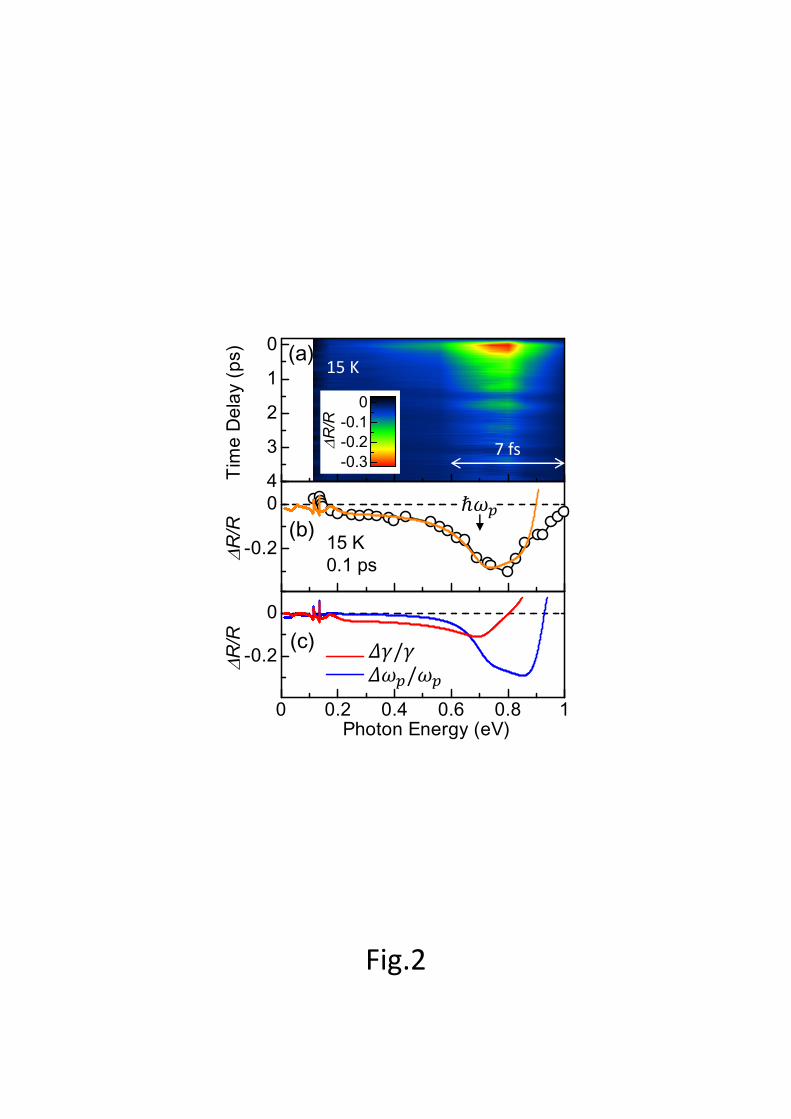
Fig. 2 (a) Time evolution of the transient reflectivity (DR/R) at td < 4 ps
measured by a 100-fs pulse. (b) DR/R spectrum at td = 0.1 ps with the Lorentz
analysis (solid line). (c) Spectral change calculated with only decreasing pw
(1.8%) (blue) and that with only increasing g (12%)(red). A 11% increase in
the width of the vibrational peak at 0.165 eV [18] is taken into account.
Fig. 3 (a) Time evolution of DR/R at td < 150 fs measured by a 7-fs pulse. (b)
Time evolutions of DR/R measured at i) 0.85, ii) 0.73, and iii) 0.62 eV.
Fig. 4 DR/R spectra at various time delays td = 0–80 fs are shown as the
circles. The blue-dashed, red-dashed, and orange curves indicate the
calculated spectral change using the Lorentz model (orange), the spectral
change calculated with only /p pw w-D (blue-dashed) and that with only
/g gD (red-dashed). The arrows indicate pw .
18
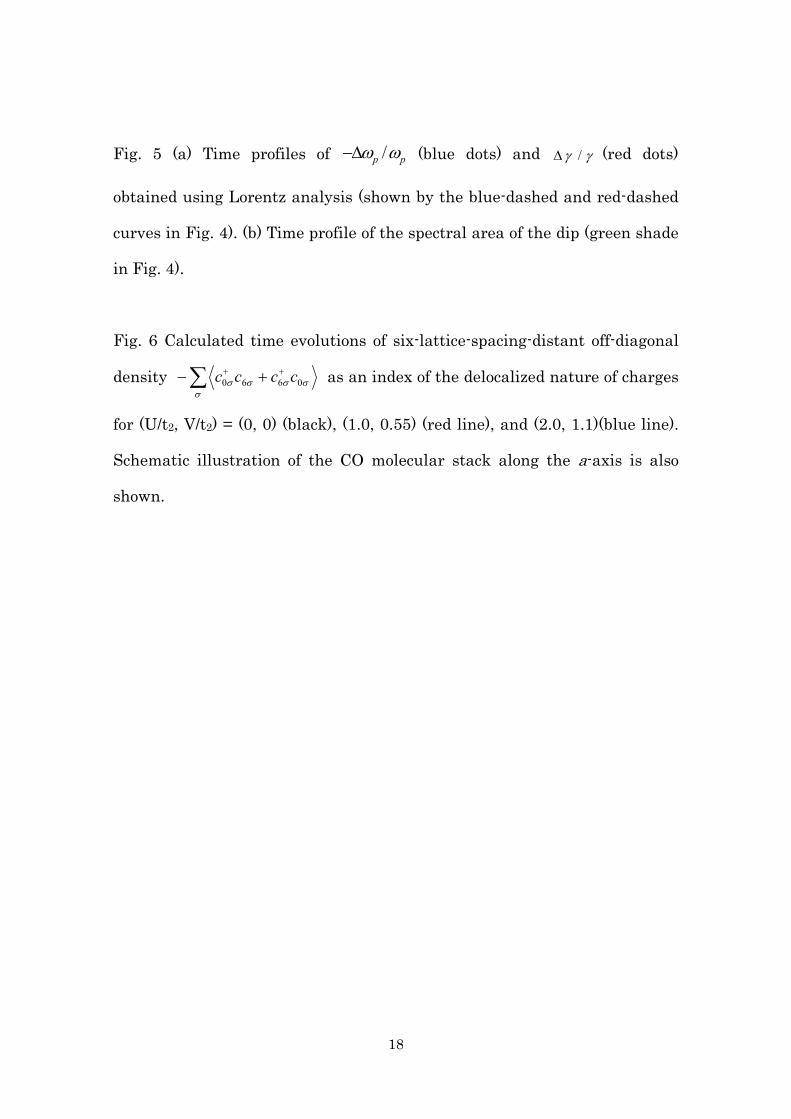
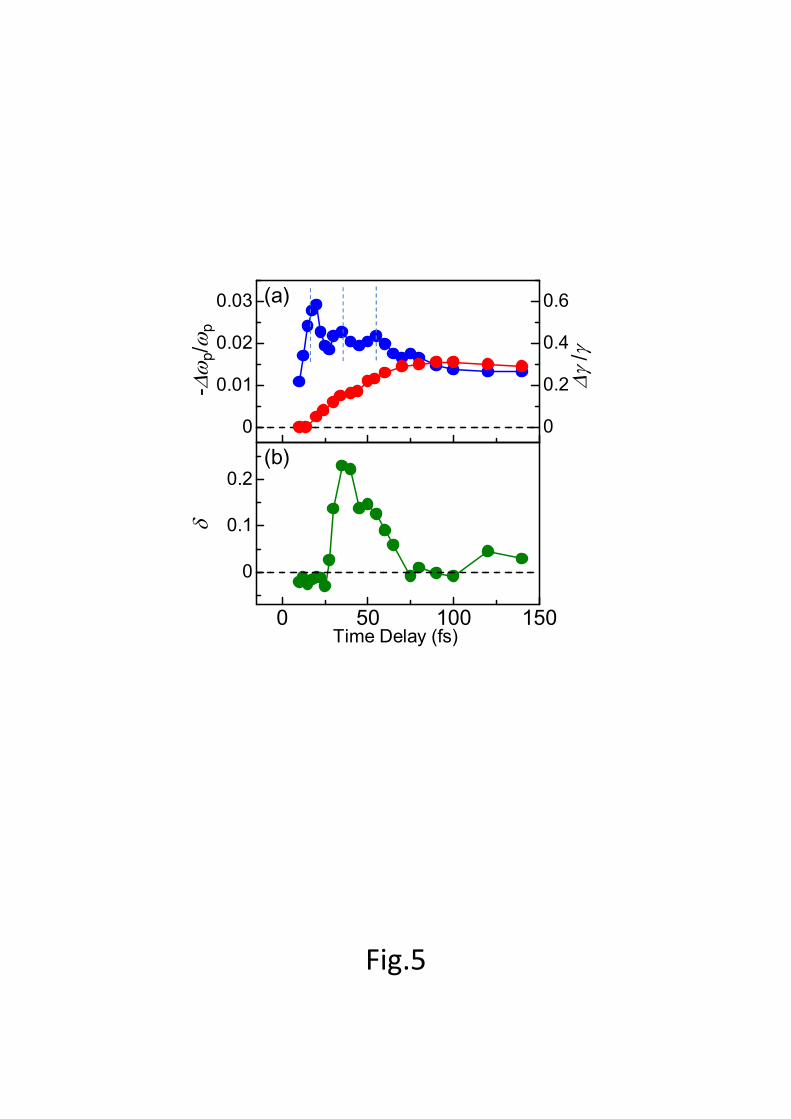
Fig. 5 (a) Time profiles of /p pw w-D (blue dots) and /g gD (red dots)
obtained using Lorentz analysis (shown by the blue-dashed and red-dashed
curves in Fig. 4). (b) Time profile of the spectral area of the dip (green shade
in Fig. 4).
Fig. 6 Calculated time evolutions of six-lattice-spacing-distant off-diagonal
density å ++ +-s
ssss 0660 cccc as an index of the delocalized nature of charges
for (U/t2, V/t2) = (0, 0) (black), (1.0, 0.55) (red line), and (2.0, 1.1)(blue line).
Schematic illustration of the CO molecular stack along the a-axis is also
shown.
012
(x10
3 W-1
cm-1
)
25 K150 K
s(w
)
0 0.2 0.4 0.6 0.8 10
1R
Photon Energy (eV)
0 100 2000
0.4
Temp. (K)
Dg /
g
Fig.1
(b)
(a) x2
150 K
25 K
0
1
2
3
4Tim
e D
elay
(ps)
-0.2
0
DR/R
0 0.2 0.4 0.6 0.8 1
-0.2
0
Photon Energy (eV)
DR/R
Fig.2
(a)
-0.3-0.2-0.1
0
DR/R
15 K0.1 ps
7 fs
(b)ℏ
(c) / /
15 K
0 50 100 150
-0.20
Time Delay (fs)
DR/R
-0.20
DR/R
-0.20
DR/R
0.6 0.7 0.8 0.9
0
50
100
150
Photon Energy (eV)
Tim
e D
elay
(fs)
(b)
(i)0.85 eV
(ii)0.73 eV
(iii)0.62 eV
(a)
(i)
Fig.3
-0.4-0.2
00.2
DR/R
(ii)(iii)
15 K
-0.4-0.2
0
-0.4-0.2
0
0.4 0.6 0.8 1-0.4-0.2
0
-0.4-0.2
00.2
DR/R
-0.4-0.2
0
DR/R
0.4 0.6 0.8 1-0.4-0.2
0
DR/R
35 fs
(b)
(a)
(e)
(c) (f)
Fig.4
(d)
18 fs
25 fs
Photon Energy (eV)
12 fs
50 fs
80 fs
0
0.01
0.02
0.03
0
0.2
0.4
0.6
-Dw
p/wp
Dg /g
0 50 100 150
0
0.1
0.2
d
Time Delay (fs)
Fig.5
(b)
(a)
0 25 50 750
0.1
0.2
0.3
0.4
0.5
Time Delay (fs)
(0,0)
−
+
Fig.6
(U/t2,V/t2)=
(1.0, 0.55)(2.0, 1.1)
Supplementary Material for
“Ultrafast response of plasma-like reflectivity edge in
(TMTTF)2AsF6 driven by 7-fs, 1.5-cycle strong-light field”
Y. Naitoh1, Y. Kawakami1, T. Ishikawa1, Y. Sagae1, H. Itoh1, K. Yamamoto2,
T. Sasaki3, M. Dressel4, S. Ishihara1, Y. Tanaka5, K. Yonemitsu5, and S. Iwai1*
Here, we provide additional details regarding the temperature dependence of the steady state reflectivity and the spectral analysis using the Drude-Lorentz model. We also show the transient reflectivity DR spectrum instead of DR/R to consider the accuracy of the data when the value of R is
very small. Furthermore, the accuracy of the fitting parameter /p pw wD for
the transient reflectivity is described to show that the uncertainty is much
lower than the field-induced change in /p pw wD of ~3%. The reproducibility
of DR/R is also shown.
Steady state reflectivity and analysis
Reflectivity spectra for TMTTF salts have been measured and analyzed
using the Drude–Lorentz model for >30 years [1-3]. In these compounds, the
reflectivity spectrum has an edge that is analogous to the plasma-edge in
Drude metals. This reflectivity edge in the near-infrared region has been
characterized by ( )20/p ne mw e e¥= in the Lorentz model, if 0w is much
smaller than pw (the number of charges in the 1/4 filling-band n : ~2 x
1021cm-3 and their mass m : 3~4m0, dielectric constants for high-frequency
and vacuum 0,e e¥ , charge gap 0w : ~0.2 eV).
On the other hand, a Raman active C=C vibration becomes infrared active in
the low energy (< 0.2 eV) reflectivity spectrum, because of symmetry
breaking induced by the electron-molecular vibrational (EMV) coupling. We
consider the Fano interference between the electronic transition and this
vibrational transition by the dimer model [1]. However, in Fig. 1(b) in the
main text, we noticed a disagreement between the observed spectrum and
the calculated spectrum for the vibrational region (0.1-0.2 eV) at 25 K,
although the disagreement becomes smaller at 150 K. Since such vibrational
response at room temperature has been well reproduced previously by this
dimer model [1], a possible explanation for the disagreement at low
temperatures is the screening of the vibrational peaks by the charge motion
driven by the ~0.1 eV AC field of mid infrared light. Here, we describe in
further detail the temperature dependence of the steady state reflectivity
and the analysis using the Lorentz model, and show that these spectral
features at < 0.2 eV do not considerably affect the higher energy region
around pw ~0.7 eV.
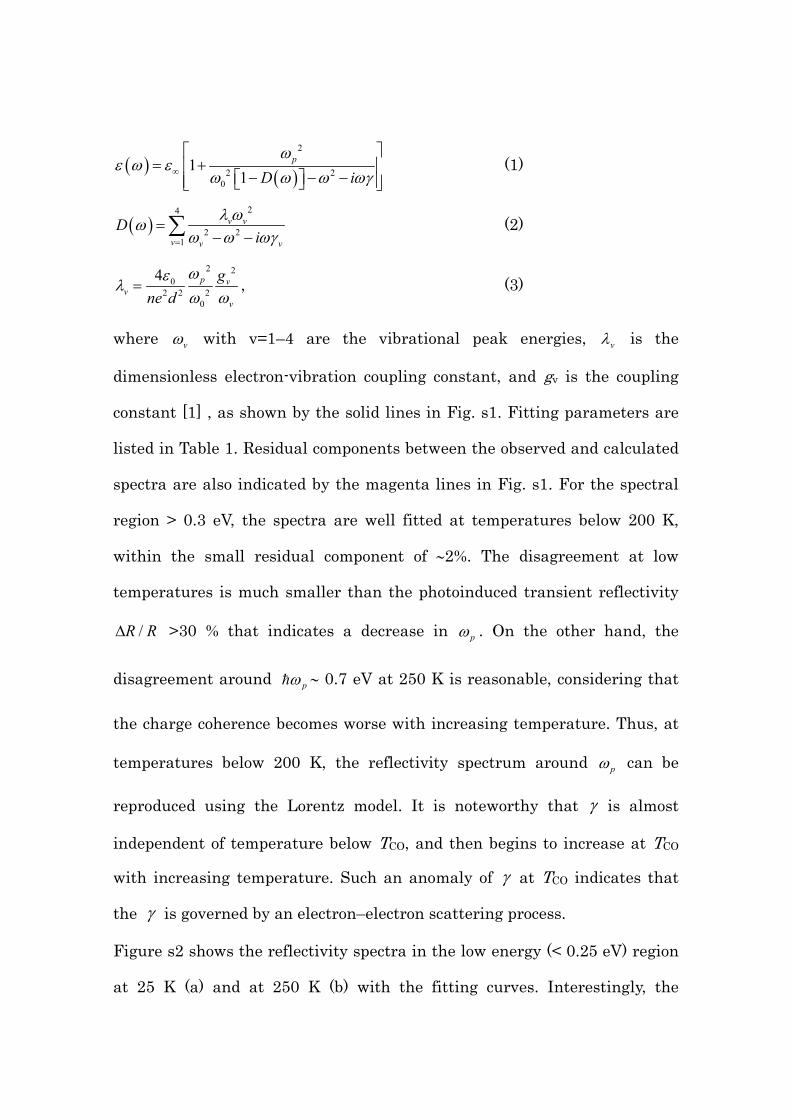
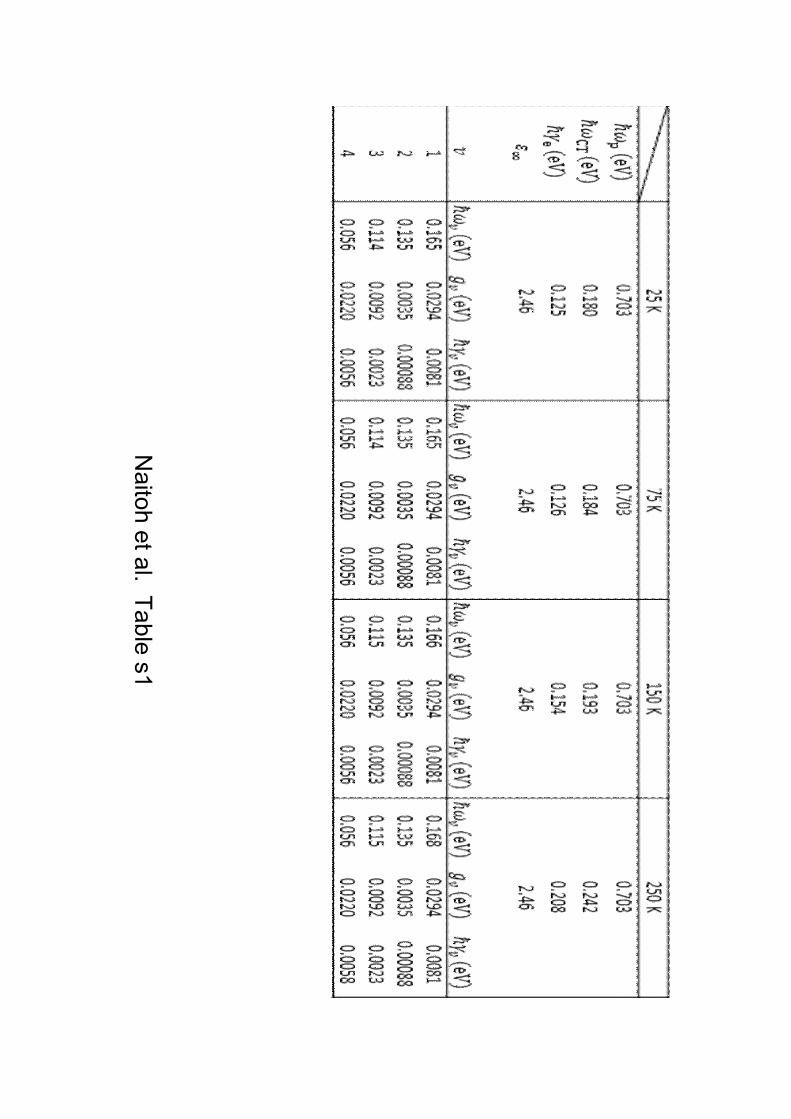
Figure s1 shows the reflectivity at 25, 75, 150, and 250 K. On the basis of
the dimer model [1], as described above, the reflectivity spectra can be
calculated within the framework of Lorentz analysis considering the
coupling with intramolecular vibrations as Eqs.(1) – (3).
( ) ( )
2
2 20
11
p
D iw
e w ew w w wg¥
é ù= +ê ú
- - -é ùê úë ûë û (1)
( )24
2 21
v v
v v v
Di
l www w wg=
=- -å (2)
2 20
2 2 20
4 p vv
v
gne d
wel
w w= , (3)
where vw with v=1–4 are the vibrational peak energies, vl is the
dimensionless electron-vibration coupling constant, and gv is the coupling
constant [1] , as shown by the solid lines in Fig. s1. Fitting parameters are
listed in Table 1. Residual components between the observed and calculated
spectra are also indicated by the magenta lines in Fig. s1. For the spectral
region > 0.3 eV, the spectra are well fitted at temperatures below 200 K,
within the small residual component of ~2%. The disagreement at low
temperatures is much smaller than the photoinduced transient reflectivity
/R RD >30 % that indicates a decrease in pw . On the other hand, the
disagreement around pw ~ 0.7 eV at 250 K is reasonable, considering that
the charge coherence becomes worse with increasing temperature. Thus, at
temperatures below 200 K, the reflectivity spectrum around pw can be
reproduced using the Lorentz model. It is noteworthy that g is almost
independent of temperature below TCO, and then begins to increase at TCO
with increasing temperature. Such an anomaly of g at TCO indicates that
the g is governed by an electron–electron scattering process.
Figure s2 shows the reflectivity spectra in the low energy (< 0.25 eV) region
at 25 K (a) and at 250 K (b) with the fitting curves. Interestingly, the
vibrational peaks are clearer at 250 K than at 25 K. Such suppression of the
vibrational peaks at low temperatures is in contrast to the well-known
temperature dependence governed by phonon–phonon and/or
electron–phonon scatterings. Furthermore, the vibrational peaks can be
better fitted at 250 K than at 25 K , i.e., the disagreement clearly becomes
larger at low temperatures for this region. This feature along with the high
reflectivity of ~0.75 at < 0.15 eV, suggests that the vibrational responses are
screened by the charge motion driven by the AC field with 0.1 -0.2 eV.
However, as described in the main text, the parameters 0w , vw , vg , and g
reflecting the low energy (< 0.2 eV) spectrum, do not considerably affect the
spectrum around pw (~0.7 eV), which is justified by the fact that 0 pw w<< ,
v pw w<< . Therefore, we can discuss the spectral changes at higher energy (>
0.5 eV) by the parameters pw and g in Eq. 1.
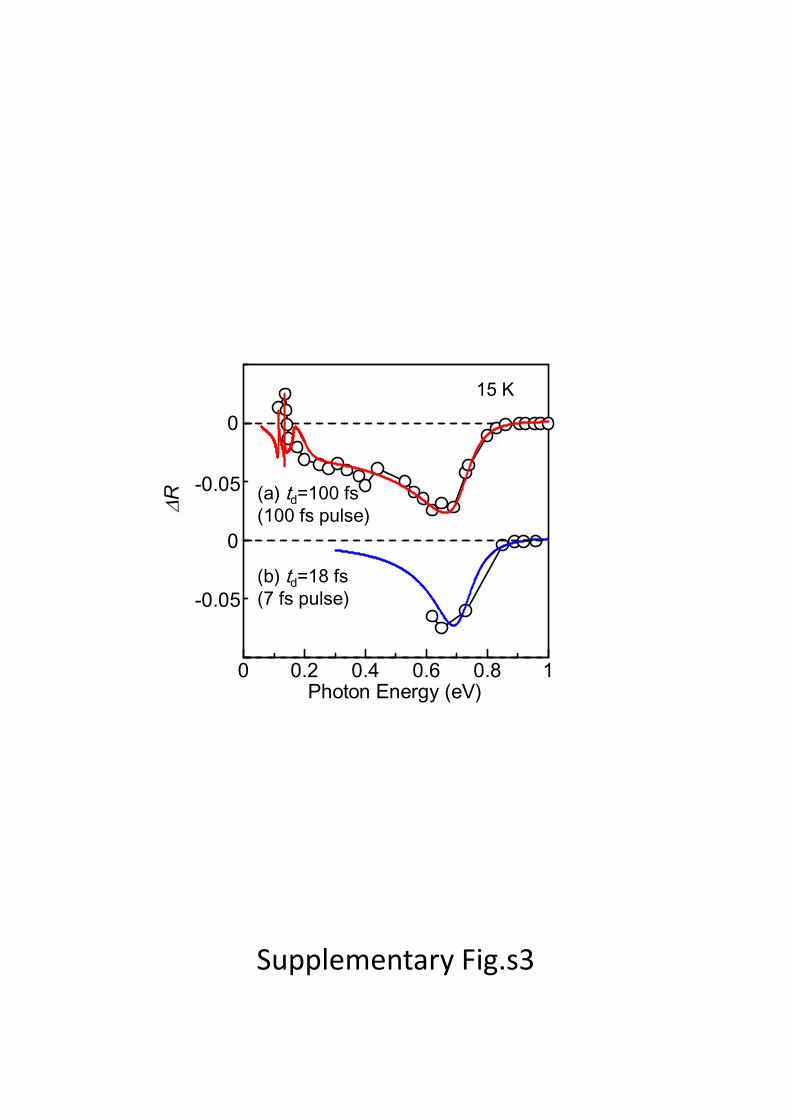
Indication of the transient reflectivity by DR , instead of DR/R .
In Figs. 2–4 of the main text, we have shown the transient reflectivity
spectrum as DR/R, which is generally used. However, in this case, the steady
state reflectivity at > 0.85 eV is very small, as shown in Fig. 1(b). In that
spectral region, DR/R becomes large, even if DR is very small. Here, we
discuss the transient reflectivity on the basis of DR, instead of DR/R . Figures
s3(a) and s3(b) show the DR measured at td =100 fs after the excitation by the
100-fs pulse and at td =18 fs after the excitation by the 7-fs pulse. In the DR
spectrum shown in Fig. s3(a), the spectral structure between 0.1 and 0.2 eV
becomes more prominent. This can be reproduced by the analysis shown by
the red curve. According to this analysis, the reflectivity increase in the low
energy region can be explained by the changes in pw , pg and the
vibrational parameter 1vg . On the other hand, the disagreement at higher
energies (> 0.9 eV) becomes negligible, as shown in Figs. s3(a) and 3(b).
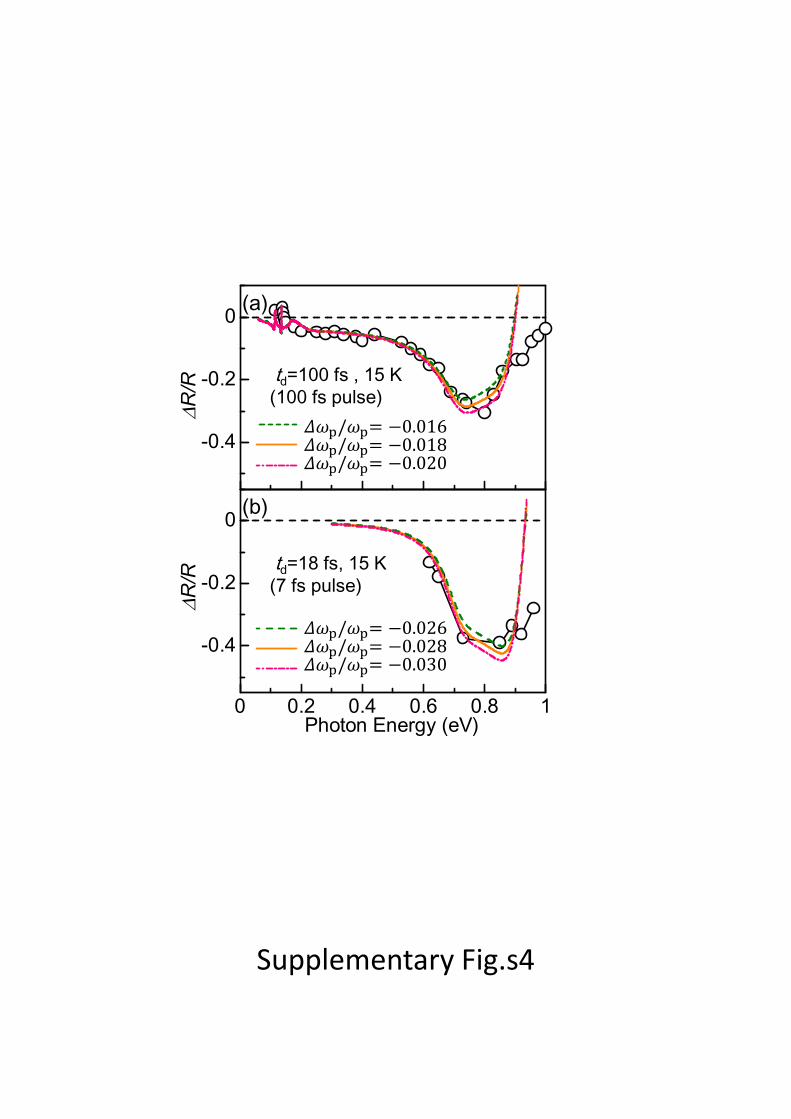
Accuracy of the fitting parameter /p pw wD
Figures s4(a) and s4(b) show the DR/R measured by 100 fs [s4(a)] and 7 fs
[s4(b)] pulses, respectively. The orange line [ /p pw wD = -0.018, /g gD = -0.12
in Fig. s4(a), /p pw wD = -0.028 in Fig. s4(b)] are the best-fit curves shown in
the main text. If we detune the parameter /p pw wD of about ± 0.2%, the
fitting curves cannot reproduce the results as shown by the green dashed
and magenta dashed-dotted lines. Therefore, we can conclude that the fitting
error of /p pw wD (about 0.2 %) is sufficiently small to discuss the
field-induced /p pw wD of about 3 %.
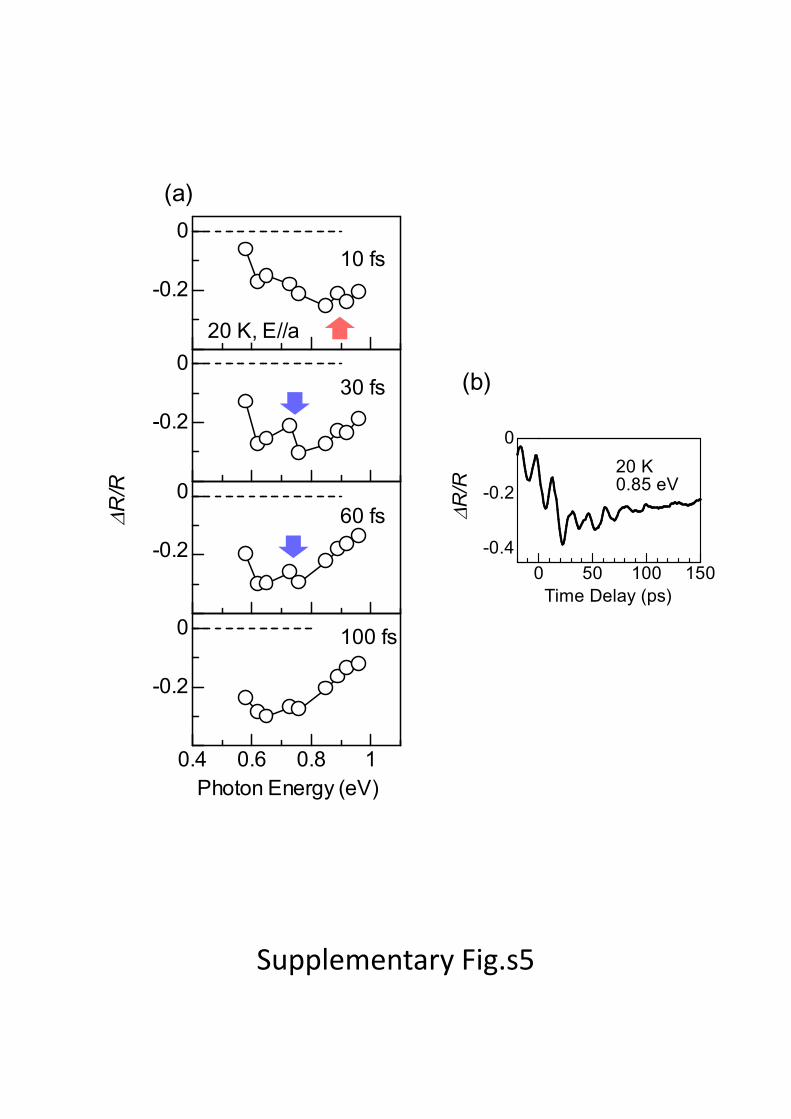
Reproducibility of DR/R spectrum
To confirm the reproducibility, we have measured DR/R spectrum in another
(TMTTF)2AsF6 sample. As shown in Fig. s5, the characteristics of the DR/R
at 20 K, 1.1 mJ/cm2 are quite similar to those in Figs. 3 and 4 (at almost the
same experimental condition; 15 K, 0.8 mJ/cm2), i.e.,
i) DR/R has a broad peak at 0.8-0.9 eV (shown by the red arrow) during the
initial time domain (< 20 fs). Then, the peak moves to the lower-energy side
(~0.6 eV) until 80-100 fs (Fig. s5(a)). ii) The spectral dip has been observed at
~0.7 eV (~ pw ) in the intermediate time region 30-60 fs (shown by the arrows
in Fig. s5(a)). iii) The time-domain oscillation with a period of 20 fs has been
observed at >0.8 eV (Fig. s5(b)). By these results, the reproducibility of the
transient reflectivity is confirmed at least for what we have mainly discussed
about.
References
[1] C. S. Jacobsen, D. B. Tanner, and K. Bechgaard, Phys. Rev. B28, 7019
(1983).
[2] A. Pashkin, M. Dressel, and C. A. Kuntscher, Phys. Rev. B74,
165118(2006).
[3] In the earlier study [1], authors could not completely justify the usage of
the Lorentz model for the low energy spectral region reflecting the low dc
conductivity and the charge transfer band (~0.2 eV). However, they have
concluded that it describes the real spectra quite well for the high energy
region. We agree that the Lorentz/ Drude model is difficult to analyze the low
energy response, because electron correlations inherent in
quasi-one-dimensional electron systems are important at < 0.2 eV, where the
bond alternation gives rise to the dimerization gap. Fortunately, we need to
discuss only about the high energy region around pw in the present study. In
such a limited condition, the analysis using this model is considered to be
reliable.
Figure captions
Figures s1 Reflectivity spectra of (TMTTF)2AsF6 measured at 25, 75, 150,
and 250 K for the polarization E//a, where a is the stacking axis of the planar
molecules. The solid black lines show the fitting curves calculated by Eqs.
1–3. The residual between the observed and calculated spectra are also
shown by the magenta lines. The fitting parameters are listed in Table. 1.
Figure s2 Reflectivity spectra at 25 K (a) and at 250 K (b) in the low energy
(< 0.25 eV) region with the fitting curves (solid black lines).
Figure s3 DR measured at td =100 fs after the excitation by 100-fs pulse and
that at td =18 fs after the excitation by 7-fs pulse. The solid lines show the
fitting curves calculated by Eqs.1–3 [with the same parameters as those used
in Fig. 2(b) and Fig. 4(b) ].
Figure s4 DR/R measured by 100 fs (a) and 7 fs (b) pulses, respectively. The
best-fitted curves shown in the main text are indicated by the orange lines.
The fitting curves for detuned parameters /p pw wD of ± 0.2% are also
shown by the green-dashed and magenta-dashed-dotted lines.
Figure s5 DR/R (a) and time evolution (b) measured by 7 fs pulses in another
(TMTTF)2AsF6 sample. These results have been shown to indicate the
reproducibility of the DR/R . The red and blue arrows indicate the broad peak
at td =10 fs (red) and the spectral dip at td =30, 60 fs (blue). The experimental
conditions (20 K, 1.1 mJ/cm2) are quite similar to those in Figs. 3 and 4 (0.8