water Article Understanding and Control of Biopolymer Fouling in Ultrafiltration of Different Water Types Xing Zheng 1,2, *, Frederik Zietzschmann 2 , Stephan Plume 2 , Hendrik Paar 2 , Mathias Ernst 3 , Zi Wang 4 and Martin Jekel 2, * 1 State Key Laboratory Base of Eco-Hydraulic Engineering in Arid Area, Xi’an University of Technology, Xi’an 710048, China 2 Department of Water Quality Control, Technical University of Berlin, Berlin 10623, Germany; [email protected] (F.Z.); [email protected] (S.P.); [email protected] (H.P.) 3 Department of water resource and water supply, Technical University Hamburg-Hamburg, Hamburg 21073, Germany; [email protected]4 National Supervision & Inspection Center of Environmental Protection Equipment Qaulity (Jiangsu), Yixing 214205, China; [email protected]* Correspondence: [email protected] (X.Z.); [email protected] (M.J.); Tel.: +86-29-8231-2906 (X.Z.); +49-30-314-23339 (M.J.) Academic Editor: Sunny Jiang Received: 10 March 2017; Accepted: 20 April 2017; Published: 23 April 2017 Abstract: The present work focuses on understanding and control of biopolymer fouling in ultrafiltration of a typical surface water and nearby secondary effluent for direct and indirect portable use. Characterization results show that both kinds of biopolymers are of similar molecular weight. Longer than one year water quality monitoring results show that the C/N ratio in the secondary effluent biopolymers was relatively constant at around 4.8, while that in the surface water macromolecules fluctuated at around 6.9. Under a similar mass load, the investigated secondary effluent biopolymers lead to hydraulic resistance slightly higher than that caused by filtering surface water macromolecules; however, the correspondingly formed fouling is significantly less reversible by hydraulic backwashing. The quantity of the nitrogenous biopolymers in the secondary effluent demonstrated a strong correlation with the extent of the irreversible fouling in ultrafiltration (UF), while that from the surface water did not. In membrane fouling cleaning tests, certain detergent demonstrated high efficiency in removing the irreversible fouling after UF of the secondary effluent, but presented no effect in eliminating fouling caused by the surface water foulants. In-line coagulation using FeCl 3 prior to UF was shown as an effective fouling control method, but the effect depends heavily on the type of feed water. Keywords: biopolymer fouling; protein; secondary effluent; surface water; ultrafiltration 1. Introduction Ultrafiltration (UF) membranes have often been used in filtering surface water or treated domestic wastewater for direct and indirect portable use, e.g., as pretreatment prior to RO (Reverse Osmosis) in water purification or reclamation. Nevertheless, the economic feasibility of UF is restricted by fouling phenomena to a large extent. To select suitable fouling control strategies such as pre-treatment, chemical cleaning, etc., identification and characterization of primary foulants is necessarily required [1]. Previous studies show that biopolymers (macromolecular protein-like substances and polysaccharides) are primary organic foulants in low pressure membrane filtration of both secondary effluent (SE) [2,3] and surface water (SW) [4,5]. SE biopolymers are the macromolecular fraction of Water 2017, 9, 298; doi:10.3390/w9040298 www.mdpi.com/journal/water
Transcript
water
Article
Understanding and Control of Biopolymer Fouling inUltrafiltration of Different Water Types
Xing Zheng 1,2,*, Frederik Zietzschmann 2, Stephan Plume 2, Hendrik Paar 2, Mathias Ernst 3,Zi Wang 4 and Martin Jekel 2,*
1 State Key Laboratory Base of Eco-Hydraulic Engineering in Arid Area, Xi’an University of Technology,Xi’an 710048, China
Academic Editor: Sunny JiangReceived: 10 March 2017; Accepted: 20 April 2017; Published: 23 April 2017
Abstract: The present work focuses on understanding and control of biopolymer fouling inultrafiltration of a typical surface water and nearby secondary effluent for direct and indirectportable use. Characterization results show that both kinds of biopolymers are of similar molecularweight. Longer than one year water quality monitoring results show that the C/N ratio in thesecondary effluent biopolymers was relatively constant at around 4.8, while that in the surface watermacromolecules fluctuated at around 6.9. Under a similar mass load, the investigated secondaryeffluent biopolymers lead to hydraulic resistance slightly higher than that caused by filtering surfacewater macromolecules; however, the correspondingly formed fouling is significantly less reversibleby hydraulic backwashing. The quantity of the nitrogenous biopolymers in the secondary effluentdemonstrated a strong correlation with the extent of the irreversible fouling in ultrafiltration (UF),while that from the surface water did not. In membrane fouling cleaning tests, certain detergentdemonstrated high efficiency in removing the irreversible fouling after UF of the secondary effluent,but presented no effect in eliminating fouling caused by the surface water foulants. In-line coagulationusing FeCl3 prior to UF was shown as an effective fouling control method, but the effect dependsheavily on the type of feed water.
Ultrafiltration (UF) membranes have often been used in filtering surface water or treated domesticwastewater for direct and indirect portable use, e.g., as pretreatment prior to RO (Reverse Osmosis) inwater purification or reclamation. Nevertheless, the economic feasibility of UF is restricted by foulingphenomena to a large extent. To select suitable fouling control strategies such as pre-treatment, chemicalcleaning, etc., identification and characterization of primary foulants is necessarily required [1].
Previous studies show that biopolymers (macromolecular protein-like substances andpolysaccharides) are primary organic foulants in low pressure membrane filtration of both secondaryeffluent (SE) [2,3] and surface water (SW) [4,5]. SE biopolymers are the macromolecular fraction of
Water 2017, 9, 298; doi:10.3390/w9040298 www.mdpi.com/journal/water
effluent organic matter (EfOM). They are mostly solvable microbiological products (SMP) secreted bymicroorganisms during metabolism and/or related to extracellular polymeric substances (EPS) [6–8].Using advanced characterization technologies, the presence of proteins and polysaccharides in thisfraction are clearly identified [2]. Quantitatively, it is suggested that in the macromolecular fractionincreased content of protein-like substances over polysaccharides would lead to more irreversiblemembrane fouling [9]. This is evident when model substances are tested in membrane processes [10].In UF of real SE, Haberkamp et al. [11] demonstrated the important contribution of protein-like materialon irreversible fouling as well. Nevertheless, it was not clarified if the protein-like substances are frombiopolymer fraction or from other fractions with smaller molecular sizes. Considering complicatedsynergistic effect of different organics in feed water [2,12] and limited representation capacity of modelsubstances in fouling studies [13], quantitatively reliable results identifying the role of protein-likesubstances in real biopolymer fouling need to be demonstrated.
In low-pressure membrane filtration of surface water, the discussion about the contributionof protein-like substances to membrane fouling exists as well. For instance, in a UF of SW study,no clear relationship between the carbon content of biopolymers and UF fouling was observed [5].Instead, the presence of protein-like substances in water, regardless of their molecular weight, seemsto contribute to irreversible fouling more significantly. Nevertheless, Kimura et al. [4] quantifiedbiopolymer content in different surface waters using liquid chromatography with organic carbon andUV254 (LC-OCD-UVD) detectors, and observed that the quantity of biopolymers (in terms of organiccarbon) is well related to fouling development in microfiltration (MF) processes, without consideringthe presence of protein-like substances at all.
The above-mentioned studies suggest that in both SE and SW the contribution of protein-likesubstance in biopolymer fraction to membrane fouling needs to be evaluated in more detail. One wayto gain more insights is to compare the severity of biopolymer fouling in UF of both types of water,and then evaluate its relation with the content of protein-like substances. This process is feasiblebecause protein content in biopolymers originating from SE and SW is quantitatively quite different.For instance, some investigations on the EfOM biopolymers show that this fraction contains relativelyhigh protein-like material, indicated by the ratio of carbon to nitrogen (C:N ratio) in the range of6.2 ± 1.7 [7]. This C:N ratio indicator is consistent with the Redfield ratio (C:N:P = 106:16:1) [14].In comparison, biopolymers from SW predominantly consist of polysaccharides from more diversesources, such as phytoplankton, algae and terrigenous [15]. They exhibit a significantly higher C:Nratio over the Redfield ratio [16]. Although polysaccharides from these two typical water types canbe different in terms of contributing to fouling [17], they are considered to have significantly lowerfouling potential than protein-like substances [10,18]. Nevertheless, there is a lack of informationdistinguishing the difference between these two kinds of organics on fouling. Thus, the comparison ofthese biopolymers is expected to indicate a clear difference in fouling severity.
The comparison of UF fouling in treating SE and SW was conducted in some previousstudies [19,20]. These pioneer works clearly revealed significant differences in UF fouling duringfiltration of EfOM and SW biopolymers. However, the uncertainty of corresponding conclusions riseswhen the following conditions are considered. For instance, the results can be affected due to thechange of operational conditions such as selection of backwash water. In UF fouling studies the waterchemistry of backwash water needs to be consistent with the feed water because, in most UF systems,the permeate is used for backwash. When other kinds of water (e.g., when demineralized water isused for backwash [21]) are used instead, the reversibility of fouling can be altered dramatically, whichwill affect the conclusion obtained using permeate for hydraulic back flush. Secondly, the representability of water samples needs to be considered seriously because fluctuation of water quality alwayschallenges the conclusion made based on very limited number of samples [20]. At this point, longterm testing and frequent monitoring are necessary to get statistically reliable results. In addition,previous works are mostly lab scale investigations [19,20]. While the results no doubt reflect the fouling
Water 2017, 9, 298 3 of 17
potential of feed water, pilot scale investigations are more preferred to confirm lab scale results anddeliver practically applicable knowledge [22].
In the present work, lab-scale UF tests were conducted to identify fouling potential of biopolymersfrom typical SE and SW sources with a monitoring period longer than one year. LC-OCD-OND wasused to quantify the carbon and nitrogen content in the biopolymer fraction and indicate the contentof protein-like substances. The filterability and reversibility of biopolymer fouling were evaluatedand their relation with the carbon and nitrogen content in the biopolymer fraction was identified.Furthermore, pilot scale UF with chemical cleaning was performed to gain insight into the chemicalproperty of the irreversible fouling. In the end in-line coagulation tests were conducted for severalmonths to illustrate the difference of UF performance in treating SE and SW containing biopolymerswith very different characteristics.
2. Materials and Methods
2.1. Secondary Effluent
Treated domestic wastewater used in the present work is the SE from the wastewater treatmentplant (WWTP) Ruhleben in Berlin with a treatment capacity of 250,000 m3/d. The wastewater treatmentprocess includes a conventional activated sludge process and biological phosphorus and nitrogenremoval. Inorganic coagulant (FeCl3) was added in the biological process to keep total phosphorusconcentrations below 0.5 mg/L. The effluent from the secondary clarifier was used as feed waterdirectly to the pilot UF after a pre-filter with a pore size of 100 µm, and for the lab-scale UF testafter pre-filtration using cellulose nitrate filter with a pore size of 0.45 µm (Satorious). More detailedinformation about the plant can be found in previous studies [23].
2.2. Surface Water
SW samples were taken from the Landwehrkanal, Berlin. This SW canal is connected with theupper and lower part of Spree River and flows through Berlin City. The sampling site was locatedbehind a small barrage, providing good mixture of the canal water. Prior to the UF pilot plant, a sievefilter with a pore size of 200 µm was used to treat the SW. River water used for the lab-scale UF testwas prefiltered using a cellulose nitrate filter with a pore size of 0.45 µm (Satorious). More informationabout this water can be found in Tian’s work [19].
2.3. Lab Scale UF Test
Lab scale dead-end flat-sheet filtration tests using Amicon UF cell (UF membrane NADIR@UP150 with MWCO 150 k Da, Wiesbaden, Germany) were performed to conduct membrane filtrationexperiments. For each test a new UF membrane was used. Using this setup filterability and reversibilityof water sample can be quantified. Here, filterability is defined as the hydraulic resistance causedby fouling after initial filtering of a 500 mL water sample. Reversibility refers to the hydraulicallyirreversible resistance after a number of filtration and backwash cycles. This kind of test has been wellestablished and accepted in previous studies [24]. In brief, each test was conducted in five filtrationcycles using a filtration cell with a volume of 200 mL (Amicon 8200, Millipore, Billerica, MA, USA) andan effective membrane filtration area of 28.7 cm2. During each single filtration cycle, a 500 mL watersample (pre-filtered using a cellulose nitrate filter with a pore size of 0.45 mm (Sartorius)) is suppliedto the cell through a connected feed tank (4 L) in dead-end mode under constant pressure at one bar.The membrane is backwashed using a 50 mL salt solution (CaCl2 2.8 mmol/L, NaCl 5.4 mmol/Ldissolved in pure water, conductivity around 1200 µS/cm to simulate UF permeate treating SE) afterproducing 500 mL permeate. Then, pure water flux was determined by filtering 200 mL pure waterthrough the fouled membrane. The corresponding hydraulic resistance can be calculated according tothe Darcy equation. In either filtration or backwash, the water is pressurized using nitrogen under1 bar. The operation is conducted at room temperature (22 ◦C) and at a stirring speed of 120 rpm.
Water 2017, 9, 298 4 of 17
It should be mentioned that, although the situation of the lab scale test is different to that in thepilot test (e.g., operational mode constant pressure vs. constant flux, membrane type flat sheet vs.hollow fiber membrane, pre-filter mesh size 0.45 µm vs. 100/200 µm), they confirm the difference infouling potential of different water samples [24]. This implies that the results from these two tests areconsistent with each other regarding the fouling nature of feed water and the order of fouling severity.Therefore, the lab test results are reliable in comparing fouling effect of various feed waters.
2.4. Pilot Scale UF (without In-Line Coagulation) and Cleaning in Place (CIP) Test
Pilot scale investigations were carried out using a dead-end pressure driven UF pilot plant withhydrophilized PES membranes (hollow fibre membrane, Dizzer 450, Inge AG, Inge, Greifenberg,Germany) after a pre-filter (100 µm mesh size) with no coagulant was used. Detailed informationabout the membrane can be found in a previous study [23]. In the present work, the UF unit wasoperated in dead-end filtration mode at a constant flux of 60 L/(m2·h). According to preliminary teststhe difference of trans-membrane pressure (TMP) increase rate with and without in-line coagulationwas distinct under such flux and the increase rates in filtering both types of water under differentcoagulant dosages were in a reasonable range [23]. Therefore, the flux was fixed at 60 L/(m2·h) duringall pilot scale tests. The basic operational condition is as follows: after 20 min filtration the membranewas backwashed for 25 s using permeate water at a flux of 260 L/(m2·h). An experiment ended whenthe TMP reached 600 mbar. The time the plant operated from the start until TMP reached 600 mbar istermed as the operating duration (in days). After each pilot experiment the fouled membrane waschemically cleaned (CIP) in a two-step process: In CIP I the fouled membrane was soaked in a basesolution (pH 12 by dissolving NaOH in demineralized water) for 30 min at a temperature around20 ◦C. After the module was flushed using tap water, the permeability was measured by filteringtap water for at least 10 min to get a stable value. In CIP II, different reagents were used to soak themodule for 60 min at 20 ◦C. The reagents include protease type XXIII 50 mg/L at pH 7 (Sigma Aldrich,St. Louis, MO, USA), α-amylase 50 mg/L at pH 7 (Sigma Aldrich), H2O2 200 mg/L (Sigma Aldrich),raw ethanol (100%, analytical grade) and diluted with pure water at 50% (v/v) and 10% (v/v) at pH 12,and sodium dodecyl sulfate (Sigma Aldrich) at a concentration of 2 and 0.1 g/L at pH 12 (dissolved indemineralized water). As each CIP test (including filtration and CIP I and II) was conducted withintwo days, scaling was assumed not to occur significantly. Therefore, no acid cleaning was conductedfor these tests. The chemicals used in CIP I and II are summarized in Table 1.
Table 1. Cleaning in place (CIP) conditions in tests.
CIP Step Test 1 Test 2 Test 3 Test 4 Test 5 Test 6 Test 7 Test 8 Test 9 Test 10
CIP I30 min at 20 ◦C NaOH dissolved in demineralized water with a pH 12
CIP II60 min at 20 ◦C
Protease50 mg/L
Amylase50 mg/L
H2O2 200mg/L
Ethanol100%
Ethanol50%
Ethanol 10%,pH 12
SDS 2 g/L,pH 12
SDS 0.1g/L, pH 12
SDS 2 g/L,pH 12
SDS 2 g/L,pH 12
2.5. Pilot UF Test with In-Line Coagulation
In-line coagulation with UF tests were conducted using FeCl3 (CVB Albert Carl GmbH & CoKG, Berlin, Germany) as coagulant to control fouling development in UF of SE and SW. During allexperiments, FeCl3 was added after the 100 µm pre-filter into the feed water without the removal ofcoagulated solids (in-line coagulation) prior to the UF pilot plant. The feed pump of the UF pilot wasused as the mixer. The reaction time after coagulant dose until the flocs arrived on the membranesurface was kept at around 90 s based on preliminary tests. Basic operational conditions of themembrane system are identical to the plant without in-line coagulation. In terms of Fe3+ content, thedosage was fixed at 0.04, 0.07 or 0.15 mmol/L (2, 4 and 8 mg/L of Fe3+, correspondingly) during eachsingle test treating the SE, while in UF of the SW the dosage was selected as 0.02 and 0.04 mmol/L(1 and 2 mg/L of Fe3+) based on some preliminary tests. One test is completed when TMP achieved600 mbar. After each experiment, the module was chemically cleaned using base, oxidant and acid
Water 2017, 9, 298 5 of 17
subsequently. If the permeability recovery could not achieve 90% after using different cleaning reagents,a new module was used for further experiments. Detailed test conditions can be found in a previouspublication [23].
2.6. Water Analysis
2.6.1. LC-OCD-UVD-OND
The dissolved macromolecular organic compounds in both waters are quantified using liquidchromatography with online organic carbon, UV, and organic nitrogen detectors (LC-OCD-UVD-OND).The LC-OCD-UVD-OND system (DOC-LABOR Dr. Huber, Karlsruhe, Germany) was equipped witha size exclusion column HW50S (GROM Analytik HPLC GmbH, Rottenburg-Halfingen, Germany)and online dissolved organic carbon (OCD), UV254 (UVD), and dissolved organic nitrogen (OND)detectors. The liquid chromatogram (LC) unit separates organic compounds based on theirmolecular size and the separated compounds were detected by online detectors; larger molecularsize material were generally indicated by a shorter elution time. Using ChromCALC®software(ChromCALC®, DOC-LABOR Dr. Huber, KarlsruheCity, Germany), the corresponding peak area couldbe converted into concentrations (mg C/L, mg N/L) and UVA254 absorbance (1/m). According to themanufacturer [25], the ratio between dissolved organic carbon (DOC) measured after the column andthe DOC in bypass can be used to reflect the relative hydrophobicity of a water sample. In the presentwork, this ratio of different water samples is calculated and compared. The ratio of ideal hydrophilicsubstances is 100%. A lower value indicates increased hydrophobicity.
2.6.2. Fluorescence Excitation Emission Matrix
Fluorescence excitation emission matrix (F-EEM, FluoroMax-4, Horiba, Kyoto, Japan) is used tocharacterize the feedwaters. The spectrofluorometer was equipped with a xenon excitation source.EEM were collected for excitation wavelengths from 250 to 500 nm in 5 nm steps and for emissionwavelengths from 300 to 600 nm in 5 nm steps. Both excitation and emission slit bandwidths werefixed at 5 nm. The measurement was conducted at room temperature (20 ± 0.5 ◦C). All samples weremeasured at neutral pH and a DOC of approximately 5 mg/L to minimize inner effect [26].
2.6.3. Other Water Quality Parameters
In the present work, a High TOC meter (Elementar Analysensysteme GmbH, Langenselbold,Germany) was used to analyse DOC concentration. The content of humic substances in water sampleswas identified using UV254 absorption which was quantified using a spectrometer (Perkin ElmaerUV/VIS Spectrometer, Waltham, MA, USA) at a wavelength of 254 nm. Turbidimeter (2100 NISTurbidimeter, HACH, Loveland, CO, USA) was used to quantify turbidity. pH 537 (WTW, Weilheim,Germany) was used to measure pH. The ion content of Ca and Na was identified using atomicabsorption spectrometry (Analytik Jena, Jena, Germany). Most of the parameters were analyzed onceor twice a week, while some parameters were measured less frequently due to less focus. Detailednumber of measurements can be seen in Table 2.
3. Results and Discussion
3.1. Overview of Water Quality
During water quality monitoring period (February 2009–August 2010, except winter 2009 for SW),these two types of water demonstrated similar pH and calcium content (Table 2), even during rainfallevent. This indicates that the SE and SW deliver similar water chemistry condition (e.g., alkalinity),which builds up fair situation in comparing fouling because both parameters are critical factorsaffecting the severity of organic fouling [21,27]. Although the ion strength (reflected by conductivity)of these two types of water is different, that affects the severity of UF fouling to a minor extent
Water 2017, 9, 298 6 of 17
because the difference is from the content of mono-charged ions (e.g., sodium, Table 2). Compared tomulti-charged metal ions, the mono-charged species affect the severity of organic fouling to a muchless extent [12,28]. With respect to the turbidity of the SE and SW after pre-filters, the average valueand its fluctuation in the SE are lower than that of the SW.
Table 2. Water quality of secondary effluent (SE) and surface water (SW) during the monitoring period,number of LC-OCD measurements > 100.
Notes: * additional values (nmin = 10) from Berliner Wasserbetriebe. ** cited from Zheng et al. [29], n = 44. *** citedfrom Zheng et al. [24] as ortho phosphate concentration in average. Part of the data are adapted from [30], withcopyright permission from Desalination and Water Treatment.
The content of organics in the SE and SW varies. On average, the SE contains 50% higher DOCthan the SW. This is mainly caused by a higher content of humic substances and building blocks(in terms of UV254, Table 2) in the SE. DOC in the SE shows also higher hydrophobicity than that inthe SW (Table 2). As shown, roughly 90% of the SE DOC can pass through the LC column, while thatvalue increased to 91% when the SW was measured. The difference seems very minor. However, it is astatistically reliable signal indicating that the EfOM in the SE is more retained by the LC material [25]than the organics in the SW. This is consistent with the higher content of humic-like substances in theSE than in the SW (in terms of UV254) while in all DOC fractions these materials are of the highesthydrophobicity [2].
F-EEM confirms certain water characteristics qualified by other methods. As shown inFigure 1, both water samples have peaks at excitation/emission (EX/EM) range of 250/440 nmand 310/400–430 nm indicating the presence of humic-like substances [26]. The SE sample presents ahigher signal intensity at these peaks than the SW sample, which is consistent with the higher humiccontent quantified by UV254 measurements (Table 2). The SE also shows a higher intensity at theprotein-like peak (270/350 nm) than the SW sample presents, indicating it is more significantly affectedby microbiological activities in wastewater treatment processes [26].
Water 2017, 9, 298 7 of 17
Water 2017, 9, 298 6 of 17
Table 2. Water quality of secondary effluent (SE) and surface water (SW) during the monitoring period, number of LC-OCD measurements > 100.
Parameters SE SW Temperature (°C) 11.9 ± 4.3 * 15.9 ± 8.3
Biopolymer C/N ratio 4.8 ± 0.6 6.9 ± 1.1 Notes: * additional values (nmin = 10) from Berliner Wasserbetriebe. ** cited from Zheng et al. [29], n = 44. *** cited from Zheng et al. [24] as ortho phosphate concentration in average. Part of the data are adapted from [30], with copyright permission from Desalination and Water Treatment.
The content of organics in the SE and SW varies. On average, the SE contains 50% higher DOC than the SW. This is mainly caused by a higher content of humic substances and building blocks (in terms of UV254, Table 2) in the SE. DOC in the SE shows also higher hydrophobicity than that in the SW (Table 2). As shown, roughly 90% of the SE DOC can pass through the LC column, while that value increased to 91% when the SW was measured. The difference seems very minor. However, it is a statistically reliable signal indicating that the EfOM in the SE is more retained by the LC material [25] than the organics in the SW. This is consistent with the higher content of humic-like substances in the SE than in the SW (in terms of UV254) while in all DOC fractions these materials are of the highest hydrophobicity [2].
F-EEM confirms certain water characteristics qualified by other methods. As shown in Figure 1, both water samples have peaks at excitation/emission (EX/EM) range of 250/440 nm and 310/400–430 nm indicating the presence of humic-like substances [26]. The SE sample presents a higher signal intensity at these peaks than the SW sample, which is consistent with the higher humic content quantified by UV254 measurements (Table 2). The SE also shows a higher intensity at the protein-like peak (270/350 nm) than the SW sample presents, indicating it is more significantly affected by microbiological activities in wastewater treatment processes [26].
Figure 1. Fluorescence excitation emission matrix (F-EEM) of secondary effluent and surface water.
300 350 400 450 500 550 600250
300
350
400
450
500
a) secondary effluent
Emission Wavelength (nm)
Exc
itatio
n W
avel
engt
h (n
m)
0.0
1.3E+05
2.5E+05
3.8E+05
5.0E+05
6.3E+05
7.5E+05
8.8E+05
1.0E+06
0.0
1.3E+05
2.5E+05
3.8E+05
5.0E+05
6.3E+05
7.5E+05
8.8E+05
1.0E+06
300 350 400 450 500 550 600250
300
350
400
450
500
Emission Wavelength (nm)
Exc
itatio
n W
avel
engt
h (n
m)
b) surface water
Figure 1. Fluorescence excitation emission matrix (F-EEM) of secondary effluent and surface water.
3.2. Biopolymers in SE and SW
Detailed comparison of the molecular size distribution of the organics in both kinds of water isshow in Figure 2. It can be seen that the SE and SW contain some biopolymers (elution time 40–60 min).Most of the DOC is contributed from humics and building blocks (elution time 60–80 min). The organicswith smaller molecular sizes (elution time after 80 min) have limited contribution to DOC. After UF,most of the biopolymers, which are regarded as the major foulants to UF, can be removed (data notshown). Similar phenomena have already been reported in a number of studies [24,31]. The organicsdetected after elution time of 60 min are counted as minor foulants because their contribution tohydraulic resistance through surface adsorption is limited compared to biopolymers [2], although theirpresence does alter the surface property of the membrane and may lead to conditioning fouling whichaffects subsequent fouling processes [32].
Water 2017, 9, 298 7 of 17
3.2. Biopolymers in SE and SW
Figure 2. Liquid chromatography with online organic carbon (LC-OCD) chromatograms of secondary effluent and surface water.
Detailed comparison of the molecular size distribution of the organics in both kinds of water is show in Figure 2. It can be seen that the SE and SW contain some biopolymers (elution time 40–60 min). Most of the DOC is contributed from humics and building blocks (elution time 60–80 min). The organics with smaller molecular sizes (elution time after 80 min) have limited contribution to DOC. After UF, most of the biopolymers, which are regarded as the major foulants to UF, can be removed (data not shown). Similar phenomena have already been reported in a number of studies [24,31]. The organics detected after elution time of 60 min are counted as minor foulants because their contribution to hydraulic resistance through surface adsorption is limited compared to biopolymers [2], although their presence does alter the surface property of the membrane and may lead to conditioning fouling which affects subsequent fouling processes [32].
Long term water quality monitoring shows that in both types of water the concentration of biopolymers changes seasonally (Figure 3). In the SE, their concentration increased from August to December and decreased when the winter passed. This trend confirms the phenomenon reported in a previous study [24]. Although detailed reason has not been explored thoroughly, several factors such as temperature shock, availability of food and nutrients can affect the living condition of bacteria, and thus the secretion of SMP [7,8,33]. Under such challenging conditions, bacteria alter the production of SMP and/or EPS to adapt to the situation and protect their metabolism process [8]. Difference to the trend in the SE, biopolymer content in the SW decreased from summer to winter and presented its maximum values at around 1.2 mg/L in August to September 2010 (Figure 3). In winter, the concentration was about 0.2 mg/L, which is much lower than that in other seasons. As biopolymers in SW originate mainly from algae, detritus and aquatic plant phytoplankton, bacteria, and oysters due to the release of exopolymers, their living conditions such as temperature change affect the quantity and quality of the biopolymers to a large extent [34].
Figure 2. Liquid chromatography with online organic carbon (LC-OCD) chromatograms of secondaryeffluent and surface water.
Long term water quality monitoring shows that in both types of water the concentration ofbiopolymers changes seasonally (Figure 3). In the SE, their concentration increased from August toDecember and decreased when the winter passed. This trend confirms the phenomenon reported in aprevious study [24]. Although detailed reason has not been explored thoroughly, several factors suchas temperature shock, availability of food and nutrients can affect the living condition of bacteria, andthus the secretion of SMP [7,8,33]. Under such challenging conditions, bacteria alter the productionof SMP and/or EPS to adapt to the situation and protect their metabolism process [8]. Difference to
Water 2017, 9, 298 8 of 17
the trend in the SE, biopolymer content in the SW decreased from summer to winter and presentedits maximum values at around 1.2 mg/L in August to September 2010 (Figure 3). In winter, theconcentration was about 0.2 mg/L, which is much lower than that in other seasons. As biopolymers inSW originate mainly from algae, detritus and aquatic plant phytoplankton, bacteria, and oysters dueto the release of exopolymers, their living conditions such as temperature change affect the quantityand quality of the biopolymers to a large extent [34].Water 2017, 9, 298 8 of 17
Figure 3. Variation of biopolymer concentration in secondary effluent and surface water (no SW sample was analyzed from October 2009 to April 2010, but the drop of biopolymer concentration from September 2009 to April 2010 implies the process took place in real time).
Not only the quantity of biopolymers fluctuates, but their quality changes as well. In the present investigation, the relative content of organic nitrogen in the SE biopolymer fraction is significantly higher than that in the SW macromolecules, with an average C/N ratio of 4.8 and 6.9 for the SE and SW biopolymers, respectively. Suppose the organic nitrogen is mainly from the protein-like substances [25], they contribute to 63% of biopolymer DOC in the SE samples, while that in the SW their contribution is around 44%. In both kinds of biopolymers, the content of inorganic colloids is low (UV absorbance of inorganic colloids, Table 2), implying the low content of colloidal silica [25].
The extent of fluctuation of C/N ratio within the biopolymer fraction of these two types of water is also different. The ratio in the SE is relatively stable at around 4.8 without a clear trend during the whole sampling period (Figure 4), while SW fluctuates much more significantly (Figure 4). It increased from 4 in April and experienced peak values close to 12 in June. Thereafter, it decreased again. The variation does not follow the change of biopolymer concentration record which increased from April continuously and achieved the highest note in August (Figure 3). For a mixed culture of microorganisms, the causes can be attributed to the changes of bacterial activity, a shift in the nature and/or availability of resources, or even the variation of the microorganism community [35–37]. Detailed analysis can be conducted in future studies.
Figure 3. Variation of biopolymer concentration in secondary effluent and surface water (no SWsample was analyzed from October 2009 to April 2010, but the drop of biopolymer concentration fromSeptember 2009 to April 2010 implies the process took place in real time).
Not only the quantity of biopolymers fluctuates, but their quality changes as well. In the presentinvestigation, the relative content of organic nitrogen in the SE biopolymer fraction is significantlyhigher than that in the SW macromolecules, with an average C/N ratio of 4.8 and 6.9 for the SE and SWbiopolymers, respectively. Suppose the organic nitrogen is mainly from the protein-like substances [25],they contribute to 63% of biopolymer DOC in the SE samples, while that in the SW their contributionis around 44%. In both kinds of biopolymers, the content of inorganic colloids is low (UV absorbanceof inorganic colloids, Table 2), implying the low content of colloidal silica [25].
The extent of fluctuation of C/N ratio within the biopolymer fraction of these two types ofwater is also different. The ratio in the SE is relatively stable at around 4.8 without a clear trendduring the whole sampling period (Figure 4), while SW fluctuates much more significantly (Figure 4).It increased from 4 in April and experienced peak values close to 12 in June. Thereafter, it decreasedagain. The variation does not follow the change of biopolymer concentration record which increasedfrom April continuously and achieved the highest note in August (Figure 3). For a mixed cultureof microorganisms, the causes can be attributed to the changes of bacterial activity, a shift in thenature and/or availability of resources, or even the variation of the microorganism community [35–37].Detailed analysis can be conducted in future studies.
Water 2017, 9, 298 9 of 17Water 2017, 9, 298 9 of 17
Figure 4. C/N ratio within biopolymers in secondary effluent and surface water.
3.3. Comparison of Filterability and Reversibility in UF
The quantitative and qualitative change of biopolymer fraction delivers an opportunity to check their corresponding effect on membrane fouling. The comparison of the hydraulic resistance during UF of these two kinds of water shows that under a similar biopolymer load filtering the SE leads to a slightly higher resistance compared to filtering the SW (Figure 5), which is similar to the data presented by Tian et al [19]. As the resistance is mainly caused by the retention of biopolymers in feed water, which are of similar MW in both feeds (Figure 1), the structure of these organics is supposed to contribute to the difference. Considering that protein-like substances are more abundant in the SE biopolymers, and at a similar MW are denser and of smaller size compared to polysaccharides [38], during filtration, they can present a higher specific resistance than polysaccharides [39,40], thus leading to a slightly higher hydraulic resistance under a similar mass load.
Figure 5. Hydraulic resistance filtering secondary effluent and surface water under 500 mL permeate volume (n = 13).
0
2
4
6
8
10
12
14
16.07.09 24.10.09 01.02.10 12.05.10 20.08.10Date
C/N
in b
iopo
lym
ers
secondary effluent surface water
Figure 4. C/N ratio within biopolymers in secondary effluent and surface water.
3.3. Comparison of Filterability and Reversibility in UF
The quantitative and qualitative change of biopolymer fraction delivers an opportunity to checktheir corresponding effect on membrane fouling. The comparison of the hydraulic resistance duringUF of these two kinds of water shows that under a similar biopolymer load filtering the SE leadsto a slightly higher resistance compared to filtering the SW (Figure 5), which is similar to the datapresented by Tian et al. [19]. As the resistance is mainly caused by the retention of biopolymers in feedwater, which are of similar MW in both feeds (Figure 1), the structure of these organics is supposedto contribute to the difference. Considering that protein-like substances are more abundant in the SEbiopolymers, and at a similar MW are denser and of smaller size compared to polysaccharides [38],during filtration, they can present a higher specific resistance than polysaccharides [39,40], thus leadingto a slightly higher hydraulic resistance under a similar mass load.
Water 2017, 9, 298 9 of 17
Figure 4. C/N ratio within biopolymers in secondary effluent and surface water.
3.3. Comparison of Filterability and Reversibility in UF
The quantitative and qualitative change of biopolymer fraction delivers an opportunity to check their corresponding effect on membrane fouling. The comparison of the hydraulic resistance during UF of these two kinds of water shows that under a similar biopolymer load filtering the SE leads to a slightly higher resistance compared to filtering the SW (Figure 5), which is similar to the data presented by Tian et al [19]. As the resistance is mainly caused by the retention of biopolymers in feed water, which are of similar MW in both feeds (Figure 1), the structure of these organics is supposed to contribute to the difference. Considering that protein-like substances are more abundant in the SE biopolymers, and at a similar MW are denser and of smaller size compared to polysaccharides [38], during filtration, they can present a higher specific resistance than polysaccharides [39,40], thus leading to a slightly higher hydraulic resistance under a similar mass load.
Figure 5. Hydraulic resistance filtering secondary effluent and surface water under 500 mL permeate volume (n = 13).
0
2
4
6
8
10
12
14
16.07.09 24.10.09 01.02.10 12.05.10 20.08.10Date
C/N
in b
iopo
lym
ers
secondary effluent surface water
Figure 5. Hydraulic resistance filtering secondary effluent and surface water under 500 mL permeatevolume (n = 13).
The reversibility of the fouling formed during UF of both types of water is presented in Figure 6.As shown, a higher biopolymer concentration in the SE leads to more irreversible fouling, which isconsistent with the observation in a previous study [24]. There are also studies showing that there is nosignificant correlation between the biopolymer content and irreversible fouling [11,19]. Being awarethat the severity of fouling is related to operational conditions [41] and water chemistry [2], detailedcomparison of the experimental condition was conducted. It is shown that in Tian’s test demineralizedwater was used for backwash [19]. This kind of water has been demonstrated to have a much higherremoval effect on hydraulically irreversible fouling due to the reduction of Ca2+ bridging effect in the
Water 2017, 9, 298 10 of 17
organic fouling structure [21]. In the present case back wash water contains a similar concentrationof Ca2+ was used as the feed water. Therefore, it is not surprising that the conclusion is different.In another case, cross-flow testing without backwash was applied while operating a bench-scale UFunit [11]. That is different from the dead-end filtration mode with periodic backwash used in thepresent work. The operational difference leads to uncertain comparisons of the irreversible fouling inthese systems, which could be further investigated as a research topic.Water 2017, 9, 298 10 of 17
Figure 6. Relationship between irreversible resistance and: (a) organic carbon content of biopolymer in ultrafiltration (UF) of secondary effluent (SE); (b) organic nitrogen content of biopolymer in UF of SE; (c) organic carbon content of biopolymer in UF of surface water (SW); and (d) organic nitrogen content of biopolymer in UF of SW.
The reversibility of the fouling formed during UF of both types of water is presented in Figure 6. As shown, a higher biopolymer concentration in the SE leads to more irreversible fouling, which is consistent with the observation in a previous study [24]. There are also studies showing that there is no significant correlation between the biopolymer content and irreversible fouling [11,19]. Being aware that the severity of fouling is related to operational conditions [41] and water chemistry [2], detailed comparison of the experimental condition was conducted. It is shown that in Tian’s test demineralized water was used for backwash [19]. This kind of water has been demonstrated to have a much higher removal effect on hydraulically irreversible fouling due to the reduction of Ca2+ bridging effect in the organic fouling structure [21]. In the present case back wash water contains a similar concentration of Ca2+ was used as the feed water. Therefore, it is not surprising that the conclusion is different. In another case, cross-flow testing without backwash was applied while operating a bench-scale UF unit [11]. That is different from the dead-end filtration mode with periodic backwash used in the present work. The operational difference leads to uncertain comparisons of the irreversible fouling in these systems, which could be further investigated as a research topic.
The effect of the content of organic nitrogen in biopolymers on irreversible fouling was investigated. Figure 6b shows that a higher content of organic nitrogen in the SE biopolymers matches more severe fouling situations, and this trend becomes more apparent with increased number of filtration cycles (Figure 6b). As the ratio of C/N is relatively constant in the SE, the relation of both biopolymer carbon and nitrogen content with the severity of fouling exists. When the ratio of C/N was plotted against the specific irreversible resistance, no relationship between these two parameters can be established (data not shown). These phenomena imply that polysaccharides and proteins contribute to the irreversible hydraulic resistance together. Their contribution cannot be differentiated under the present experimental conditions.
It is interesting to note that, in Figure 6a,b, correlation between biopolymer concentration and the irreversible fouling resistance can only be found at a later stage of filtration (later than three backwash cycles). Similar phenomena were reported in other studies [41,42], and imply that, during different filtration stages, the mechanisms of forming irreversible fouling are different. It is well
Figure 6. Relationship between irreversible resistance and: (a) organic carbon content of biopolymer inultrafiltration (UF) of secondary effluent (SE); (b) organic nitrogen content of biopolymer in UF of SE;(c) organic carbon content of biopolymer in UF of surface water (SW); and (d) organic nitrogen contentof biopolymer in UF of SW.
The effect of the content of organic nitrogen in biopolymers on irreversible fouling wasinvestigated. Figure 6b shows that a higher content of organic nitrogen in the SE biopolymers matchesmore severe fouling situations, and this trend becomes more apparent with increased number offiltration cycles (Figure 6b). As the ratio of C/N is relatively constant in the SE, the relation of bothbiopolymer carbon and nitrogen content with the severity of fouling exists. When the ratio of C/N wasplotted against the specific irreversible resistance, no relationship between these two parameters canbe established (data not shown). These phenomena imply that polysaccharides and proteins contributeto the irreversible hydraulic resistance together. Their contribution cannot be differentiated under thepresent experimental conditions.
It is interesting to note that, in Figure 6a,b, correlation between biopolymer concentration andthe irreversible fouling resistance can only be found at a later stage of filtration (later than threebackwash cycles). Similar phenomena were reported in other studies [41,42], and imply that, duringdifferent filtration stages, the mechanisms of forming irreversible fouling are different. It is wellargued that during the initial stage of filtration non-selective mono-layer adsorption of both humicsand biopolymers occur, which causes the main irreversible fouling (e.g., [41]). Under such condition,no apparent correlation between biopolymer concentration and the irreversible resistance can beobserved. In a later stage, however, due to the exhaustion of adsorptive capacity of the membrane,
Water 2017, 9, 298 11 of 17
the accumulation of biopolymers plays a major role in leading to irreversible resistance. Thus, suchrelation becomes more apparent [41,42].
In the case of SW, no relationship between the biopolymer content and the irreversible resistancein UF can be found (Figure 6c) when all the samples (from June 2009 to October 2010) are taken intoconsideration. However, when the data are divided based on the sampling time, a negative correlationbetween the biopolymer content (sampling from May to August 2010) and the irreversible resistanceemerges. Interestingly, increased biopolymer concentration in the feed water is related to decreasedirreversible fouling. This result implies that under the current experimental condition a higher amountof SW biopolymers forms a more reversible fouling layer. As the organic nitrogen might be due to thepresence of proteins [25], and the increase of relative content of proteins was demonstrated to causemore irreversible fouling [10,11], the correlation between the concentration of nitrogenous biopolymerand membrane fouling was investigated. It is observed that while the organic nitrogen content variedfrom 0.09 to 0.2 mg N/L for these water samples, no correlation between these two parameters canbe established.
The result of the SW biopolymer fouling seems to be contradictable to other research results [4,11].These studies found that either the content of the total amount of SW biopolymers or the content ofprotein-like substances is relevant to the irreversible fouling. Considering Kimura’s study, the differentconclusion may be due to the application of MF (pore size 0.1 µm) treating different SW. It is evidentthat MF is more prone to fouling than UF because macromolecules can be more easily pushed intothe membrane structure and form irreversible fouling [20]. Variation of the polysaccharide molecularstructure during the test period could be another reason. A recent research revealed that even withinpolysaccharide (alginate) fraction the variation of the ratio between 1,4-linked β-d-mannuronic acidand α-l-guluronic acid will alter the interaction between the organics and the membrane, and thuschange the severity of fouling [17]. Although detailed investigation has not been conducted in thepresent work, the possibility exists while the change of the organic components in the macromolecularfraction is significant (Figures 3 and 4). Further detailed investigation of this topic has begun in ourresearch group.
The reasons for no correlation between organic nitrogen content in biopolymers and thecorrespondingly formed irreversible fouling can be explored in different perspectives. One cause couldbe the synergistic effect of mixing proteins and polysaccharides in water. When the organics (e.g.,proteins and polysaccharides) are present simultaneously, the final fouling effect is not dependent onone single material, but the interaction between them and with the membrane. For instance, Wang andTang [12] demonstrated that mixed proteins led to much less fouling compared to when they presentedindividually. They suggested that the interaction consumes active sites on the molecules when theyare mixed together, which reduces the possibility of interacting with the membrane. Similar resultscan be seen when proteins and polysaccharides are mixed in membrane filtration test [10]. Besidessynergistic effect, the exact property and quantity of the organic nitrogen in the biopolymer fractionneeds to be addressed. In LC-OCD-OND measurement the organic nitrogen is assumed to be fromproteins. However, this has not been quantitatively confirmed because over 40% of organic componentscontaining nitrogen are not proteins [43]. At this point, further research regarding quantifying theexact content of proteins in the biopolymer fraction needs to be conducted. In addition, the causecould also be due to the fluctuation of water chemistry although sampling conditions were regulatedto minimize the influence of precipitation (e.g., variation of conductivity and the concentration ofCa2+ is within 10%, Table 1), fouling-relevant compounds such as Fe was not analyzed. In principle, amulticomponent correlation analysis is required in order to be able to draw definitive conclusions aboutcorrelations between fouling and variables. This should be seriously considered in the further research.
3.4. Fouling Control Using CIP in Pilot Scale Test
Figure 7 shows the permeability recovery using different chemicals when the pilot UF was fouledafter filtering SE and SW. As each test was completed within two days (including filtration and CIP), it
Water 2017, 9, 298 12 of 17
is assumed that the organic fouling, especially biopolymers, contribute mainly to the overall foulingvia gel layer filtration and “gluing” other particles together to the membrane surface [44]. Therefore,CIP test was targeted on cleaning organics. The left side of Figure 7 shows CIP effect of one membranemodule after it was fouled in filtering the SE. In general, the fouling in UF can be largely removedusing sodium hydroxide at pH 12. This is consistent with other studies that NaOH is an effectivereagent removing organic foulants through hydrolyzing and making them more solvable [45]. SomeLC-OCD analysis was conducted and the results show that most of the fouling removed by NaOHare solvable biopolymer-like organics, which was shown in a previously published study [46]. Afterbase cleaning, different CIP chemicals were used to remove the NaOH-resistant foulants. The mosteffective ones are ethanol (100%) and sodium lauryl sulfate (SDS, 2 g/L at pH 12).
Ethanol is able to remove organic foulants [47] due to coexisting a polar end, the hydroxyl groupand a non-polar end, the ethyl group. It is able to dissolve both polar and non-polar compounds.Increasing the content of water in ethanol decreased the effect of cleaning, implying that the removableorganics by ethanol might be hydrophobic in nature and be difficult to be dissolved in pure water. SDSsolution has been widely used in CIP to remove hydrophobic foulants in assisting with other chemicalreagents [45]. Specifically, the nonpolar tail can react with the hydrophobic organic, with the help ofionized tail they can dissolve the organics into water solution. These results imply the NaOH-resistantfoulants in UF of SE could be hydrophobic in nature.
Use of enzymes or H2O2 (Figure 7) to clean the fouled UF after treating the SE was not a successas the permeability was not further improved after NaOH cleaning (Figure 7). It is not surprising thatthe enzymes are not working because these substances can only work on specific proteins under wellcontrolled conditions [45]. The weak performance of H2O2 confirmed the result from a previous studythat H2O2 cannot remove EfOM foulants in UF due to their low oxidation capacity [46].
Water 2017, 9, 298 12 of 17
3.4. Fouling Control Using CIP in Pilot Scale Test
Figure 7 shows the permeability recovery using different chemicals when the pilot UF was fouled after filtering SE and SW. As each test was completed within two days (including filtration and CIP), it is assumed that the organic fouling, especially biopolymers, contribute mainly to the overall fouling via gel layer filtration and “gluing” other particles together to the membrane surface [44]. Therefore, CIP test was targeted on cleaning organics. The left side of Figure 7 shows CIP effect of one membrane module after it was fouled in filtering the SE. In general, the fouling in UF can be largely removed using sodium hydroxide at pH 12. This is consistent with other studies that NaOH is an effective reagent removing organic foulants through hydrolyzing and making them more solvable [45]. Some LC-OCD analysis was conducted and the results show that most of the fouling removed by NaOH are solvable biopolymer-like organics, which was shown in a previously published study [46]. After base cleaning, different CIP chemicals were used to remove the NaOH-resistant foulants. The most effective ones are ethanol (100%) and sodium lauryl sulfate (SDS, 2 g/L at pH 12).
Ethanol is able to remove organic foulants [47] due to coexisting a polar end, the hydroxyl group and a non-polar end, the ethyl group. It is able to dissolve both polar and non-polar compounds. Increasing the content of water in ethanol decreased the effect of cleaning, implying that the removable organics by ethanol might be hydrophobic in nature and be difficult to be dissolved in pure water. SDS solution has been widely used in CIP to remove hydrophobic foulants in assisting with other chemical reagents [45]. Specifically, the nonpolar tail can react with the hydrophobic organic, with the help of ionized tail they can dissolve the organics into water solution. These results imply the NaOH-resistant foulants in UF of SE could be hydrophobic in nature.
Use of enzymes or H2O2 (Figure 7) to clean the fouled UF after treating the SE was not a success as the permeability was not further improved after NaOH cleaning (Figure 7). It is not surprising that the enzymes are not working because these substances can only work on specific proteins under well controlled conditions [45]. The weak performance of H2O2 confirmed the result from a previous study that H2O2 cannot remove EfOM foulants in UF due to their low oxidation capacity [46].
0
50
100
150
200
250
300
350 SW test
SE test
2 g/l SDS (pH 12)
0.1 g/l SDS (pH 12)
2 g/l SDS (pH 12)
Ethanol 10% (pH 12)
Ethanol 50%
Ethanol 100%
200 mg/l H2O2
(pH 12)
50 mg/l Amylase (pH 7)
Perm
eabi
lity
20°
C [l/(m
2 h b
ar)]
50 mg/lProtease (pH 7)
Permeability of clean membrane fouled Membrane CIP I NaOH pH12 CIP II
Figure 7. Cleaning effect of UF membrane fouled during filtering secondary effluent and surface water.
The effect using SDS in cleaning EfOM fouling was not observed when it was used to clean the SW fouling. The permeability was even slightly reduced after SDS cleaning (reproducible results on the right side of Figure 7). This result suggests that the irreversible foulants in UF of SW are of significant difference in character compared to that of the EfOM foulant. Considering that EfOM organic is more hydrophobic (Table 2), it can be imagined that in UF of the SE more hydrophobic
Perm
eabi
lity
[L/m
2 hb
ar@
20º
C]
Figure 7. Cleaning effect of UF membrane fouled during filtering secondary effluent and surface water.
The effect using SDS in cleaning EfOM fouling was not observed when it was used to clean the SWfouling. The permeability was even slightly reduced after SDS cleaning (reproducible results on theright side of Figure 7). This result suggests that the irreversible foulants in UF of SW are of significantdifference in character compared to that of the EfOM foulant. Considering that EfOM organic is morehydrophobic (Table 2), it can be imagined that in UF of the SE more hydrophobic interaction betweenfoulants and the membrane exists than that during UF of the SW. Therefore, capacity of the surfactantcan be fully used in reacting with the EfOM foulants and achieve a promising cleaning effect. Usingthe same amount of SDS for cleaning SW fouling may cause overdose due to the limited amount of
Water 2017, 9, 298 13 of 17
hydrophobic foulants on the membrane. The overdosed SDS can even cover the membrane by bindingthe membrane material instead of the foulants [48,49], and therefore can reduce the permeability ofthe membrane.
3.5. Fouling Control Using In-Line Coagulation in Pilot Scale Tests
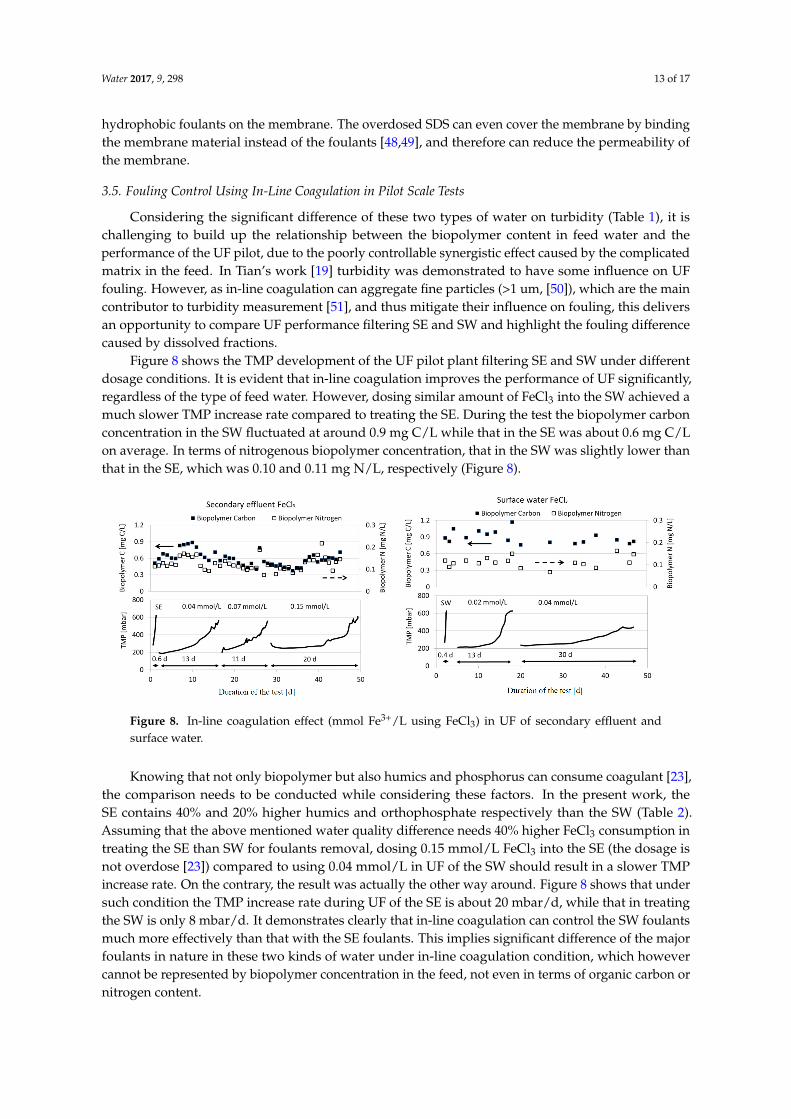
Considering the significant difference of these two types of water on turbidity (Table 1), it ischallenging to build up the relationship between the biopolymer content in feed water and theperformance of the UF pilot, due to the poorly controllable synergistic effect caused by the complicatedmatrix in the feed. In Tian’s work [19] turbidity was demonstrated to have some influence on UFfouling. However, as in-line coagulation can aggregate fine particles (>1 um, [50]), which are the maincontributor to turbidity measurement [51], and thus mitigate their influence on fouling, this deliversan opportunity to compare UF performance filtering SE and SW and highlight the fouling differencecaused by dissolved fractions.
Figure 8 shows the TMP development of the UF pilot plant filtering SE and SW under differentdosage conditions. It is evident that in-line coagulation improves the performance of UF significantly,regardless of the type of feed water. However, dosing similar amount of FeCl3 into the SW achieved amuch slower TMP increase rate compared to treating the SE. During the test the biopolymer carbonconcentration in the SW fluctuated at around 0.9 mg C/L while that in the SE was about 0.6 mg C/Lon average. In terms of nitrogenous biopolymer concentration, that in the SW was slightly lower thanthat in the SE, which was 0.10 and 0.11 mg N/L, respectively (Figure 8).
Water 2017, 9, 298 13 of 17
interaction between foulants and the membrane exists than that during UF of the SW. Therefore, capacity of the surfactant can be fully used in reacting with the EfOM foulants and achieve a promising cleaning effect. Using the same amount of SDS for cleaning SW fouling may cause overdose due to the limited amount of hydrophobic foulants on the membrane. The overdosed SDS can even cover the membrane by binding the membrane material instead of the foulants [48,49], and therefore can reduce the permeability of the membrane.
3.5. Fouling Control Using In-Line Coagulation in Pilot Scale Tests
Figure 8. In-line coagulation effect (mmol Fe3+/L using FeCl3) in UF of secondary effluent and surface water.
Considering the significant difference of these two types of water on turbidity (Table 1), it is challenging to build up the relationship between the biopolymer content in feed water and the performance of the UF pilot, due to the poorly controllable synergistic effect caused by the complicated matrix in the feed. In Tian’s work [19] turbidity was demonstrated to have some influence on UF fouling. However, as in-line coagulation can aggregate fine particles (> 1 um, [50]), which are the main contributor to turbidity measurement [51], and thus mitigate their influence on fouling, this delivers an opportunity to compare UF performance filtering SE and SW and highlight the fouling difference caused by dissolved fractions.
Figure 8 shows the TMP development of the UF pilot plant filtering SE and SW under different dosage conditions. It is evident that in-line coagulation improves the performance of UF significantly, regardless of the type of feed water. However, dosing similar amount of FeCl3 into the SW achieved a much slower TMP increase rate compared to treating the SE. During the test the biopolymer carbon concentration in the SW fluctuated at around 0.9 mg C/L while that in the SE was about 0.6 mg C/L on average. In terms of nitrogenous biopolymer concentration, that in the SW was slightly lower than that in the SE, which was 0.10 and 0.11 mg N/L, respectively (Figure 8).
Knowing that not only biopolymer but also humics and phosphorus can consume coagulant [23], the comparison needs to be conducted while considering these factors. In the present work, the SE contains 40% and 20% higher humics and orthophosphate respectively than the SW (Table 2). Assuming that the above mentioned water quality difference needs 40% higher FeCl3 consumption in treating the SE than SW for foulants removal, dosing 0.15 mmol/L FeCl3 into the SE (the dosage is not overdose [23]) compared to using 0.04 mmol/L in UF of the SW should result in a slower TMP increase rate. On the contrary, the result was actually the other way around. Figure 8 shows that under such condition the TMP increase rate during UF of the SE is about 20 mbar/d, while that in treating the SW is only 8 mbar/d. It demonstrates clearly that in-line coagulation can control the SW foulants much more effectively than that with the SE foulants. This implies significant difference of the major foulants in nature in these two kinds of water under in-line coagulation condition, which however cannot be represented by biopolymer concentration in the feed, not even in terms of organic carbon or nitrogen content.
Figure 8. In-line coagulation effect (mmol Fe3+/L using FeCl3) in UF of secondary effluent andsurface water.
Knowing that not only biopolymer but also humics and phosphorus can consume coagulant [23],the comparison needs to be conducted while considering these factors. In the present work, theSE contains 40% and 20% higher humics and orthophosphate respectively than the SW (Table 2).Assuming that the above mentioned water quality difference needs 40% higher FeCl3 consumption intreating the SE than SW for foulants removal, dosing 0.15 mmol/L FeCl3 into the SE (the dosage isnot overdose [23]) compared to using 0.04 mmol/L in UF of the SW should result in a slower TMPincrease rate. On the contrary, the result was actually the other way around. Figure 8 shows that undersuch condition the TMP increase rate during UF of the SE is about 20 mbar/d, while that in treatingthe SW is only 8 mbar/d. It demonstrates clearly that in-line coagulation can control the SW foulantsmuch more effectively than that with the SE foulants. This implies significant difference of the majorfoulants in nature in these two kinds of water under in-line coagulation condition, which howevercannot be represented by biopolymer concentration in the feed, not even in terms of organic carbon ornitrogen content.
Water 2017, 9, 298 14 of 17
4. Conclusions
The present study investigated the character of organic constituents in the range of biopolymersubstances in two types of typical water sources, and compared their fouling behavior and controllingeffects during the UF process. According to the above-presented results, the following conclusions canbe made.
The organics in the investigated secondary effluent and surface water are of similar sizedistribution pattern. With respect to the biopolymer fraction, the secondary effluent macromoleculescontain more protein-like substances than the surface water biopolymers, evidenced by a lower C/Nratio compared to that from surface water biopolymers.
Under the conditions applied in the present work, the secondary effluent biopolymerdemonstrated a higher fouling potential than that of the investigated surface water samples in general.However, the content of nitrogenous biopolymer cannot be used as a generic indicator representingthe fouling potential of different water types due to the lack of quantitatively reliable relation withfouling severity.
The concentration and component of biopolymers in the investigated waters varies seasonally.While that in the secondary effluent increases from summer to winter and reaches a maximum inthe cold season, biopolymer content in the present surface water decreases during the same periodand achieves the lowest value in winter. Compared to a relatively stable C/N ratio in the secondaryeffluent biopolymer fraction, the ratio in the surface water fluctuates significantly, increasing to amaximum in summer and decreasing afterwards.
NaOH and sodium lauryl sulfate (2 g/L at pH 12) have been shown as effective chemical cleaningreagents recovering the permeability of a UF membrane after filtering the secondary effluent. Sodiumlauryl sulfate shows no effect in cleaning UF membranes fouled by the investigated surface waterorganics, implying that the foulants in the surface water may have higher hydrophilicity compared tothat in the secondary effluent.
In-line coagulation using FeCl3 is demonstrated to be an effective procedure controlling foulingin UF of secondary effluent and surface water. Under comparable biopolymer concentrations in thefeed water, in-line coagulation is more effective in controlling fouling in UF of the surface water thantreating the secondary effluent.
Acknowledgments: The investigations and preparation of the article were conducted within the research project“Sustainable water concept and its application for the Olympic Games 2008–Phase II” (02 WA 1016) supported byFederal Ministry of Education and Research (BMBF, Germany) and State Key Laboratory Base of Eco-HydraulicEngineering in Arid Area (104-438016024) which are highly acknowledged.
Author Contributions: Xing Zheng and Martin Jekel conceived and designed the experiments;Frederik Zietzschmann, Stephan Plume and Hendrik Paar performed the experiments; Xing Zheng, Mathias Ernstand Martin Jekel analyzed the data; Xing Zheng, Frederik Zietzschmann, Stephan Plume and Hendrik Paarcontributed reagents/materials/analysis tools; and Xing Zheng, Zi Wang and Mathias Ernst wrote the paper.
Conflicts of Interest: The authors declare no conflict of interest.
References
1. Amy, G. Fundamental understanding of organic matter fouling of membranes. Desalination 2008, 231, 44–51.[CrossRef]
2. Zheng, X.; Khan, M.T.; Croué, J.P. Contribution of effluent organic matter (EfOM) to ultrafiltration (UF)membrane fouling: Isolation, characterization, and fouling effect of EfOM fractions. Water Res. 2014, 65,414–424. [CrossRef] [PubMed]
3. Myat, D.T.; Stewart, M.B.; Mergen, M.; Zhao, O.; Orbell, J.D.; Gray, S. Experimental and computationalinvestigations of the interactions between model organic compounds and subsequent membrane fouling.Water Res. 2014, 48, 108–118. [CrossRef] [PubMed]
4. Kimura, K.; Tanaka, K.; Watanabe, Y. Microfiltration of different surface waters with/without coagulation:Clear correlations between membrane fouling and hydrophilic biopolymers. Water Res. 2014, 49, 434–443.[CrossRef] [PubMed]
5. Hallé, C.; Huck, P.M.; Peldszus, S.; Haberkamp, J.; Jekel, M. Assessing the performance of biological filtrationas pretreatment to low pressure membranes for drinking water. Environ. Sci. Technol. 2009, 43, 3878–3884.[PubMed]
6. Jiang, T.; Kennedy, M.D.; Schepper, V.D.; Nam, S.N.; Nopens, I.; Vanrolleghem, P.A.; Amy, G. Characterizationof soluble microbial products and their fouling impacts in membrane bioreactors. Environ. Sci. Technol. 2010,44, 6642–6648. [CrossRef] [PubMed]
8. Ni, B.J.; Rittmann, B.E.; Yu, H.Q. Soluble microbial products and their implications in mixed culturebiotechnology. Trends Biotechnol. 2011, 29, 454–463. [CrossRef] [PubMed]
9. Contreras, A.E.; Steiner, Z.; Miao, J.; Kasher, R.; Li, Q. Studying the role of common membrane surfacefunctionalities on adsorption and cleaning of organic foulants using QCM-D. Environ. Sci. Technol. 2011, 45,6309–6315. [CrossRef] [PubMed]
10. Jermann, D.; Pronk, W.; Meylan, S.; Boller, M. Interplay of different NOM fouling mechanisms duringultrafiltration for drinking water production. Water Res. 2007, 41, 1713–1722. [CrossRef] [PubMed]
11. Haberkamp, J.; Ernst, M.; Böckelmann, U.; Szewzyk, U.; Jekel, M. Complexity of ultrafiltration membranefouling caused by macromolecular dissolved organic compounds in secondary effluents. Water Res. 2008, 42,3153–3161. [CrossRef] [PubMed]
12. Wang, Y.N.; Tang, C.Y. Fouling of nanofiltration, reverse osmosis, and ultrafiltration membranes by proteinmixtures: The role of inter-foulant-species interaction. Environ. Sci. Technol. 2011, 45, 6373–6379. [CrossRef][PubMed]
13. Kim, H.C.; Dempsey, B.A. Membrane fouling due to alginate, SMP, EfOM, humic acid, and NOM.J. Membr. Sci. 2013, 428, 190–197. [CrossRef]
14. Leenheer, J.A. Systematic Approaches to Comprehensive Analyses of Natural Organic Matter.Ann. Environ. Sci. 2009, 3, 1–130.
15. Passow, U.; Shipe, R.F.; Murray, A.; Pak, D.K.; Brzezinski, M.A.; Alldredge, A.L. The origin of transparentexopolymer particles (TEP) and their role in the sedimentation of particulate matter. Cont. Shelf Res. 2001, 21,327–346. [CrossRef]
16. Passow, U. Transparent exopolymer particles (TEP) in aquatic environments. Prog. Oceanogr. 2002, 55,287–333. [CrossRef]
17. Meng, S.; Liu, Y. Alginate block fractions and their effects on membrane fouling. Water Res. 2013, 47,6618–6627. [CrossRef] [PubMed]
18. Susanto, H.; Arafat, H.; Janssen, E.M.L.; Ulbricht, M. Ultrafiltration of polysaccharide-protein mixtures:Elucidation of fouling mechanisms and fouling control by membrane surface modification. Sep. Purif. Technol.2008, 63, 558–565. [CrossRef]
19. Tian, J.Y.; Ernst, M.; Cui, F.; Jekel, M. Correlations of relevant membrane foulants with UF membrane foulingin different waters. Water Res. 2013, 47, 1218–1228. [CrossRef] [PubMed]
20. Huang, H.; Lee, N.; Young, T.; Gary, A.; Lozier, J.C.; Jacangelo, J.G. Natural organic matter fouling oflow-pressure, hollow-fiber membranes: Effects of NOM source and hydrodynamic conditions. Water Res.2007, 41, 3823–3832. [CrossRef] [PubMed]
21. Li, S.; Heijman, S.G.J.; Verberk, J.Q.J.C.; Le Clech, P.; Lu, J.; Kemperman, A.J.B.; Amy, G.L.; van Dijk, J.C.Fouling control mechanisms of demineralized water backwash: Reduction of charge screening and calciumbridging effects. Water Res. 2011, 45, 6289–6300. [CrossRef] [PubMed]
22. Nguyen, A.H.; Tobiason, J.E.; Howe, K.J. Fouling indices for low pressure hollow fiber membraneperformance assessment. Water Res. 2011, 45, 2627–2637. [CrossRef] [PubMed]
23. Zheng, X.; Plume, S.; Ernst, M.; Croué, J.P.; Jekel, M. In-line coagulation prior to UF of treated domesticwastewater-foulants removal, fouling control and phosphorus removal. J. Membr. Sci. 2012, 129–139.[CrossRef]
24. Zheng, X.; Ernst, M.; Huck, P.M.; Jekel, M. Biopolymer fouling in dead-end ultrafiltration of treated domesticwastewater. Water Res. 2010, 44, 5212–5221. [CrossRef] [PubMed]
25. Huber, S.A.; Balz, A.; Abert, M.; Pronk, W. Characterisation of aquatic humic and non-humic matterwith size-exclusion chromatography-organic carbon detection-organic nitrogen detection (LC-OCD-OND).Water Res. 2011, 45, 879–885. [CrossRef] [PubMed]
26. Henderson, R.K.; Baker, A.; Murphy, K.R.; Hambly, A.; Stuetz, R.M.; Khan, S.J. Fluorescence as a potentialmonitoring tool for recycled water systems: A review. Water Res. 2009, 43, 863–881. [CrossRef] [PubMed]
27. Van den Brink, P.; Zwijnenburg, A.; Smith, G.; Temmink, H.; van Loosdrecht, M. Effect of free calciumconcentration and ionic strength on alginate fouling in cross-flow membrane filtration. J. Membr. Sci. 2009,345, 207–216. [CrossRef]
28. Koo, C.H.; Mohammad, A.W.; Suja, F.; Meor Talib, M.Z. Review of the effect of selected physicochemicalfactors on membrane fouling propensity based on fouling indices. Desalination 2012, 287, 167–177. [CrossRef]
29. Zheng, X.; Ernst, M.; Jekel, M. Pilot-scale investigation on the removal of organic foulants in secondaryeffluent by slow sand filtration prior to ultrafiltration. Water Res. 2010, 44, 3203–3213. [CrossRef] [PubMed]
30. Zietzschmann, F.; Ernst, M.; Godehardt, M.; Paar, H.; Zheng, X.; Jekel, M. Linking UF reversibleand irreversible fouling to the water quality of surface water and treated municipal wastewater.Desalin. Water Treat. 2014, 52, 7598–7608.
31. Peiris, R.H.; Hallé, C.; Budman, H.; Moresoli, C.; Peldszus, S.; Huck, P.M.; Legge, R.L. Identifying foulingevents in a membrane-based drinking water treatment process using principal component analysis offluorescence excitation-emission matrices. Water Res. 2010, 44, 185–194. [CrossRef] [PubMed]
32. Xiao, K.; Wang, X.M.; Huang, X.; Waite, T.D.; Wen, X.H. Analysis of polysaccharides, protein and humic acidretention by microfiltration membranes using Thomas’ dynamic adsorption model. J. Membr. Sci. 2009, 342,22–34. [CrossRef]
33. Barker, D.J.; Stuckey, D.C. A review of soluble microbial products (SMP) in wastewater treatment systems.Water Res. 1999, 33, 3063–3082. [CrossRef]
34. Heinonen, K.B.; Ward, J.E.; Holohan, B.A. Production of transparent exopolymer particles (TEP) by benthicsuspension feeders in coastal systems. J. Exp. Mar. Biol. Ecol. 2007, 341, 184–195. [CrossRef]
35. Chrzanowski, T.H.; Kyle, M.; Elser, J.J.; Sterner, R.W. Element ratios and growth dynamics of bacteria in anoligotrophic Canadian shield lake. Aquat. Microb. Ecol. 1996, 11, 119–125. [CrossRef]
36. Westerhoff, P.; Rodriguez-Hernandez, M.; Baker, L.; Sommerfeld, M. Seasonal occurrence and degradationof 2-methylisoborneol in water supply reservoirs. Water Res. 2005, 39, 4899–4912. [CrossRef] [PubMed]
37. Vrede, K.; Heldal, M.; Norland, S.; Bratbak, G. Elemental composition (C, N, P) and cell volume ofexponentially growing and nutrient-limited bacterioplankton. Appl. Environ. Microbiol. 2002, 68, 2965–2971.[CrossRef] [PubMed]
38. Haberkamp, J. Organic membrane fouling in ultrafiltration of treated domestic wastewater: Causes,mechanisms and methods to reduce. Ph.D. Thesis, Technical University of Berlin, Berlin, German, 2008.
39. Ho, C.C.; Zydney, A.L. Protein fouling of asymmetric and composite microfiltration membranes. Ind. Eng.Chem. Res. 2001, 40, 1412–1421. [CrossRef]
40. Ye, Y.; Le Clech, P.; Chen, V.; Fane, A.G. Evolution of fouling during crossflow filtration of model EPSsolutions. J. Membr. Sci. 2005, 264, 190–199. [CrossRef]
42. Yangali-Quintanilla, V.A.; Holm, A.H.; Birkner, M.; D’Antonio, S.; Stoltze, H.W.C.; Ulbricht, M.; Zheng, X.A fast and reliable approach to benchmark low pressure hollow fibre filtration membranes for waterpurification. J. Membr. Sci. 2016, 499, 515–525. [CrossRef]
43. Westgate, P.J.; Park, C. Evaluation of proteins and organic nitrogen in wastewater treatment effluents.Environ. Sci. Technol. 2010, 44, 5352–5357. [CrossRef] [PubMed]
44. Wang, X.M.; Waite, T.D. Gel layer formation and hollow fiber membrane filterability of polysaccharidedispersions. J. Membr. Sci. 2008, 322, 204–213. [CrossRef]
45. Regula, C.; Carretier, E.; Wyart, Y.; Gésan-Guiziou, G.; Vincent, A.; Boudot, D.; Moulin, P. Chemicalcleaning/disinfection and ageing of organic UF membranes: A review. Water Res. 2014, 56, 325–365.[CrossRef] [PubMed]
46. Zheng, X.; Ernst, M.; Jekel, M. Stabilizing the performance of ultrafiltration in filtering tertiaryeffluent-Technical choices and economic comparisons. J. Membr. Sci. 2011, 366, 82–91. [CrossRef]
47. Tian, J.Y.; Chen, Z.L.; Yang, Y.L.; Liang, H.; Nan, J.; Li, G.B. Consecutive chemical cleaning of fouledPVC membrane using NaOH and ethanol during ultrafiltration of river water. Water Res. 2010, 44, 59–68.[CrossRef] [PubMed]
48. Kingma, A.J. Compatibility of nonionic surfactants with membrane materials and their cleaning performance.Food Bioprod. Process. 2015, 93, 304–309. [CrossRef]
49. Chen, P.; Zhong, Z.; Liu, F.; Xing, W. Cleaning ceramic membranes used in treating desizing wastewaterwith a complex-surfactant SDBS-assisted method. Desalination 2015, 365, 25–35. [CrossRef]
50. Pearce, G.K. UF/MF Membrane Water Treatment: Principles and Design; Water Treatment Academy: Bangkok,Thailand, 2011.
51. He, W.P.; Nan, J. Study on the impact of particle size distribution on turbidity in water. Desalin. Water Treat.2012, 41, 26–34. [CrossRef]


![Explaining brightness illusions using spatial filtering · PDF fileExplaining brightness illusions using spatial filtering ... 1979, 413]. Our models extend Blakeslee and McCourt](https://static.documents.pub/doc/80x56/5aa3e2e07f8b9a07758ed3b1/explaining-brightness-illusions-using-spatial-ltering-brightness-illusions.jpg)


