Ultrasonic characterization of Ultrasonic characterization of inertial confinement fusion targets inertial confinement fusion targets KSM EDITED VERSION KSM EDITED VERSION High Average Power Laser (HAPL) Program Meeting October 27-28, 2004 Princeton Plasma Physics Laboratory Princeton, New Jersey, USA L.J. Bond a , M.S. Good a and D. Schroen b a Pacific Northwest National Laboratory Pacific Northwest National Laboratory Richland, Washington, USA Richland, Washington, USA b Schafer Corporation, Livermore, California, USA Schafer Corporation, Livermore, California, USA
Transcript
Ultrasonic characterization of inertial Ultrasonic characterization of inertial confinement fusion targetsconfinement fusion targets
KSM EDITED VERSIONKSM EDITED VERSION
High Average Power Laser (HAPL) Program MeetingOctober 27-28, 2004
Princeton Plasma Physics LaboratoryPrinceton, New Jersey, USA
L.J. Bonda, M.S. Gooda and D. Schroenb
aaPacific Northwest National LaboratoryPacific Northwest National LaboratoryRichland, Washington, USARichland, Washington, USA
bbSchafer Corporation, Livermore, California, USASchafer Corporation, Livermore, California, USA
RECENT ACTIVITIES:RECENT ACTIVITIES:Data taken on TPX Foam Cylinders and DVB Foam Spherical ShellGas-coupled: Initial 1-D scanned Images from TPX Foam SamplesWater-coupled: Preliminary data to characterize DVB Foam Spherical Shell Capsules just after gellation Measure wall thickness and concentricity Proposed Technique: Use 50-MHz transducer array Benefit: ultrasonic technique would eliminate multiple
chemical exchanges required by the current optical technique, expedite production, and significantly reduce the solvent waste stream.
High Pressure Gas CoupledUltrasound (HPGCU) SystemHigh Pressure Gas CoupledUltrasound (HPGCU) System
A.A. Pressurized Pressurized Gas CylinderGas CylinderB. Pressure Vessel B. Pressure Vessel C. C. Pressure Pressure GageGage ReadRead Out Out D.D. Ultrasonic Ultrasonic ElectronicsElectronicsE.E. Data Cables to Data Cables to
ComputerComputerF.F. Motor ControllerMotor ControllerG.G. Motor InterfaceMotor InterfaceH. Camera MonitorH. Camera Monitor
of Scanner within of Scanner within Pressure VesselPressure Vessel
AABB
CC
DDDD DD
EE
FF
GGHH
Components within Pressure VesselComponents within Pressure VesselComponents within Pressure VesselComponents within Pressure Vessel
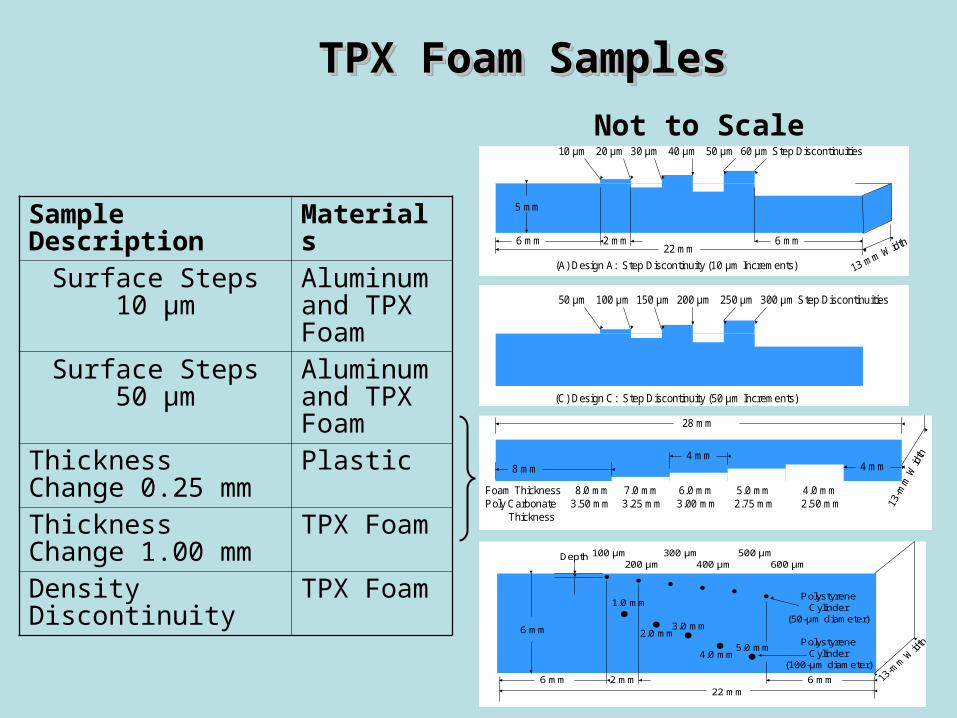
Foam Thickness 8.0 mm 7.0 mm 6.0 mm 5.0 mm 4.0 mmPoly Carbonate 3.50 mm 3.25 mm 3.00 mm 2.75 mm 2.50 mm
Thickness
28 mm
8 mm 4 mm
100 µm 300 µm 500 µm200 µm 400 µm 600 µm
2 mm22 mm
6 mm
●● ● ● ●
●
Polystyrene Cylinder
(50-µm diameter)●
●
●●
●Polystyrene
Cylinder(100-µm diameter)
1.0 mm
Depth
2.0 mm3.0 mm
4.0 mm5.0 mm
6 mm 6 mm
Not to Scale
Preliminary Data to Characterize DVB Foam Preliminary Data to Characterize DVB Foam Spherical Shell Capsules After Gellation:Spherical Shell Capsules After Gellation:
Thickness Measurement (WATER COUPLED)
Preliminary Data to Characterize DVB Foam Preliminary Data to Characterize DVB Foam Spherical Shell Capsules After Gellation:Spherical Shell Capsules After Gellation:
Excellent resolution exists to quantify thicknessClassic phase reversal pattern exists between responses Outer Surface: Water to
DVB saturated with water Inner Surface: DVB
saturated with water to water
High confidence exists in signal interpretation.
Amplitude (Screen Height Percent)
Peak Frequency:
37 MHz
DVB Spherical Shell
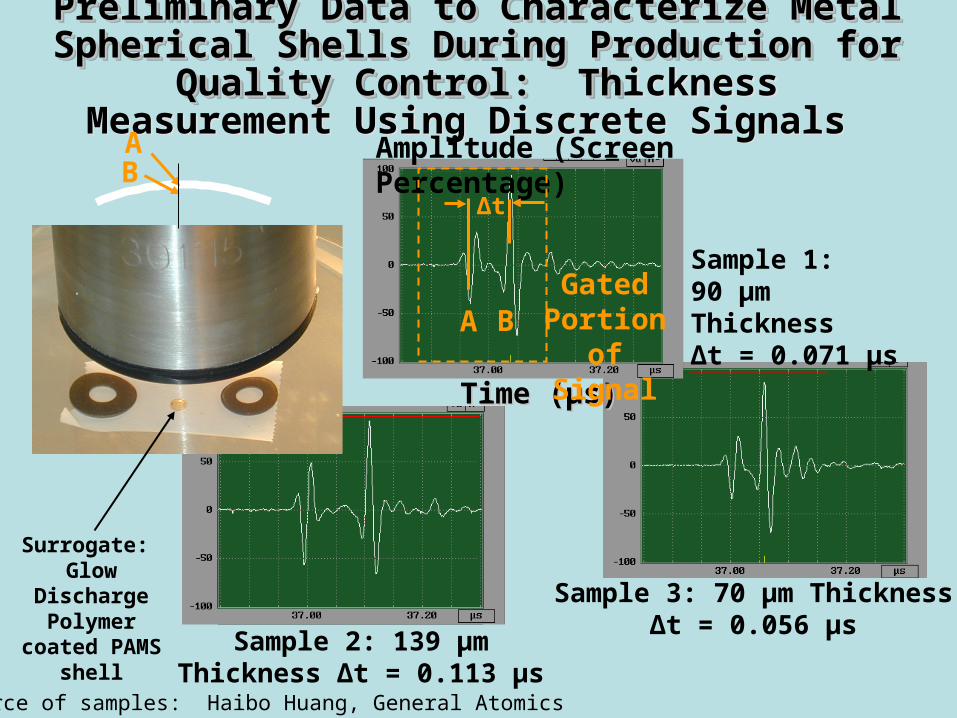
Preliminary Data to Characterize Metal Spherical Preliminary Data to Characterize Metal Spherical Shells During Production for Quality Control: Shells During Production for Quality Control:
ThThickness Measurement Using Discrete Signals
Preliminary Data to Characterize Metal Spherical Preliminary Data to Characterize Metal Spherical Shells During Production for Quality Control: Shells During Production for Quality Control:
ThThickness Measurement Using Discrete Signals AB
Amplitude (Screen Percentage)
Time (Time (µsµs))
A BGated
Portion of Signal
Δt
Sample 1:90 µm ThicknessΔt = 0.071 µs
Sample 2: 139 µm Thickness Δt = 0.113 µs
Sample 3: 70 µm ThicknessΔt = 0.056 µs
Source of samples: Haibo Huang, General Atomics
Surrogate: Glow Discharge Polymer coated
PAMS shell
Preliminary Data to Characterize Metal Spherical Preliminary Data to Characterize Metal Spherical Shells During Production for Quality Control: Shells During Production for Quality Control: ThThickness Measurement Using Spectroscopy
Preliminary Data to Characterize Metal Spherical Preliminary Data to Characterize Metal Spherical Shells During Production for Quality Control: Shells During Production for Quality Control: ThThickness Measurement Using Spectroscopy
Amplitude (Screen Percentage)
Frequency (MHz)
Amplitude Spectrum of Gated Signal
Δf = 1/Δt
Δf
Sample 1:90 µm Thickness
Sample 2: 139 µm Thickness
Sample 3: 70 µm Thickness
Source of samples: Haibo Huang, General Atomics
ConclusionsConclusions
Acoustic microscopy has unique characterization capabilities for two critical steps in the target fabrication production facility.It can characterize gelled (opaque) foam shells without solvent exchanges to an indexed mated solvent. Optical characterization requires an exchange from isopropanol and future processing steps require an exchange back to isopropanol. Ultrasonic characterization eliminates two solvent exchange steps with the time and solvent waste associated with them. It can characterize layered targets in both room temperature and a cryogenic environment. Ultrasonic characterization could be done just prior to injection to decrease the number of shells that do not produce high yield.
ReferencesReferencesReferencesReferences
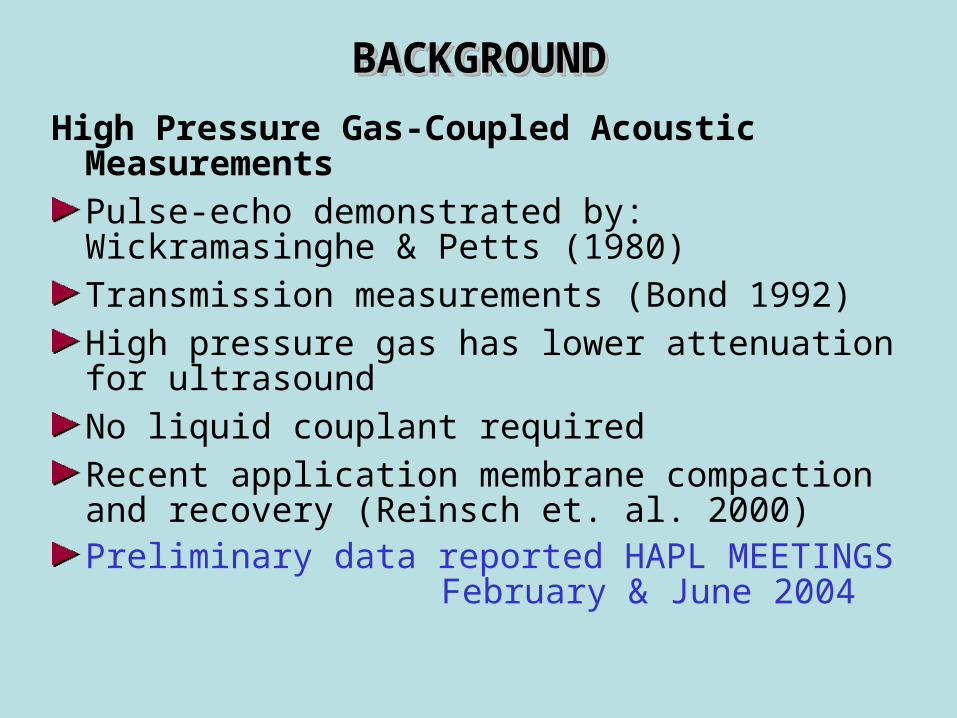
Bond, L.J. (1992) Through transmission gas and pulsed water-coupled microscopy of electronic packaging and composite materials. Report to NIST, University of Colorado at Boulder.
Reisch, V.E., Greenberg, A.R., Kelley, S.S., Peterson, R. and Bond, L.J. (2000) “A new technique for the simultaneous real-time measurement of membrane compaction and performance during exposure to high-pressure gas.” J. Membrane Science 171 pp. 217-228.
Wickramasinghe, H.K. and Petts, C.R. (1980) Gas medium acoustic microscopy, in Scanning Image Microscopy, ed. E.A. Ash, Academic Press (London) pp. 57-70.
For more information contact:For more information contact:
Leonard J. Bond, Ph.D.Leonard J. Bond, Ph.D.Laboratory FellowLaboratory FellowPacific Northwest National LaboratoryPacific Northwest National LaboratoryP.O. Box 999, K5-26P.O. Box 999, K5-26Richland, WA 99352Richland, WA 99352email: email: [email protected]: 509-375-4486Phone: 509-375-4486
Morris S. Good, Ph.D.Morris S. Good, Ph.D.Staff Scientist and EngineerStaff Scientist and EngineerPacific Northwest National LaboratoryPacific Northwest National LaboratoryP.O. Box 999, K5-26P.O. Box 999, K5-26Richland, WA 99352Richland, WA 99352email: email: [email protected]: 509-375-2529Phone: 509-375-2529