76
NISTIR 6975 Ultrasonic evaluation methods applicable to polymer concrete composites 5 10 15 20 25 30 35 5 10 15 20 25 30 35 Andrzej Garbacz Edward J. Garboczi
| Date post: | 13-Jul-2018 |
| Category: |
Documents |
| Upload: | truonghuong |
| View: | 221 times |
| Download: | 0 times |

NISTIR 6975
Ultrasonic evaluation methodsapplicable to polymer concretecomposites
5
10
15
20
25
30
35
5 10 15 20 25 30 35
Andrzej GarbaczEdward J. Garboczi

NISTIR 6975
Ultrasonic evaluation methodsapplicable to polymer concrete
composites
Andrzej GarbaczWarsaw University of Technology
Warsaw, Poland
Edward J. GarbocziMaterials and Construction Research Division
Building and Fire Research Laboratory
April 2003
U.S. DEPARTMENT OF COMMERCEDonald L. Evans, Secretary
TECHNOLOGY ADMINISTRATIONPhillip J. Bond, Under Secretary of Commerce for Technology
NATIONAL INSTITUTE OF STANDARDS AND TECHNOLOGYArden L. Bement, Jr., Director
III
EXECUTIVE SUMMARY
This publication is the final report on the three-year project entitled "Ultrasonic evaluationmethods applicable to polymer concrete composites." The project was sponsored by theM.Skłodowska-Curie US-Polish Joint Fund II. The project was collaboratively carried out by theNational Institute of Standards and Technology (NIST), Gaithersburg, MD, USA and the Instituteof Construction Engineering and Management (ICEM), Warsaw University of Technology,Warsaw, Poland. Edward J. Garboczi (NIST) and Andrzej Garbacz (ICEM, from Prof. LechCzarnecki’s Building Polymer Composites Group), were the principal investigators.
The main objective of the project was to evaluate the possibility of implementing ultrasonicmethods for the nondestructive assessment of polymer composite properties. The two main fieldsof polymer composite applications, anticorrosion protection of concrete structures (includingindustrial floors) and polymer concrete pre-cast elements, were both taken into account. Thepossibility of nondestructive evaluation of the quality of multi-layer repair systems, includingadhesion mapping, has arisen as the most interesting result of the project. The design of theexperimental program was developed by the principal investigators, and was carried out at theICEM laboratories. NIST also collaborated in the interpretation of the test results and preparationof the report.

IV
ACKNOWLEDGEMENTS
The authors would like to thank Prof. Lech Czarnecki for inspiration, remarks and discussionduring preparation of this report. Marek Łuciuk and Mikołaj Krystosiak have prepared theirMaster Theses during the realization of this M.Skłodowska-Curie US-Polish Joint Fund IIproject.
Cover: industrial epoxy concrete floor and an example of adhesion mapping of a polymerconcrete on top of portland cement concrete using an ultrasonic pulse velocitymethod

V
ABSTRACT
Polymer composites (PC) appear as useful materials for repair and protection of buildingstructures, as well as for manufacturing precast elements. In the case of pre-cast elements, aswell as repair materials, the usefulness and durability of polymer composites depend on theselection of the material composition for obtaining the composite with controllable properties.This task is a material design and optimization procedure. For repairs and protective coatings, themain problem is good bonding between PC composites and concrete substrate for the length oftime desired. In both cases, there is a need for quality control (verification tests) and diagnostictests during structural service as well. This is available using destructive or semi-destructive tests.Such a way of testing, however, is expensive and of limited usability due to its destructivecharacter. Therefore, the development of nondestructive assessment methods for polymercomposites is an important need. Ultrasonic methods are among the most common nondestructivetechniques used in material science and industry. Ultrasonic methods are well-known andstandardized towards traditional building materials: metals, cement concrete, and rocks. In thecase of polymer concrete composites, ultrasonic methods are at the introductory stage.
The results of the project confirmed the usefulness of ultrasonic methods fornondestructive evaluation of polymer concrete composites in various applications. The pulsevelocity method can be used for evaluation of the properties and homogeneity of the pre-castelements made from polymer concrete as well as for evaluation of adhesion in the multi-layerPC-CC systems (adhesion mapping). The ultrasonic echo method can be used as acomplementary method for nondestructive estimation of PC layer thickness.
Results of the project are presented in this report. The appendix contains a list of the eightpublications that were presented during international and domestic conferences and published inproceedings and journals. The results are in general accord with worldwide scientific andengineering activities in nondestructive quality control of repair, e.g. Guide for evaluation ofconcrete structures prior to rehabilitation, ACI 364.1R-94, 2001; the family of European standards1504: Products and systems for the protection and repair of concrete structure; and activities ofRILEM Technical Committees: TC-151 "Adhesion Technology in Concrete Engineering – Physicaland Chemical Aspects" and TC-184 IFE "Industrial floors for withstanding harsh environmentalattacks, including repair and maintenance".

VI

VII
TABLE OF CONTENTS
1. INTRODUCTION2. NONDESTRUCTIVE TEST METHODS APPLICABLE TO CONCRETE-LIKE
COMPOSITES3. CHARACTERISTIC OF THE ULTRASONIC TESTING
3.1. Characteristic of the ultrasonic waves3.2. Attenuation of the ultrasonic wave3.3. Methods used in the ultrasonic measurement technique3.4. Application of ultrasonic methods for the concrete testing
4. GENERAL APPROACH FOR ULTRASONIC EVALUATION OF POLYMER CONCRETECOMPOSITES
5. EVALUATION OF TECHNICAL PROPERTIES OF POLYMER CONCRETE ELEMENTS5.1. Experimental procedure5.2. Ultrasonic evaluation of selected technical properties of vinyl ester concrete
5.2.1. Materials5.2.2. Results5.2.3. Relationship between microstructure and ultrasonic waves propagation
5.3. Ultrasonic estimation of selected properties of epoxy concrete5.3.1. Material and results5.3.2. Discussion of results5.3.3. Analysis of relationship between microstructure and ultrasonic wave propagation
5.4. Conclusions concerning ultrasonic evaluation of elements made from polymer concrete6. ULTRASONIC EVALUATION OF MULTILAYER REPAIR SYSTEMS
6.1. Approach to evaluation of multi-layer repair systems6.2. Evaluation of the multi-layer system with ultrasonic echo method
6.2.1. Procedure of the ultrasonic testing6.2.2. Materials6.2.3. Determination of adhesion6.2.4. Results of testing using echo method6.2.5. Results of testing using echo method
6.3. Evaluation of multi-layer system with pulse velocity method6.3.1. Ultrasonic test procedure6.3.2. Materials and testing floor systems6.3.3. Ultrasonic evaluation of adhesion at boundary conditions6.3.4. The effect of chemical composition and geometry of polymer coating6.3.5. Relationship between pull-off strength and ultrasonic parameters6.3.6. Ultrasonic detection of defects in PC-CC system
6.4. Conclusions concerning the ultrasonic evaluation of the multi-layer PC-CC system7. SUMMARY AND CONCLUSIONS8. REFERENCES
ENCLOSURE - List of publications involved with the activity on the project

VIII

1. INTRODUCTION
Polymer composites (PC) are useful materials for repair and protection of building structures, as well asfor the manufacturing of pre-cast elements. There are various fields of applications for these materials[1-4]:- repair, maintenance and anti-corrosion protection (protective and decorative coatings) of building
structures,- flooring, mainly industrial floors, but also floors in hospital and school buildings, sport arenas and
other community structures,- polymer concrete precast elements, like manholes, pipes and slabs as well as chemical resistant
vessels, e.g. electrolytic cells.In the case of pre-cast elements and repair materials, the usefulness and durability of polymer
composites depend on the selection of the material composition for obtaining composites withcontrollable properties. This task is a material design and optimization procedure [5,6]. For repairsand protective coatings, the main issue is good bonding between PC composites and cementconcrete substrates, including the effect of time. In both cases, there is a need for quality control(verification tests) and diagnostic tests during structural service as well. This is available usingdestructive or semi-destructive tests, e.g. determination of compressive strength on samples coredfrom structure or determination of bonding with the pull-off method. Such a way of testing,however, is expensive and of limited usability due to its destructive character as well as becauseinformation obtained is only local. Therefore, the development of nondestructive assessmentmethods for polymer composites is an important need [7,8]. Ultrasonic methods are among the mostcommon nondestructive techniques used in material science and industry [9,10]. Ultrasonic methodsare well-known and standardized for traditional building materials, like metals [11], cement concrete[12-14], and rocks [15,16]. In the case of polymer concrete composites, ultrasonic methods are at theintroductory stage [17,18]. The aim of the project was analysis of the usability of ultrasonic methods for assessment of PCproperties in various applications.
2. NONDESTRUCTIVE TEST METHODS APPLICABLE TO CONCRETE-LIKECOMPOSITES
Nondestructive test (NDT) methods are commonly used for quality control of various constructionelements [11]. The development of NDT methods is important from a technical and an economicalpoint of view. Contrary to destructive methods, NDT techniques give information about materialproperties without deteriorating material microstructure and serviceability. The main advantages ofNDT methods are: the possibility of on-site evaluation, repeatability at the same place during structuralservice, and quick test results.
By comparison to other construction materials like steel, the development of NDT methods forconcrete-like composites has progressed at a slower pace because these kind of composites are difficultto test [10]. Concrete is heterogeneous, intrinsically conductive (because the pore solution is an ionicelectrolyte), and also usually contains steel reinforcement. For these reasons, NDT techniques used withmetals are not easy to implement for concrete and similar composites. Since it is difficult to apply toconcrete some of the techniques used with metals, alternative NDT methods have been considered.
Recently, the development of NDT techniques applicable to concrete has become of interest.This has resulted from an increase in quality requirements for concrete in new construction. On theother hand, the percentage of repair and rehabilitation in the total building market has increased. Theestimated cost of repair and rehabilitation in the US and Canada during the next 20 years is equal to$1 · 1012 to $3 · 1012 (USD) or about 15 % to 50 % of the total North American building market

2
[19]. The situation in the Polish building market is similar but is actually closer to the upperpercentage limit. The evaluation of structures prior to repair, a proper selection of repair materials,and quality control of the repairs should be done to assure the effectiveness of the repair process[20]. Many institutions are involved with elaboration of repair guidelines [21,22]. This indicates theimportance of repair issues. The European Standardization Committee CEN/TC104 has beenworking on the family of standards EN 1504 under the common title “Products and systems for theprotection and repair of concrete structure." The guidelines for structural evaluation prior to therepair and quality control after repair are important part of standards [22]. In 1999, ACI TechnicalCommittee 364 - Rehabilitation has elaborated guidelines for evaluation of concrete structures priorto rehabilitation [23]. In Poland, procedures of concrete structure evaluation are given in the PolishStandard PN-88/B-01807 “Anticorrosion protection of building structures. Concrete and reinforcedconcrete structures. Evaluation procedures” [24], and in the Guidelines of Building ResearchInstitute 361/99 "Guide for evaluation of safety of reinforced concrete structures" [25]. NDTmethods play an important role in evaluating concrete structure and in quality control of repairwork. Recently, the RILEM Technical Committee, "Non-destructive evaluation of concretestructures," has been created. The main task of this Committee is an elaboration of the guidelines forNDT evaluation of concrete structures and the promotion of a wider use of NDT techniques inpractical applications. The progress in this field has been made in the US. The review of differentNDT methods applicable to concrete structures (Table 1) was given in the Report of ACI TechnicalCommittee 228 – Non-Destructive Testing of Concrete [26], in which the capabilities, limitationsand potential application of various NDT methods were presented. The ACI Reports ACI 364.1R-94and ACI 228.2R-98 have been published together in 1999 as “The Concrete Repair Manual.”
NDT methods are applied to concrete structures for four main reasons [26]:- quality control of new structures,- unexpected problems with new construction,- evaluation of existing structures, including evaluation prior to repair,- quality control of concrete repair.
In general, considering the measured parameters, NDT methods can be divided into thefollowing categories [9,10]:
- rebound hammer,- acoustic methods – stress wave propagation (ultrasound, acoustic emission, impact-echo,
etc.),- radiation methods (X-ray, gamma ray, neutron emission, etc.),- electromagnetic methods,- others – e.g. infrared thermography.
Another classification takes into account the aim of nondestructive evaluation. Two main categoriescan be recognized [10]:
- evaluation of concrete strength and its homogeneity (e.g. rebound hammer, ultrasonic pulsevelocity),
- evaluation of structural integrity – detection of various types of defect in concrete, detectionand evaluation of steel reinforcement (e.g. visual inspection, stress wave propagation,impact-echo, infrared thermography, radiation methods, electromagnetic methods).
Among various NDT techniques, ultrasonic methods, especially the ultrasonic pulse velocitymethod, are still commonly used for the evaluation of concrete structures.

3
Table 1. Nondestructive methods for evaluation of concrete structures [9,10,12,26].
Rebound hammer Example of application:
− evaluation of homogeneity or consistency ofcompressive strength of concrete structure,
− monitoring strength gain
Scheme of method:
Principle:Measurement of rebound height after strikingconcrete surface with spring loaded hammer;correlation between rebound number andcompressive strength is determined
Limitations:- evaluation of near-surface properties only,- results depend on surface roughness,- reference curve needed for strength estimation,− rebound number affected by the orientation of
the apparatus,
Ultrasonic pulse velocity, UP-V Example of application:- evaluation of degree of homogeneity of concrete structures,- monitoring strength gain,- determination of dynamic Young modulus if
Poisson’s ratio and mass density is known,- estimation of concrete strength,- complementary to other tests ,
Scheme of method:
Principle:Measurement of a travel time of ultrasonic Pwave, over a known path length, calculation ofpulse velocity in concrete, regression analysis ofrelationship between pulse velocity and concreteproperties (mainly compressive strength)
Limitations:- needs coupling agent,- reference curve needed for strength estimation,- measurements with the transducers at the
same side of sample difficult to interpret
Ultrasonic pulse echo, UP-E Example of application:- method developed to detect delamination,
discontinuities, and small cracks,- measurements of slab thickness,- monitoring of polymer adhesive curing,
Scheme of method:
Principle:Propagation of a short pulse of ultrasonic wave;measurement of travel time to boundariesseparating materials with different densities andelastic properties; by knowing the wave speed thedistance to the reflecting interface is detected
Limitations:- needs coupling agent,- heterogeneous nature of concrete and of
reinforcement presence result in multitude ofechoes,
- difficult interpretation of results,- relatively large “null-zone”

4
Table1. (cont’d)
Impact-Echo, IEExample of application::- defect detection in concrete slabs, like
delamination, flaws, large cracks,honeycombing, debonding
- measurements of concrete slab thickness,- evaluation of the quality of the bond between
overlay and base concrete,- estimation of depth of surface-opening cracks,
including water-filled ones
Scheme of method:
Principle:Development of echo method; mechanical, highenergy impact used to generate the stress wave;high penetration of concrete, mainly by P wave;frequency analysis of recorded waveform usingthe fast Fourier transform
Limitations:- detection of large defects, relatively deeply
located- needs expert for interpretation of results,
Spectral Analysis of Surface Waves, SASW Example of application::- determination of the stiffness profiles of
flexible pavements,- measurement of changes in elastic properties
of concrete slabs during curing,- estimate thickness of layers
Scheme of method:
Principle:Analysis of the spectrum of the dispersegeneralized Rayleigh surface wave in a layeredsystem; the received signal is analyzed to obtainedthe dependence of phase velocity on thefrequency
Limitations:- necessity of comparison of the theoretical and
experimental dispersion curves- time consuming procedure,- difficulties in interpretation of the results,- requires Poisson’s ratio
Ground-Penetrating Radar, GPR Example of application:- delamination detection,- locating reinforcing bars in structures,- measurement of pavement thickness,- measurements of water content of fresh concrete
Scheme of method:
Principle:Non-contact method; method analogues to UP-Etechniques, except that pulses of electromagneticwaves are used instead of stress waves, results areregistered as a waterplot
Limitations:- improper estimation of relative dielectric
constant resulted in large error,- needs expert for interpretation of results,- results depends on in-situ conditions: presence
of moisture and chlorides in concrete,- expensive equipment
impact
R waveR waveimpact

5
Table1. (cont’d.)
Infrared Thermography , ITExample of application:- locating near-surface defects, like
delamination and flaws,- short-time period for scanning large surface areas
Scheme of method:
Principle:Measurement of surface temperature differences –thermographic image
Limitations:- needs expert for interpretation of results,- results depends on in-situ conditions (surface
quality, wind speed and ambient temperature)
Electro-magnetic (covermeters) Example of application:− evaluation of concrete quality (moisture
content)− detection of steel bars in concrete,− evaluation of concrete cover around steel bars
Scheme of method:
Principle:Interaction between the steel reinforcement andlow-frequency electromagnetic fields; twoprinciples are used: magnetic reluctance and eddycurrents
Limitations:− method sensitive to concrete substrate quality
(dielectric constant depends on the concretemoisture)
− results difficult to interpret
Radioactive (radiometric, radiographic) Example of application:− detection of steel bars,− detection of defects inside concrete,− detection of low density regions
Scheme of method:
Principle:High-energy electromagnetic radiation (X-ray,gamma, neutron); concrete evaluation on the baseof changes in detected intensity of radiation; twotypes of methods according to type of sensor:radiometric (detector) and radiographic(photographic film)
Limitations:− limited thickness of tested elements (< 500
mm)− very expensive,− safety training and licensing personnel
required
infraredscanner
film ordetector
source ofradiation
concrete

6
3. CHARACTERISTICS OF ULTRASONIC TESTING
3.1. Characteristics of ultrasonic waves
Ultrasonic waves are generally defined as a phenomenon consisting of the wave transmission ofa vibratory movement of a medium with above-audible frequency (above 20 kHz). Ultrasonic wavesare considered to be elastic waves. Ultrasonic waves are used in two main fields of materialstesting:- ultrasonic flaw detection (detection and characterization of internal defects in a material),- ultrasonic measurement of the thickness and mechanical properties of a solid (stresses,
toughness, elasticity constants), and analysis of liquid properties.In all the above listed applications of ultrasound, the vibrations of the medium can be
described by a sinusoidal wave of small amplitude. This type of vibration can be described using thewave equation:
2
22
2
2
xac
ta
∂∂
∂∂
⋅=1)
where: a = instantaneous deflection in m; t = time in s; c = wave propagation velocity in m/s; x = position coordinate (path) in m.
The vibrations of the medium are characterized by the following parameters:- acoustic velocity, ν = velocity of vibration of the material particles around the position of
equilibrium:
υ ω ω ϕ= = −d ad t
A tco s ( )2)
where: a, t are as above; ω = 2πf, the angular frequency in rad/s; A = amplitude of deviationfrom the position of equilibrium in m; φ = angular phase or deviation, at which the vibratingparticle reaches the momentary value of the deviation from position of equilibrium, in rad,
- wave period, T = time after which the instantaneous values are repeated,- wave frequency, f = inverse of the wave period: f = 1/T in Hz,- wave length, λ = the minimum length between two consecutive vibrating particles of the same
phase:
λ = ⋅ =c T cf
3)
In a medium without boundaries, ultrasonic waves are propagated spatially from their source.Neighboring material, vibrating in the same phase, forms the wave surface. The following types ofwaves are distinguished depending on the shape of the wave front (Fig. 1):- plane wave – the wave surface is perpendicular to the direction of the wave propagation,- cylindrical wave – the wave surfaces are coaxial cylinders and the source of the waves is a
straight line or a cylinder,- spherical waves – the wave surfaces are concentric spherical surfaces; the waves are induced by
a small size (point) source; deflection of the particle is decreased proportionally to its distancefrom the source. For large distances from the source, a spherical wave is transformed into aplane wave.

7
Figure 1. Forms of the wave surface: a) plane wave, b) cylindrical wave, c) spherical wave
Ultrasonic waves differ in the direction of the medium vibration in relation to the wavepropagation direction. Three main types of ultrasonic waves are distinguished (see Table 2):- longitudinal waves: the medium vibrates in rectilinear way, in the direction of the ultrasonic
wave propagation,- transverse wave: the medium particles vibrate only in a direction perpendicular to the direction
of wave propagation,- surface waves (Rayleigh waves): the waves propagate in an interface layer with two directions of
the vibrations of the particles: perpendicular and parallel to the direction of the wavepropagation,
- plate waves (Lamb waves): these waves propagate in media like plates and bars, one or twodimensions of which are similar to the wave length; two forms of these waves are possible:
• anti-symmetrical wave (torsional) – the medium particles vibrate along the transverselyneutral axis and elliptical movement is done at the surface,• symmetrical waves (dilatation) - the medium particles vibrate along the longitudinallyneutral axis and elliptical movement is done at the surface.As it is seen from formulae above, the velocities of the longitudinal, transverse and surface
waves do not depend on the frequency f. Therefore, the formulae may be applied for bothcontinuous and impulse waves.
Impulse waves are most often used for concrete testing using the ultrasonic measurementtechniques. The velocity of the impulse propagation is characterized by the group velocity, which isthe velocity of propagation of the given wave amplitude, and by phase velocity, which is thevelocity of propagation of the given phase. In non-dispersive media, the group velocity of the waveis equal to the phase velocity. In dispersive media, the spectrum of the impulse frequency isbroadband and therefore the group and phase velocities are different and difficult to measure. Inpractice, wave impulse propagation is most often characterized by the velocity of the impulse frontor by the velocity of the signal (velocity of the given point of the main part of the signal).
λ
λ
λ
r
r

8
Table 2. Types of stress waves according to the direction of medium particle vibration
Wave type Symbol & scheme ofmedium vibration
Wave velocity * Remarks
Longitudinal(compressive) P or L
a) infinite medium
( ) ( )c E
L = ⋅−
+ ⋅ −ρν
ν ν1
1 1 2
b) bounded medium- plate: a >> λ, b << λ c E
L = ⋅−ρ ν1
1 2
- bar: a >> λ, b >> λ c E
L =ρ
Waves commonly used inpractice. Propagation insolid, liquid and gasmedium. Propagation ofpure P-wave limited bymedium dimensions only –should be large enough incomparison to wave length.
Transverse(shear) S or T
( )c G ET = = ⋅
⋅ +ρ ρ ν1
2 1
cT < cL
Polarized waves - rotationof wave source causeschanges in plane ofvibration of mediumparticles. Propagation insolid media only, whosedimensions are significantlylarger than the wave length.
Surface(Rayleigh)
Rc cR T≈
++
⋅087 112
1. . ν
ν
cR ≈ 0,9 ÷ 0,95 cT (*?*)
Waves penetrate medium toa depth close to the wavelength; vibration in theperpendicular direction hasmuch higher amplitude thanin parallel direction.
Plate(Lamb)
Dilatation, plate wave
Torsional, plate wave
Velocity of the Lambwaves, cLamb, dependson the wave frequencyand plate thickness
cR < cLamb < cT.
Influence of frequency onthe Lamb wave velocitycreates difficulties inapplication of the Lambwaves in NDT
*E - elastic modulus, Pa , G - shear modulus of elasticity, Pa, ν – Poisson’s ratio, ρ – density, kg/m3, λ = wavelength

9
3.2. Attenuation of ultrasonic waves
The energy of an ultrasonic wave travelling through a medium is attenuated depending onthe properties of the medium. The reasons are:• energy absorption, which occurs in every state of matter and is caused by the intrinsic friction ofthe medium leading to conversion of the mechanical energy into thermal energy,• reflection, refraction, diffraction and dispersion of the wave; this type of wave attenuation ischaracteristic particularly for heterogeneous media like metal polycrystals and concrete.The weakening of the ultrasonic wave is usually characterized by the wave attenuation coefficient α[dB⋅m-1⋅Hz-1], which determines the change of the acoustic pressure after the wave has traveled aunitary distance through the given medium.
In solids, the loss of energy is related mainly to absorption and dispersion. The attenuationcoefficient α is described by the relation:
α=α1+α2 4)
where α1 is the attenuation coefficient that describes how mechanical energy is converted intothermal energy, and α2 is the attenuation coefficient that describes the decrease of wave energy dueto reflections and refractions in various directions.
For a majority of solids, the energy losses connected to the absorption are proportional to theultrasonic waves frequency, so that the attenuation of longitudinal waves is greater than theattenuation of transverse waves.
In non-homogenous materials, the energy losses caused by dispersion of the ultrasonic waveare more important. The most important parameter is the material grain size D, and the relationbetween the wave length λ and D is given by the following formulae:
a) λ » D and 0.016 < D/λ < 0.16 – Rayleigh dispersionα ≈ α1 f + α2 f 4 5)
where the dispersion coefficient α2 ≈ D 3
b) λ ≈ D and 0.16 < D/λ < 1 – stochastic dispersionα ≈ α1 f + α2 f 2 6)
where the dispersion coefficient α2 ≈ D
c) λ < D – diffusion dispersion; attenuation coefficient α is defined by the previous equation and α2
≈ 1/D
d) λ « D and D/λ > 10 - absorption of the ultrasonic wave in every grain as well as reflection on theinterfacial surfaces; the average attenuation coefficient is defined by the following equation:
α α α≈ + +1 22f f R
D7)
where R is the average reflection coefficient for the interfacial surfaces, and the dispersioncoefficient α2 ≈ 1/D. If R is low, the attenuation is low, too.

10
3.3. Methods used in the ultrasonic measurement technique
The most often applied methods of ultrasonic testing are the pulse velocity method, the echomethod, and the resonance method. Visual and holographic methods, used for direct visualization ofthe ultrasonic field in the given medium, are of lesser importance.
The ultrasonic pulse velocity method (called also transmission method) is one of the oldestand simplest methods of materials testing. The method consists in the determination of the traveltime, over a known path length of the longitudinal ultrasonic wave after its transmission through thetested medium (see Fig. 2). Both the emitting and receiving transducers are usually placed on theopposite sides of the tested sample (coaxially if possible). Other transducer arrangements are alsoused in concrete testing (Fig. 2b, c). They can be placed on the perpendicular surfaces (Fig.2b) or onthe same side of the tested member (Fig.2c).
a) b) c)
Figure 2. Ultrasonic pulse velocity method: a) direct method, b) semi-direct method, c) indirect(surface) method
The ultrasonic echo method is often used for defect detection in metal members. The methodconsists in generation of a short impulse of the ultrasonic wave by the transmitting transducer (Fig. 3).After reflection by the material’s structural heterogeneity or by the limiting surface, the impulses arerecorded by the receiving transducer (dual transmitting-receiving transducers are also available). Part ofthe ultrasonic wave is reflected by the material defect, returns to the receiving transducers and isrecorded as the defect’s echo. Another part of the wave passes by the defect and reaches the oppositewall of the tested material, where it is reflected and returns to the receiver with some delay as thebottom echo. The depth of the defect or the reflecting surface is determined on the basis of the traveltime of the impulse and the ultrasonic wave velocity. A small grain size of the tested material isnecessary for the echo method to be efficient. The grain size should be significantly smaller than thesearched-for defects; if not, then any defect echo will be overlapped by the echoes formed by the grainboundaries.
a) b)
Figure 3. Testing the concrete by ultrasonic echo method: a) transmitting-receiving transducer,b) double transducer

11
The resonance method consists in the introduction of an ultrasonic wave into the testedmedium, which is of the constant thickness g, in such a way that a resonant standing wave, ofwavelength λ, will be formed under the condition:
g n ncf
= ⋅ =λ2 2
8)
where n = an integer that defines the harmonic number.
Contrary to the echo method, in the resonance method the interference of the incident andreflected waves is observed. A continuous wave is usually emitted in this method. Thedemonstration of the resonance of the continuous wave requires a large area of contact of thetransducer with the tested material. The transducers used usually have a diameter of about 30 mmand should be well pressed against a smooth surface of the material. The main problem is thefinding of the resonance frequency for n = 1. The other limitation is that practical use of the methodis really only possible in the laboratory, not in the field.
3.4. Application of ultrasonic methods for concrete testing
At present, two ultrasonic methods are used for concrete testing: the pulse velocity methodand the echo method. These methods enable the evaluation of concrete strength and homogeneity. Ina limited range, the ultrasonic pulse velocity method is also applied for determination of theelasticity constants [30,31], detection of crack geometry [30,32], evaluation of the degree ofconcrete degradation, e.g. deterioration due to freeze-thaw attack. The structure of concrete, asdefined by the maximum aggregate size, requires low frequency ultrasonic waves, since the wavelength should be larger than the grain size for minimizing losses caused by dispersion. Ultrasonicwaves are diffracted by discontinuities smaller than the wave length. Assuming the pulse velocity inconcrete, cL , is 3 km/s to 5 km/s, the wave length, λ, ranges from 75 mm to 125 mm at a frequencyof 40 kHz [9]. The maximum diameter of aggregate grains, D, does not usually exceed 32 mm. Inthis case, the ratio D/λ ranges from 0.25 to 0.41. From eqs. 5-8, it can be concluded that at leastRayleigh and stochastic dispersions occur. As frequency increases, the wave length decreases andbecomes close to the grain diameter. This implies that other types of wave dispersion can occcur.Therefore, the resolution in the concrete testing is worse than in the case of metals. In practice [27],frequencies from 100 kHz to 1 MHz are used for testing concrete samples or members smaller than0.5 m. Members larger than 0.5 m require low frequencies below about 100 kHz, and are usuallyabout 40 kHz.
The direct pulse velocity method is most often used to assess concrete structures. Theindirect pulse velocity method is used rarely in specific application. Only longitudinal ultrasonicwaves are used in practice, because transverse waves are difficult to generate in concrete and arestrongly attenuated in this material. The pulse velocity method is used mainly for evaluation of thecompressive strength vs. time as well as for evaluation of structural homogeneity.
The common procedure for evaluation of cement concrete properties with the pulse velocitymethod (Fig. 4) consists in regression analysis of the experimental relationship between the pulsevelocity and selected technical properties (mainly compressive strength), leading to development ofsuitable reference curves (called also calibration curves, correlation curves or ISO-strength curves)[9,10,13]. There are many recommendations and national standards for the ultrasonic evaluation ofconcrete compressive strength. They define the type of reference concrete as well as the materialsparameters that can be varied to develop the reference curve. Komlos et al. [14] have analyzed thestandards concerning the rules for ultrasonic testing by the pulse velocity method. In general, threemethods of reference curve development can be recognized:
12
0102030405060708090
3.8 4.0 4.2 4.4 4.6
pulse velocity, km/s
com
pres
sive
stre
ngth
, MP
aa) calibration curve developed for cube concrete specimens with the same composition and cured
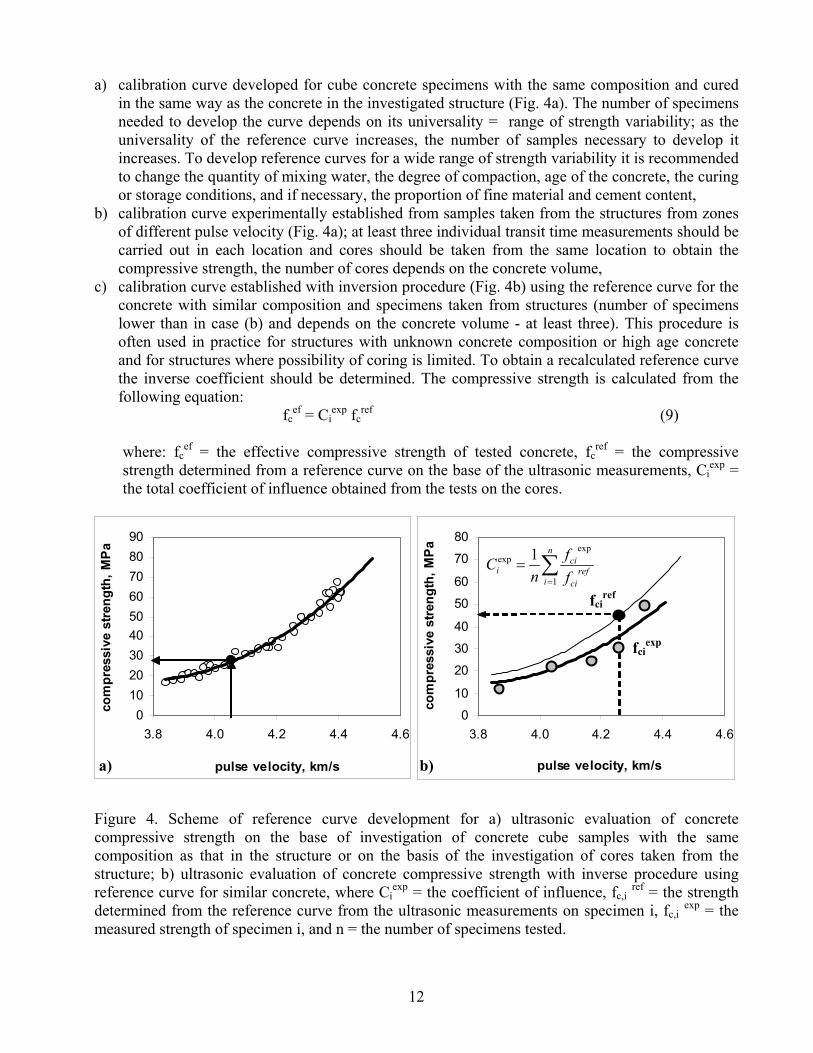
in the same way as the concrete in the investigated structure (Fig. 4a). The number of specimensneeded to develop the curve depends on its universality = range of strength variability; as theuniversality of the reference curve increases, the number of samples necessary to develop itincreases. To develop reference curves for a wide range of strength variability it is recommendedto change the quantity of mixing water, the degree of compaction, age of the concrete, the curingor storage conditions, and if necessary, the proportion of fine material and cement content,
b) calibration curve experimentally established from samples taken from the structures from zonesof different pulse velocity (Fig. 4a); at least three individual transit time measurements should becarried out in each location and cores should be taken from the same location to obtain thecompressive strength, the number of cores depends on the concrete volume,
c) calibration curve established with inversion procedure (Fig. 4b) using the reference curve for theconcrete with similar composition and specimens taken from structures (number of specimenslower than in case (b) and depends on the concrete volume - at least three). This procedure isoften used in practice for structures with unknown concrete composition or high age concreteand for structures where possibility of coring is limited. To obtain a recalculated reference curvethe inverse coefficient should be determined. The compressive strength is calculated from thefollowing equation:
fcef = Ci
exp fcref (9)
where: fcef = the effective compressive strength of tested concrete, fc
ref = the compressivestrength determined from a reference curve on the base of the ultrasonic measurements, Ci
exp =the total coefficient of influence obtained from the tests on the cores.
Figure 4. Scheme of reference curve development for a) ultrasonic evaluation of concretecompressive strength on the base of investigation of concrete cube samples with the samecomposition as that in the structure or on the basis of the investigation of cores taken from thestructure; b) ultrasonic evaluation of concrete compressive strength with inverse procedure usingreference curve for similar concrete, where Ci
exp = the coefficient of influence, fc,i ref = the strengthdetermined from the reference curve from the ultrasonic measurements on specimen i, fc,i exp = themeasured strength of specimen i, and n = the number of specimens tested.
0
10
20
30
40
50
60
70
80
3.8 4.0 4.2 4.4 4.6
pulse velocity, km/s
com
pres
sive
stre
ngth
, MPa
a) b)
∑=
=n
iref
ci
cii f
fn
C1
expexp 1
fciexp
fciref

13
Most standards and guidelines recommend two regression equations for description of therelationship between pulse velocity and concrete strength:
- linear : fc = a0 + a1 cp (10)- exponential: fc = a0 exp (a1 cp) (11)
where: fc = compressive strength, cp = longitudinal pulse velocity, and a0 a1 are regressioncoefficients.However, others types are allowed:
- fc = a0 + a1 cp + a2 cp2 (12)
- fc = a0 cpa1 (13)
where the symbols are the same as in eq. (10)The measure of the accuracy of strength estimation from a reference curve is the coefficient
of standard deviation, Cd:
( )[ ] %100/1
12/1
1
2exp,
exp,, xfff
n
n
iicic
reficdC
−
−= ∑
=
(14)
where: fc,i ref = the strength determined from the reference curve from the ultrasonic measurementson specimen i, fc,i exp = the measured strength of specimen i, and n = the number of specimens tested.If Cd is less than 12 %, the estimation of compressive strength with the ultrasonic method isconsidered satisfactory.
The ultrasonic pulse velocity method is commonly used for compressive strength estimation.However, many authors have stressed that various factors can affect pulse velocity and overshadowchanges resulted from strength changes [10,23]. Komlos et al. [14] have also concluded thatapplications of longitudinal waves for concrete evaluation may be classified in the following way,according to decreasing precision of measurement:
- monitoring of how concrete properties change with time,- control of homogeneity of the structure of concrete (possible disturbances of the signal from the
reinforcement),- estimation of the compressive strength (necessity of calibration),- determination of the elasticity constants (doubtful as concrete is a heterogeneous composite),- detection of defects – least attractive of all (possibility of obtaining faulty results with dangerous
and expensive consequences).- They have also stressed the necessity of enhancing ultrasonic measurement techniques in thefollowing proposed directions:
- using waves others than longitudinal, e.g. surface wave, plate waves,- using wave parameters other than wave propagation velocity,- using advanced methods for analysis of the ultrasonic signal.
Recently, many institutions have become focused on the improvement of ultrasonic test methods,e.g. using surface waves and advanced signal processing [35, 36]
The ultrasonic echo method is rarely used for concrete, and mainly only for flaw detection.This method gives lower resolution for concrete compared to metal testing. Impulse duration is longat a frequency of 100 kHz; this leads – in the case of the single transducer in the echo method – to a

14
long “dead zone”. Double transducers cannot be applied here due to the small directivity of theultrasonic beams emitted with low frequencies and the possibility of “cross-talk” between them, aswell as the reflection of the wave by the surfaces parallel to the beam axis. In the case of the testingof the concrete using the echo method, the obtained results are difficult to interpret due to themultiple echoes caused by material heterogeneity – the presence of coarse aggregate and steelreinforcement. Recently, some work on improving the echo method has been carried out, focused onusing ultrasonic waves with higher frequency and a new data processing procedure, the so-calledsplit spectrum processing [39].
The resonance method is mainly used in the laboratory for the determination of dynamicelastic moduli of concrete-like composites [18,40].
4. GENERAL APPROACH TO ULTRASONIC EVALUATION OF POLYMER CONCRETECOMPOSITES
From the engineering point of view, the nondestructive assessment of the properties of polymercomposites should be developed for three main fields of PC/PCC application (Fig. 5):- repair,- protective coatings (including industrial floors),- pre-cast elements.Usually, different procedures for nondestructive evaluation should be used because of differentpurposes for evaluating PC materials or the systems in which they are used.
NDT evaluation of PC pre-cast elementsDue to the similarity of the geometrical features of the microstructure (Fig. 6) of both cement
concrete and polymer concrete, it would seem possible that experience using ultrasonic techniques oncement concrete can be implemented into polymer composites technology for PC pre-cast elements.The ultrasonic pulse velocity can be used for this purpose. This implies that reference curves should bedetermined for a given type of PC (see Section 3.4). However, the differences in properties should betaken into account, especially differences in elastic properties between cement paste and resinbinder, which can affect ultrasonic wave propagation in PC. Ultrasonic wave propagation dependsgenerally on material composition and composite microstructure. In the specific case of polymerconcrete composites, the ultrasonic wave propagation is influenced by: type of the binder and filler,content and grain-size distribution of the aggregate, and microfiller content and porosity. Theadhesion between resin binder and aggregate is also important. For example, using a wet aggregatecan result in a lack of adhesion, and by using coupling agents the adhesion can be increased [41,42].
NDT evaluation of multi-layer systemsAs a result of repair and applying anti-corrosion protection to a building structure, a multi-
layer system consisting of portland cement concrete (CC) in contact with polymer composite (PC) isproduced. In this case, quality control of the repair application is one of the most important purposesfor applying NDT methods. These are mainly focused on nondestructive estimation of the systemgeometry (layer thickness), and detection of flaws, voids and places with lower adhesion [43-46] atthe interface zone of the repair material (PC/PCC) and the concrete substrate. Lack of adhesion canbe a result of technological error, actual material incompatibility in the PC-CC system, as well asfrom the change of properties during the service time of the repair, which are termed durabilityproblems.
The nondestructive evaluation of layer thickness, flaws, disbonds, and areas of poor adhesionunder the top PC layer (Fig. 7) is a difficult issue and requires a careful selection of the most

15
suitable NDT methods. The NDT techniques selected should give a possibility for testing the PC-CCsystem from one side of the structure due to the specific repair system. Two ultrasonic methods canbe considered for this purpose: the echo method and the indirect pulse velocity method. Figure 7illustrates details of this method, which will be discussed in more detail later in this report.
The relation between the specific acoustic impedance of the components of the PC-CC multi-layer system is one of the most important factors influencing ultrasonic wave propagation inparticular elements of the system, as well as through the internal interfaces. The heterogeneousnature of both PC and CC, including “cohesion” defects of their microstructure (like voids, porosity,cracks), and the presence of steel reinforcement can additionally complicate the nondestructiveassessment of adhesion between PC and CC.

16
Figure 5. The general concept of the research project for the evaluation of polymer concretecomposite properties in various applications using non-destructive ultrasonic methods.

17
CC PC
E aggregate ∼ E cement paste E aggregate >> E resin binder
Figure 6. Example of similarity of microstructure geometry of portland cement concrete (CC) andpolymer concrete (PC)
Table 3. Approximate value of specific acoustic impedance, Z, for various building materials: Z = density x pulse velocity
Material Density Pulse velocity Specific acousticimpedance, Z
(kg/m3) (m/s) (kg/m2s)
Concrete 2300 3500 to 4500 (8 to 10) ·106
Mortar 2100 3500 7 ·106
Air 1.2 343 0.411
Water 1000 1480 1.5 ·106
Soil 1500 500 to1500 (1 to 3) ·106
Clay 1800 1300 2 ·106
Sand 1700 1500 2 ·106
Timber 900 800 to1200 (0.7 to 1) ·106
Bitumen 1200 500 1 ·106
Asphalt 1900 2500 5 ·106
Steel 7800 5900 4.6 ·107
Granite 2700 5500 to 6100 (15 to 17) ·106

18
Figure 7. (a) Scheme of determination of reflection coefficient R; (b) R value for common "buildinginterfaces"; Z1, Z2 - acoustic impedance (computed from data in Table 3); (c) sketch of defects in PC-CC system
porescracks
concrete substrate
polymer composite
non-hardnedresin
non-zerovolume disbond
zero-volumedisbond
Ai
Atr
AodZ1
Z2
Aod = Ai 1Z2Z1 Z- 2Z
+
Atr = Ai 1Z2Z
2 Z2+
R = 1Z2Z1 Z- 2Z
+=
iAtrA
Interface Reflectioncoefficient R
Concrete / air - 0.99Concrete / water - 0.71Concrete / soil - 0.63
Granite/concrete - 0.28Asphalt / concrete + 0.29
Concrete / steel + 0.67Bitumen/concrete + 0.80
b)
a)
c)
(16)

19
5. EVALUATION OF TECHNICAL PROPERTIES OF POLYMER CONCRETEELEMENTS
5.1. Experimental procedureThe assessment of PC precast elements was performed according to the normal procedure for
cement concretes (see Section 3.4). In this case, suitable variability of ultrasonic wave velocityand PC properties is the main issue. There are many recommendations and national standards forassessment of cement concrete structure with the pulse velocity method; however, a similarguideline does not exist for PC. On the basis of literature data, as well as the authors’ experience,the resin binder content, the content of sand, the micro-filler fraction of aggregate, the porosity,and if necessary, the use of a wet aggregate, can all be varied to develop a reference curve for PC(Fig. 8). In this work, the usefulness of a material optimization approach [6] for suitablevariability of PC properties was analyzed.
The surface-transmission pulse velocities in polymer concretes were measured by a commercialconcrete tester, using sets of associated transducer pairs. The source pulse frequency was 100 kHz,and the distance between transducers was 80 mm. A petroleum jelly was used as a coupling agent toimprove the acoustic contact between the samples and the transducers. The propagation times weremeasured for all PC samples before mechanical testing, with later calculation of the ultrasonic wavevelocities.
The compressive strength, fc, and flexural strength, fb, were tested for each sample. The staticmodulus of elasticity (Young’s modulus) was calculated from the load-deflection curve at 50 % ofultimate load. Volume density (total mass divided by total volume) and porosity, which can betreated as bulk material parameters, were determined for characterization of the PCmicrostructure. The porosity, p, was calculated from the formula: p=1-(Dv/Ds), where the volumedensity, Dv, and specific density (total mass divided by pore-free volume), Ds, were measured foreach sample. Additionally, the dynamic elasticity modulus (see Table 1) was estimated from thefollowing formula: Ed = Dv vp
2 , where vp = longitudinal pulse velocity and Dv = the volumedensity.
Beam-shaped samples (40 mm x 40 mm x 160 mm) were prepared and used for compressiveand bending tests. The ultrasonic measurements and determination of mechanical properties werecarried out after 14 d of PC curing.
5.2. Ultrasonic evaluation of selected technical properties of vinylester concrete
5.2.1. MaterialsIntroductory investigations of the ultrasonic evaluation of vinyl-ester polymer concrete properties
were carried out during the preparation of a proposal for the M.Skłodowska-Curie US-PL Fund II[51-53]. An analysis of PC composition effect on ultrasonic wave propagation was one purpose ofthat investigation. The pulse velocity of ultrasonic waves mainly depends on the elastic properties ofthe constituent material, the volume density, and the geometry of the structures tested. The geometryeffect can be minimized by using standard sample and test procedures. The elastic properties anddensity are direct results of the material microstructure. The basic elements of polymer concretestructure can be classified, in descending order of the elastic properties, as follows: filler (courseaggregate), micro-filler (fine sand), resin binder, and pores (to be thought of as a filler with zeroelastic properties). Some factors like the porosity, or low adhesion on an aggregate/binder interface,

20
can also affect the ultrasonic wave attenuation. On the other hand, increasing the filler and micro-filler content can increase the ultrasonic wave velocity.
GUIDELINES FOR ULTRASONIC ASSESSMENTOF CONCRETE-LIKE COMPOSITE PROPERTIES
Cement concrete:RILEM draft recommendation and manynational standards and recommendations
Polymer concrete:None exist
TYPE OF REFERENCE CONCRETECC PC (proposal)
∇ type of cement∇ cement content∇ type (nature) of aggregate∇ granularity of aggregate∇ admixture type and content
∆ type of resin binder∆ type (nature) of aggregate∆ binder content ⇒ aggregate
to binder ratio by weight∆ granularity of aggregate∆ micro-filler type and content
MATERIAL PARAMETERS WHICH CAN BE VARIEDTO DEVELOP ISO-STRENGTH CURVE
CC PC (proposal)
∇ quantity of mixing water∇ degree of compaction∇ age of concrete (3 - 90 days)∇ curing or storage conditions
+ if necessary:∇ proportion of fine
material (± 8 %)∇ cement content (± 10 %)
∆ aggregate (A) and resinbinder (B) - aggregateto binder ratio by weight ⇒ A/B
∆ content of sand fractionof aggregate ⇒ S/A
∆ micro-filler content ⇒ M/A∆ porosity
+ if necessary:∆ wet (coarse) aggregate
Figure 8. Research approach to evaluation of PC precast element properties
MATERIAL OPTIMIZATION APPROACH
Material model of PC
PC properties = f (A/B, S/A, M/A)

21
In the present work, eight types of model polymer concretes, differing in structure, weretested. A commercial vinyl-ester resin with low viscosity was used as the binder. A natural multi-size fraction quartz aggregate with grain sizes ranging from 0 mm to 8 mm, was used as the filler.A silica flour (>90 % SiO2) with a high specific surface area (1800 m2/kg to 2000 m2/kg) wasused as the micro-filler. On the basis of previous investigation of various vinyl-ester concretes,the aggregate (A) to resin binder (B) ratio, A/B (by mass), was equal to 8 for the polymerconcretes tested. The following eight types of polymer concrete, differing in aggregate composition,were investigated. Each composite used a different size range of aggregates. The table below showsthe size fraction of the quartz aggregates used in each material, which were labeled A-H. Forcomposites D-H, the amounts of different aggregates shown are by mass.
• single-fraction composites:A: size fraction 0 mm to 2 mm,B: size fraction 2 mm to 4 mm,C: size fraction 4 mm to 8 mm,
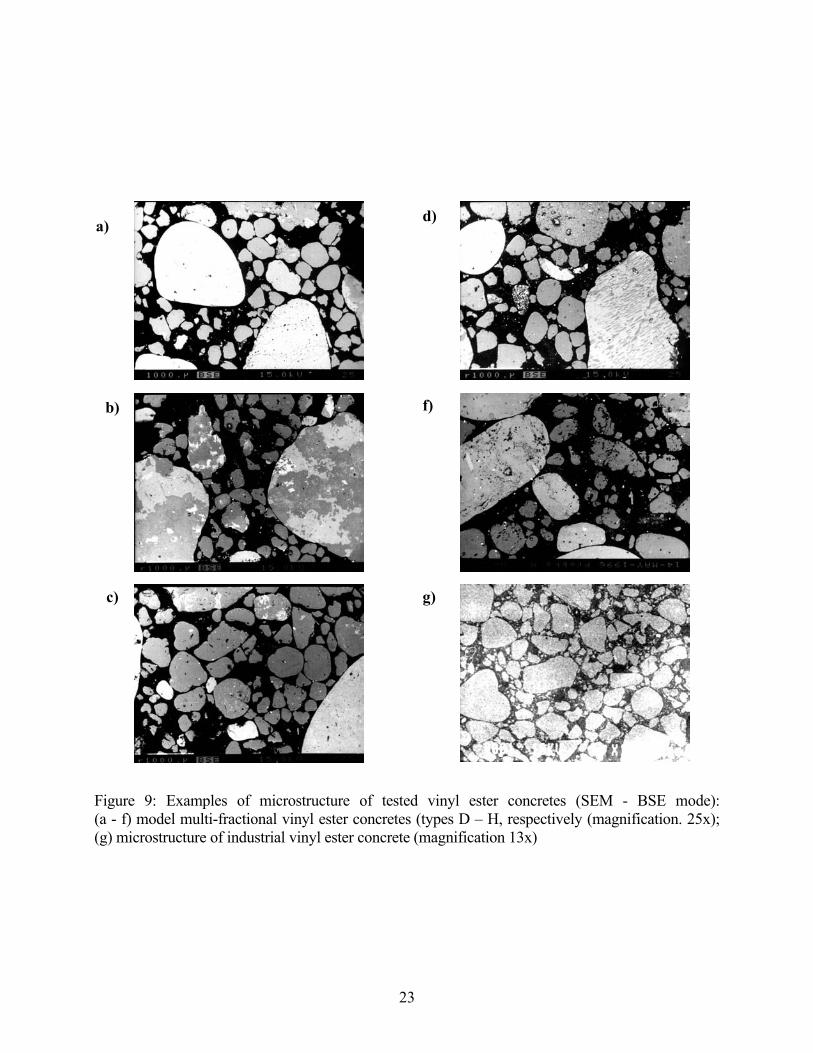
• multi-fraction composites (Fig. 9):D: 1/3 (0 to 2) mm + 1/3 (2 to 4) mm + 1/3 (4 to 8) mm,E: 50 % (0 to 2) mm + 50 % (2 to 4) mm,F: 48 % (0 to 2) mm + 48 % (2 to 4) mm + 4 % silica flour,G: 46 % (0 to 2) mm + 46 % (2 to 4) mm + 8 % silica flour,H: 44 % (0 to 2) mm + 44 % (2 to 4) mm + 12 % silica flour.
The composition of the PC of types F-H was selected on the basis of the non-continuous sievecurve method, with silica flour included as the micro-filler. Composite E served as the referencecomposition for composites F-H. The particular types of composite differed in structure. Due to thelow workability of the polymer concrete mix when high contents of micro-filler were present, thesamples of composite H were characterized by a high irregularity in the micro-filler distribution. Therelationship between ultrasonic pulse velocity and mechanical properties for a vinyl-ester concrete,which was representative of industrial precast elements (see Fig. 9f), was analyzed. In this case, theaggregate to resin binder ratio was A/B = 10 (by mass). Quartz aggregate with a grain size rangingfrom 0 mm to 5 mm (using a continuous sieve curve) was used, with silica flour used as the micro-filler. The basic differences between the model and industrial vinyl-ester concrete samples were thegrain size distribution of the aggregate and the type of vinyl-ester binder. Six rectangular-shapedsamples, 40 mm x 40 mm x 160 mm, were prepared for each type of composite.
5.2.2. ResultsUltrasonic testing with the indirect pulse velocity method on the rectangular samples was
compared to tests of ultrasonic wave propagation with the direct method was carried out forrepresentative sample of each vinyl-ester concrete type. The results of these tests showed that thepulse velocity measured with both methods was practically the same, with a ratio of 1.00 ± 0.02 forboth the model and the industrial vinyl-ester concretes. This confirmed the usefulness of the indirectpulse velocity method for evaluation of PC properties.
The results of measurements of the parameters of ultrasonic wave propagation (see Table 4)indicated that the propagation time was characterized by a low coefficient of variation CT, rangingfrom a low of 0.9 % for composite F to a high of 6.2 % for composite C. The high value of thecoefficient of variation for the amplitude, as high as 50 %, made this parameter practically uselessfor estimation of the technical properties of polymer concrete. On the basis of a statistical analysis(significance level α=0.05), it can be concluded that the values of propagation time obtained for thetypes of composites tested were significantly different and therefore can be used for characterizationof the technical properties of concrete. The pulse velocity, vp, for each sample was calculated, basedon the values of the propagation time. The pulse velocity was lower – up to 30 % - for the single-

22
size-fraction composites (A,B,C) compared to the multi-size-fraction composites (D,E,F,G,H). Thisresult indicates a significant effect of aggregate grain composition, with wider size range resulting inbetter filling of the volume and with lower porosity. For example, pulse velocities for the single-size-fraction composites, A, B, and C, were lower than for composite D, which consists of all theaggregate size fractions used in A, B, and C. In general, the addition of micro-filler increased thepulse velocity. Only in the case of composite H, which had the highest micro-filler content, the pulsevelocity was lower than in the reference composite E (Fig. 10a). In this case, the lower workabilityof the polymer concrete mix when large amounts of micro-filler was present caused an irregulardistribution of the micro-filler and formation of micro-filler agglomeration (Fig. 10b), often withmicrocracks in the interior of the agglomerates (see Fig.10c). This agglomeration was the probablecause of the significant decrease of pulse velocity for composite H.
23
Figure 9: Examples of microstructure of tested vinyl ester concretes (SEM - BSE mode):(a - f) model multi-fractional vinyl ester concretes (types D – H, respectively (magnification. 25x);(g) microstructure of industrial vinyl ester concrete (magnification 13x)
a)
b)
c)
d)
f)
g)

24
Figure 10. (a) Influence of the micro-filler content on the pulse velocity for composites E-H, (b)example of composite H microstructure with agglomeration of micro-filler, (c) microcracks insideagglomeration.
Table 4. Parameters of ultrasonic wave propagation for vinyl ester concretes tested
Statistical parameterComposite type
A B C D E F G H
propagation time, µs
Mean value, µm 22.67 23.67 24.77 19.63 19.18 18.63 17.96 19.78
Std.dev., µm 0.50 0.86 1.52 0.37 0.26 0.15 0.19 0.54
Coeff. of variation, % 2.22 3.66 6.15 1.89 1.36 0.82 1.10 2.73
Amplitude
Mean value 166.83 212.06 125.28 128.17 123.89 138.83 130.67 130.33
Std..dev. 43.94 45.72 24.30 17.47 10.77 13.37 7.27 8.27
Coeff. of variation, % 26.34 21.56 19.39 13.63 8.69 9.63 5.56 6.34
Mean value of pulse velocity, m/s
---- 3530 3388 3230 4076 4172 4293 4454 4047
Mean value of dynamic elasticity modulus, GPa
---- 25.2 22.2 21.1 37.0 38.0 40.4 43.6 35.6
The technical properties of the model PC composites types used are shown in Table 5. Thecomposites differed in porosity. The highest porosity was observed for the single-fractioncomposites, greater than 10 %. An increasing width of aggregate size distribution and the addition of
3,8
3,9
4,0
4,1
4,2
4,3
4,4
4,5
0 4 8 12
microfiller fraction in aggregate, %
puls
e ve
loci
ty, k
m/s
E F G H
a) b) c)

25
silica flour tended to decrease the porosity down to about 6 % (a porosity of around 5 % is a typicalvalue for polymer concretes).
The different PC structures resulted in different properties. The compressive strength of multi-size-fraction (D-H) composites was about 50 % higher than for single-size-fraction composites (A-C). The addition of micro-filler (composites E - H), in relatively small amounts, did not affected thecompressive strength by very much compared to the standard deviations. The lowest values of fc inthe micro-filler group, however, were obtained for composite H. The average compressive strengthfor composite H was about 30 % lower than that for reference composite E, and were probably dueto the high irregularity of the micro-filler distribution. The flexural strength for the microfiller groupcompared to the other PC types was changed in a relatively smaller degree. However, the non-homogeneous distribution of micro-filler in composite H caused a 45 % lowering of fb compared to
Table 5. Technical properties of tested vinyl ester concretes
Statistical parameter Composite type
A B C D E F G H
compressive strength, MPa
Mean value, MPa 24.8 13.2 13.2 44.2 47.4 48.2 47.4 35.1
Std.dev.,MPa 3.4 1.6 3.7 6.2 2.4 4.2 4.8 2.5
Coeff. of Var., % 13.8 12.0 28.0 14.1 5.1 8.6 9.8 7.1
flexural strength, MPa
Mean value, MPa 15.7 14.1 11.9 18.5 20.8 22.1 21.5 12.3
Std.dev.,MPa 2.0 2.0 0.5 1.0 1.1 1.1 2.1 1.2
Coeff. of Var., % 12.7 13.9 4.2 5.2 5.5 5.1 9.8 9.7
static elasticity modulus, GPa
Mean value, GPa 9.6 4.0 2.0 12.8 15.9 18.8 20.4 19.5
Std.dev.,GPa 3.5 1.2 0.1 1.3 1.7 1.5 5.8 2.8
Coeff. of Var., % 36.6 31.4 6.2 9.8 10.8 7.9 1.2 19.5
porosity, %
Mean value, % 10.9 17.8 14.9 7.0 7.7 5.8 5.8 6.1
Std.dev., % 1.1 1.2 1.7 0.9 0.9 0.6 1.2 1.2
Coeff. of Var., % 9.8 6.5 11.3 12.8 11.9 9.9 20.2 19.2
volume density, kg/m3
Mean value, kg/m3 2018 1932 2025 2224 2184 2191 2196 2176
Std.dev., kg/m3 30 17 41 12 8 9 8.9 5.4
Coeff. of Var., % 1.5 0.9 2.0 0.5 0.36 0.4 0.4 0.3
26
the reference composite E, just like in the case of compressive strength. The micro-filler compositesalso had higher values of elasticity modulus, Eb, than did the non-micro-filler composites. This canbe explained by a modification of the resin binder by the micro-filler resulting in higher values of Ebof the binder phase, e.g., the binder phase becomes a polymer micro-mortar. In the case ofcomposite H, a small decrease in the value of Eb was found, although within the standard deviation.Clearly, a non-homogenous micro-filler distribution affects strength more than modulus of elasticity,which is a reasonable result, since strength is much more sensitive to flaw size than is the modulusof elasticity.
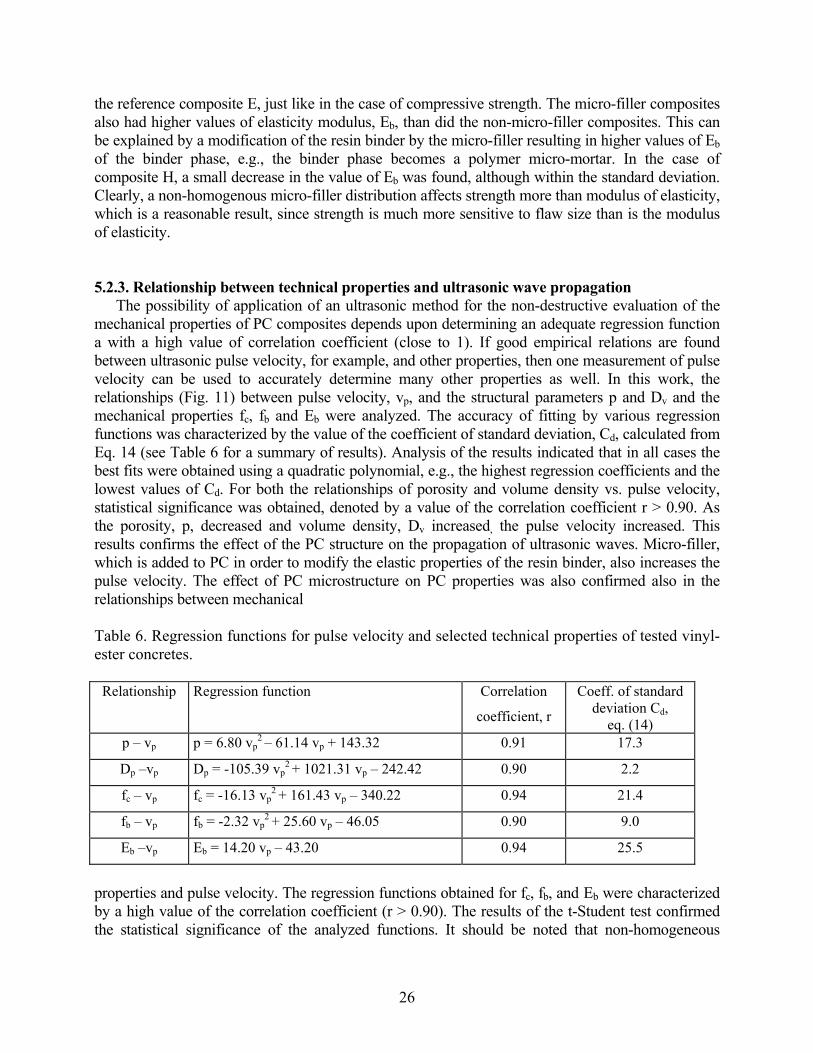
5.2.3. Relationship between technical properties and ultrasonic wave propagationThe possibility of application of an ultrasonic method for the non-destructive evaluation of the
mechanical properties of PC composites depends upon determining an adequate regression functiona with a high value of correlation coefficient (close to 1). If good empirical relations are foundbetween ultrasonic pulse velocity, for example, and other properties, then one measurement of pulsevelocity can be used to accurately determine many other properties as well. In this work, therelationships (Fig. 11) between pulse velocity, vp, and the structural parameters p and Dv and themechanical properties fc, fb and Eb were analyzed. The accuracy of fitting by various regressionfunctions was characterized by the value of the coefficient of standard deviation, Cd, calculated fromEq. 14 (see Table 6 for a summary of results). Analysis of the results indicated that in all cases thebest fits were obtained using a quadratic polynomial, e.g., the highest regression coefficients and thelowest values of Cd. For both the relationships of porosity and volume density vs. pulse velocity,statistical significance was obtained, denoted by a value of the correlation coefficient r > 0.90. Asthe porosity, p, decreased and volume density, Dv increased, the pulse velocity increased. Thisresults confirms the effect of the PC structure on the propagation of ultrasonic waves. Micro-filler,which is added to PC in order to modify the elastic properties of the resin binder, also increases thepulse velocity. The effect of PC microstructure on PC properties was also confirmed also in therelationships between mechanical
Table 6. Regression functions for pulse velocity and selected technical properties of tested vinyl-ester concretes.
Relationship Regression function Correlation
coefficient, r
Coeff. of standarddeviation Cd,
eq. (14)p – vp p = 6.80 vp
2 – 61.14 vp + 143.32 0.91 17.3
Dp –vp Dp = -105.39 vp2 + 1021.31 vp – 242.42 0.90 2.2
fc – vp fc = -16.13 vp2 + 161.43 vp – 340.22 0.94 21.4
fb – vp fb = -2.32 vp2 + 25.60 vp – 46.05 0.90 9.0
Eb –vp Eb = 14.20 vp – 43.20 0.94 25.5
properties and pulse velocity. The regression functions obtained for fc, fb, and Eb were characterizedby a high value of the correlation coefficient (r > 0.90). The results of the t-Student test confirmedthe statistical significance of the analyzed functions. It should be noted that non-homogeneous

27
structure (e.g. irregular distribution of micro-filler due to the low workability of PC mix) affects thepropagation of ultrasonic waves to a smaller extent than do the mechanical properties of PC.
The regression analysis of the relation between the static, Eb, and the dynamic, Ed, modulus ofelasticity showed (Fig. 8f) that this relationship (α=0.05) is statistically significant (correlationcoefficient r=0.94). Similar relations exist for the other composites.
Statistically significant relationships between pulse velocity and compressive and flexuralstrength were also obtained for representative samples of industrial vinyl-ester concrete (Fig.12).The regression functions obtained for fc and fb were characterized by lower correlation coefficients(0.84 and 0.71) in comparison to the corresponding properties of the model concretes. However, theshape of the regression function plot is similar in both cases and the low values of the coefficient ofstandard deviation, Cd, indicated a reasonable fit to experimental results.
The results obtained confirmed that the pulse velocity method is useful for nondestructiveevaluation of polymer concrete properties. However, further investigation should be continued toimprove the accuracy of the reference curve.

28
p = 6.80vp2 - 61.14vp + 143.32
r = 0.91
0
5
10
15
20
25
3.0 3.4 3.8 4.2 4.6vp, km/s
p, %
a) Dp= -105.39vp2 + 1021.31vp - 242.42r = 0.90
1800
1900
2000
2100
2200
2300
2400
3.0 3.4 3.8 4.2 4.6
vp, km/s
D p, k
g/m
3
b)
fc= -16.13vp2 + 161.43vp - 340.22r = 0.94
0
20
40
60
80
3.0 3.4 3.8 4.2 4.6
vp, km/s
f c, M
Pa
c) fb = -2.32vp2 + 25.60vp - 46.05r = 0.90
5
10
15
20
25
30
3.0 3.4 3.8 4.2 4.6
vp, km/s
f b, M
Pa
d)
Eb = 14.20vp - 43,20r = 0.94
0
5
10
15
20
25
3.0 3.4 3.8 4.2 4.6
vp, km/s
E b, G
Pa
e)
Edyn = 1.047Estat + 16.113r = 0.94
0
10
20
30
40
50
0 10 20 30
Estat, GPa
Edyn
, GP
a
f)
Figure 11. Regression functions describing relationships between the pulse velocity and: (a)porosity, p, (b) volume density, Dv, (c) compressive strength, fc, d) flexural strength, fb, and (e) staticelasticity modulus, Eb , for tested model vinyl ester concretes tested. Graph f) shows the dynamicelasticity modulus, Edyn, plotted against the static modulus of elasticity, Estat .

29
Figure 12. Relationships between pulse velocity, vp, and: (a) compressive strength, fc, and(b) flexural strength, fb, for representative samples of industrial precast elements made from vinylester concrete. The dashed line shows the corresponding regression functions for the model vinylester concretes, obtained previously (see Table 6).
Additionally, the effect of aggregate moisture content on polymer concrete properties and thepulse velocity was tested. The investigations were carried out for vinyl-ester mortar (A/B = 4 bymass) and vinyl-ester concrete (A/B = 8 by mass) with aggregates of different moisture contents,wagg (amount of water by mass). The results obtained showed that the decrease of interioradhesion (Fig.13) affected both the PC mechanical properties and the pulse velocity (Fig.14). Asthe moisture level of the aggregates increased, the mechanical properties and the pulse velocitysignificantly decreased. This indicates that aggregates with different moisture levels can be usedfor development of the lower region of the reference curve, for low values of the strength and thepulse velocity. In other words, the variation of these properties with aggregate moisture content isstatistically significant.
Figure 13. SEM micrographs showing examples of PC microstructure with dry (a) and wet (b)aggregate, which had caused different levels of adhesion.
fb = -2.32vp2 + 25.60vp - 46.05
fb = -3,90vp2 + 35,22vp - 50,53
r = 0.71 Cd = 3.6%
5
10
15
20
25
30
35
3.0 3.5 4.0 4.5 5.0vp, km/s
fb, M
Pa
b)
fc = -16.13vp2 + 161.43vp - 340.22
fc = -27.48vp2 + 252.03vp - 489.47
r = 0.84 Cd =6.9%
0
20
40
60
80
100
120
3.0 3.5 4.0 4.5 5.0vp, km/s
fc, M
Paa)

30
Figure 14. Effect of aggregate moisture content on a) mechanical properties: compressivestrength, fc, and flexural strength, fb, and b) pulse velocity, vp, for vinyl-ester mortar andconcrete; w agg – water to aggregate ratio by mass. Error bars represent variation over severalnominally identical samples.
5.3. Ultrasonic estimation of selected properties of epoxy concrete
5.3.1. Materials and resultsThe second stage of the experiment was concerned with the ultrasonic evaluation of epoxy
concrete with different fractions of resin binder (different A/B ratio). The relation between theirproperties and the ultrasonic pulse velocity was tested. A commercial epoxy resin was used as abinder. The same natural quartz, with diameters of (0 to 1.5) mm, (1 to 2) mm, and (2 to 5) mm, wasused as an aggregate, and the same microsilica was used as a micro-filler. Seven types of epoxyconcrete, differing in microstructure and properties, were obtained (Table 7). The materialoptimization approach was used to formulate the composition of the tested epoxy concretes [54]and to obtain a wide range of variability of both concrete properties and pulse velocity. Beam-shaped samples (40 mm x 40 mm x 160 mm) were prepared and used for compressive and bendingtests.
5.3.2. Discussion of resultsThe relationship between the ultrasonic pulse velocity, vp, and the mechanical properties fc and fb
and the structural parameters p, and Dv were analyzed (see Fig.15). Analysis of the results indicatedthat, just as in the vinyl-ester concretes, the best fits to experimental data were obtained usingquadratic polynomial functions (Table 8). For both porosity and volume density vs. pulse velocity, asatisfactory level of statistical significance was obtained. With decreasing p and increasing Dv , pulsevelocity increased. The relationships between the mechanical properties and the propagation of theultrasonic wave were also statistically significant. The regression functions obtained for fc and fbwere characterized by a high value of the correlation coefficient, r > 0.93. In the case of epoxyconcretes with a lower A/B ratio, a relatively high effect of micro-filler addition on pulse velocitywas observed – for concrete with A/B=9 and M/A=0.18 the pulse velocity was higher and
0
20
40
60
80
0 0.5 1 1.5 2
wagg, %
fc, f
b, M
Pa
a)
fc - mortar K/S = 4 fc - concrete K/S = 8 fb - mortar K/S = 4 fb - concrete K/S =8
2
3
4
5
0 0.5 1 1.5 2
wagg, %
v p, k
m/s
vp - mortar K/S = 4 vp - concrete K/S = 8
b)
31
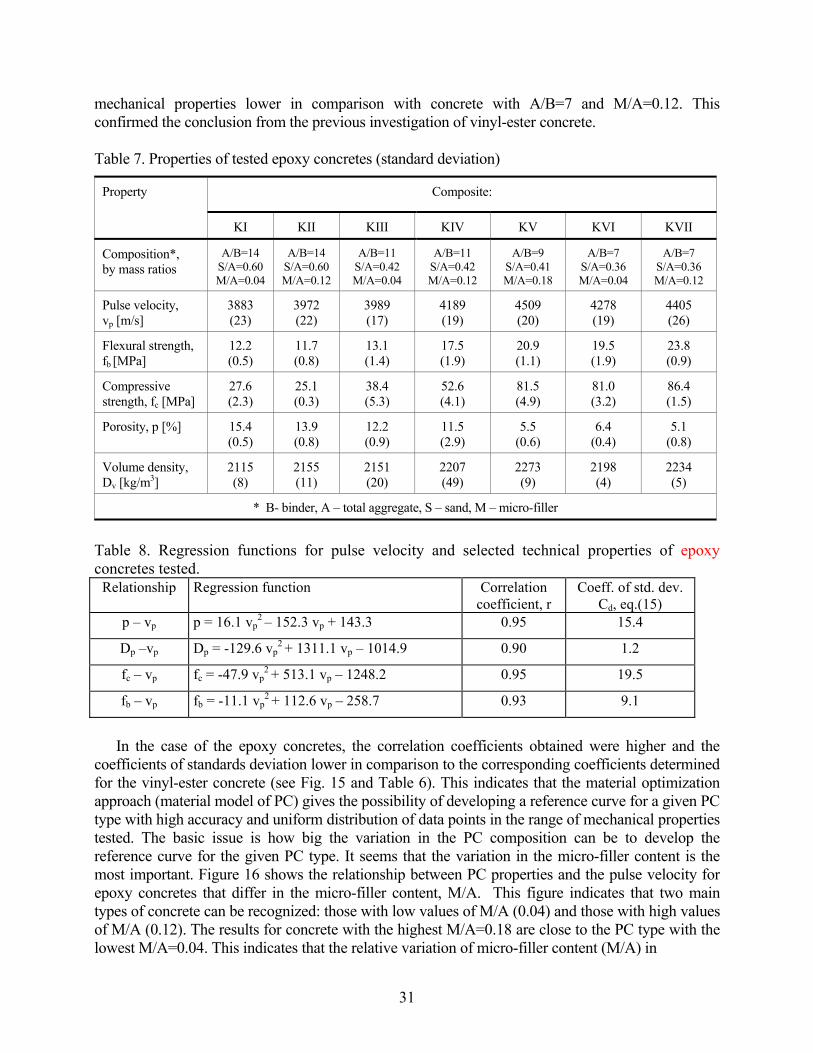
mechanical properties lower in comparison with concrete with A/B=7 and M/A=0.12. Thisconfirmed the conclusion from the previous investigation of vinyl-ester concrete.
Table 7. Properties of tested epoxy concretes (standard deviation)
Composite:Property
KI KII KIII KIV KV KVI KVII
Composition*,by mass ratios
A/B=14S/A=0.60M/A=0.04
A/B=14S/A=0.60M/A=0.12
A/B=11S/A=0.42M/A=0.04
A/B=11S/A=0.42M/A=0.12
A/B=9S/A=0.41M/A=0.18
A/B=7S/A=0.36M/A=0.04
A/B=7S/A=0.36M/A=0.12
Pulse velocity,vp [m/s]
3883(23)
3972(22)
3989(17)
4189(19)
4509(20)
4278(19)
4405(26)
Flexural strength,fb [MPa]
12.2(0.5)
11.7(0.8)
13.1(1.4)
17.5(1.9)
20.9(1.1)
19.5(1.9)
23.8(0.9)
Compressivestrength, fc [MPa]
27.6(2.3)
25.1(0.3)
38.4(5.3)
52.6(4.1)
81.5(4.9)
81.0(3.2)
86.4(1.5)
Porosity, p [%] 15.4(0.5)
13.9(0.8)
12.2(0.9)
11.5(2.9)
5.5(0.6)
6.4(0.4)
5.1(0.8)
Volume density,Dv [kg/m3]
2115(8)
2155(11)
2151(20)
2207(49)
2273(9)
2198(4)
2234(5)
* B- binder, A – total aggregate, S – sand, M – micro-filler
Table 8. Regression functions for pulse velocity and selected technical properties of epoxyconcretes tested.
Relationship Regression function Correlationcoefficient, r
Coeff. of std. dev.Cd, eq.(15)
p – vp p = 16.1 vp2 – 152.3 vp + 143.3 0.95 15.4
Dp –vp Dp = -129.6 vp2 + 1311.1 vp – 1014.9 0.90 1.2
fc – vp fc = -47.9 vp2 + 513.1 vp – 1248.2 0.95 19.5
fb – vp fb = -11.1 vp2 + 112.6 vp – 258.7 0.93 9.1
In the case of the epoxy concretes, the correlation coefficients obtained were higher and thecoefficients of standards deviation lower in comparison to the corresponding coefficients determinedfor the vinyl-ester concrete (see Fig. 15 and Table 6). This indicates that the material optimizationapproach (material model of PC) gives the possibility of developing a reference curve for a given PCtype with high accuracy and uniform distribution of data points in the range of mechanical propertiestested. The basic issue is how big the variation in the PC composition can be to develop thereference curve for the given PC type. It seems that the variation in the micro-filler content is themost important. Figure 16 shows the relationship between PC properties and the pulse velocity forepoxy concretes that differ in the micro-filler content, M/A. This figure indicates that two maintypes of concrete can be recognized: those with low values of M/A (0.04) and those with high valuesof M/A (0.12). The results for concrete with the highest M/A=0.18 are close to the PC type with thelowest M/A=0.04. This indicates that the relative variation of micro-filler content (M/A) in

32
Epoxy concrete: Dmax = 4 mm Vinyl-esterconcrete
Composition A/B=14S/A=0.60M/A=0.04
A/B=14S/A=0.60M/A=0.12
A/B=11S/A=0.42M/A=0.04
A/B=11S/A=0.42M/A=0.12
A/B=9S/A=0.41M/A=0.18
A/B=7S/A=0.36M/A=0.04
A/B=7S/A=0.36M/A=0.12
A/B=8
Dmax= 2-8 mm
Symbol
Figure 15. Regression functions describing relationships between pulse velocity and a) porosity, b)volume density, c) compressive strength, and d) flexural strength, for epoxy and vinyl-ester concretesdiffering in microstructure.
y = -2. 32x2 + 25.60x - 46.05r = 0.8959
y = -11.11x2 + 112.55x - 258.70r = 0.9281
0
5
10
15
20
25
30
3.0 3.5 4.0 4.5 5.0
vp, km/s
fb, M
Pa
y = -16.13x2 + 161.43x - 340.22r = 0.9409
y = -47.9x2 + 513.08x - 1248.2r = 0.9528
0
10
20
30
40
50
60
70
80
90
100
3.0 3.5 4.0 4.5 5.0
vp, km/s
fc, M
Pay = 0.3917x2 + 2.0667x - 2.244r = 0.9263
y = 9.2867x2 - 34.971x + 36.205r = 0.9021
2.8
3.0
3.2
3.4
3.6
3.8
4.0
4.2
4.4
4.6
4.8
1.80 1.90 2.00 2.10 2.20 2.30 2.40
Dv, g/m3
v p, k
m/s
y = 0.0059x2 - 0.2218x + 5.3593r = 0.9160
y = 0.0015x2 - 0.0813x + 4.8098r = 0.9469
2.8
3.0
3.2
3.4
3.6
3.8
4.0
4.2
4.4
4.6
4.8
0 5 10 15 20
p, %
vp, k
m/s
b)
c) d)
a)

33
Figure 16. The pulse velocity vs. a) porosity, b) volume density, c) compressive strength, and d)flexural strength, for epoxy concretes with different micro-filler contents, M/A.
composition of the reference PC type should be not too high. On the basis of the results obtained itcan be proposed that the variation in M/A should be not higher than ± 0.02.
5.3.3. Analysis of relationship between microstructure and ultrasonic wave propagation
Fractography, which was used to determine the fracture surface roughness ratio, RS, wasthen used for characterization of the microstructure of the epoxy concretes tested (Fig.17). It hasbeen shown [55,56] that the fracture surface roughness ratio, RS, is an important parameter that canbe used to characterize the toughness of materials. This parameter is defined as the true fracture
M/A = 0.04 - M/A = 0.12 M/A = 0.18
0
20
40
60
80
100
3.8 4.0 4.2 4.4 4.6vp, km/s
fc, M
Pa
0
5
10
15
20
25
30
3.8 4.0 4.2 4.4 4.6vp, km/s
fb, M
Pa
02468
1012141618
3.8 4.0 4.2 4.4 4.6vp, km/s
p, %
2000
2100
2200
2300
3.8 4.0 4.2 4.4 4.6vp, km/s
Dv,
kg/m
3
a) b)
c) d)

34
surface area, S, divided by the apparent projected area, So: Rs = S/So. In the case of polymerconcrete, the topography of the fracture surface depends not only on the composition (resin binder toaggregate ratio, A/B; porosity and aggregate grain size distribution) but also depends on theadhesion between binder and aggregate [57]. In this case, the Rs parameter can be treated as a factordescribing the PC microstructure in a satisfactory way [58]. The relationship between Rs and pulsevelocity can be used for the nondestructive estimation of polymer concrete toughness.
The value of Rs was determined (Fig.18) using the method of vertical sections [59,60], forrepresentative samples of each type of epoxy concrete at magnifications of 10x, 25x, 63x, 160x,and 400x (see Table 9).
Table 9. The surface roughness ratio, RS, for the epoxy concretes tested
Composite:Property
KI KII KIII KIV KV KVI KVII
Composition*,by mass ratio
A/B=14S/A=0.60M/A=0.04
A/B=14S/A=0.60M/A=0.12
A/B=11S/A=0.42M/A=0.04
A/B=11S/A=0.42M/A=0.12
A/B=9S/A=0.41M/A=0.18
A/B=7S/A=0.36M/A=0.04
A/B=7S/A=0.36M/A=0.12
Surface fractureratio, Rs at mag.:
10x25x63x
160x400x
2.2132.1011.9851.9491.834
2.3082.3571.9701.8891.743
2.3242.1441.9272.0931.924
2.0111.9721.8692.0721.942
1.6601.5981.6541.7121.819
1.6071.5711.5591.8511.815
1.7081.6651.6851.8191.760
* B- binder, A – aggregate (in total), S – sand, M – micro-filler
The results obtained indicated that the relationship between the pulse velocity and the fracturesurface geometry (Fig.19) depends on the observation level or magnification. The relationshipbetween pulse velocity and Rs is statistically significant up to a magnification of 160x. As themagnification increases, the values of the correlation coefficients decrease. At a magnification of400x, which starts seeing the length scales at the micro-filler level, the relationship is no longerstatistically significant. In this case, binder modification by the micro-filler affects pulse velocity tolarger extent than does the purely geometrical features of the microstructure resulting from thecomposition. This confirmed previous conclusions that to develop the reference curve for a given PCtype the variation in micro-filler content should be limited.

35
Figure 17. Examples of microstructures and fracture surface profiles of the epoxy concretes tested.Concrete compositions were designed based on the material model of epoxy concrete [54].
KVII: A/B = 7; S/A = 0.36; M/A = 0.12
KI: A/B = 14; S/A = 0.60; M/A = 0.04
KIII: A/B = 11; S/A = 0.42; M/A = 0.04
KV: A/B = 9; S/A = 0.41; M/A = 0.18 KVI: A/B = 7; S/A = 0.36; M/A = 0.04
KII: A/B = 14; S/A = 0.6; M/A = 0.12
KIV: A/B = 11; S/A = 0.42; M/A = 0.12
A – aggregate in total (mass);B – binder (mass);S – sand (mass);M- micro-filler (mass)

36
Figure 18. Scheme of determination of fracture surface roughness ratio using vertical sectionmethod and image analysis.
400x
10x
25x
63x160x
RS (magnification)
fracturesuface
cuttingi sample
thinning
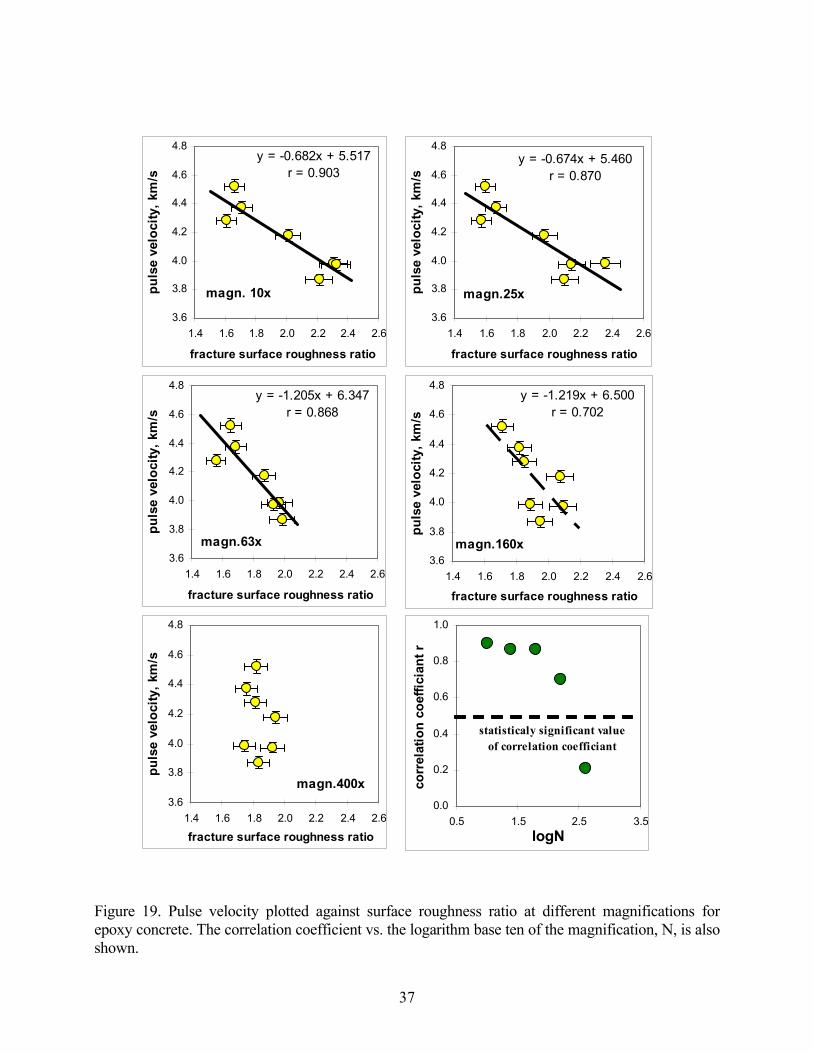
37
Figure 19. Pulse velocity plotted against surface roughness ratio at different magnifications forepoxy concrete. The correlation coefficient vs. the logarithm base ten of the magnification, N, is alsoshown.
y = -0.682x + 5.517r = 0.903
3.6
3.8
4.0
4.2
4.4
4.6
4.8
1.4 1.6 1.8 2.0 2.2 2.4 2.6
fracture surface roughness ratio
puls
e ve
loci
ty, k
m/s
magn. 10x
y = -0.674x + 5.460r = 0.870
3.6
3.8
4.0
4.2
4.4
4.6
4.8
1.4 1.6 1.8 2.0 2.2 2.4 2.6
fracture surface roughness ratio
puls
e ve
loci
ty, k
m/s
magn.25x
y = -1.205x + 6.347r = 0.868
3.6
3.8
4.0
4.2
4.4
4.6
4.8
1.4 1.6 1.8 2.0 2.2 2.4 2.6
fracture surface roughness ratio
puls
e ve
loci
ty, k
m/s
magn.63x
y = -1.219x + 6.500r = 0.702
3.6
3.8
4.0
4.2
4.4
4.6
4.8
1.4 1.6 1.8 2.0 2.2 2.4 2.6
fracture surface roughness ratio
puls
e ve
loci
ty, k
m/s
magn.160x
3.6
3.8
4.0
4.2
4.4
4.6
4.8
1.4 1.6 1.8 2.0 2.2 2.4 2.6
fracture surface roughness ratio
puls
e ve
loci
ty, k
m/s
magn.400x0.0
0.2
0.4
0.6
0.8
1.0
0.5 1.5 2.5 3.5logN
corr
elat
ion
coef
ficia
nt r
statisticaly significant valueof correlation coefficiant

38
5.4. Conclusions concerning ultrasonic evaluation of elements made from polymer concreteOn the basis of the results obtained, the following main conclusions about ultrasonic
assessment of polymer concrete precast elements can be formulated:• the regression functions obtained for vinyl-ester and epoxy concretes justify the possibility of applying ultrasonic methods for the nondestructive evaluation of properties of precast elements made from various polymer concretes;• in engineering practice, a reference curve (ISO-strength curve) should be made for the given
type of polymer concrete, taking into account the type of resin binder and the type of aggregate;• to develop a reference curve for calibration procedures the following parameters can be varied: the aggregate to resin binder ratio, A/B, the sand fraction, S/A, and in a limited range, the micro-filler content, M/A (the variation in M/A should be about 50 %, and the maximum value of M/A should be less than 0.12), and, if necessary, the aggregate moisture content;• the material optimization approach (material model of polymer concrete) gives the possibility of
developing a reference curve for the given PC type with high accuracy and uniform distributionof data points in the tested range of mechanical properties and pulse velocity;
• the pulse velocity, as calculated from the transit time and as the parameter describing theultrasonic wave propagation in a material, is practically useful for the estimation of PCproperties. The amplitude was found to be useless for estimating polymer concrete propertiesbecause of the high level of scatter;
• the obtained results indicate the necessity for further investigation in order to increase theaccuracy of ultrasonic evaluation of polymer concrete properties using advanced methods ofdata processing, e.g, fuzzy logic or Bayes's theory [61], or an advanced method of signalanalysis [62].

39
6. ULTRASONIC EVALUATION OF MULTI-LAYER REPAIR SYSTEMS
6.1. Propagation of ultrasonic waves through the medium boundary
Quality control of the efficiency of repair applications is the basic purpose behind thenondestructive evaluation of the multi-layer systems of polymer concrete on top of portlandcement concrete (PC-CC) that are created as a result of repair techniques. This quality control isfocused mainly on the estimation of the thickness of system elements and the detection of variousdefects at the PC-CC interface. Echo methods are preferred in this field [10]. Recently, the impact-echo method, which was developed at the National Institute of Standards and Technology andCornell University, has appeared as the most promising NDT method for the quality assessment ofconcrete structures [62,63]. However, detection of relatively large and deeply located defects onlyplus expensive equipment are disadvantages of this method.
The adhesion between PC and CC is a crucial property of a repair system. Quality control ofthe adhesion level is available using a semi-destructive method, e.g. a pull-off test (Fig. 20). In anew European Standard, ENV 1504, a pull-off strength higher than 1.5 MPa is recommended. Themeasurement of pull-off strength is usually restricted by contractors to a localized area due to thedestructive character of pull-off strength measurement. Therefore, the development ofnondestructive assessment methods for evaluation of the adhesion between polymer composites andconcrete substrates, and especially a possibility of mapping the adhesion level over a wide region, isone of the important needs in the PC repair field.
The complexity of ultrasonic wave propagation through the PC-CC multi-layer system (seeSection 4) means that for proper nondestructive evaluation of a multi-layer system the properselection of investigation method is very important. In general, the usefulness of two ultrasonicmethods, the echo method and the indirect pulse velocity method, can be considered.
Figure 20. Example of deteriorated industrial floor and evaluation of adhesion with pull-off test

40
6.2. Evaluation of the PC - CC system with echo method
6.2.1. Procedure of the ultrasonic testingThe purpose of this stage of research was the evaluation of the possibility of using the
ultrasonic echo method for estimating the thickness of industrial resin floors and adhesion levelsin the PC-CC system. The investigations were carried out using four commercial transducers* ofvarious frequency characteristics: 0.5LN50, with a frequency of 0.5 MHz, S12HB0.8-3, with afrequency range of 0.8 MHz to 3 MHz, 1V102, with a frequency 1 MHz, and 10V202, operatingat a frequency of 10 MHz and having a delay line.
The floor thickness was determined based on the location of the echo from the PC-CCinterface and the previously determined velocity of the wave in the floor material. The influenceof adhesion differences on the value of the echo amplitude was assumed during analysis of thepossibility of using the echo method for evaluation of the adhesion at the PC-CC interface. Theamplitude was amplified to a level equal to 0.8 of the maximum amplitude. The value of theamplification was defined to be W0.8H. It was assumed that value of W0.8H was a measure of thewave attenuation at the PC-CC interface and corresponded to a measure of the adhesion in thePC-CC system. A commercial ultrasonic gel was applied as the coupling agent. The ultrasonictests of coatings were carried out after 7 d and 28 days of the curing of the portland cementconcrete substrate.
6.2.2. MaterialsTests were performed on samples corresponding to commercial epoxy industrial floors.
The polymer coating was placed on the concrete substrate of the B35 class, with sample sizes of500 mm x 1000 mm x 50 mm. For obtaining various adhesion levels, coatings were placed onconcrete substrate having 8 different kinds of surface states: dry, wet, oiled, and with primer(Fig. 21a). The variability of the coating thickness over a sample surface was obtained by a slightinclination of the substrate. Additionally, beam samples from the floor material, 40 mm x 40 mmx 160 mm were prepared for determination of the ultrasonic wave velocity in the tested polymercoating and for calibration of the measurement equipment. The measurements were carried outalso for a floor that was disbonded to the concrete substrate. In this case, the polymer coatingwas applied to a layer of metallic foil and after hardening placed onto a concrete substrate(Fig.21b). This corresponded to a "zero adhesion" state of the PC-CC system.
* Certain commercial equipment is identified in this report in order to adequately specify the experimentalprocedure. In no case does such identification imply recommendation or endorsement by the National Institute ofStandards and Technology, nor does it imply that the equipment used is necessarily the best available for thepurpose.

41
Figure 21. Scheme of ultrasonic evaluation of (a) different adhesion levels and (b) the “zero-adhesion” state.
6.2.3. Determination of adhesion
Adhesion between the polymer coating and the concrete substrate has been characterizedby the bond strength in the pull-off test. Steel cylindrical “dollies” of 50 mm diameter wereglued to the coating with epoxy glue. The floor layer and concrete substrate were drilled to adepth of 10 mm. The pull-off bond strength was determined using a digital tester after ultrasonictesting was completed.
6.2.4. Results of testing using echo method
The reflection coefficient, R, was determined for the floor and concrete substrate system.For that reason, the density and the ultrasonic pulse velocity for the floor material and concretesubstrate were first determined separately. The ultrasonic wave velocity obtained for the epoxy floorwas equal to 2650 m/s ± 10 m/s. This value agrees well with literature data [64]. The apparentdensity of the floor was 1589 kg/m3 ± 12 kg/m3. The ultrasonic velocity and density for the concretesubstrate were 4100 m/s ± 24 m/s and 2220 kg/m3 ± 22 kg/m3, respectively. Using these values, theacoustic impedances were calculated:
- epoxy floor: Z1 = cp · ρp = 4.21 · 106 kg/m2s- concrete substrate: Z2 = cb · ρb = 9.102 · 106 kg/m2s
The value of the reflection coefficient for the epoxy floor – concrete substrate system, calculatedfrom eq.16, was then:
R =12
12
ZZZZ
+−
= 0.37 kg/m2s
The value obtained is relatively high (Fig. 7), showing that obtaining information on the floor –concrete interface separation surface using ultrasonic techniques is possible even without completedelamination.
Measurements of the floor thickness using the echo method after 7 days of curing werecarried out for checking the usefulness of the transducers for evaluating the state of the PC-CC
b) zero adhesiona) variable adhesion
PC coating
Concrete substratewith different
surface quality
Concrete substrate

42
interface. Transducers S12HB0.8-3 and 10V202 appeared to be the most useful compared to theother transducers. The echo from the floor – substrate separation interface was visible in therecorded signal (Fig. 22 a, b), but the echo from the bottom of the substrate was not visible. Thisis favorable for the testing of coatings due to the reduction of disturbing echoes, e.g. from thereinforcement. The remaining transducers were not useful for evaluating the state of the PC-CCsystem. Transducers 0.5LN50 and 1V102 had too large of a dead zone and the floor signalinterfered with the input impulse (Fig. 22 c, d). However, transducer 0.5LN50 recorded the echofrom the substrate bottom. Transducers S12HB0.8-3 and 10V202 were selected for furthertesting.
The floor thickness and amplification coefficient W0,8H were measured in the first stageusing the ultrasonic echo method. The tests were performed in 9 uniformly distributed measuringpoints of every field. Then the pull-off bond strength was determined in 4 places of each field. Afterdetachment of the dollies, the real thickness of the floor was measured in 4 places of each dollyusing a Brinell magnifier. Results of these measurements are given in Table 10. The distributions offloor thickness over a given slab, measured directly with the magnifier and estimated by ultrasonicmethods, are presented in Fig. 23. In all cases, the thickness distribution was determined using theleast squares method of estimation with the same parameters.

43
Figure 22. Registered signal (A-scan) after testing the floor system of 2 mm thick layered onconcrete substrate with echo method using: a) S12HB0.8-3, b) 10V202, and c) 0.5LN50, 1V102.The signals recorded in (a) and (b) contain echoes from the interface floor - concrete substrate.
a)
c)
depth
depth depth
Rel
ativ
e am
plitu
de
Rel
ativ
e am
plitu
de
Rel
ativ
e am
plitu
de
Rel
ativ
e am
plitu
de
2.2 mm – echo frominterface PC-CC
56 mm – echofrom bottomof concretesubstrate
depth
2.0 mm – echo frominterface PC-CC
Overlappingwith echo from
transmitter
d) depth
echo fromdelay line
depth
b)

44
Figure 23. The floor thickness distributions measured with magnifier (a) and estimated withultrasonic echo method (b,c) for the S12HB0.8-3 and 10V202 transducers, respectively.
1 1,5 2 2,5 3 3,5 4 4,5 5 ponad
length, cm
wid
th, c
m
0
5
10
15
20
25
30
35
40
45
50
0 10 20 30 40 50 60 70 80 90 100
1 1,5 2 2,5 3 3,5 4 4,5 5 ponad
length, cm
wid
th, c
m
0
5
10
15
20
25
30
35
40
45
50
0 10 20 30 40 50 60 70 80 90 100
1 1,5 2 2,5 3 3,5 4 4,5 5 ponad
length, cm
wid
th, c
m
0
5
10
15
20
25
30
35
40
45
50
0 10 20 30 40 50 60 70 80 90 100
a)
a)
b)
c)
above
above
above

45
Table 10. Results of floor thickness estimation and pull-off strength measurements
Ultrasonic testingTransducer S12HB0.8-3 Transducer 10V202
Thickness tU-E, mm Amplification, dB Thickness tU-E, mm Amplification, dB"true" thickness
t, mm
pull-off strength,MPa
PoleMeanvalue
Standarddeviation
Mean value Standarddeviation
Mean value Standarddeviation
Mean value Standarddeviation
Mean value Standarddeviation
Mean value Standarddeviation
After 7 d of hardening1 4.14 0.56 48.32 1.81 4.180 0.540 74.100 1.208 - - - -2 4.57 0.55 51.11 3.37 4.460 0.918 74.080 4.479 - - - -3 3.04 0.38 49.86 3.08 2.840 0.358 67.620 3.776 - - - -4 2.69 0.56 48.78 3.43 2.500 0.430 69.040 2.752 - - - -5 3.37 0.43 51.00 1.99 3.280 0.363 71.100 0.806 - - - -6 2.92 0.34 47.41 1.70 2.960 0.477 72.013 5.276 - - - -7 2.73 0.17 48.97 2.64 2.640 0.329 71.060 1.960 - - - -8 2.17 0.23 47.67 2.57 2.200 0.453 65.720 2.729 - - - -
After 28 d of hardening1 4.44 0.60 63.73 2.32 4.080 0.638 86.560 2.482 3.88 0.66 2.87 0.342 4.72 0.39 66.11 3.11 4.600 0.696 86.760 3.692 4.21 0.63 0.66 0.523 3.10 0.36 63.67 3.21 2.860 0.428 83.340 3.303 2.29 0.48 0.95 0.444 2.81 0.61 64.47 3.45 2.440 0.503 81.000 3.156 1.98 0.56 2.75 0.255 3.52 0.52 65.21 2.18 3.200 0.424 82.440 2.981 2.96 0.37 0.52 0.116 3.24 0.37 60.93 2.46 3.000 0.361 82.960 1.071 2.67 0.38 1.37 0.437 2.84 0.22 62.62 3.17 2.540 0.365 79.720 1.221 2.36 0.31 0.96 0.248 2.32 0.29 59.67 3.10 2.220 0.377 78.260 2.269 2.07 0.15 0.80 0.21

46
6.2.5. Discussion of results
The floor thickness distributions presented in Fig. 23 indicated that the ultrasonicmeasurements with the echo method reproduced the trends in floor thickness very well. However,in comparison to the thickness distribution obtained directly with the Brinell magnifier, theultrasonic method overestimated the floor thickness by about 0.3 mm to 0.5 mm, depending onthe transducer type. The thickness measurement results were statistically analyzed to find arelationship between the thickness as determined with different methods. The floor thickness asestimated by the ultrasonic method after 7 d and 28 d of curing is in very good agreement(correlation coefficients r > 0.95) with the "true" thickness (Fig. 24) for both transducers. Thethicknesses as estimated by the two transducers are close to each other. This displays the goodrepeatability of the ultrasonic method. In general, the relationship between thickness measuredwith magnifier, t, and thickness as estimated with ultrasonic method, tU-E, can be described by asimple linear function:
t = A tU-E (17)
The correction coefficient A equals 0.88 for the S12HB0.8-3 transducer and 0.90 for the 10V202transducer. The value of the A coefficient mainly depends on the transducer type, but hardeningtime and presence of the coupling agent can also affected the estimated value of thickness. It wasobserved that as the hardening time of the floor increased the A coefficient increased at anapproximately constant dosage of coupling agent. This implies that during nondestructiveevaluation of floor thickness a suitable correction coefficient should be introduced taking intoaccount the device type, coupling agent used, and hardening time. The results obtained indicatedthat a value of the "A" coefficient equal to 0.89 is acceptable for both transducers. Surprisinglygood results were also obtained for the 10 MHz transducer, which was theoretically moresusceptible to ultrasonic wave attenuation than were the lower frequency transducers.
Analysis of the amplification coefficient (W0.8H ) results showed that a relation betweenthe level of amplification and the pull-off bond strength did not exist (Fig. 25) for both hardeningtimes. The value of attenuation W0.8H for a "zero-adhesion" state of polymer coating (see Fig. 21)was located between the points corresponding to different levels of adhesion. This indicated thatevaluation of the adhesion in PC-CC systems with an ultrasonic echo method is difficult becauseof the high difference between the acoustic impedances of the PC coating and concrete substrate.In the case of the 10V202 transducer (frequency 10 MHz), a statistically significant relationbetween thickness and amplification was observed. This implies that the differences found in thevalues of the amplification coefficient W0.8H measured on fields with various adhesion levels maybe at least 70 % the result of the differences in the floor thickness (Fig. 26 a). The effect of thefloor thickness was less significant in the case of the S12HB0.8-3 transducer (Fig. 26b). Astatistical significance with high determination coefficient was obtained for the relationshipbetween attenuation W0.8H and the "true" thickness as measured with the magnifier (Fig. 26c).
The results obtained confirmed that the ultrasonic echo method can be useful for the non-destructive evaluation of the polymer coating floor thickness. However, there is need for furtherinvestigation to establish optimal parameters for the ultrasonic measurements, which are mainlythe type and the frequency characteristics of the transducers used.

47
Figure 24. Relationship between "true" value of floor thickness and estimated with ultrasonic echomethod using transducer a) S12HB0.8-3, b) 10V202, and c) thickness estimated with bothtransducers.
7 d 28 d of hardening
a)
b)
c)
y = 0.882xR2 = 0.913
y = 0.838xR2 = 0.930
1
2
3
4
5
1 2 3 4 5 6
t U-E, mm
t, m
m
y = 0.904xR2 = 0.961
y = 0.886xR2 = 0.968
1
2
3
4
5
1 2 3 4 5 6
t U-E, mm
t, m
m
y = 1.002xR2 = 0.967
y = 1.078xR2 = 0.9764
1
2
3
4
5
1 2 3 4 5
t(S12HB0,8-3), mm
t(10V
202)
, mm

48
a) b)
Figure 25. Pull-off strength against amplification W0.8H for tested epoxy floor system withtransducers: a) S12HB0.8-3 and b) 10V202
7 d 28 d of hardening
44
46
48
50
52
54
0 1 2 3 4pull-off strength, MPa
W0,
8H, d
B
W0,8H for "zero adhesion" state
606264666870727476
0 1 2 3 4pull-off strength, MPa
W0,
8H, d
B
W0,8H for "zero adhesion" state
c)
Figure 26. Amplification coefficient W0.8Hplotted against the estimated thickness tU-E forepoxy floor systems tested with transducers: a)S12HB0.8-3 and b) 10V202; c) amplificationcoefficient W0.8H vs. "true" thickness for bothtransducers after 28 d of floor hardening.
b)a)
7 d 28 d of hardening
R2 = 0.79
R2 = 0.31
40
45
50
55
60
2 3 4 5tU-E, mm
W0,
8H, d
B
R2 = 0.90
R2 = 0.70
60
65
70
75
80
2 3 4 5tU-E, mm
W0,
8H, d
B
S12HB 0.8-3: R2 = 0.72
10V202: R2 = 0.90
40
50
60
70
80
2 3 4 5t, mm
W0,
8H, d
B

49
6.3. Evaluation of multi-layer system with pulse velocity method
6.3.1. Ultrasonic test procedureThe ultrasonic evaluation of adhesion in the PC-CC system was carried out using the indirect
pulse velocity method. It was assumed that areas with poor adhesion influence the recordedwaveforms (Fig. 27) by attenuating the reflections more rapidly. In consequence, the changes inparameters describing the waveform were used to describe the adhesion in the PC-CC system.
Figure 27. Received ultrasonic pulse for (a) good adhesion and (b) poor adhesion in the PC-CCsystem.
The investigations were carried out with a commercial concrete tester with sets of associatedtransducer pairs (Fig. 28). The source pulse frequency of the compressive wave was 100 kHz. Thedistance between transducers was fixed and equal to 80 mm. A gel was used as a coupling mediumto improve acoustic contact between the samples and the transducers. The transmitted wave pulsewas transformed into digital signals (sampling period 0.2 µs) by an A/D converter system and thenfed into a microcomputer for a waveform analysis. The time versus voltage record was averagedwith six previously recorded pulse signals to reduce the effects of random noise and theheterogeneity of the microstructures of both the polymer composites and the concrete substrate.Each ultrasonic pulse was recorded after tester stabilization was indicated. These nondestructivemeasurements were carried out after 7 d of hardening of each type of coating.
The propagation of ultrasonic waves through the PC-CC system was characterized by thepulse velocity, calculated from the transit time, and by the changes of a mean square valueparameter, MS(t), defined in the time domain. The MS value at a given time was calculated from theformula:
( )oi
i
ii
nn
n
nAA
tMS
o
o
−=∑−
)( (18)
where Ai is the amplitude of the ith-recorded point [V] and no is the number of the first point withamplitude different than zero. The plot of the MS value describes the amplitude variance in the timedomain and is a representation of the attenuation of the wave pulse. In this work, we assumed thatfor a sample area of poor adhesion, the MS value would statistically decrease faster than for an areaof high adhesion. This assumption is justified by results like those shown in Fig. 27.
a) b)
- 1 2
- 9
- 6
- 3
0
3
6
9
1 2
t i m e [ µ s ]
ampl
itude
[V]
- 1 2
- 9
- 6
- 3
0
3
6
9
1 2
t i m e [ µ s ]
ampl
itude
[V]

50
Figure 28. Scheme of ultrasonic procedure for evaluation of adhesion between polymer compositesand concrete substrate.
6.3.2. Materials and tested floor systems
The investigations were carried out for the polymer industrial floor systems described inTable 11: epoxy (EP), polyurethane (PUR) and vinyl ester (VE) coatings. All coating systems werelayered on a portland cement concrete substrate (B35 class, which has a characteristic compressivestrength of 35 MPa), prepared from the same concrete mix. This concrete class was selected to havea relatively strong substrate in order to obtain failure in the PC-CC bond line (adhesive failure mode)and to be close to the real concrete substrate used in the floor industry (concrete with compressivestrengths greater than 25 MPa). For the evaluation of the usability of the pulse velocity method forassessment of the adhesion, three experiments were carried out:
travel time
pulse velocity
Time [µs]Mea
nsq
uare
valu
e,M
S
Transmittingtransducer
Receivingtransducer
i
i
n
A=MS(t)
2∑
80

51
- ultrasonic evaluation of adhesion at maximum and minimum adhesion levels,- analysis of relationship between pull-off strength and ultrasonic parameters,- ultrasonic detection of defects in the PC-CC system.
Table 11. Chemical composition and pull-off strength of tested polymer coatings (from producer technical data sheets)
Symbol of polymer coatingPropertyEP-1 EP-2 PUR VE
Chemical composition Waterdispersion ofepoxy resin
Epoxyresin
Polyurethaneresin
Vinyl-esterresin
Number of components 2 2 2 1+3 (hardening system)
Max. grain size of fine filler, mm < 0.1 < 0.1 < 0.1 < 0.125Nominal thickness, mm 0.7 - 3 1 - 5 0.5 - 4 1 - 3Pull-off strength (concrete substrate:compressive strength > 25MPa)
> 1.5 MPa > 2.5 > 2 > 1.7
6.3.3. Ultrasonic evaluation of adhesion at boundary conditions
The pulse waveforms were analyzed for two boundary conditions (Fig. 29):- maximum adhesion (for a given type of polymer coating),- zero-adhesion (corresponding to delamination).
To simulate delamination the polymer coating was prepared on a metallic foil with an anti-adhesion agent, and next put onto a cement concrete substrate. The investigations were carried outfor three commercial floor systems: EP, PUR and VE, of nominal thickness 3 mm and containing aquartz filler (maximum grain diameter Dmax < 0.1 mm).
a) b)
Figure 29. Scheme of ultrasonic evaluation of adhesion for two conditions: (a) maximum adhesionand (b) zero-adhesion.
The average pull-off strength obtained for the EP, VE and PUR coating systems wasequal to 3.23 MPa, 3.45 MPa, and 2.10 MPa, respectively. Cohesive failure in the concretesubstrate was obtained during the pull-off test for the EP and VE coatings. In the case of the PURcoating, a mixed failure mode (70 % cohesive failure in concrete and 30 % adhesive failure in the
3mm
maximum adhesionzero adhesion

52
PC-CC bond line) was observed. This confirmed that for the “maximum adhesion” state highadhesion in the PC-CC system was actually developed. On the basis of waveform analysis, thetransit time and the MS value (Fig. 30) were selected as useful parameters for furtherinvestigations. The amplitude values registered by the tester were not significantly correlatedwith the adhesion level for all tested systems.
The MS values for coatings with maximum adhesion and zero adhesion were significantlydifferent. The MS plot determined for the concrete substrate without any polymer coating waslocated between the MS plots for the coatings with maximum adhesion and with zero-adhesion.In the case of the epoxy coating, the pulse velocity for the zero-adhesion state, vp = 2623 m/s,was close to the pulse velocity determined with the direct method, vp = 2650 m/s (see. p.6.2).This result confirmed that the ultrasonic wave penetrated both the polymer coating and theconcrete substrate. In the case where delamination was present, the ultrasonic wave traveled onlythrough the polymer coating. The highest difference of the MS value between the maximumadhesion state and the zero adhesion state was observed to fall in the range of 400 µs to 700 µs inthe time domain. The MS value at 500 µs in the time domain was used in most of the analysis inthis report.
Figure 30. The pull-off strength, pulse velocity and MS distribution in the time domain for thetested polymer coating systems.
0
10
20
30
40
50
60
0 200 400 600 800 1000 1200 1400 1600
time of pulse propagation [µs]
Mea
n sq
uere
val
ue M
S(t)
[V*V
]
VE(1)
EP(2)
PUR(3)
CC
EP(5)
PUR(6)
VE(4)
Floorsystem
Pull-offstrength[MPa]
Pulse velocity[km/s]
(stand. dev.)
Floorsystem
Pull-offstrength[MPa]
Pulse velocity[km/s]
(stand. dev.)VE(1) 3.45 4.460 (0.032) VE(4) - 2.703 (0.012)EP(2) 3.23 4.460 (0.032) EP(5) - 2.623 (0.007)
PUR(3) 2.10 4.420 (0.020) PUR(6) - 2.339 (0.010)
CC: pulse velocity 4.908 km/s (stand. dev. 0.030)

53
6.3.4. The effect of chemical composition and geometry of polymer coating
Ultrasonic wave propagation through the PC-CC system [64] was analyzed for each type offloor system and for three thickness values of the polymer coating: 1 mm, 2 mm, and 4 mm.Additionally, the effect of using coarse filler, 0.3 mm to 0.7 mm in size, on wave propagation wastested. This kind of filler is commonly added to improve the abrasion resistance of a polymercoating.
The results obtained indicate that ultrasonic wave propagation through the PC-CC system isaffected by the type of resin binder, the presence of coarse filler, and the thickness of the polymercoating. The addition of the coarse filler (Fig. 31) significantly decreased the pulse velocity and theMS value for the EP-1 coating, while for the PUR system this effect was not significant. As thecoating thickness increased, the pulse velocity and MS value decreased (Fig. 32). The largestchanges were observed for the EP-1 and PUR floor types. In the case of the EP-2 coating, the effectof coating thickness was less significant. The results indicate that for proper ultrasonic evaluation ofadhesion in a PC-CC system, a suitable reference curve should be determined, with coatingcomposition and thickness considered as factors affecting the propagation and attenuation ofultrasonic waves. The value of the coating thickness can be verified using the echo method (seep.6.2).
Figure 31. MS value distribution for (a) EP-1 and (b) PUR coatings with and without coarse filler
0
10
20
30
40
50
60
0 500 1000 1500
time (µs)
mea
n sq
uare
val
ue M
S (V
*V)
w ith filler
w ithout filler
1 mm
4 mm1 mm
a)
0
10
20
30
40
50
60
0 500 1000 1500
time (µs)
mea
n sq
uare
val
ue M
S (V
*V)
w ith filler
w ithout filler
1 mm
4 mm
b)

54
Figure 32. Pulse velocity (a) and MS value distribution (b) for three values of the thickness ofthe polymer coatings.
4.794.59
4.28 4.304.10
3.894.12
3.943.71
3.0
4.0
5.0
6.0
1 mm 2 mm 4 mm 1 mm 2 mm 4 mm 1 mm 2 mm 4 mm
puls
e ve
loci
ty (k
m/s
)
EP-1EP-2
PUR a)
10
20
30
40
50
0 500 1000 1500time (µs)
mea
n sq
uare
val
ue M
S (V
*V)
EP-1 (1 mm) EP-1 (2 mm) EP-1 (4 mm)EP-2 (1 mm) EP-2 (2 mm) EP-2 (4 mm)PUR (1 mm) PUR (2 mm) PUR (4 mm)
b)
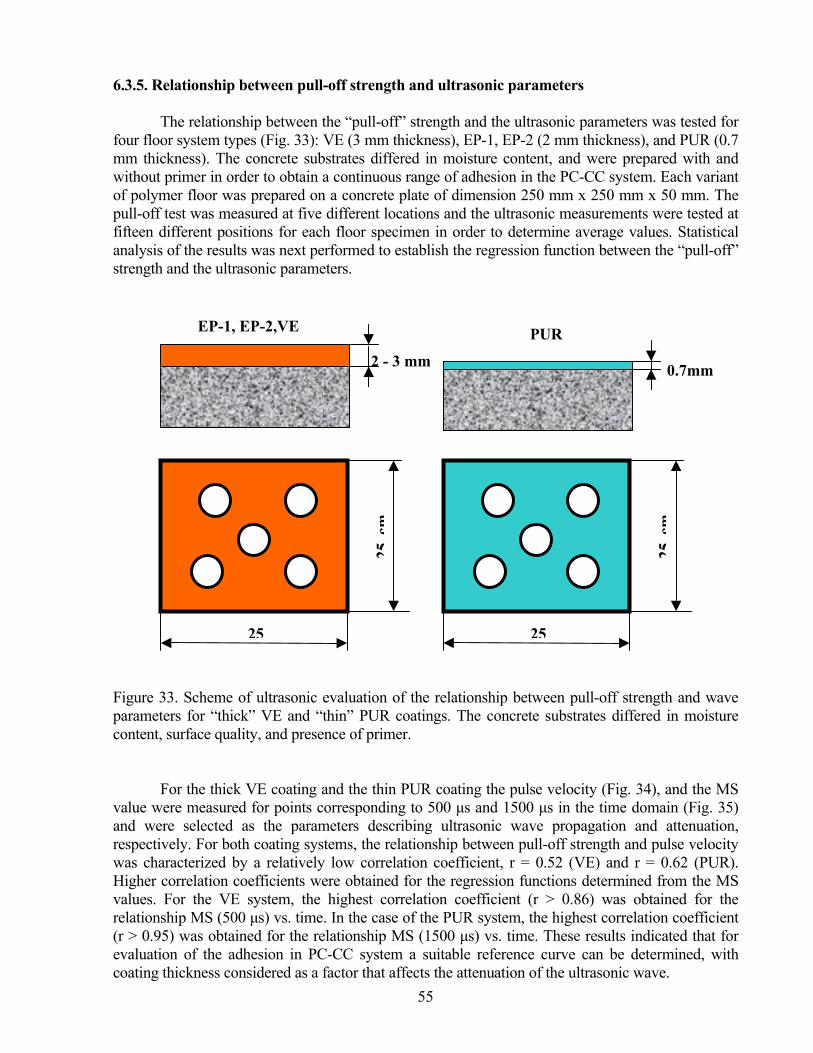
55
6.3.5. Relationship between pull-off strength and ultrasonic parameters
The relationship between the “pull-off” strength and the ultrasonic parameters was tested forfour floor system types (Fig. 33): VE (3 mm thickness), EP-1, EP-2 (2 mm thickness), and PUR (0.7mm thickness). The concrete substrates differed in moisture content, and were prepared with andwithout primer in order to obtain a continuous range of adhesion in the PC-CC system. Each variantof polymer floor was prepared on a concrete plate of dimension 250 mm x 250 mm x 50 mm. Thepull-off test was measured at five different locations and the ultrasonic measurements were tested atfifteen different positions for each floor specimen in order to determine average values. Statisticalanalysis of the results was next performed to establish the regression function between the “pull-off”strength and the ultrasonic parameters.
Figure 33. Scheme of ultrasonic evaluation of the relationship between pull-off strength and waveparameters for “thick” VE and “thin” PUR coatings. The concrete substrates differed in moisturecontent, surface quality, and presence of primer.
For the thick VE coating and the thin PUR coating the pulse velocity (Fig. 34), and the MSvalue were measured for points corresponding to 500 µs and 1500 µs in the time domain (Fig. 35)and were selected as the parameters describing ultrasonic wave propagation and attenuation,respectively. For both coating systems, the relationship between pull-off strength and pulse velocitywas characterized by a relatively low correlation coefficient, r = 0.52 (VE) and r = 0.62 (PUR).Higher correlation coefficients were obtained for the regression functions determined from the MSvalues. For the VE system, the highest correlation coefficient (r > 0.86) was obtained for therelationship MS (500 µs) vs. time. In the case of the PUR system, the highest correlation coefficient(r > 0.95) was obtained for the relationship MS (1500 µs) vs. time. These results indicated that forevaluation of the adhesion in PC-CC system a suitable reference curve can be determined, withcoating thickness considered as a factor that affects the attenuation of the ultrasonic wave.
2 - 3 mm
EP-1, EP-2,VE PUR
0.7mm
25
25cm
25
25cm

56
Figure 34. Pulse velocity against pull-off strength for (a) "thick" VE and (b) “thin” PUR coatings
Figure 35. Relationship between mean square value MS and pull-off strength calculated for the VEcoating: (a) MS (500 µs) and (c) MS (1500 µs), and for the PUR coating: (b) MS (500 µs) and (d)MS (1500 µs).
In the case of the EP-1 and EP-2 coatings [64], the pulse velocity was approximatelyconstant (Fig. 36a) for a wide range of the pull-off strength, 1 MPa to 3.5 MPa, and its value was
y = 0.1872x + 4.1077R2 = 0.2758
4.3
4.4
4.5
4.6
4.7
4.8
0 2 4 6pull-off strength, MPa
puls
e ve
loci
ty, k
m/s
a)
y = 0.0776x + 4.3326R2 = 0.3813
4.3
4.4
4.5
4.6
4.7
4.8
0 2 4 6pull-off strength, MPa
puls
e ve
loci
ty, k
m/s
b)
y = 14.547Ln(x) + 33.406R2 = 0.7327
0
10
20
30
40
50
60
0 1 2 3 4pull-off strength, MPa
MS(
500)
, V*V
a)
y = 9.8131Ln(x) + 39.042R2 = 0.7508
10
20
30
40
50
60
0 1 2 3 4pull-off strength, MPa
MS(
500)
, V*V
b)
y = 8.4589Ln(x) + 16.769R2 = 0.646
0
10
20
30
40
50
0 1 2 3 4pull-off strength, MPa
MS(
1500
), V*
V
c)
y = 17.055Ln(x) + 18.826R2 = 0.9028
0
10
20
30
40
50
0 1 2 3 4
pull-off strength, MPa
MS(
1500
), V*
V
d)

57
significantly higher in comparison with the velocity measured for the "zero-adhesion" state. For bothepoxy coatings, the relationship: MS (500 µs) vs. pull-off strength (Fig. 36b) was characterized by ahigh correlation coefficient value: r > 0.97. The relationship of MS (500 µs) vs. the pull-off strengthcan be described by the following formula:
EP-1: MS (500 µs) = -3.43 fa2 +23.17 fa + 3.58 (19)
EP-2: MS (500 µs) = -2.68 fa2 +18.44 fa + 8.64 (20)
where the MS (500 µs) value is in V*V and the pull-off strength, fa , is in MPa.For all coating systems tested, adhesive or mainly adhesive failure modes were observed up
to approximately 2.0 MPa. As the pull-off strength increased above this point, the failure modeapproached pure cohesive failure in the concrete substrate. The results obtained indicate thatrelationships between the pull-off strength and the parameters of ultrasonic wave propagation arevalid for only a limited range of pull-off strength. This is a result of the nature of the pull-off test –maximum bond strength corresponds to the tensile strength of the concrete substrate. On the otherhand, if the adhesion of the polymer coating to the concrete substrate is high the acoustic coupling isenough to propagate an ultrasonic wave through the PC-CC system. Figures 35 and 36 show that theMS (500 µs) value attained a maximum when the pull-off strength achieved a maximum value closeto the tensile strength of the concrete substrate.
Figure 36. Pulse velocity (a) and MS (500 µs) value (b) vs. the pull-off strength for the epoxycoatings tested.
6.3.6. Ultrasonic detection of defects in PC-CC systemThe possible ultrasonic detection of defects in a PC-CC system was tested for the EP-1 and
EP-2 epoxy coatings that had artificial defects introduced at the PC-CC interface In the first part ofexperiment, ultrasonic defect detection was performed for floor systems having an unknownrelationship between the pull-off strength and various ultrasonic parameters. In second part of the
EP-1 - EP-2; results for PUR coating at maximum and zero adhesion state
2
3
4
5
0 1 2 3 4
pull-off strength (MPa)
puls
e ve
loci
ty (k
m/s
)
a) y = -2.68x2 + 18.44x + 8.64r = 0.999
y = -3.43x2 + 23.17x + 3.58r = 0.997
0
10
20
30
40
50
0 1 2 3 4
pull-off strength (MPa)
MS
(500
µs)
, V*V
b)

58
experiment, an approximate relationship between the pull-off strength and the MS value was used tocompute the adhesion mapping.
In the first part of the experiment, the EP-2 epoxy coating (3 mm thick) was layered on aconcrete plate having dimensions 600 mm x 30 mm x 50 mm. Artificial defects were prepared in theform of polyethylene thin film sheets of different shape and dimensions, which were put on theconcrete substrate under the top coating (Fig. 37). The EP-2 floor sample was divided into a regulargrid. At the nodes of this grid, six ultrasonic measurements were carried out in two perpendiculardirections. After the ultrasonic measurements were performed, the “pull-off” strength was alsomeasured at the nodes of the grid.
Figure 37. Sample for ultrasonic detection of defects in PC-CC system
The results obtained for the ultrasonic measurements and the pull-off strength at particularnodes of the grid were analyzed next. The results were created in two separate groups ofmeasurement points – one for a low and one for a high value of the pull-off strength. This impliesthat from a statistical point of view, the plots obtained for pull-off strength vs. pulse velocity (Fig.38a) and pull-off strength vs. the MS (1500 µs) value (Fig. 38b) could not be used as referencecurves for nondestructive estimation of the pull-off strength. The negative exponential approach toestimation was used to determine the distributions of the measured pull-off strength (Fig. 38c) andthe MS (1500 µs) value (Fig. 38d). In general, the pull-off strength and the MS (1500 µs) value weredecreased in the defect areas. However, the MS value distribution, in contrary to the pull-off strengthdistribution, indicated the defect presence (coordinates: 200 mm, 200 mm). It was confirmed in thepull-off test. The results obtained indicate that the ultrasonic pulse method can be used for defectdetection in PC-CC systems, at least as an introductory test.
The same experiment was carried out for the EP-1 and EP-2 floors [64], for which therelationship between the pull-off strength and MS (500 µs) value was already established. The EP-1and EP-2 epoxy coatings (2 mm thick) were layered on concrete substrates of dimensions 400 mm x400 mm x 50 mm. Artificial defects were prepared in the same way as previously, and thespecimens were divided into a regular grid. At the nodes of this grid, eight ultrasonic measurementswere carried out in directions inclined at 45o to each other. In selected nodes, the pull-off strengthwas also determined. The results of the ultrasonic measurements were statistically analyzed. Theleast squares method of estimation was used to determine the distribution of the MS (500 µs) valuefor the EP-1 and EP-2 coatings (Fig. 39). Equations 2 and 3 were used to obtain the correspondingpull-off strength distribution (see the right scale in Fig. 39). A low pull-off strength was obtained
3 mm
EP
60
30

59
only when a steel dolly was placed completely in the defect area. In general, the experimental pulloff strength was higher than 2 MPa, even at the points where steel dollies were partially placed in thedefect area. This can lead to overestimation of the pull-off strength. Contrary to the experimentalresults of the pull-off strength, the MS value distribution properly indicated the presence of defects.The MS (500 µs) value decreased at defect sites and the corresponding variational coefficient of theMS value increased.
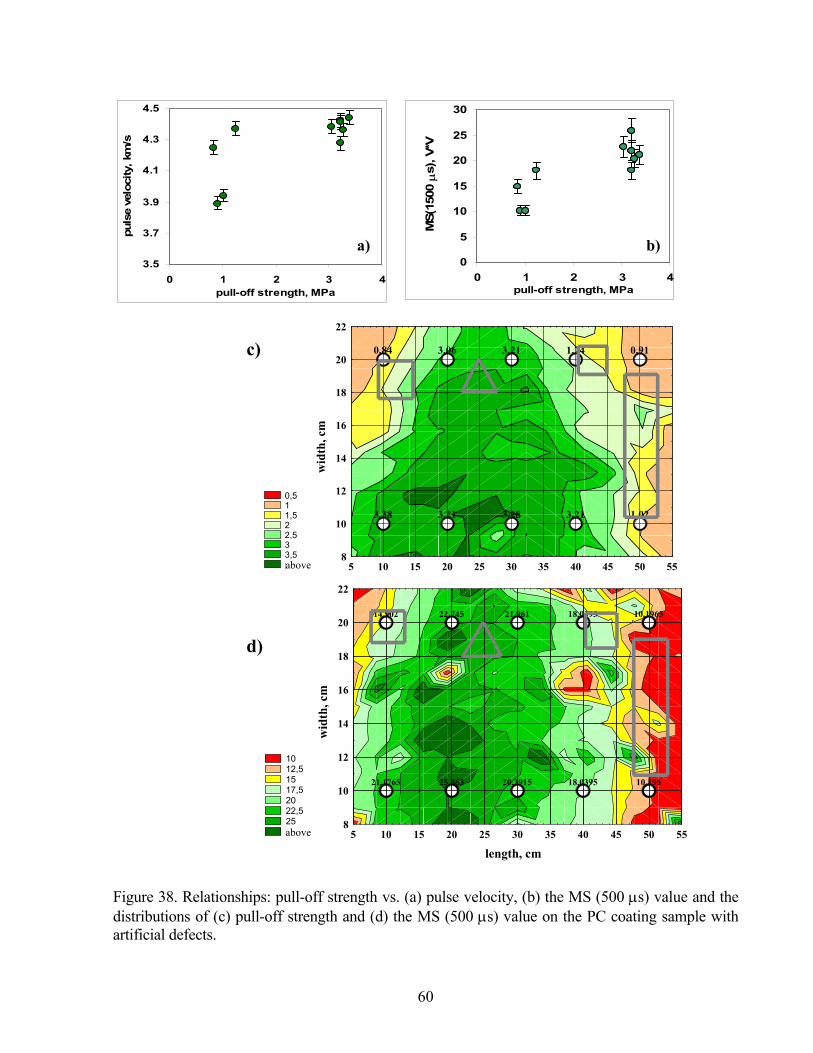
60
Figure 38. Relationships: pull-off strength vs. (a) pulse velocity, (b) the MS (500 µs) value and thedistributions of (c) pull-off strength and (d) the MS (500 µs) value on the PC coating sample withartificial defects.
3.5
3.7
3.9
4.1
4.3
4.5
0 1 2 3 4pull-off strength, MPa
puls
e ve
loci
ty, k
m/s
0
5
10
15
20
25
30
0 1 2 3 4pull-off strength, MPa
MS(
1500
µs)
, V*V
a) b)
0,5 1 1,5 2 2,5 3 3,5 ponad
length, cm
wid
th, c
m
3,38 3,21 3,28 3,21 1,02
0,84 3,06 3,21 1,24 0,91
8
10
12
14
16
18
20
22
5 10 15 20 25 30 35 40 45 50 55
10 12,5 15 17,5 20 22,5 25 ponad
length, cm
wid
th, c
m
21,1765 25,863 20,3915 18,0395 10,196
14,902 22,745 21,961 18,0395 10,1965
8
10
12
14
16
18
20
22
5 10 15 20 25 30 35 40 45 50 55
c)
d)
above
above
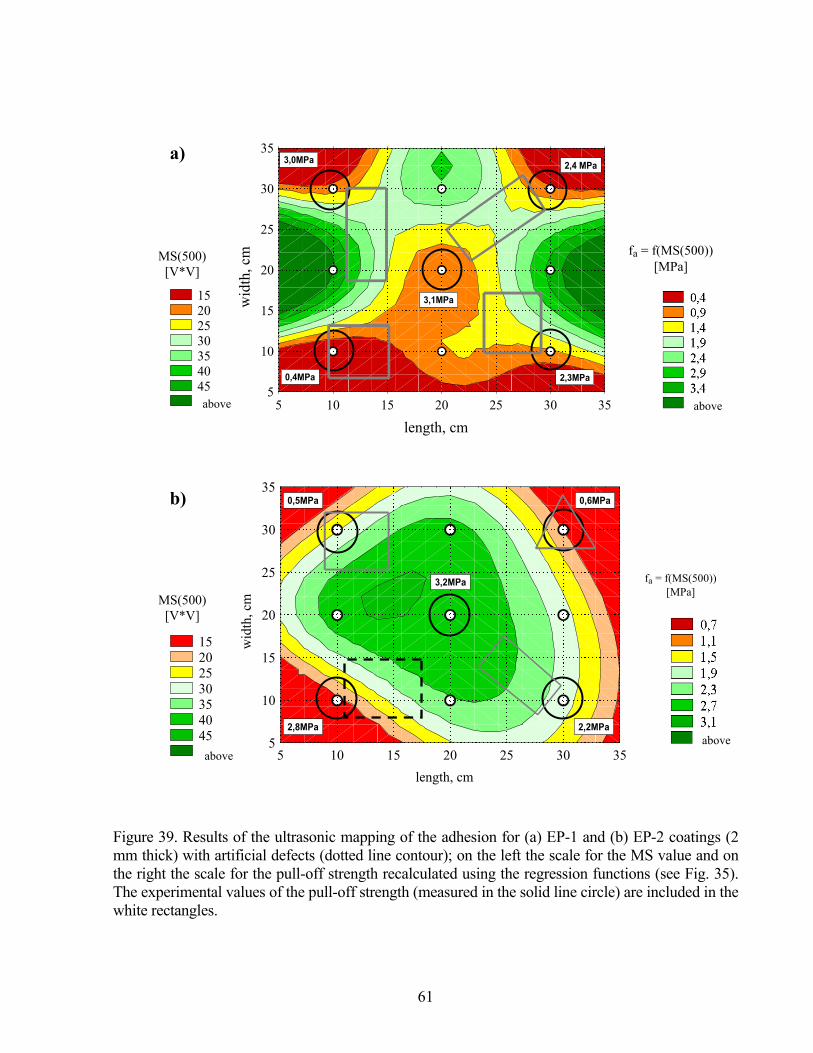
61
Figure 39. Results of the ultrasonic mapping of the adhesion for (a) EP-1 and (b) EP-2 coatings (2mm thick) with artificial defects (dotted line contour); on the left the scale for the MS value and onthe right the scale for the pull-off strength recalculated using the regression functions (see Fig. 35).The experimental values of the pull-off strength (measured in the solid line circle) are included in thewhite rectangles.
15 20 25 30 35 40 45 ponad
length, cm
wid
th, c
m
5
10
15
20
25
30
35
5 10 15 20 25 30 35
0,4MPa
2,4 MPa
3,1MPa
3,0MPa
2,3MPa
MS(500)[V*V]
fa = f(MS(500))[MPa]
aboveabove
a)
15 20 25 30 35 40 45 ponad
length, cm
wid
th, c
m
5
10
15
20
25
30
35
5 10 15 20 25 30 35
0,5MPa 0,6MPa
3,2MPa
2,8MPa 2,2MPa
MS(500)[V*V]
fa = f(MS(500))[MPa]
aboveabove
b)

62
6.4. Conclusions concerning ultrasonic evaluation of the multi-layer PC-CC systemOn the basis of the results obtained and described in this report, the following conclusions
about ultrasonic evaluation of the multi-layer PC-CC system, which is created as a result of repair oranticorrosion protection application, are as follows.
1. The ultrasonic echo (U-E) method can be used for nondestructive estimation of the polymercoating thickness. The possibility of defect detection in the PC-CC system with this methodneeds further investigation and the evaluation of adhesion with this method seems to be lesspromising.
2. The regression functions obtained for various coating systems justify potential application of theindirect pulse velocity method for nondestructive evaluation of the adhesion between thepolymer coating and the concrete substrate, as well as for mapping of the adhesion distribution.
3. A reference adhesion curve should be developed for a given type of polymer coating (includingits composition and thickness), for a wide range of adhesion, from the "zero adhesion" state tothe maximum adhesion state. On this basis, the following steps for the nondestructiveassessment of adhesion between polymer coating and concrete substrate (Fig. 40) can beformulated:(a) selection of measurement points,(b) determination of the MS(500 µs)REF value distribution with indirect pulse velocity
methods; measurement of MS(500 µs)EXP value around the selected points (at least fourmeasurements at each point),
(c) evaluation of the coating thickness with ultrasonic-echo method,(d) recalculation of MS(500 µs)EXP into MS(500 µs)REF for measured coating thickness (eg.
on the basis of a suitable regression function or graph MS(500 µs) value vs. coatingthickness),
(e) estimation of adhesion strength from the reference curve: pull-off strength vs. MS(500 µs)REF.
Figure 40. General scheme of ultrasonic evaluation of the adhesion between polymer coating andconcrete substrate (description above in text).
4. The relationship between the pull-off strength and the parameters of ultrasonic wave propagation are valid for only limited range of pull-off strength. If the adhesion of the polymer coating to the concrete substrate increases the MS (500 µs) value approaches to the maximum for the pull-off strength value close to the tensile strength of the concrete substrate.
MS(500),V*V
pull-
off s
tren
gth,
MPa
MS (500 µs)EXP
MS (500 µs)REF

63
5. The results obtained indicate also the need for further investigation to improve theaccuracy of the ultrasonic estimation of the adhesion in the PC-CC system using anadvanced method of signal analysis (e.g. spectral analysis) or data analysis (e.g. multipleregression).

64
7. SUMMARY AND CONCLUSIONS
The main goal of the project entitled "Ultrasonic evaluation methods applicable to polymerconcrete composites" was the evaluation of the potential of ultrasonic methods for assessment ofpolymer concrete composite properties. The project was carried out the framework of theM.Skłodowska-Curie US-Polish Joint Fund II. The research task was analyzed taking intoaccount the two main fields of polymer composite application: anticorrosion protection ofconcrete structures, including industrial floors, and pre-cast elements made from PC. For all theseapplications, one of the most important issues is quality control (verification tests) and diagnosistests during structural service. For these purposes, the application of two ultrasonic methods, apulse velocity method and an echo method, were considered. In the case of pre-cast elements, thiswork focused on the elaboration of principles of how to evaluate polymer concrete propertieswith the pulse velocity method. The main goal of the ultrasonic evaluation of a multi-layer PC-CC system created during repair and/or anticorrosion protection was quality control of the repairefficiency, particularly an estimation of layer thickness, detection of defects in the interfaceregion, and mapping of the adhesion between polymer composites and concrete substrate. In thisfield, the usefulness of the echo method and the indirect pulse velocity method were considered.
The results obtained, in the form of regression functions, confirmed the usefulness of theultrasonic methods for nondestructive evaluation of polymer composites in various applications.The pulse velocity method can be used for evaluation of the properties and homogeneity of theprecast elements made from polymer concrete as well as for evaluation of adhesion in the multi-layer PC-CC systems (the adhesion mapping). The ultrasonic echo method is useful fornondestructive estimation of PC layer thickness.
The project results were presented in scientific journals and at international conferences.Nondestructive evaluation of multi-layer repair systems, including especially adhesion mapping, hasappeared as the most interesting possibility. A more detailed report reviewing nondestructivemethods applicable to the evaluation of adhesion will be published as a subchapter of the final reportof RILEM Technical Committee TC-151 "Adhesion Technology in Concrete Engineering –Physical and Chemical Aspects." The results will be also used during preparation of a book chapteron the nondestructive evaluation of industrial floors. This chapter will be published in the report ofthe new RILEM Technical Committee, RILEM TC-184 IFE "Industrial floors for withstandingharsh environmental attacks, including repair and maintenance."

65
8. REFERENCES
1. L.Czarnecki “The status of polymer concrete” Concrete International Design and Construction7, 47, 1985.
2. D.W.Fowler “Current status of polymer concretes in United States” Proc. of Inter.CongressICPIC’98, Bologna (Italy), 37, 1998.
3. J.T.Dikeou “Structural design of polymer concrete products”, ibid., 277.4. L.Czarnecki, A.Garbacz: "Betony winyloestrowe jako materiał wanien elektrolitycznych", II
Ogólnopolskie Sympozium - Kompoyty i Kompozycje Polimerowe, Szczecin (1994), 317-320.5. L.Czarnecki, A.Garbacz, P.Łukowski, J.R.Clifton, “Polymer Composites for Repairing of
Portland Cement Concrete: Compatibility Project”, United States Department of Commerce,Report no. NISTIR 6361, Gaithersburg, MD, 1999.
6. J.Clifton, L.Czarnecki, P.Łukowski “Application of material model in optimization ofpolymer concretes”, Proc. of Inter. ICPIC Congress, Oostende (Belgium), 293, 1995.
7. L.Runkiewicz, “Analysis of damages and catastrophes of building structures as a result ofcorrosion” Proc.of X Conf. Kontra'96 -Durability of Buildings and protection against corrosion,Zakopane (Poland), 237, 1996.
8. R.G.Mathey, J.R.Clifton “Review of nondestructive evaluation methods applicable toconstruction materials and structures”, NBS Technical Note 1247, 109, 1988.
9. L.Brunarski, L.Runkiewicz "Podstawy i przykłady stosowania metod nieniszczących wbadaniach konstrukcji z betonu,” Wyd. ITB (1983).
10. Carino N.J., Nondestructive Test Methods, Concrete Construction Engineering Handbook,ed.E.G.Nawy, CRC Press, 19.1-19.67.
11. J.Deputat “Nondestructive evaluation methods of material properties”, Gamma (in Polish),Warszawa 1997.
12. Wu, T.-T., ”A comprehensive review on wave-based NDT techniques for evaluation of concretestructures”, Proceedings of 14th World Conference on Non Destructive Testing’, New Delhi(1996) 217-222.
13. “Draft recommendation for in situ concrete strength determination by combined non-destructivemethods”, Mater. and Struct. 26, 43, 1993.
14. K.Komlos, S.Popovics, T.Nürnbergerova, B.Babal, J.S.Popovitcs “Ultrasonic pulse velocitytest of concrete properties as specified in various standards”, Cement and Concrete Composites,357, 1996.
15. B.Christaras, F.Auger, E.Mosse “Determination of the moduli of elasticity of rocks.Comparison of the ultrasonic velocity and mechanical resonance frequency methods with directstatic methods”, Mater. and Struct. 27, 222, 1994.
16. T.Chrzan “Ultrasonic evaluation of properties of rocks and building materials”, OPWr. (inPolish), Monografie 35, Wrocław 1994.
17. B.Marusa “Possibility of application of ultrasonic pulse method in polymer concreteinvestigation.” Proc. of Conf. Polymer concretes in building (in Polish), 107, Katowice 1980.
18. S.K.Mantrala, C.Vipulanandan “Nondestructive evaluation of polyster polymer concrete”, ACIMaterials Journal” 92, 660, 1995.
19. Czarnecki L., Emmons P.H., Vaysburd A., ”Materiały do napraw w ujęciu holistycznym,”Materiały Budowlane, 5 (2000), 2-7.
20. Czarnecki L., Vaysburd A.M., Mailvaganam N.P., Emmons P.H., McDonald J.E. ”Repair andrehabilitation of structures – Some random thoughts, Indian Concrete Journal, 74 (2000) 13-20.
21. Sasse R.H., Czarnecki L., ”Naprawy i ochrona konstrukcji betonowych w świetle normy,” EN1504-10. Materiały Budowlane 7, 1999, 30-33.
66
22. L.Czarnecki, ”Naprawa konstrukcji żelbetowych w świetle wymagań europejskich,” Mat. VIKonferencji Naukowo-Technicznej Problemy Rzeczoznawstwa Budowlanego - WarsztatyPracy- Cedzyna 2000, 21-34.
23. Guide for evaluation of concrete structures prior to rehabilitation, ACI 364.1R-94, 200124. PN-88/B-01807 ”Antykorozyjne zabezpieczenia w budownictwie. Konstrukcje betonowe i
żelbetowe. Zasady diagnostyki konstrukcji”.25. Instrukcji ITB nr 361/99 "Zasady oceny bezpieczeństwa konstrukcji żelbetowych", Wyd. ITB,
Warszawa, 1999.26. Nondestructive test methos for evaluation of concrete in structures, ACI 228.2R-98, 2001.27. J.Obraz "Ultrasonics in measurement techniques" (in Polish) , WNT, Warszawa, 1983.28. PN-74/B-06261 Nieniszczące badania konstrukcji z betonu. Metoda ultradźwiękowa badania
wytrzymałości betonu na ściskanie.29. Instrukcja ITB nr 290 Instrukcja stosowania metody ultradźwiękowej do nieniszczącej
kontroli jakości betonu w konstrukcji, ITB, Warszawa (1977).30. British Standards BS1881: Part 203: 1986: "Testing Concrete Recommendations for
measurement of velocity of ultrasonic pulses in concrete".31. Russian Standard GOST 17624-87 "Concrete - Ultrasonic method for strength determination,”
cit. after [14].32. J.Kaszyński "An investigation into the depth in a cracks in a reinforced concrete structures
using an ultrasonic method", Proceedings of 15th World Conference on Non DestructiveTesting, Roma (2000), pap.357.
33. S.F. Selleck, E.N. Landis, M.L.Peterson, S.P.Shah, J.D.Achenbach "Ultrasonic investigationof concrete with distributed damage,” ACI Materials J. (1998) 27-36.
34. V.Garnier, G.Cornelup, E.Toppani, M.Leyginie "Non-destructive evaluation of concretedamage by ultrasounds", Proceedings of 15th World Conference on Non Destructive Testing,Roma (2000), pap.402.
35. J.S.Popovics, J.D.Achenbach, W-J. Song "Application of new ultrasound and sound generationmethods for testing concrete structures", Mag. of Concrete Research, 51 (1999), 35-44.
36. T.Gudra, B.Stawiski "Non-destructive strength characterization of concrete surface waves",NDT&E International, 33 (2000), 1-6.
37. Ma Z., Baishya M.C., Cook R.L., “Polymer-Injection/Ultrasonic Pulse-Echo System for BridgeDeck Repair,” Concrete International, March (1996) 39-41.
38. Weizheng L., Yiyong Y., ”Ultrasonic detection of cement concrete pavement thickness”,Proc.14th World Conference on Non Destructive Testing – WCNDT, New Delhi (1996), 839-842.
39. S.Popovics, N.M.Bilgutay, M.Karaoguz, T.Akgul "High-Frequency ultrasound technique fortesting concrete,” ACI Materials Journal, 97 (2000), 58-64.
40. M.L.Leming, J.M.Nau, J.Fokuda "Nondestructive determination of the dynamic modulus ofconcrete disks,” ACI Materials Journal, 95 (1998), 50-57.
41. L.Czarnecki, B.Chmielewska, “The influence of coupling agent on the properties of vinylestermortar.” Proc. of II International RILEM Symposium on Adhesion between Polymers andConcrete ISAP ’99, Dresden (Niemcy), 1999, 57-66.
42. N.Ahn, D.W.Fowler “The effect of metallic monomers on the bond strength of polymerconcrete to wet substrates.” Proc. of Inter.Congress ICPIC’98, Bologna (Italy), 199, 1998.
43. N.J.Delatte, D.W.Fowler, B.F.McCullough, S.F.Grater "Investigating performance of bondedconcrete overlays", J. of Performance of Constructed Facilities, (5) (1998) 62-70.
44. C.Jaquerod, Ch.Chippis, F.Alou, Y.F.Houst ”Nondestructive testing of repair mortars forconcrete,” Proc. of the 3rd Int. Colloquium Materials Science and Restoration, Esslingen(Germany), 872, 1992.

67
45. K.S.Tan, K.C.Chan, B.S.Wong, L.W.Guan, "Ultrasonic evaluation of cement adhesion in walltiles", Cement and Concrete Composites 18 (1996) 119-124.
46. C.Jaquerod, F.Alou, Y.F.Houst "Nondestructive testing of repair mortars for concrete,"Proceedings of an International Colloquium 'Material Science and Restoration', Esslingen(1992), 872-888.
47. Czarnecki, L., Głodkowska, W., Wiąckowska, A., ”Model of compatibility of polymercomposite-cement concrete (PC-CC) system,” in Durability of polymer based compositesystems for structural application, Proceedings of an International Colloquium, Brussels(1991),484-493.
48. Czarnecki L., Garbacz A., Łukowski P., Clifton J.R, “Polymer Composites for Repairing ofPortland Cement Concrete: Compatibility Project. NIST Report (NISTIR 6394),” United StatesDepartment of Commerce, National Institute of Standards and Technology, Gaithersburg MD(USA), 1999.
49. O'Connor, D.N., Saiidi, M., ”Compatibility of polyester-styrene polymer concrete overlays withPortland cement concrete bridge decks”, ACI Materials J., 90 (1993) 59-68.
50. P.Łukowski:, ”Model of composition-properties relationship” , Ph.D. Thesis, Warsaw 1995.51. L.Czarnecki, A.Garbacz, M.Łuciuk, ”Nondestructive evaluation of mechanical properties of
polymer concretes using ultrasonic pulse method”, Proc. of the 4th Intern. ColloquiumMaterials Science and Restoration, Esslingen (Germany), 523, 1996.
52. Czarnecki, A.Garbacz, M.Łuciuk, “Evaluation of selected properties of polymer concrete usingultrasonic method.” Building & Engineering 10 (in Polish), 514, 1997.
53. A.Garbacz, M.Łuciuk, L.Czarnecki "Usability of ultrasonic method to assess technicalproperties of polymer concretes" (in Polish), 26th Conference on NDT, Szczyrk (1997),193-198.
54. L. Czarnecki, P. Łukowski, Modelling of the polymer concrete properties, Studies ofUniversity of Transport and Communications in Žilina, Civil Engineering, vol. 21, 1998,21-29.
55. Brandt, A.M., Cement-based composites: materials, mechanical properties and performance, E& FN Spon, London, 1995.
56. Underwood, E.E., ”Estimating fracture characteristics by quantitative fractography,” J.Metals,(1986) 106-178.
57. L.Czarnecki, A.Garbacz, J,Kurach "On the characterization of polymer concrete fracturesurface", Cement & Concrete Composites, 23 (2001) 399-409.
58. B.Chmielewska, Modification of polymer mortars with silane agents, Ph.D.Thesis, WarsawUniversity of Technology, Warsaw 2000.
59. Baddeley, A.J., Gundersen, H.J.G., Cruz-Orive, L.M., ”Estimation of surface area from verticalsections,” J.of Microscopy, 3 (1986) 259-276.
60. Wojnar, L., Fraktografia ilościowa. Podstawy i komputerowe wspomaganie badań; Zeszytynaukowe Politechniki Krakowskiej. Seria Mechanika, 2, Kraków, 1990.
61. L.Brunarski "Diagnostyczne metody badań budowli,” XXXVIII Scientific Conference, Krynica(1992), 11-20.
62. M.Sansalone, M., N.J.Carino, ”Detecting delamination in concrete slabs with and withoutoverlays using the impact-echo method”, ACI Materials Journal 86, 1989.
63. Nazarian, S., Baker, M., Crain, K., ”Assessing quality of concrete with wave propagationtechnigues”, ACI Materials J. (1997) 296-305.

68
List of publications involved with the activity on the project
1. Czarnecki L., Garbacz A., Łuciuk M.: Ocena wybranych właściwości betonów żywicznychmetodą ultradźwiękową (Evaluation of selected technical properties with ultrasonic methods),Building Industry & Engineering (in Polish), 10 (1997), pp.514-516.
2. Garbacz A., Łuciuk M., Czarnecki L.: Przydatność metody ultradźwiękowej do oceny cechtechnicznych betonów żywicznych (Usability of ultrasonic pulce velocity for assessment ofpolymer concrete properties), Proc.26th Polish Conference on NDT Techniques, Szczyrk(1997), pp.193-198.
3. Garbacz A., Czarnecki L., Clifton J.R.: “Ultrasonic Methods To Assess PolymerConcrete Properties”, Proc. of the IX Inter.Congress “Polymers in Concrete” ICPIC’98,Bologna (Italy), 1998, pp. 761-769.
4. Garbacz A., Czarnecki L., Clifton J.R., ”Non-destructive methods to assess adhesionbetween polymer composite and portland cement concrete,” Proc. 2nd Int. RILEM Symposium“Adhesion between polymers and concrete”- ISAP’99, Dresden (1999), pp. 467- 474.
5. Czarnecki L., Garbacz A., Clifton J., “Evaluation of polymer concrete properties withultrasounds,” Concrete & Reinforced Concrete (in Russian), 4 (1999), pp. 29-30.
6. Garbacz A. “Nondestructive assessment of adhesion between polymer composite andconcrete substrate,” chapter 8.4 in State of the Art. Report of RILEM TC-151 APC, 1999.
7. Garbacz A., Czarnecki L., Garboczi E., “Ultradźwiękowa ocena przyczepności międzykompozytem polimerowym a podkładem betonowym, (Ultrasonic evaluation of adhesion betweenpolymer composites and concrete substrate),” Proc. Polish Conf. "Materials in Building Industry"Matbud '2000, Kraków (2000), pp. 99-106.
8. Garbacz A., Czarnecki L., Garboczi E.: "Ultrasonic Assessment of Adhesion betweenPolymer Composites and Concrete Substrate", in the Proc. of the 10th International CongressPolymers in Concrete - ICPIC 2001, USA.


