PNNL-17488 Rev. 0 Ultrasonic Examination of Double-Shell Tank 241-AP-107 Examination Completed February 2008 AF Pardini DR Weier KK Anderson April 2008 Prepared for the U.S. Department of Energy under Contract DE-AC05-76RL01830
Transcript
PNNL-17488 Rev. 0
Ultrasonic Examination of Double-Shell Tank 241-AP-107 Examination Completed February 2008 AF Pardini DR Weier KK Anderson April 2008 Prepared for the U.S. Department of Energy under Contract DE-AC05-76RL01830
DISCLAIMER This report was prepared as an account of work sponsored by an agency of the
United States Government. Neither the United States Government nor any agency thereof, nor Battelle Memorial Institute, nor any of their employees, makes any
warranty, express or implied, or assumes any legal liability or responsibility for the accuracy, completeness, or usefulness of any information, apparatus, product, or process disclosed, or represents that its use would not infringe privately owned rights. Reference herein to any specific commercial product,
process, or service by trade name, trademark, manufacturer, or otherwise does not necessarily constitute or imply its endorsement, recommendation, or favoring by
the United States Government or any agency thereof, or Battelle Memorial Institute. The views and opinions of authors expressed herein do not necessarily
state or reflect those of the United States Government or any agency thereof. PACIFIC NORTHWEST NATIONAL LABORATORY
operated by BATTELLE
for the UNITED STATES DEPARTMENT OF ENERGY
under Contract DE-AC05-76RL01830 Printed in the United States of America
Available to DOE and DOE contractors from the Office of Scientific and Technical Information,
email: [email protected] Available to the public from the National Technical Information Service,
U.S. Department of Commerce, 5285 Port Royal Rd., Springfield, VA 22161 ph: (800) 553-6847 fax: (703) 605-6900
email: [email protected] online ordering: http://www.ntis.gov/ordering.htm This document was printed on recycled paper.
(9/2003)
PNNL-17488 Rev. 0
Ultrasonic Examination of Double-Shell Tank 241-AP-107 Examination Completed February 2008 AF Pardini DR Weier KK Anderson April 2008 Prepared for the U.S. Department of Energy under Contract DE-AC05-76RL01830 Pacific Northwest National Laboratory Richland, Washington 99352
Summary AREVA Federal Services LLC (AFS), under a contract from CH2M HILL Hanford Group (CH2M HILL), has performed an ultrasonic examination of selected portions of Double-Shell Tank 241-AP-107. The purpose of this examination was to provide information that could be used to evaluate the integrity of the wall of the primary tank. The requirements for the ultrasonic examination of Tank 241-AP-107 were to detect, characterize (identify, size, and locate), and record measurements made of any wall thinning, pitting, or cracks that might be present in the wall of the primary tank. Any measurements that exceed the requirements set forth in the Engineering Task Plan (ETP), RPP-Plan-34301 (Castleberry 2007) and summarized on page 1 of this document, are to be reported to CH2M HILL and the Pacific Northwest National Laboratory (PNNL) for further evaluation. Under the contract with CH2M HILL, all data is to be recorded on electronic media and paper copies of all measurements are provided to PNNL for third-party evaluation. PNNL is responsible for preparing a report(s) that describes the results of the AFS ultrasonic examinations. Examination Results The results of the examination of Tank 241-AP-107 have been evaluated by PNNL personnel. The ultrasonic examination consisted of two vertical 15-in.-wide scan paths over the entire height of the tank from Riser 30. The examination also included two vertical 15-in.-wide scan paths over the entire height of the tank and the heat-affected zone (HAZ) of four vertical welds and one horizontal weld from Riser 31. The examination was performed to detect any wall thinning, pitting, or cracking in the primary tank wall. Primary Tank Wall Vertical Scan Paths Two 15-in.-wide vertical scan paths were performed on Plates #1, #2, #3, #4, and #5 from Riser 30. The plates were examined for wall thinning, pitting, and cracks oriented vertically on the primary tank wall. There were no areas of wall thinning that exceeded the reportable level of 10% of the nominal thickness. No pitting or vertical crack-like indications were detected in Plates #1, #2, #3, #4, or #5. Two 15-in.-wide vertical scan paths were performed on Plates #1, #2, #3, #4, and #5 from Riser 31. The plates were examined for wall thinning, pitting, and cracks oriented vertically on the primary tank wall. There were no areas of wall thinning that exceeded the reportable level of 10% of the nominal thickness. No pitting or vertical crack-like indications were detected in Plates #1, #2, #3, #4, or #5. Primary Tank Wall Weld Scan Paths The HAZ of vertical welds in Plates #2, #3, #4, and #5 from Riser 31 were examined for wall thinning, pitting, and cracks oriented either perpendicular or parallel to the weld. There were no areas of wall thinning that exceeded the reportable level of 10% of the nominal thickness. No pitting or crack-like indications were detected in the weld HAZ areas in Plates #2, #3, #4, and #5.
ii
The HAZ of the horizontal weld between Plate #5 and the tank knuckle from Riser 31 was examined for wall thinning, pitting and cracks oriented either perpendicular or parallel to the weld. There were no areas of wall thinning that exceeded the reportable level of 10% of the nominal thickness. No pitting or crack-like indications were detected in the weld HAZ areas on Plate #5 side or on the knuckle side of the horizontal weld. Ultrasonic Data Statistical Analysis Extreme Value: Extreme value measured wall thickness losses were estimated. Since current remaining wall thickness typically still often exceeds drawing nominal, thereby generating negative losses, UT image maximum values were instead used to determine estimated nominal wall thickness per plate/riser combination. These thicknesses tended to run from drawing nominal up to about to 0.020-in. greater. They in turn were used with each UT image minimum value to determine estimated wall thickness losses, which were then combined for a plate course over two risers, two paths per riser. Three-parameter Weibull distributions were fit to individual plate courses and to suitable combinations of plate courses. Since minimal loss differences are indicated between plate courses for Tank 241-AP-107, the preferred case is for measurements combined over all plate courses. This generates an estimated worst case measured wall thickness loss of 0.057-in. that might be expected if the entire surface area of the tank wall were UT inspected. Actual wall thickness loss would be expected to be less. A 95% confidence bound is computed based on the uncertainty in the Weibull parameters due to the quality of the Weibull fit and the number of measurements available; this 95% bound on measured wall thickness loss is 0.061-in. Note that such losses should be considered relative to the larger “estimated” nominal wall thicknesses and not the drawing nominal. Riser Differences: Two inspections paths were competed down each of Risers 30 and 31. The use of two risers was based on initial studies of the first multi-riser-inspected Tank 241-AY-101 (in 2005). In that case, statistically significant riser differences were indicated, so it was determined that either multiple risers should be used in subsequent UT tank inspections, or if only a single riser were used, an extra uncertainty factor should be incorporated to account for such riser variability. However, the resulting 2007 two-riser UT inspections of several tanks tended to indicate that riser differences are indeed not significant. It was then suggested that three or four paths down a single riser might be adequate with inspection from multiple risers not required. For 2008, the two-riser inspections are continuing however. For the current Tank 241-AP-107 UT inspection, this lack of riser differences is again indicated. However, even though the risers did not differ in their average overall wall thicknesses, measured Riser 30 wall thicknesses did tend to exceed those of Riser 31 at the lower tank elevations while the opposite result held at the higher elevations. Old versus New Inspection Comparison: Approximately the same Tank 241-AP-107 wall areas were inspected both in the previous 2000 inspection and in the current 2008 inspection. This was the case for two inspections paths in Riser 31, so about 70 pairs of old and new UT image results could be compared. A fairly persistent difference was shown of about 0.025-in. between 2000 and 2008 with the 2008 wall
iii
thicknesses being thinner. The tracking of the UT results with each other along the inspection paths is quite remarkable, especially for the UT average values. Such consistent differences between the 2000 and 2008 results indicate one of two things, or perhaps a combination of both: 1) A very uniform corrosion rate over all tank wall surfaces that were inspected. 2) A systematic difference in the way measurements were generated in 2000 and in 2008. Intuitively it would seem that such consistent differences make the second reason seem the more reasonable. Special studies of UT wall thickness measurement capability have been proposed that seek to identify the sources of such systematic measurement error so that it can be better controlled. This will better support comparisons of current measurements with those taken in the future so that these UT inspections can be used to make meaningful studies of wall thickness corrosion rates.
Figures 3.1 Transducer Configuration for Examining the Primary Tank Wall........................................... 4 3.2 Transducer Configurations for Examination of Weld Zone in the Primary Tank Wall ........... 5 3.3 Views of the Weld Zone to be Ultrasonically Examined in the Primary Tank Wall ............... 6 4.1 UT of Tank 241-AP-107 Riser 30 and Riser 31....................................................................... 7 4.2 Sketch of Scan Paths on Tank 241-AP-107 Primary Tank from Riser 30 ............................... 9 4.3 Sketch of Scan Paths on Tank 241-AP-107 Primary Tank from Riser 31 ............................... 10 5.1 UT Data from Tank 241-AP-107 Riser 30............................................................................... 12 5.2 UT Data from Tank 241-AP-107 Riser 30 cont. ...................................................................... 13 5.3 UT Data from Tank 241-AP-107 Riser 31............................................................................... 14 5.4 UT Data from Tank 241-AP-107 Riser 31 cont. ...................................................................... 15 6.1 Estimated Nominal Thickness from UT Maxima .................................................................... 16 6.2 Estimated Maximum Loss by Plate.......................................................................................... 17 6.3 Weibull Distribution Fits to UT Maximum Wall Thickness Loss by Plate Course ................. 18 6.4 Tank 241-AP-107 Wall Thickness Extreme Value Loss Estimates and Bounds..................... 19 6.5 Weibull Distribution Fit to Combined UT Maximum Wall Thickness Loss ........................... 20 6.6 Riser Differences in UT Measured Wall Thickness................................................................. 22 6.7 Riser 30 minus Riser 31 Differences........................................................................................ 23 6.8 Year 2000 minus Year 2008 Differences ................................................................................. 25 6.9 Year 2000 versus Year 2008 Measurement Paths.................................................................... 26
1.0 Introduction AREVA Federal Services LLC (AFS), under a contract from CH2M HILL Hanford Group (CH2M HILL), has performed an ultrasonic examination (UT) of selected portions of Double-Shell Tank (DST) 241-AP-107. The purpose of this examination was to provide information that could be used to evaluate the integrity of the DST. The requirements for the UT of Tank 241-AP-107 were to detect, characterize (identify, size, and locate), and record measurements made of any wall thinning, pitting, or cracks that might be present in the wall of the primary tank. Any measurements that exceed the requirements set forth in the Engineering Task Plan (ETP), RPP-Plan-34301 (Castleberry 2007), are to be reported to CH2M HILL and the Pacific Northwest National Laboratory (PNNL) for further evaluation. Specific measurements that are reported include the following: • Wall thinning that exceeds 10% of the nominal thickness of the plate. • Pits with depths that exceed 25% of the nominal plate thickness. • Stress-corrosion cracks that exceed 0.10 in. (through-wall) and are detected in the inner wall of the
tank, HAZ of welds, or in the tank knuckle. The accuracy requirements for ultrasonic measurements for the different types of defects are as follows: • Wall thinning – measure thickness within ±0.020 in. • Pits – size depths within ±0.050 in. • Cracks – size the depth of cracks on the inner wall surfaces within ±0.1 in. • Location – locate all reportable indications within ±1.0 in.
Under the contract with CH2M HILL, all data is to be recorded on electronic media and paper copies of all measurements are provided to PNNL for third-party evaluation. PNNL is responsible for preparing a report(s) that describes the results of the AFS UT.
1
2.0 Qualified Personnel, Procedures, and Equipment Under contract from CH2M HILL, qualification of personnel participating in the DST inspection program, the UT equipment (instrument and mechanical scanning fixture), and the UT procedure that will be used in the examination of the current DST is required. Personnel participating in the examinations are to be certified in accordance with American Society for Nondestructive Testing (ASNT) Recommended Practice SNT-TC-1A, 1992 Edition, and associated documentation is to be provided. The capability of the UT system is to be validated through a performance demonstration test (PDT) on a mock-up simulating the actual DST. The current procedure for the UT is to be based on requirements listed in the American Society for Mechanical Engineers (ASME), Boiler and Pressure Vessel Code Section V, Article 4, Ultrasonic Examination Methods for Inservice Inspection. 2.1 Personnel Qualifications The following individuals were qualified and certified to perform UT of the Hanford DST 241-AP-107: • Mr. Wesley Nelson, ASNT Level III (#LM-1874) in UT, has been identified as AFS’s UT Level III
authority for this project. Mr. Nelson has been certified by AFS as a UT Level III in accordance with AFS procedure COGEMA-SVCP-PRC-014, latest revision which conforms to the requirements of ASNT SNT-TC-1A, 1992. Further documentation has been provided to establish his qualifications (Pardini 2000).
• Mr. James B. Elder, ASNT Level III (#JM-1891) in UT, has been contracted by AFS to provide peer
review of all DST UT data. Mr. Elder has been certified by JBNDT as a UT Level III in accordance with JBNDT written practice JBNDT-WP-1, latest revision. Further documentation has been provided to establish his qualifications (Posakony and Pardini 1998).
• Mr. William D. Purdy, AFS UT Level II limited (for P-Scan data acquisition only). Mr. Purdy has
been certified in accordance with AFS procedure COGEMA-SVCP-PRC-014, latest revision. Further documentation has been provided to establish his qualifications (Posakony 2001).
• Mr. Jeffery S. Pintler, AFS UT Level II limited (for P-Scan data acquisition only). Mr. Pintler has
been certified in accordance with AFS procedure COGEMA-SVCP-PRC-014, latest revision. Further documentation has been provided to establish his qualifications (Pardini 2006).
The following individual participated in this examination and is a trainee and is not qualified or certified to perform independent UT of the Hanford DST 241-AP-107: • Ms. Laura A. Sepich, AFS UT trainee in accordance with AFS procedure COGEMA-SVCP-PRC-
014, latest revision.
2
2.2 Ultrasonic Examination Equipment CH2M HILL has provided the UT equipment for the examination of Tank 241-AP-107. This equipment consists of a Force Technology P-Scan ultrasonic test instrument and Force Technology AWS-5D remote-controlled, magnetic-wheel crawler for examining the primary tank wall. Ultrasonic transducers used for the examinations are commercially available. The P-Scan ultrasonic system has been qualified through a PDT administered by PNNL. (Posakony and Pardini 1998) 2.3 Ultrasonic Examination Procedure AFS has provided the UT procedure for the examination of Tank 241-AP-107. This procedure, COGEMA-SVUT-INS-007.3, Revision 3, outlines the type of UT and mechanical equipment that are to be used as well as the types of transducers. Both straight-beam and angle-beam transducers are used for the examination of the primary tank wall. The examination procedures include full documentation on methods for calibration, examination, and reporting. Hard copies of the T-Scan (thickness) and P-Scan (projection or angle beam) views of all areas scanned are made available for analysis. The UT procedure requires the use of specific UT transducers for the different examinations. A calibration performed before and after the examinations identifies the specific transducers used and the sensitivity adjustments needed to perform the inspection. The AFS UT procedure has been qualified through a PDT (Posakony and Pardini 1998).
3
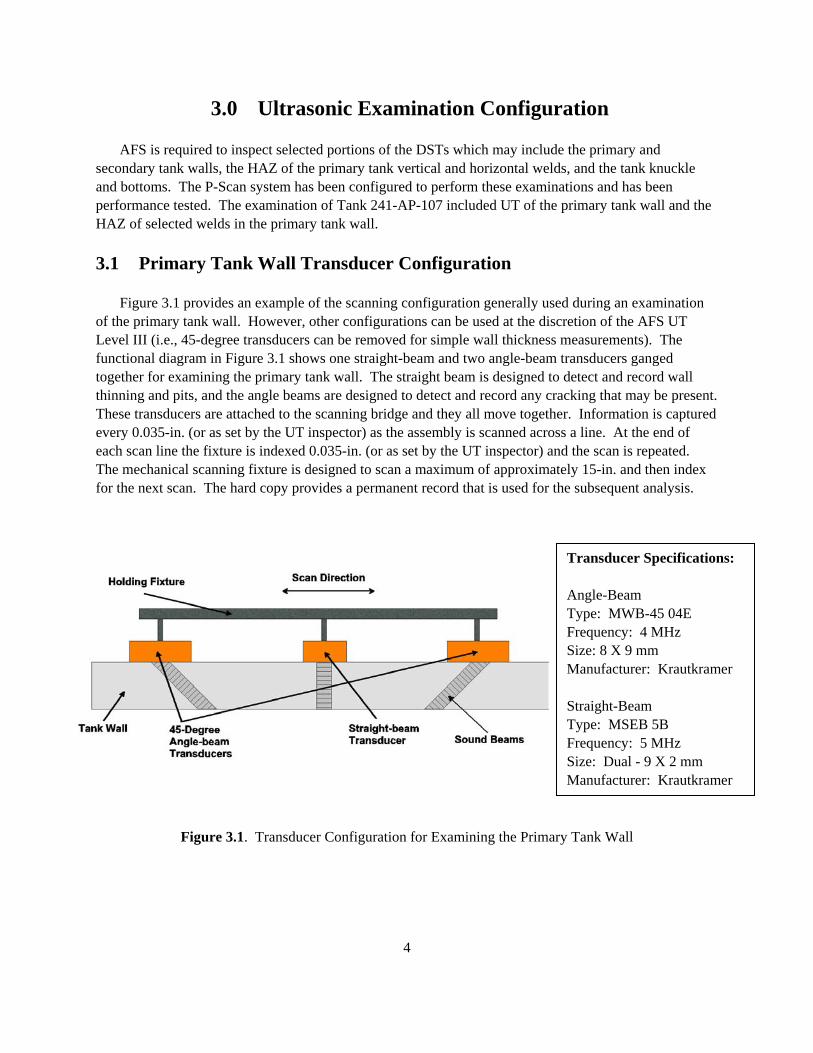
3.0 Ultrasonic Examination Configuration AFS is required to inspect selected portions of the DSTs which may include the primary and secondary tank walls, the HAZ of the primary tank vertical and horizontal welds, and the tank knuckle and bottoms. The P-Scan system has been configured to perform these examinations and has been performance tested. The examination of Tank 241-AP-107 included UT of the primary tank wall and the HAZ of selected welds in the primary tank wall. 3.1 Primary Tank Wall Transducer Configuration Figure 3.1 provides an example of the scanning configuration generally used during an examination of the primary tank wall. However, other configurations can be used at the discretion of the AFS UT Level III (i.e., 45-degree transducers can be removed for simple wall thickness measurements). The functional diagram in Figure 3.1 shows one straight-beam and two angle-beam transducers ganged together for examining the primary tank wall. The straight beam is designed to detect and record wall thinning and pits, and the angle beams are designed to detect and record any cracking that may be present. These transducers are attached to the scanning bridge and they all move together. Information is captured every 0.035-in. (or as set by the UT inspector) as the assembly is scanned across a line. At the end of each scan line the fixture is indexed 0.035-in. (or as set by the UT inspector) and the scan is repeated. The mechanical scanning fixture is designed to scan a maximum of approximately 15-in. and then index for the next scan. The hard copy provides a permanent record that is used for the subsequent analysis.
Transducer Specifications: Angle-Beam Type: MWB-45 04E Frequency: 4 MHz Size: 8 X 9 mm Manufacturer: Krautkramer Straight-Beam Type: MSEB 5B Frequency: 5 MHz Size: Dual - 9 X 2 mm Manufacturer: Krautkramer
Figure 3.1. Transducer Configuration for Examining the Primary Tank Wall
4
3.2 Weld Zone Transducer Configuration Figure 3.2 is a functional sketch that shows the configurations for examination of the weld zone. The area of interest (HAZ of the weld) is shown as lying adjacent to the weld. Both cracks and pitting may occur in this region. The “A” portion of this sketch shows the 60-degree angle-beam transducers used for detecting cracks parallel to the weld. The straight-beam transducers in this sketch are used for detecting and recording any pitting or wall thinning that may be present. All transducers are ganged together. The scanning distance traveled is limited to a total of approximately 5.0-in. The sketch titled “B” shows the arrangement for detecting cracks that may lie perpendicular to the weld. Four 45-degree, angle-beam transducers are used for this inspection. Again the transducers are ganged together but the scan is limited to a total of approximately 4.0-in. The weld zone requirements are shown in Figure 3.3. The scan protocol, data capture, and index parameters are the same for examining other weld areas in the tank.
Transducer Specifications: Angle-Beam Type: MWB-60 04E Frequency: 4 MHz Size: 8 X 9 mm Manufacturer: Krautkramer Straight-Beam Type: MSEB 5B Frequency: 5 MHz Size: Dual - 9 X 2 mm Manufacturer: Krautkramer
Transducer Specifications: Angle-Beam Type: MWB-45 04E Frequency: 4 MHz Size: 8 X 9 mm Manufacturer: Krautkramer
A. Configuration for pitting and cracks parallel to weld
B. Configuration for cracks perpendicular to weld
Figure 3.2. Transducer Configurations for Examination of Weld Zone in the Primary Tank Wall
5
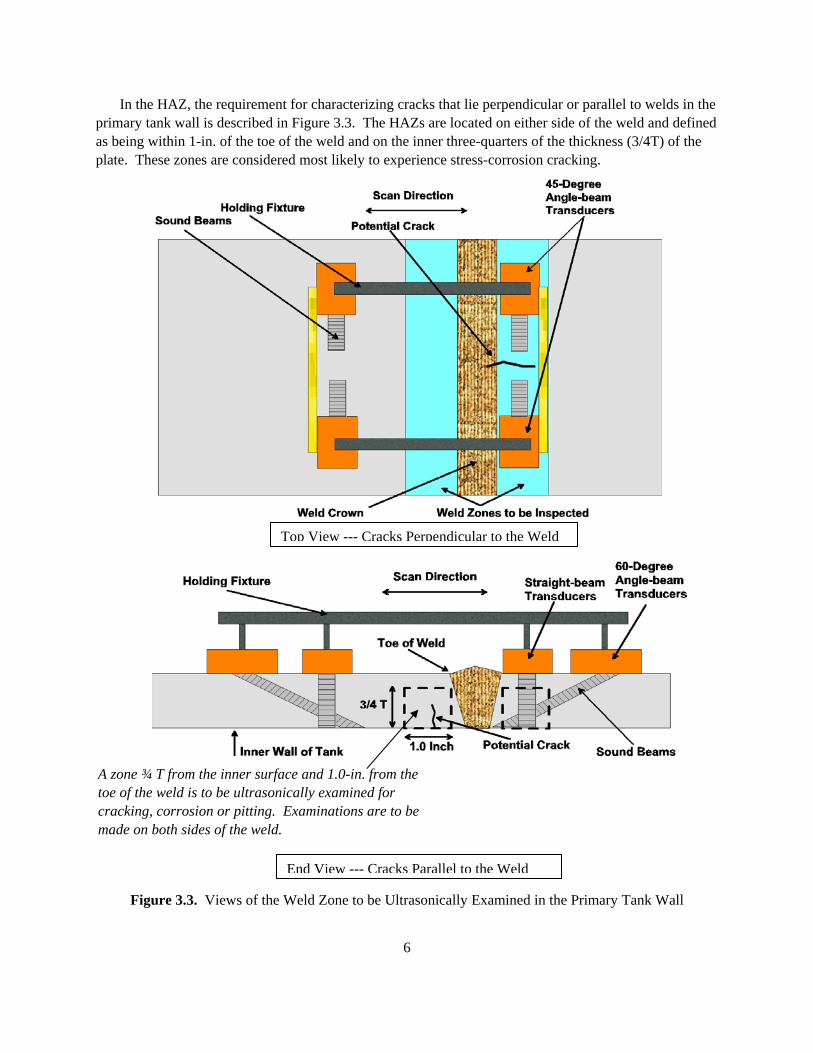
In the HAZ, the requirement for characterizing cracks that lie perpendicular or parallel to welds in the primary tank wall is described in Figure 3.3. The HAZs are located on either side of the weld and defined as being within 1-in. of the toe of the weld and on the inner three-quarters of the thickness (3/4T) of the plate. These zones are considered most likely to experience stress-corrosion cracking.
Top View --- Cracks Perpendicular to the Weld
A zone ¾ T from the inner surface and 1.0-in. from the toe of the weld is to be ultrasonically examined for cracking, corrosion or pitting. Examinations are to be made on both sides of the weld.
End View --- Cracks Parallel to the Weld
Figure 3.3. Views of the Weld Zone to be Ultrasonically Examined in the Primary Tank Wall
6
4.0 Ultrasonic Examination Location Tank 241-AP-107 is located in the Hanford 200 East area in AP Tank Farm. The crawler and associated scanner that hold the transducers were lowered into the 24-in. risers located on the east side (Riser 30) and on the west side (Riser 31) of 241-AP-107. Figure 4.1 provides a graphic of the location of the risers.
Figure 4.1. UT of Tank 241-AP-107 Riser 30 and Riser 31
7
8
Figure 4.2 describes the areas on the primary wall of Tank 241-AP-107 that were ultrasonically examined from Riser 30 located on the east side of the tank. Two 15-in.-wide vertical scan paths were performed on Plates #1, #2, #3, #4, and #5 below the entrance to Riser 30. Figure 4.3 describes the areas on the primary wall of Tank 241-AP-107 that were ultrasonically examined from Riser 31 located on the west side of the tank. Two 15-in.-wide vertical scan paths were performed on Plates #1, #2, #3, #4, and #5 below the entrance to Riser 31. Vertical weld HAZ examinations were done on Plates #2, #3, #4, and #5, and the horizontal weld HAZ examination was done on the transition Plate #5 to knuckle weld.
9
Figure 4.2. Sketch of Scan Paths on 241-AP-107 Primary Tank from Riser 30
Plate 1 0.500" thick
Plate 2 0.500" thick
Plate 3 0.563" thick
Plate 4 0.750" thick
Plate 5 0.875" thick
Lower Primary Knuckle 0.938" thick
330 in.
237 in.
145 in.
37 in.
13 in. 0 in.
422 in. Dome 0.500" thick
DST 241-AP-10724 in. diameter
Riser-030
~17 in.
15 in. Wide Vertical Scan(TYP)
~9 ft.
~2 ft.
~1 ft. – 1 in.
Annulus Air Inlet Pipe (TYP)
Vertical Wall
Scan #1
Vertical Wall
Scan #2 HorizontalWeld (TYP)
VerticalWeld (TYP)
Note - Vertical Scans: Top to Bottom
Not To Scale
NEast Riser C L
Elevation
~7 ft. – 8.5 in.
~7 ft. – 8.5 in.
~7 ft. – 8.5 in.
10
Figure 4.3. Sketch of Scan Paths on Tank 241-AP-107 Primary Tank from Riser 31
Plate 1 0.500" thick
Plate 2 0.500" thick
Plate 3 0.563" thick
Plate 4 0.750" thick
Plate 5 0.875" thick
Lower Primary Knuckle 0.938" thick
330 in.
237 in.
145 in.
37 in.
13 in. 0 in.
422 in. Dome 0.500" thick
~7 ft. – 8.5 in.
~7 ft. – 8.5 in.
~7 ft. – 8.5 in.
DST 241-AP-10724 in. diameter
Riser-031
~17 in.
15 in. Wide Vertical Scan(TYP)
~9 ft.
~2 ft.
~1 ft. – 1 in.
Not To Scale
HorizontalWeld (TYP)
Annulus Air Inlet Pipe (TYP)
Inspected Weld
Vertical Wall
Scan #2
Vertical Wall
Scan #1
VerticalWeld (TYP)
Notes - Vertical Scans: Top to Bottom - Horizontal Scans: South to North
InspectedWeld
S
InspectedWeld
Horizontal Weld Scan
InspectedWeld
West Riser C L
Elevation
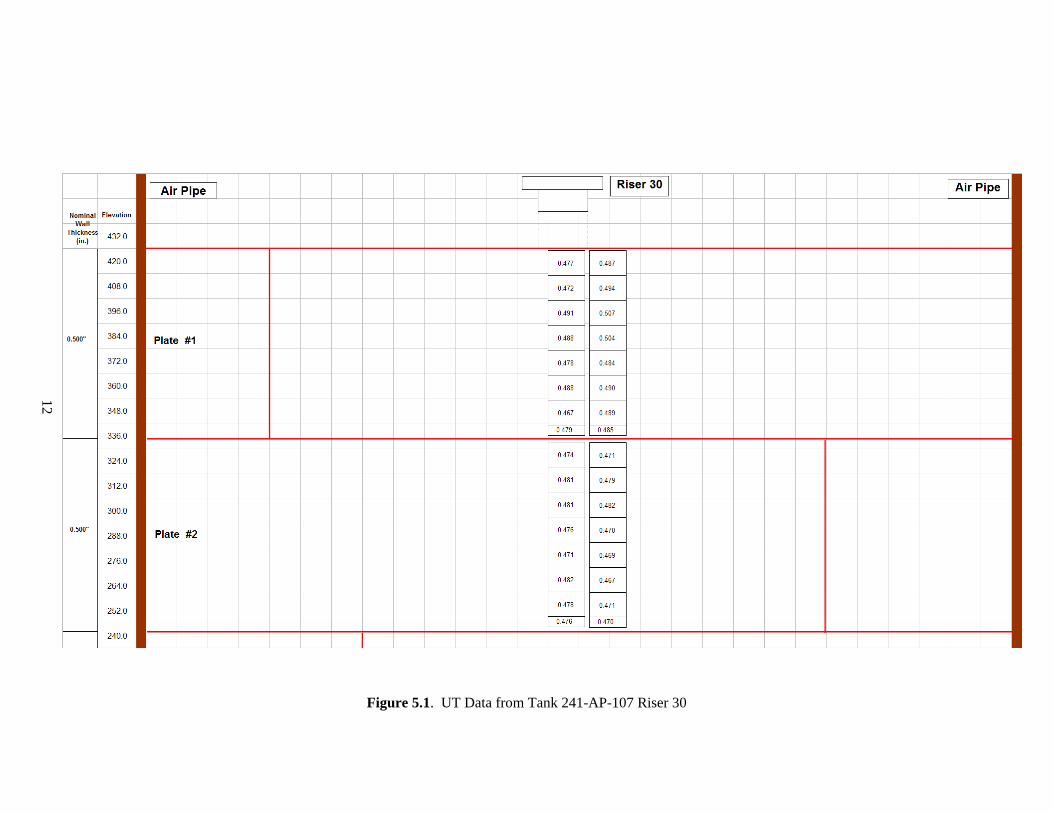
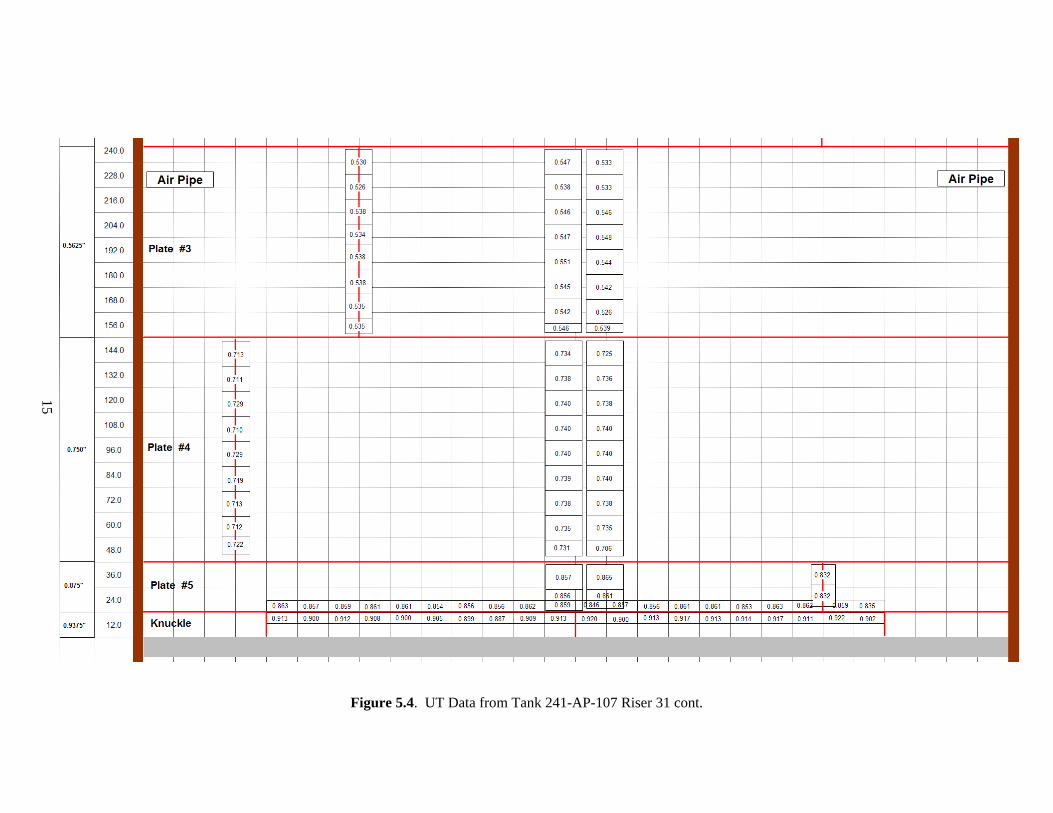
5.0 Ultrasonic Examination Results AFS has provided detailed reports including T-Scan and P-Scan hard copies of all areas that were ultrasonically examined to PNNL for third-party review. The data was analyzed by AFS Level III Mr. Wes Nelson, and peer reviewed by JBNDT Level III Mr. Jim Elder. The results of the examination of Tank 241-AP-107 are presented in Figures 5.1, 5.2, 5.3, and 5.4. Figures 5.1 and 5.2 show the wall thickness examination results for the primary tank wall taken below Riser 30. The examination consisted of two vertical paths beneath the 24-in. diameter riser. Vertical scan #1 was 15-in.-wide on Plate #1, #2, #3, #4, and #5 near the centerline of the 24-in. riser. Vertical scan #2 was adjacent to vertical scan #1 and was also 15-in.-wide on Plates #1, #2, #3, #4, and #5. Vertical scans were conducted in the downward direction. Figures 5.1 and 5.2 display the minimum readings taken in each 15-in.-wide by 12-in.-long area of the scan. Figures 5.3 and 5.4 show the wall thickness examination results for the primary tank wall and the HAZs of both vertical and horizontal welds taken below Riser 31. The examination consisted of two vertical paths beneath the 24-in. diameter riser. Vertical scan #1 was 15-in.-wide on Plate #1, #2, #3, #4, and #5 near the centerline of the 24-in. riser. Vertical scan #2 was adjacent to vertical scan #1 and was also 15-in.-wide on Plates #1, #2, #3, #4, and #5. Vertical scans were conducted in the downward direction. Figures 5.3 and 5.4 display the minimum readings taken in each 15-in.-wide by 12-in.-long area of the scan. The HAZs of vertical welds in Plates #2, #3, #4, and #5 were examined and the HAZ in the horizontal weld between Plate #5 and the knuckle section was also examined. Weld area exams include approximately 5-in. on each side of the weld and figures 5.3 and 5.4 display the minimum readings taken in each 5-in.-wide by 12-in.-long area of the scan. Areas in the figures that show two measurements in the same box are the result of the vertical scan paths overlapping the horizontal scan paths. In the overlapping areas, both minimum readings from each vertical and horizontal scan paths are given.
11
12
Figure 5.1. UT Data from Tank 241-AP-107 Riser 30
13
Figure 5.2. UT Data from Tank 241-AP-107 Riser 30 cont.
14
Figure 5.3. UT Data from Tank 241-AP-107 Riser 31
Figure 5.4. UT Data from Tank 241-AP-107 Riser 31 cont.
15
6.0 Ultrasonic Data Statistical Analysis 6.1 Extreme Value
The objective of this section is to estimate a worst case wall condition with respect to thinning (see Weier, Anderson, 2005, for a description of the methodology). If remaining wall thickness were used to estimate such a worst case condition, wall thickness measurements from plates with differing nominal thicknesses could not be combined to fit a common distribution. Extreme value distribution fitting will benefit from having more measurements to fit, so if results can be reasonably combined across plates, this approach is preferred. For this reason, extreme value plate loss is computed instead of using remaining wall thickness. However if the original nominal values for tank wall thicknesses (0. 5-in., 0.5625-in., 0.750-in., and 0.875-in. respectively for Tank 241-AP-107) are used, negative losses are often obtained since remaining wall thickness still exceeds drawing nominal. For this reason UT image maximum values were used to provide a better estimate of original wall thickness than the drawing nominal values. This assumes some areas of plates are in near pristine condition. But of course such maximum values would not be used if they were less than the original drawing nominal thickness. Note that measurement error and its variability has not been separated from the actual wall thickness variability here. Therefore when an extreme value is generated using the following methodologies, a worst case “measured wall thickness loss” is being estimated. That is, both the measurement uncertainty and the actual wall thickness variability contribute to the overall uncertainties. When we obtain a worst case value, we are then deriving a worst case “measured result” that would be expected if the entire tank were inspected using UT methodology. This is a more extreme value than would be obtained estimating only a worst case wall condition; to do that, measurement error would have to be adequately characterized and removed from consideration. That has not yet been undertaken since appropriate data is not available to do so, but it is a topic of proposed studies. Two inspection paths are available down each of two risers for Tank 241-AP-107. For example, in a ~9-ft. plate (vertical dimension) for one riser, this generates about 9 maximum measured wall thickness values per path (it actually varies from plate to plate depending on plate dimensions). These values were considered over the two paths for each riser/plate combination. The alternative “nominal thickness” selected in this manner then depends somewhat on the pattern of these maximum values, but generally it could be described as approximately the 90th percentile of such measurements. It was considered too extreme to use the largest of the 18 or so maximum values due to potential measurement error then grossly over-estimating the true nominal thickness. In this manner the Figure 6.1 maximum remaining thicknesses were obtained for Tank 241-AP-107.
Figure 6.1. Estimated Nominal Thickness from UT Maxima
16
The individual UT image minimum values in each path for a plate/riser combination were then subtracted from the estimated maximum value for that plate/riser from Figure 6.1. In this manner 9 or so estimated UT maximum wall thickness losses could be obtained per path for such a plate/riser combination, and then these were combined across the two risers, two paths per riser, so about 36 such losses were available for the entire plate course. This is a relatively minimal amount of data for distribution fitting as performed in this work, which is why combining measurements across plates is desirable. Note that since two risers are used, the riser variability within the tank does contribute to the overall variability in the results. For this reason an added one-sigma uncertainty, to accommodate riser variability if only a single riser were used, is not added here (see Weier, Anderson, Berman 2005). The estimated wall thickness maximum losses for Tank 241-AP-107 are shown across plates in Figure 6.2. The vertical extent of the green diamonds represents confidence intervals for the means within each plate (the widths of the diamonds reflect the number of UT measurements per plate). Statistically these means are at most only very marginally different, so for this reason it could be deemed appropriate to combine the measurements across all plates, and that is indeed done in the following for extreme value analysis, in addition to giving results for the individual plates. But the extreme value results actually depend more on the large values in the upper tails of plates' distributions than on the plate means. For this reason alternative groupings are considered; plates 1, 3, and 4 are combined since they have all the outlying larger values, and plates 2 and 5 are combined since they do not. Thus extreme value results are given for these latter groupings as well.
Figure 6.2. Estimated Maximum Loss by Plate The histograms in Figure 6.3 show estimated maximum wall thickness loss data for the individual plate courses. Three-parameter Weibull distributions are fit to these histograms and are shown as the smooth curves. The total surface area of a plate course, and thus the number of 15-in. by 12-in. UT images needed to 100% inspect the entire plate course is computed. The percentile of the distribution that then corresponds to the maximum expected loss among this many UT images, based on the distribution fit
17
to the histogram, is considered as the expected estimated worst case loss in that plate course.
The number of measurements available and the quality of the fit of the Weibull distribution affect the uncertainty in the estimated Weibull parameters, and in turn, the uncertainty in this estimated worst case loss. Therefore 95% confidence bounds on the worst case losses are also computed using these uncertainties.
The values indicated by the arrows on the histograms are the estimated worst case losses per plate course (blue, to the left) and their associated 95% confidence bounds (orange, to the right). The corresponding values are given in the table shown in Figure 6.4. Included in the table are: 1) the number of measurements, 2) the estimated extreme value loss expected for the plate course around the entire circumference of the tank, and 3) the 95% confidence bound for the extreme value loss.
Figure 6.3. Weibull Distribution Fits to UT Maximum Wall Thickness Loss by Plate Course
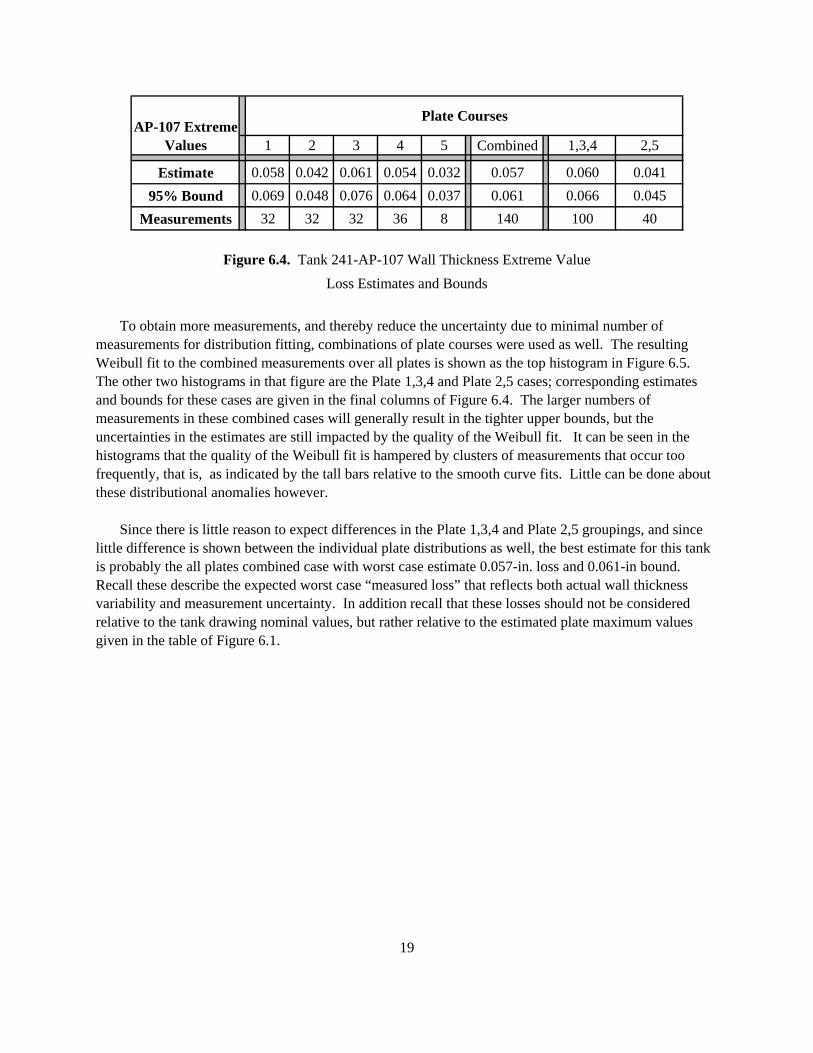
Figure 6.4. Tank 241-AP-107 Wall Thickness Extreme Value Loss Estimates and Bounds
To obtain more measurements, and thereby reduce the uncertainty due to minimal number of measurements for distribution fitting, combinations of plate courses were used as well. The resulting Weibull fit to the combined measurements over all plates is shown as the top histogram in Figure 6.5. The other two histograms in that figure are the Plate 1,3,4 and Plate 2,5 cases; corresponding estimates and bounds for these cases are given in the final columns of Figure 6.4. The larger numbers of measurements in these combined cases will generally result in the tighter upper bounds, but the uncertainties in the estimates are still impacted by the quality of the Weibull fit. It can be seen in the histograms that the quality of the Weibull fit is hampered by clusters of measurements that occur too frequently, that is, as indicated by the tall bars relative to the smooth curve fits. Little can be done about these distributional anomalies however.
Since there is little reason to expect differences in the Plate 1,3,4 and Plate 2,5 groupings, and since little difference is shown between the individual plate distributions as well, the best estimate for this tank is probably the all plates combined case with worst case estimate 0.057-in. loss and 0.061-in bound. Recall these describe the expected worst case “measured loss” that reflects both actual wall thickness variability and measurement uncertainty. In addition recall that these losses should not be considered relative to the tank drawing nominal values, but rather relative to the estimated plate maximum values given in the table of Figure 6.1.
19
Figure 6.5. Weibull Distribution Fit to Combined UT Maximum Wall Thickness Loss
6.2 Riser Differences Original analyses of Tank 241-AY-101 described in Weier, Anderson, Berman 2005 showed wall thickness differences between the four risers used. This led to requirements for UT inspection for using at least two risers. But after the several tanks were so inspected during 2007, more multiple riser results became available. For the analysis of riser differences from those 2007 tanks, riser differences were not indicated (see Weier, Pardini 2007). This led to the consideration for reducing inspections from two paths from each of two risers to perhaps three or four paths from a single riser. But for 2008, the two riser, two paths per riser, convention has been continued. Therefore riser differences will continue to be examined in 2008 reports. That is the purpose of this section.
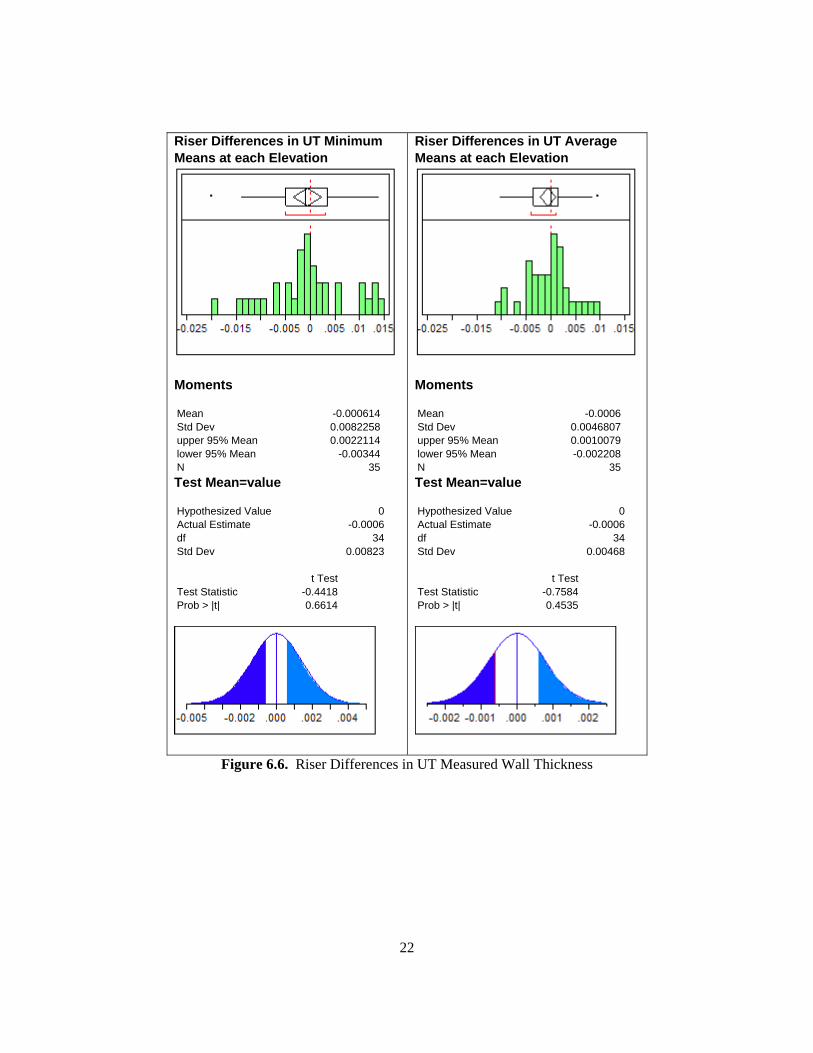
Two paths were inspected in each of Risers 30 and 31. Results were averaged over the two paths per riser at each elevation for each riser. Riser differences at each elevation were then computed by subtracting the Riser 31 means from the Riser 30 means. Figure 6.6 shows the results; the left and right sides of the figure are respectively for UT image minimum values and UT image average values.
For both the UT minimum values and the UT average values no differences are indicated between risers on the average. Histograms centered at zero at the top of the figure indicate this. Note however the
20
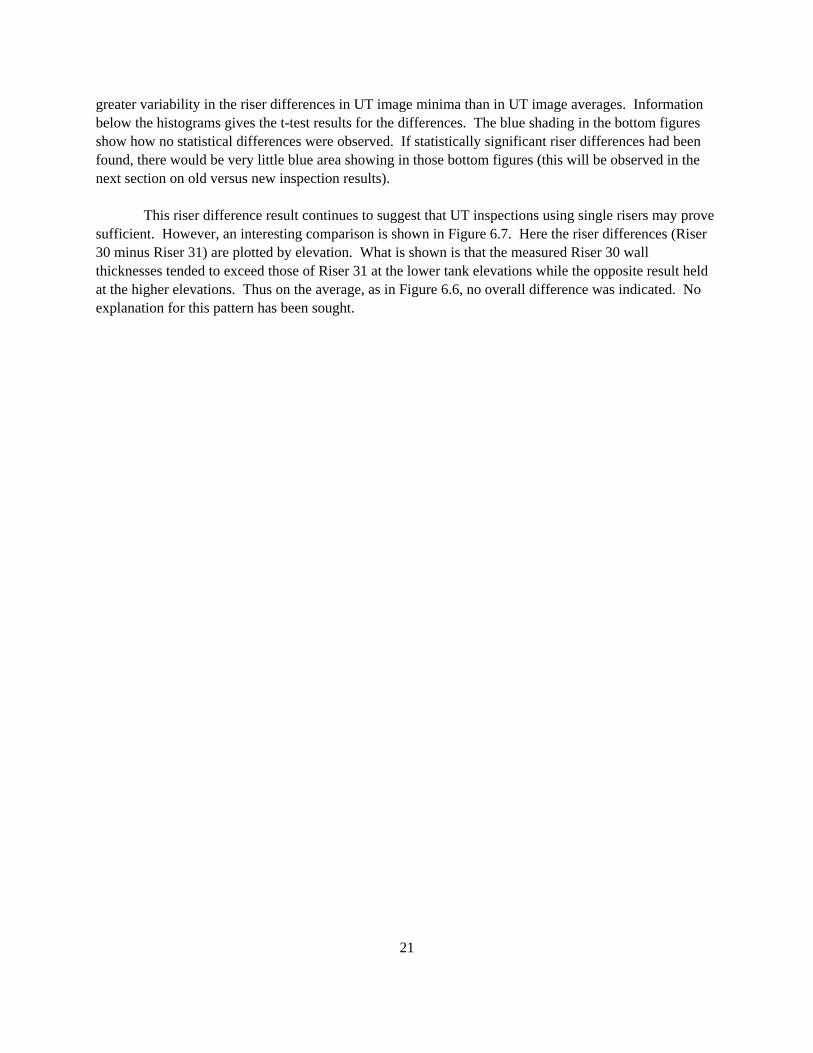
greater variability in the riser differences in UT image minima than in UT image averages. Information below the histograms gives the t-test results for the differences. The blue shading in the bottom figures show how no statistical differences were observed. If statistically significant riser differences had been found, there would be very little blue area showing in those bottom figures (this will be observed in the next section on old versus new inspection results).
This riser difference result continues to suggest that UT inspections using single risers may prove
sufficient. However, an interesting comparison is shown in Figure 6.7. Here the riser differences (Riser 30 minus Riser 31) are plotted by elevation. What is shown is that the measured Riser 30 wall thicknesses tended to exceed those of Riser 31 at the lower tank elevations while the opposite result held at the higher elevations. Thus on the average, as in Figure 6.6, no overall difference was indicated. No explanation for this pattern has been sought.
21
Riser Differences in UT Minimum Means at each Elevation
Moments Mean -0.000614Std Dev 0.0082258upper 95% Mean 0.0022114lower 95% Mean -0.00344N 35Test Mean=value Hypothesized Value 0Actual Estimate -0.0006df 34Std Dev 0.00823 t TestTest Statistic -0.4418Prob > |t| 0.6614
Riser Differences in UT Average Means at each Elevation
Moments Mean -0.0006 Std Dev 0.0046807 upper 95% Mean 0.0010079 lower 95% Mean -0.002208 N 35 Test Mean=value Hypothesized Value 0 Actual Estimate -0.0006 df 34 Std Dev 0.00468 t Test Test Statistic -0.7584 Prob > |t| 0.4535
Figure 6.6. Riser Differences in UT Measured Wall Thickness
22
UT Minima Differences UT Averages Differences
Figure 6.7. Riser 30 minus Riser 31 Differences
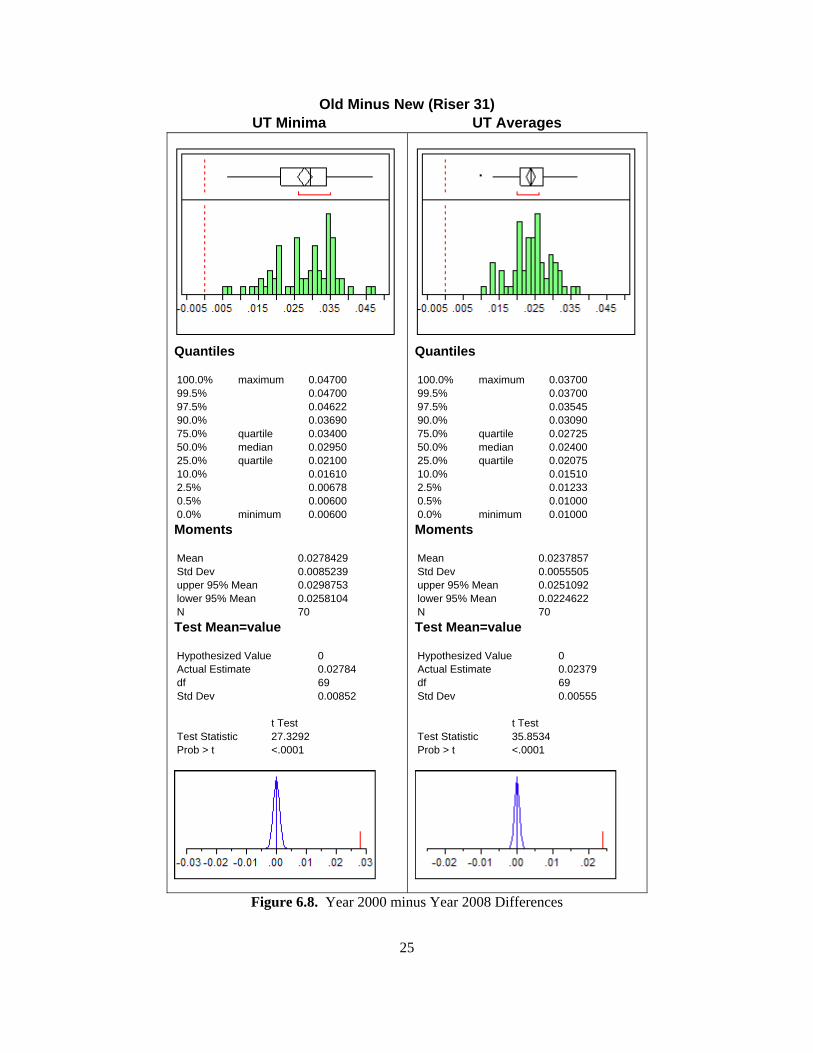
6.3 Comparison between 2000 and 2008 Data Two paths were inspected in approximately the same locations under Riser 31 in both the recent inspection and that performed in the prior Tank 241-AP-107 inspection performed in 2000. Individual UT images from 2000 and 2008 can therefore be compared within paths and at the various elevations. That is the purpose of this section. Figure 6.8 shows the “Old minus New” comparison by UT image. The mean difference in the 70 UT minima measurements that can be compared in this manner is about 0.028-in. For the UT average measurements this average difference is about 0.024-in. The red vertical dashed lines on the histograms at the top of the figure indicate no difference, and it can be seen that in no case was a 2008 UT image result ever less than the 2000 UT image result. T-tests are therefore strongly statistically significant as indicated by the lack of blue in the curves at the bottom figure (the opposite of the situation in the previous section on riser differences). But even more dramatic are the results plotted in Figure 6.9. Here differences from nominal wall thickness are plotted for each path, both for the UT Minima and the UT averages as labeled on the various plots. The red curves are for year 2000, and since the losses are “nominal minus measured” wall thickness, those values being almost always negative indicate the 2000 wall thicknesses were almost always greater than the original nominal thicknesses. But for the 2008 measurements, the UT averages were right about at nominal with the losses above and below the horizontal dashed line at zero loss. The UT minima values have moved to positive values which indicate the newer measurement are below nominal. The tracking of the paths with each other is quite remarkable, especially for the UT average values. Such consistent differences between the 2000 and 2008 results indicate one of two things, or perhaps both: 1) A very uniform corrosion rate over all tank wall surfaces that were inspected.
23
2) A systematic difference in the way measurements were generated in 2000 and in 2008. Intuitively it would seem that such consistent differences make the second reason seem the more reasonable. Special studies of UT wall thickness measurement capability have been proposed that seek to identify the source of such systematic measurement error so that it can be better controlled. This will better support comparisons of today’s measurements with those taken in the future so that these UT inspections can be used to make meaningful studies of wall thickness corrosion.
24
Old Minus New (Riser 31) UT Minima UT Averages
Quantiles 100.0% maximum 0.04700 99.5% 0.04700 97.5% 0.04622 90.0% 0.03690 75.0% quartile 0.03400 50.0% median 0.02950 25.0% quartile 0.02100 10.0% 0.01610 2.5% 0.00678 0.5% 0.00600 0.0% minimum 0.00600 Moments Mean 0.0278429 Std Dev 0.0085239 upper 95% Mean 0.0298753 lower 95% Mean 0.0258104 N 70 Test Mean=value Hypothesized Value 0 Actual Estimate 0.02784 df 69 Std Dev 0.00852 t Test Test Statistic 27.3292 Prob > t <.0001
Quantiles 100.0% maximum 0.03700 99.5% 0.03700 97.5% 0.03545 90.0% 0.03090 75.0% quartile 0.02725 50.0% median 0.02400 25.0% quartile 0.02075 10.0% 0.01510 2.5% 0.01233 0.5% 0.01000 0.0% minimum 0.01000 Moments Mean 0.0237857 Std Dev 0.0055505 upper 95% Mean 0.0251092 lower 95% Mean 0.0224622 N 70 Test Mean=value Hypothesized Value 0 Actual Estimate 0.02379 df 69 Std Dev 0.00555 t Test Test Statistic 35.8534 Prob > t <.0001
Figure 6.8. Year 2000 minus Year 2008 Differences
25
Riser 31 Old Minus New Losses (relative to design nominal)
UT Minima
Path 1 Path 2
UT Averages Path 1 Path 2
Figure 6.9. Year 2000 versus Year 2008 Measurement Paths
26
7.0 Conclusions The results of the examination of Tank 241-AP-107 have been evaluated by PNNL personnel. The examination included two vertical 15-in.-wide scan paths over the entire height of the tank from Riser 30. The ultrasonic examination also included two vertical 15-in.-wide scan paths over the entire height of the tank and the heat-affected zone (HAZ) of four vertical welds and one horizontal weld from Riser 31. The examination was performed to detect any wall thinning, pitting, or cracking in the primary tank wall. 7.1 Primary Tank Wall Vertical Scan Paths Two 15-in.-wide vertical scan paths were performed on Plates #1, #2, #3, #4, and #5 from Riser 30. The plates were examined for wall thinning, pitting, and cracks oriented vertically on the primary tank wall. The results indicated that the minimum thicknesses in the areas that were scanned are as follows: The nominal thickness in Plate #1 is 0.500-in. and the minimum thickness in this area was 0.467-in. The nominal thickness in Plate #2 is 0.500-in. and the minimum thickness in this area was 0.467-in. The nominal thickness in Plate #3 is 0.5625-in. and the minimum thickness in this area was 0.536-in. The nominal thickness in Plate #4 is 0.750-in. and the minimum thickness in this area was 0.729in. The nominal thickness in Plate #5 is 0.875-in. and the minimum thickness in this area was 0.858-in. There were no areas of wall thinning that exceeded the reportable level of 10% of the nominal thickness. No pitting or vertical crack-like indications were detected in Plates #1, #2, #3, #4, or #5. Two 15-in.-wide vertical scan paths were performed on Plates #1, #2, #3, #4, and #5 from Riser 31. The plates were examined for wall thinning, pitting, and cracks oriented vertically on the primary tank wall. The results indicated that the minimum thicknesses in the areas that were scanned are as follows: The nominal thickness in Plate #1 is 0.500-in. and the minimum thickness in this area was 0.479-in. The nominal thickness in Plate #2 is 0.500-in. and the minimum thickness in this area was 0.464-in. The nominal thickness in Plate #3 is 0.5625-in. and the minimum thickness in this area was 0.526-in. The nominal thickness in Plate #4 is 0.750-in. and the minimum thickness in this area was 0.706-in. The nominal thickness in Plate #5 is 0.875-in. and the minimum thickness in this area was 0.856-in. There were no areas of wall thinning that exceeded the reportable level of 10% of the nominal thickness. No pitting or vertical crack-like indications were detected in Plates #1, #2, #3, #4, or #5. 7.2 Primary Tank Wall Weld Scan Paths The HAZ of vertical welds in Plates #2, #3, #4, and #5 from Riser 31 were examined for wall thinning, pitting and cracks oriented either perpendicular or parallel to the weld. The results indicated that the minimum thicknesses in the weld areas that were scanned are as follows: The nominal thickness of Plate #2 is 0.500-in. and the minimum thickness in this weld area was 0.457-in. The nominal thickness in Plate #3 is 0.5625-in. and the minimum thickness in this weld area was 0.526-in. The nominal thickness in Plate #4 is 0.750-in. and the minimum thickness in this weld area was 0.710-in. The nominal thickness in Plate #5 is 0.875-in. and the minimum thickness in this weld area was 0.832-in.
27
There were no areas of wall thinning that exceeded the reportable level of 10% of the nominal thickness. No pitting or crack-like indications were detected in the weld areas in Plates #2, #3, #4, and #5. The HAZ of the horizontal weld between Plate #5 and the tank knuckle from Riser 31 was examined for wall thinning, pitting and cracks oriented either perpendicular or parallel to the weld. The results indicated that the minimum thickness in the weld area with nominal thickness of 0.875-in. on Plate #5 was 0.835-in. The minimum thickness in the weld area with nominal thickness of 0.9375-in. on the knuckle was 0.887-in. There were no areas of wall thinning that exceeded the reportable level of 10% of the nominal thickness. No pitting or crack-like indications were detected in the weld areas on Plate #5 side or on the knuckle side of the horizontal weld. 7.3 Ultrasonic Data Statistical Analysis Extreme Value: Extreme value measured wall thickness losses were estimated. Since current remaining wall thickness typically still often exceeds drawing nominal, thereby generating negative losses, UT image maximum values were instead used to determine estimated nominal wall thickness per plate/riser combination. These thicknesses tended to run from drawing nominal up to about to 0.020-in. greater. They in turn were used with each UT image minimum value to determine estimated wall thickness losses, which were then combined for a plate course over two risers, two paths per riser. Three-parameter Weibull distributions were fit to individual plate courses and to suitable combinations of plate courses. Since minimal loss differences are indicated between plate courses for Tank 241-AP-107, the preferred case is for measurements combined over all plate courses. This generates an estimated worst case measured wall thickness loss of 0.057-in. that might be expected if the entire surface area of the tank wall were UT inspected. Actual wall thickness loss would be expected to be less. A 95% confidence bound is computed based on the uncertainty in the Weibull parameters due to the quality of the Weibull fit and the number of measurements available; this 95% bound on measured wall thickness loss is 0.061-in. Note that such losses should be considered relative to the larger “estimated” nominal wall thicknesses and not the drawing nominal. Riser Differences: Two inspections paths were competed down each of Risers 30 and 31. The use of two risers was based on initial studies of the first multi-riser-inspected Tank 241-AY-101 (in 2005). In that case, statistically significant riser differences were indicated, so it was determined that either multiple risers should be used in subsequent UT tank inspections, or if only a single riser were used, an extra uncertainty factor should be incorporated to account for such riser variability. However, the resulting 2007 two-riser UT inspections of several tanks tended to indicate that riser differences are indeed not significant. It was then suggested that three or four paths down a single riser might be adequate with inspection from multiple risers not required. For 2008, the two-riser inspections are continuing however. For the current Tank 241-AP-107 UT inspection, this lack of riser differences is again indicated. However, even though the risers did not differ in their average overall wall thicknesses, measured Riser 30 wall thicknesses did tend to exceed those of Riser 31 at the lower tank elevations while the opposite result held at the higher elevations.
28
Old versus New Inspection Comparison: Approximately the same Tank 241-AP-107 wall areas were inspected both in the previous 2000 inspection and in the current 2008 inspection. This was the case for two inspections paths in Riser 31, so about 70 pairs of old and new UT image results could be compared. A fairly persistent difference was shown of about 0.025-in. between 2000 and 2008 with the 2008 wall thicknesses being thinner. The tracking of the UT results with each other along the inspection paths is quite remarkable, especially for the UT average values. Such consistent differences between the 2000 and 2008 results indicate one of two things, or perhaps a combination of both: 1) A very uniform corrosion rate over all tank wall surfaces that were inspected. 2) A systematic difference in the way measurements were generated in 2000 and in 2008. Intuitively it would seem that such consistent differences make the second reason seem the more reasonable. Special studies of UT wall thickness measurement capability have been proposed that seek to identify the sources of such systematic measurement error so that it can be better controlled. This will better support comparisons of current measurements with those taken in the future so that these UT inspections can be used to make meaningful studies of wall thickness corrosion rates.
29
30
8.0 References Posakony GJ and AF Pardini. 1998. Final Report - Ultrasonic Examination of Double-Shell Tank 241-AN-107, PNNL-11971, Pacific Northwest National Laboratory, Richland, Washington. A. F. Pardini to C.E. Jensen dated August 22, 2000, Letter Report on Performance Demonstration Test – PDT, May 2000. Copy is on file in the PNNL DST Project Records. G. J. Posakony to C.E. Jensen dated October 5, 2001, Letter Purdy Performance Demonstration Test (PDT) Report. Copy on file in the PNNL DST Project Records. Castleberry, J. L., 2007, Task Plan for the Ultrasonic Inspection of Hanford Double-Shell Tanks FY 2008, RPP-PLAN-34301, Rev 0, CH2M HILL Hanford Group, Inc., Richland, Washington. Weier DR, and KK Andersen. 2005. Estimation of Maximum Wall Thickness Loss of Five DSTs (AN-107, AP-102, AW-101, AZ-102, and SY-101), PNNL-15415, Pacific Northwest National Laboratory, Richland, Washington. Weier DR, KK Andersen, and HS Berman. 2005. Riser Difference Uncertainty Methodology Based on Tank AY-101 Wall Thickness Measurements with Application to Tank AN-107, PNNL-15182, Pacific Northwest National Laboratory, Richland, Washington. Weier DR, Pardini AF 2007. Riser Evaluation of UT Wall Thickness Measurements and Measurement Methodology PNNL-16828, Pacific Northwest National Laboratory, Richland, Washington. A. F. Pardini to G.P. Duncan dated October 6, 2006, Letter Pintler Performance Demonstration Test (PDT) Report. Copy is on file in the PNNL DST Project Records.
Distribution No. of Copies
1 Hanford Site J. L. Castleberry (1) R3-26 5 Pacific Northwest National Laboratory
K. K. Anderson (1) K6-08 S. L. Crawford (1) K5-26 A. F. Pardini (1) K5-26 G. J. Posakony (1) K5-26 M. L. Watkins (1) K5-26