19 th World Conference on Non-Destructive Testing 2016 1 License: http://creativecommons.org/licenses/by-nd/3.0/ Ultrasonic Imaging of Carbon Fiber-Reinforced Plastics Using the Full Matrix Capture Data Acquisition Technique Jan-Carl GRAGER 1,3 , Michael SCHRAPP 1 , Hubert MOOSHOFER 1 , Markus G. R. SAUSE 2 , Andreea-Manuela ZELENYAK 2 , Christian U. GROSSE 3 1 Siemens AG, Corporate Technology, Munich, Germany 2 University of Augsburg, Institute of Physics, Chair of Experimental Physics II, Augsburg, Germany 3 Technical University of Munich, Chair of Non-destructive Testing, Munich, Germany Contact e-mail: [email protected]Abstract. Within the frame of the publicly co-financed “MAIzfp” project, a highly promising ultrasonic data acquisition technique, termed Full Matrix Capture (FMC), is used in this paper to detect real defects in carbon fiber-reinforced plastics (CFRP) (i.e. impact damages). With this approach, a full raw data set of time domain signals (A-Scans) from every transmitter-receiver pair in an array probe is individually collected, stored and subsequently reconstructed as an image. The most common reconstruction algorithm for FMC data is the Total Focusing Method (TFM) in which all individually collected signals are time-shifted and combined to synthesize a focus at every voxel in the resulting image. This algorithm assumes a point source model where spherical ultrasonic waves are emitted at a particular propagation velocity. These assumptions may apply in particular test situations, but not when conducting FMC on CFRPs. Especially, directional sound velocity variations within these composites have to be considered in the image reconstruction procedure. This paper describes the essential requirements (e.g. influence of the beam directivity) to successfully apply Full Matrix Capture for the testing of anisotropic and inhomogeneous CFRP materials. Of particular concern is the modification of the TFM algorithm in order to incorporate the anisotropic sound velocity data of CFRP. Therefore, we present two methods to obtain an angular sound velocity profile. First, the experimental Backwall Reflection Method and second, a forward modeling approach. FMC measurements on impact damages are performed with a standard phased array controller using a sound velocity corrected TFM algorithm. Introduction The global demand for carbon fiber-reinforced plastic (CFRP) materials is still increasing and an end of growth is still unforeseeable [1]. These anisotropic composites usually consist of two or more different types of materials, namely carbon fibers that are embedded in a polymer matrix. The reinforcing fibers provide a high tensile strength and stiffness in fiber direction. However, typical composite structures have to be designed in a way, that many load directions are covered. Therefore, they are typically constructed as a laminates – a multilayered structure of carbon fiber plies with different orientations. More info about this article: http://ndt.net/?id=19483
Transcript
19th World Conference on Non-Destructive Testing 2016
Abstract. Within the frame of the publicly co-financed “MAIzfp” project, a highly promising ultrasonic data acquisition technique, termed Full Matrix Capture (FMC), is used in this paper to detect real defects in carbon fiber-reinforced plastics (CFRP) (i.e. impact damages). With this approach, a full raw data set of time domain signals (A-Scans) from every transmitter-receiver pair in an array probe is individually collected, stored and subsequently reconstructed as an image. The most common reconstruction algorithm for FMC data is the Total Focusing Method (TFM) in which all individually collected signals are time-shifted and combined to synthesize a focus at every voxel in the resulting image. This algorithm assumes a point source model where spherical ultrasonic waves are emitted at a particular propagation velocity. These assumptions may apply in particular test situations, but not when conducting FMC on CFRPs. Especially, directional sound velocity variations within these composites have to be considered in the image reconstruction procedure. This paper describes the essential requirements (e.g. influence of the beam directivity) to successfully apply Full Matrix Capture for the testing of anisotropic and inhomogeneous CFRP materials. Of particular concern is the modification of the TFM algorithm in order to incorporate the anisotropic sound velocity data of CFRP. Therefore, we present two methods to obtain an angular sound velocity profile. First, the experimental Backwall Reflection Method and second, a forward modeling approach. FMC measurements on impact damages are performed with a standard phased array controller using a sound velocity corrected TFM algorithm.
Introduction
The global demand for carbon fiber-reinforced plastic (CFRP) materials is still increasing and an end of growth is still unforeseeable [1]. These anisotropic composites usually consist of two or more different types of materials, namely carbon fibers that are embedded in a polymer matrix. The reinforcing fibers provide a high tensile strength and stiffness in fiber direction. However, typical composite structures have to be designed in a way, that many load directions are covered. Therefore, they are typically constructed as a laminates – a multilayered structure of carbon fiber plies with different orientations.
More info about this article: http://ndt.net/?id=19483
The high stiffness and strength-to-weight-ratio of CFRPs are the main reasons to use these composites for the manufacturing of lightweight components, like in the aerospace, automotive or energy sector. Inevitably, certain defect types (e.g. porosity, delaminations, fiber undulations or impact damages) may occur during production, maintenance or operation. Thus, reliable non-destructive testing (NDT) techniques are essential for quality assurance of these often expensive and safety relevant composite structures – especially those methods that have the capability of rapidly detecting even smaller sized defects [2]. These requirements could be fulfilled by a highly promising ultrasonic data acquisition technique, termed “Full Matrix Capture” [3].
In the case of ultrasonic inspection of CFRPs, high sound velocity variations within these anisotropic materials can impede, e.g. the application of angle-beam techniques. Therefore, ultrasonic inspection of CFRP is usually conducted by using normal incidence longitudinal waves, which are particularly sensitive to surface parallel defects like delaminations [4], but also very challenging to use for the detection of out-of-plane defects like fiber undulations or cracks perpendicular to the surface.
With the Full Matrix Capture approach, a full raw data set of time domain signals (A-Scans) from every transmitter-receiver pair in a phased array probe is individually collected and stored. This data is then usually reconstructed with a SAFT-like (“Synthetic Aperture Focusing Technique”) algorithm, termed “Total Focusing Method” (TFM), which both apply distinct time delays to the individual signals prior to their summation. The general form of the TFM (described by Holmes et al. [3]) assumes an isotropic sound velocity in the test object, which does not apply for CFRPs. The angular sound velocity profile of the tested CFRP material is essential information to properly reconstruct FMC data. Otherwise, possible defects will appear distorted in shape and size [5, 6], cannot be positioned properly or do not (directly) appear in the reconstructed image [4, 7].
This paper starts with a description of the Full Matrix Capture data acquisition
technique and the Total Focusing Method as an imaging algorithm. We focus on the essential requirements to successfully apply FMC for the testing of CFRP materials. We also point out that certain probe parameters, like the element width and the center frequency, have to be chosen carefully in order to exploit the potential of the FMC-TFM combination. Of particular concern is the modification of the Total Focusing Method [3] to incorporate anisotropic sound velocity data of CFRPs into this imaging algorithm. Two methods to obtain the required group velocities over a wide range of discrete angles are presented. First, an experimental technique – a corrected version of the Backwall Reflection Method (BRM) [4] – is presented; second, a numerical modeling approach – using the Structural Mechanics module of Comsol Multiphysics – is shown. This forward approach was only applicable, since a complete set of material parameters of the used samples (i.e. anisotropic stiffness matrix, density and ply lay-up) was available within the “MAIzfp” project. In the end, we focus on testing of real defects, i.e. impact damages in thin (~ 4 mm) CFRP samples. Therefore, measurements are performed with a standard phased array controller (Focus LT from Olympus). The FMC recorded ultrasound data is then reconstructed by using a velocity corrected TFM algorithm.
1. Full Matrix Capture & Total Focusing Method
Holmes et al. [8] (University of Bristol) coined the term “Full Matrix Capture” in 2004. They described the first NDT application of this ultrasonic data acquisition technique, albeit the basic measurement principle already existed in other publications (e.g. [9, 10]).
3
The Fraunhofer Institute for Nondestructive Testing (IZfP in Saarbrücken, Germany) developed a similar technique, termed “Sampling Phased Array” [11].
During the Full Matrix Capture data acquisition process, each single element in an array transducer is pulsed one after another while all elements, including the transmitter, are set to receive mode (see Fig. 1). Thus, a complete raw data set of discrete time domain signals 捲R岫t岻 from every transmitter-receiver pair in an array probe is independently collected and stored. This data can be reconstructed as an image in a subsequent post-processing step [3, 8]. The high number of recorded signals (an array transducer with � elements produces �態 signals during a full FMC pulse cycle) can be organized into a quadratic information matrix � = �岫沈,珍岻. The indices 件 and 倹 correspond to the element number in transmission and reception, respectively [11].
2 3 4 5 6 N1
1st FMC cycleT
xz
y
2nd FMC cycleT
3 4 5 6 N1 2xz
y
Fig. 1. The top view illustrations of the elements of a linear phased array probe (left) indicate the transmitting (餐) and the receiving (斬) elements within the first two FMC cycles. Element one is pulsed during the first cycle, while all elements capture � independent time domain signals 姉�岫�岻. By sequentially shifting the
transmitting element throughout the array, � acquisition cycles are passed through, producing �� signals in total. The corresponding data allocation in � is shown on the right.
One of the main advantages of FMC is that any imaging algorithm can be applied to the recorded data set, such as the Total Focusing Method (TFM) by using all the data in � or the Synthetic Aperture Focusing Technique (SAFT) by reconstructing only the pulse-echo data on its main diagonal [11, 12]. Thus, once the FMC raw data is stored, it is fully auditable and any arbitrary beam profile can be digitally recreated [3].
Compared to multi-element aperture approaches using � elements, the total acoustic power from a single-element transmission during the FMC process is lower, resulting in a reduced electronic signal-to-noise-ratio (SNR). According to Holmes et al. [3], image reconstruction by using the TFM has an averaging effect which tempers the SNR degradation to an amount proportional to √�. Simultaneous pulsing of adjacent elements in a linear phased array probe increases the transmitted ultrasonic energy (and hence the SNR) – but also the directivity of the sound beam [10]. This limitation of angular response is often undesired, such as when FMC data is reconstructed with the TFM. In its general form [3], this imaging algorithm assumes a point source model where spherical waves are emitted and ultrasound is propagating perpendicular to the wave fronts [11, 12]. This point source model can be valid in a particular test situation (up to a certain extent), mainly depending on the element width, test frequency and wavelength within the tested material. However, these parameters have to be chosen carefully to exploit the full potential of the FMC-TFM combination.
The TFM can be classified as a “delay-and-sum” algorithm, which synthesizes a focus at every voxel of the reconstructed image (in transmission and reception) by defined time shifts and summation of all signals from � [3, 13]. At the beginning of the reconstruction process, a region of interest (ROI) in the 捲-� plane is defined and discretized into a grid, as it is shown in Fig. 2. The individual time delays 建沈 for all transmitter-receiver combinations are calculated by first determining the sound path 嫌怠 from the transmitting
4
element (T) to the focal spot at (捲捗 , �捗) and 嫌態 from the latter to the receiving element (R). The sound velocity 潔沈 of the test object – which is in the anisotropic case a function of the angle �沈 – leads to the individual time delays 建沈 [4].
1 2 3 4 5 6 N
Tpitch
testobject
ROI(xf, zf) reconstructed
voxels (TFM-Scan)
R
θ1 θ2
t1 t2
ci = f(θi)
ti = si/ci
x
z
y
Fig. 2. Illustration of the Total Focusing Method in CFRP materials using a linear phased array probe with � elements. The sound velocity in the laminate depends on the composite itself (e.g. fiber type, matrix material,
fiber volume fraction), the orientation of the probe in the 姉-姿-plane and most importantly on the angle �餐. The intensity value � of a reconstructed voxel at (捲捗 , �捗) in the TFM image
�(捲捗 , �捗) = |∑ ∑ 捲�日,乳岫建岻N珍=怠
N沈=怠 | = |∑ ∑ 捲�日,乳 (t = [嫌怠潔怠 + 嫌態潔態])N
珍=怠N
沈=怠 |, (1)
can be expressed by equation (1), where 捲�日,乳 corresponds to the (件, 倹) entries of �. One of the key advantages of the TFM algorithm is its flexibility in terms of
adaptability (e.g. incorporating anisotropic sound velocities [4, 7] or considering beam directivities [12]), which can enhance the image quality.
2. Experimental configuration
A standard phased array acquisition unit from Olympus (Focus LT) and its inspection software TomoView was used. In general, this combination does not provide a FMC acquisition mode. However, a number of focal laws – each of them containing one transmitter-receiver element combination – had to be defined for FMC testing. Although the Focus LT is limited to 256 programmable focal laws, only 255 could be imported by the software. Thus, FMC was carried out with the maximum number of 15 elements (225 focal laws). Matlab was used for signal processing. Two linear probes with 64 elements from Olympus were used without a wedge; first, a 2.25 MHz probe (2.25L64-A2; 0.75 mm element pitch) and; second, a 5 MHz probe (5L64-A2; 0.60 mm pitch).
Since the aperture is limited to 15 elements and the focal laws could not be multiplexed across the entire aperture of the transducer, physical probe movement had to be conducted with a three-axis manipulator. Here, the probes were in direct contact with the test samples by using oil as a couplant.
Two CFRP samples were tested, both following a quasi-isotropic lay-up and having the same epoxy resin matrix. Sample I was an impacted specimen and consisted of 20 unidirectional plies (each being 0.20 mm thick), having a variable laminate thickness between 3.5 mm and 3.9 mm. Sample II was 10.5 mm in thickness, had no defects and consisted of 80 woven layers (0.13 mm each).
5
3. Angular Sound Velocity Profile of CFRP
The TFM algorithm [3] is based on coherent superposition of returning echo signals from scatterers and on incoherent noise cancellation. Thus, accurate time-of-flight calculations – which rely on precise sound velocity data – are essential for the reconstruction, e.g. to avoid distortion of defects in the images, caused by unwanted phase conditions in the focal spots (i.e. the reconstructed voxels).
Focusing of ultrasonic beams in CFRP laminates is influenced by the fiber plies, as the sound velocity changes with their orientation and the beams are refracted at different angles within each interface [7] (Fig. 3). Thus, a homogenization approach [14] for the composite in the 捲-� plane is necessary to incorporate angle dependent sound velocities into the TFM algorithm. The multilayered laminate is therefore replaced by a single homogeneous but still anisotropic material. Hence, the individual positions of the entering (Penter) and the exiting point (Pexit) of an incident plane wave are identical on both surfaces, irrespectively of considering a heterogeneous or homogeneous material. The ply-individual sound velocities 潔沈 in the 捲-� plane can now be replaced by a single (angle dependent) group velocity, which describes the velocity of the acoustic energy (i.e. wavefront propagation in the material). Now, in any point of the 捲-� plane in the material, the velocity profile is identical [4]. Since an average acoustic energy direction is assumed, some accuracy in positioning is lost, but it is still assumed to be minimal when considering typical ply thicknesses in the range of 0.2 mm [7].
x
z
y Penter
d1
d2
d3
d4
Pexit
c1
c2
c3
c4
heterogeneous homogeneous
Penter
d
Pexit
θ
Fig. 3. Homogenization approach for CFRP laminates (according to [14, 15]). An incident plane wave at Penter is refracted at different angles within each ply interface before exiting the composite at Pexit, since the sound velocity changes with the ply orientation (left). The homogenization of the material in the 姉-子 plane (right) is
necessary to incorporate angle dependent sound velocities, although some accuracy in positioning is lost.
Some methods are proposed in the literature to obtain angular sound velocity data of CFRP materials. First, the Velocity Variation Compensation (VVC) method [7]; second a through-transmission method using two phased array probes [4]; third the Backwall Reflection Method [4]; and fourth, using a forward approach via modeling. The last two are presented in this section. 3.1 Backwall Reflection Method (BRM) The Backwall Reflection Method [4] is a straightforward approach to measure a set of discrete group velocities at different angles �. It requires a flat composite laminate with parallel front and back surfaces, a phased array probe placed on the test object and a single FMC transmission cycle (Fig. 4). Since the geometric positions of the back-wall and the individual elements are known, up to � group velocities can be obtained by identifying the arrival time of the back-wall echo in the individual A-Scans. The highest angle that can be
6
theoretically covered ����,�ℎ = ta�−怠[� ∙ 岫� − な岻/に穴] is a function of the element pitch �, the number of elements � and the laminate thickness 穴.
2 5 6 N
p
test
object
R3 4
θd
θ
T/R1
(N-1) · p
x
z
y
Fig. 4. Illustration of the Backwall Reflection Method to obtain angular group velocities of CFRP by using a linear phased array probe. Up to � different group velocities can be obtained, since the back-wall echo in the recorded time domain signals occurs at the midpoint between the transmitting and the receiving element. The
geometric positions of the back-wall related to the individual elements have to be known.
To obtain the velocity profile of the impacted CFRP material, the BRM was applied to a non-defective region of sample I by using the 5 MHz probe and 64 individual focal laws for the first FMC transmission cycle (i.e. the first element was always used as a transmitter). However, as shown in Fig. 5, only eight group velocities at different angles (up to 28°) could be obtained, as the back-wall echo could not be identified at element combinations higher than T1R8 – i.e. element one was pulsed (T1) while element eight was in receive mode (R8).
Fig. 5. Three recorded A-Scans from the BRM data acquisition using the first element as the transmitter (T1).
The receiver is shifted along the aperture, from R1 (left), over R4 (middle) to R8 (right). Note that, the maximum of the back-wall echo is slightly shifted along the time axis (position of the vertical line) and loses
signal height (-22.6 dB at the T1R8 combination compared to T1R1).
It is obvious that the point source model (described in section 1) is not valid in this test situation and that the directional characteristic of the transmitter has to be taken into account. According to [16], the divergence angle at -6 dB of a rectangular shaped element �−6 鳥� = si�−怠 (ど.44 ∙ �拳 ), (2)
is a function of the wavelength � and the element width 拳 (i.e. 拳 in the plane in which the angle is measured). When assuming an isotropic sound velocity in CFRP of 3000 m/s
7
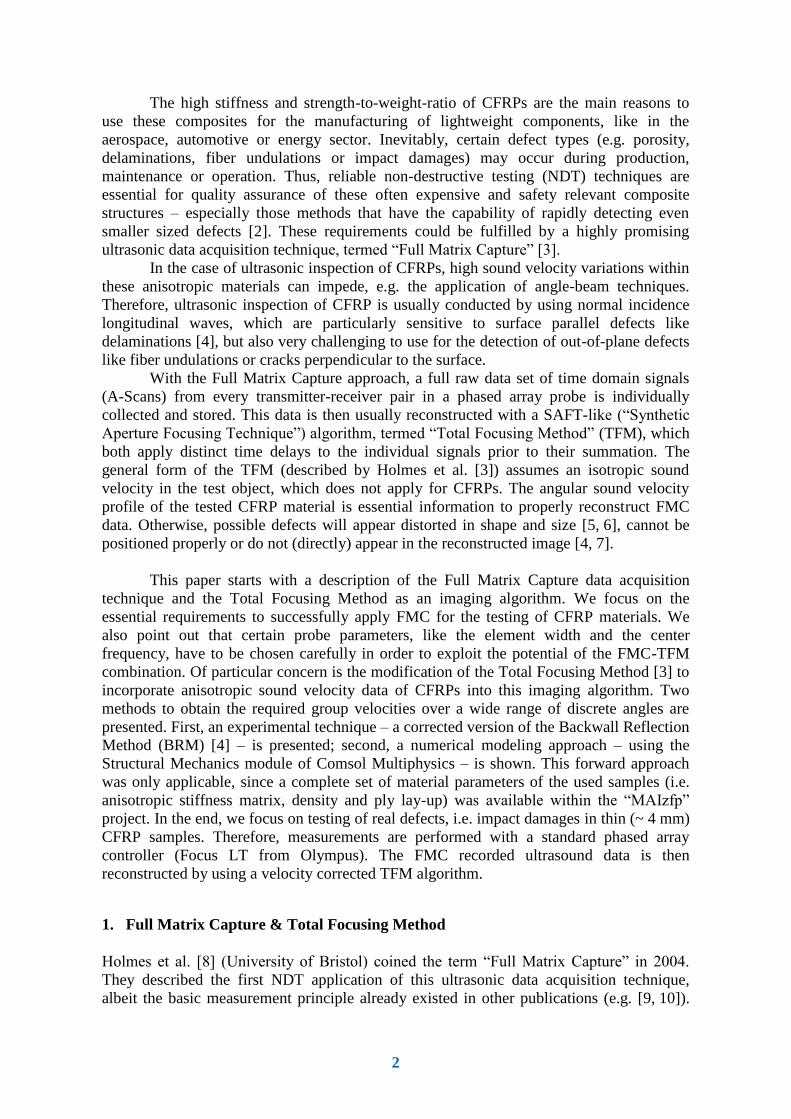
(which is a realistic value on the beam axis), equation (2) leads to a divergence angle of around 30° for the 5L64-A2 probe (element width: 0.52 mm), which may explain the signal drop at higher element combinations. Since the sound path increased by only 1 mm at the T1R8 combination (compared to T1R1), absorption effects are assumed to be negligible. Scattering caused by refraction at the individual ply interfaces of the composite may not be neglected, since the wavelength at 5 MHz (0.6 mm) is not significantly higher than the individual ply thickness (0.2 mm). Hence, the homogenization approach described at the beginning of this section may not be valid in this test situation. We assume that the limited divergence angle explains the signal drop of the back-wall echo at higher element combinations, as shown in Fig. 5. It is expected that ongoing simulations of the acoustic field of a single transmitting element in the tested composite material will give further proof to this statement. Similar results were obtained with the 2.25 MHz probe (element width: 0.67 mm) and the CFRP sample I. According to equation (2), the divergence angle of a single element is approximately 61°. Therefore, 19 group velocities at angles up to 60° could be calculated. These experimental results will be directly compared with the modeled results in subsection 3.2. In general, angular measurements with the BRM are limited by geometric parameters (i.e. laminate thickness, element pitch and number of elements) and by the ability to accurately identify the back-wall echo at higher angles [7]. The BRM was also applied to sample II by using the 2.25 MHz probe. In total, 48 group velocities – up to 58° – could be obtained (Fig. 6), which shows once again that the highest experimentally obtainable angle ����,勅�� can be roughly estimated by equation (2).
However, in order to incorporate this velocity data into the TFM algorithm, a third-degree polynomial function had to be fitted to these data points. For validating this fit for higher angles (θ > 58°), an additional through-transmission velocity measurement (350 kHz) was performed in fiber direction (θ = 90°), which differed from the fitted model. Therefore, the additional data point was used for a new third-degree polynomial fit to correct the velocity model for higher angles.
Fig. 6. Angular sound velocity profile of CFRP sample II obtained with the Backwall Reflection Method. In
total, 48 group velocities (up to 58°) could be calculated. The model was corrected for higher angles by adding an additional through-transmission velocity measurement data point (90°). The data points were fitted
to a third-degree polynomial function which could be incorporated into the TFM algorithm.
8
3.2 Modeling As an alternative approach to obtain information on the angular sound velocity
profile accompanying modeling was carried out by finite element modeling (FEM) using the Structural Mechanics module of Comsol Multiphysics. Following the experimental setup, we excited a Gaussian enveloped 5 MHz pulse defined at a point location at the top surface of the modeled CFRP sample I. Signals were then evaluated with respect to their arrival at the bottom surface of the sample. Transmission angles ranging from 0° to 81° were evaluated in 2° increments. The numerical procedure to model ultrasonic wave propagation was previously validated throughout a series of publications [17, 18] and provides sufficient accuracy to yield accurate results from composite materials. The model was implemented in a 3D approach to respect the anisotropic nature of the composite. Each ply layer was explicitly modeled to account for the difference in orientation of the ply. The model uses the full anisotropic stiffness matrix in combination with the material density as linear elastic materials model which was previously validated against experimental measurements. Computations were carried out using a convergent setting composed of 0.25 mm mesh size and a 2.0 ns time step applying a generalized-α solver.
To evaluate the propagation velocity, the point displacement is evaluated at distinct points at the bottom of the CFRP sample (directly opposed to the source position, cf. cross-section of volume in Fig. 7). The detected direct signal arrivals were evaluated to obtain their group velocity by means of the frequency-analysis routines. To this end, Choi-Williams distributions [19] as seen in Fig. 8 were computed in Matlab to obtain the correct group signal arrival time by finding the maximum intensity of the Choi-Williams coefficients. Correction was then made relative to the maximum of the sending pulse and the resulting time-of-flight was then related to the metric distance of the points (i.e. 22.15 mm for an 80° angle).
3.7
0 m
m
21.83 mm
80°75°70°60°40°0°
point source (frequency 5 MHz)
detection points
Fig. 7. Detection points at the bottom of the CFRP sample where the point displacement is evaluated in order
to assess the propagation velocity.
The evaluation results of the model are plotted in Fig. 9 as group velocity as function of angle. The points are the results obtained from FEM, with the green solid line being a fifth-degree polynomial to interpolate the data. In addition, the same figure shows 19 experimental BRM results of the same material system obtained with the 2.25 MHz probe. A third-degree polynomial function was fitted to these data points. The fifth-order polynomial fit for the FEM data was chosen, since it describes the lower angular group velocity range more accurately.
When comparing both results of the angular sound velocity profile in Fig. 9, a correlation between the FEM and the BRM data is clearly visible. The behavior of both fitted curves (up to angles that can be experimentally covered) is quite similar, with the BRM data having an offset to higher group velocities.
9
Fig. 8. Identification of the correct group signal arrival time by finding the maximum intensity of the Choi-
Williams [19] coefficients.
Fig. 9. Comparison of the angular sound velocity profile of CFRP sample I obtained with a finite element
modeling (FEM) approach and with the experimental Backwall Reflection Method (BRM). 42 group velocities (up to 81°) could be computed and 19 group velocities (up to 60°) were experimentally determined.
4. Modification of the TFM algorithm
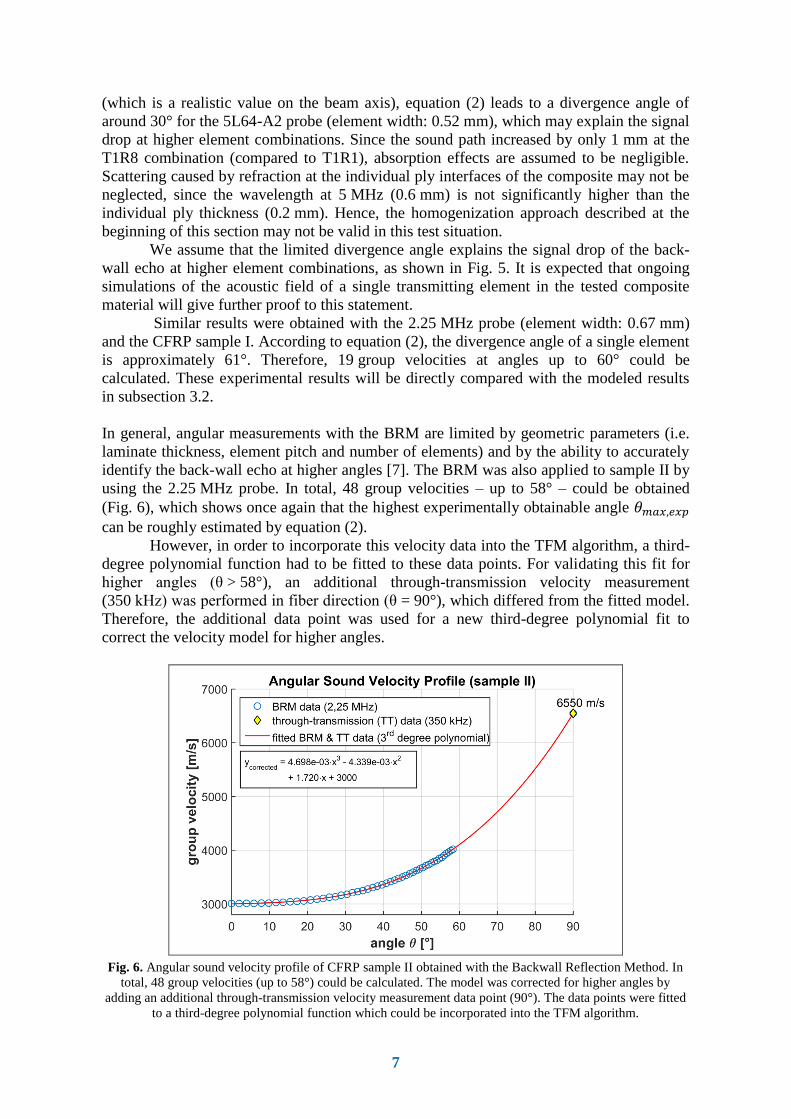
FMC testing was conducted on the impacted CFRP sample I (150 mm × 100 mm) by using the 5 MHz probe. Due to the technical limitations described in section 2, it was only possible to use an active aperture of 15 elements for data recording. Since the focal laws could not be multiplexed across the entire aperture of the linear phased array transducer, physical probe movement was conducted with a three-axis manipulator. Intensity maxima in the middle of the reconstructed image below the active aperture (caused by the limited
10
divergence angle described in section 3) caused a striped pattern in the reconstruction results (Fig. 10). This effect was tempered by overlapping the apertures during FMC data acquisition, and can still be seen in the test results in Fig. 10. Since the geometric positions of the individual elements and the voxels are known (see, e.g. Fig. 2), the angles �沈 could be calculated for every element-voxel combination. By using the angular sound velocity profile of the material, the individual time delays are calculated with the corresponding propagation velocities within the TFM reconstruction procedure. The voxel intensities �(捲捗 , �捗) were computed according to equation (1), by using the signal envelope of the time domain signals. Fig. 10 shows a velocity corrected TFM result of the FMC acquired data for CFRP sample I.
Fig. 10. The TFM imaging results of CFRP sample I show a subsurface cross-section of the test object
parallel to the surface. The contrast to the background of the two delaminations in the middle of the velocity corrected image (right) is higher than in the TFM reconstructed image with a constant sound velocity (left).
5. Conclusions and Outlook
With this paper we focused on the essential requirements to successfully apply Full Matrix Capture as a data acquisition technique to test CFRP materials. We pointed out that certain probe parameters, like the element width or the center frequency, have to be chosen carefully to exploit the potential of the FMC-TFM combination. The point source model (see section 1) is not valid while testing thin (~ 4 mm) CFRP materials. These findings can be transferred to the testing of thicker laminate structures, as it seems to be beneficial not to use the entire data from the information matrix � for imaging the closer subsurface area below the transducer. Similar findings were reported by Li et al. [15] who limited the angle of wave propagation in image formation. In other words, they fixed the aperture size at distinct image depths in order to improve the SNR.
We agree on the result of Yan et al. [7] that the Backwall Reflection Method is a quick and straightforward approach to obtain the sound velocity profile of the test object, which makes this technique especially suitable for industrial applications. Nevertheless, we showed that the application of the BRM is often limited and why modeling of sound velocities can be also very beneficial in certain test situations. We conclude that limiting the angle of wave propagation in the reconstruction process does not necessarily require sound velocities in the higher angular range as we described in section 3.
The velocity corrected TFM algorithm is essential for ultrasonic imaging of CFRP composites. But, so far we have almost neglected the heterogeneous nature of these materials, which will be a topic for further research. In addition, we will use a modified setup (i.e. new probes especially designed for polymer materials and a new acquisition unit which is really suitable to perform FMC) which will facilitate the application of FMC.
11
Acknowledgements
A major part of the research presented in this paper was granted by the German Federal Ministry of Education and Research (BMBF) in the frame of the “MAIzfp” project within the leading edge cluster MAI Carbon. The authors are also very grateful to the project partners for their close collaboration during this project.
References
[1] Kraus, T.; Kuehnel, M., Witten, E.: Composite Market Report 2015 – Market Developments, Trends, Outlook and Challenges, Carbon Composites e.V. (CCeV), 2015 [2] Karbhari, V. M.: Non-Destructive Evaluation (NDE) of Polymer Matrix Composites – Techniques and Applications, Woodhead Publishing Limited, Cambridge, ISBN: 978-0-85709-344-8, 2013 [3] Holmes, C.; Drinkwater, B. W.; Wilcox, P. D.: Post-Processing of the Full Matrix of Ultrasonic Transmit-Receive Array Data for Non-Destructive Evaluation, NDT & E International, 38(8):701-711, 2005 [4] Li, C.; Pain, D.; Wilcox, P. D.; Drinkwater, B.W.: Imaging Composite Materials Using Ultrasonic Arrays, NDT & E International, 53:8-17, 2013 [5] Kremkau, F. W.; Taylor, K. J.: Artifacts in Ultrasound Imaging, Journal of Ultrasound in Medicine, 5(4):227-237, 1986 [6] Contreras Ortiz, S. H.; Chiu, T.; Fox, M. D.: Ultrasound Image Enhancement: A Review, Biomedical Signal Processing Control, 7:419-428, 2012 [7] Yan, D.; Sutfliffe, M.; Wright, B.; Cooper, I.: Ultrasonic Imaging of Full Matrix Capture Acquired Data for Carbon Fibre-Reinforced Polymer”, Insight – Non-Destructive Testing and Conditioning Monitoring, 55(9):477-481, 2013 [8] Holmes, C.; Drinkwater, B. W.; Wilcox, P. D.: The Post-Processing of Ultrasonic Array Data Using the Total Focusing Method, Insight – Non-Destructive Testing and Conditioning Monitoring, 46(11):677-680, 2004 [9] Chiao, R. Y.; Thomas, L. J.: Analytic Evaluation of Sampled Aperture Ultrasonic Imaging Techniques for NDE, IEEE Transaction on Ultrasonics, Ferroelectrics and Frequency Control, 41(4):484-493, 1994 [10] Karaman, M.; Li, P.-C.; O'Donnell, M.: Synthetic Aperture Imaging for Small Scale Systems, IEEE Transaction on Ultrasonics, Ferroelectrics and Frequency Control, 42(3):429-442, 1995 [11] Bernus, L.; Bulavinov, A.; Dalichow, M.; Joneit, D.; Kröning, M.; Reddy, K.M.: Sampling Phased Array – A New Technique for Signal Processing and Ultrasonic Imaging, Insight – Non-Destructive Testing and Conditioning Monitoring, 48(9):545-549, 2006 [12] Zhou, X.; Peng, J.; Luo, L; Wang, Z.; Gao, X.: Effects of Directivity Function on Total Focusing Method Imaging Performance, IEEE – Far East Forum on Nondestructive Evaluation/Testing (FENDT), 57-60, 2014 [13] Schmerr Jr.; L. W.: Fundamentals of Ultrasonic Phased Arrays, Springer International Publishing, ISBN: 978-3-319-07271-5, 2015 [14] Deydier, S.; Gengembre, N.; Calmon, P.; Mengeling, V. ; Pétillon, O.: Ultrasonic Field Computation Into Multilayered Composite Materials Using a Homogenization Method Based on Ray Theory, Review of Progress in Quantitative Nondestructive Evaluation, AIP Conference Proceedings, 760:1057-1064, 2004 [15] Li, C.; Pain, D.; Wilcox, P. D.; Drinkwater, B.W.: Imaging Composite Materials Using Ultrasonic Arrays, Review of Progress in Quantitative Nondestructive Evaluation, AIP Conference Proceedings, 1430:897-904, 2012 [16] Dubé, N.: Introduction to Phased Array Ultrasonic Technology Applications: R/D Tech Guideline, Advanced Practical NDT Series, Olympus NDT, ISBN: 0-9735933-4-2, 2007 [17] Hamstad, M. A.; Sause, M. G. R.: Acoustic Emission Signals versus Propagation Direction for Hybrid Composite Layup with Large Stiffness Differences versus Direction, 31st Conference of the European Working Group on Acoustic Emission (EWGAE), 2014 [18] Sause, M. G. R.; Hamstad, M. A.; Horn, S.: Finite Element Modeling of Lamb Wave Propagation in Anisotropic Hybrid Materials, Composites Part B: Engineering, 53:249-257, 2013 [19] Choi, H.-I.; Williams, W. J.: Improved Time-Frequency Representation of Multicomponent Signals Using Exponential Kernels, IEEE Transactions on Acoustics, Speech, Signal Processing, 37(6):862-872, 1989