22
Ultrasound in Distinguishing between Cardiogenic Pulmonary Edema and ARDS Ananya Anne
| Date post: | 02-Jan-2016 |
| Category: |
Documents |
| Upload: | cody-wilson |
| View: | 220 times |
| Download: | 0 times |
Ultrasound in Distinguishing between Cardiogenic Pulmonary
Edema and ARDSAnanya Anne

Case
64 y/o man with pmh of CHF, COPD, IDDM2, is sent from his nursing home with altered mental status. On presentation he is AAOX1 and follows some commands. His vitals are stable except for O2 sat which is 88%. On physical exam, there are some fine crackles to auscultation in the posterior lung fields. He has 1+ pitting edema in the lower extremities. JVP is not appreciable. His echocardiogram from one month prior shows an EF ~45%. His EKG is unchanged with no acute changes.

ARDS? Pulmonary Edema? Both?
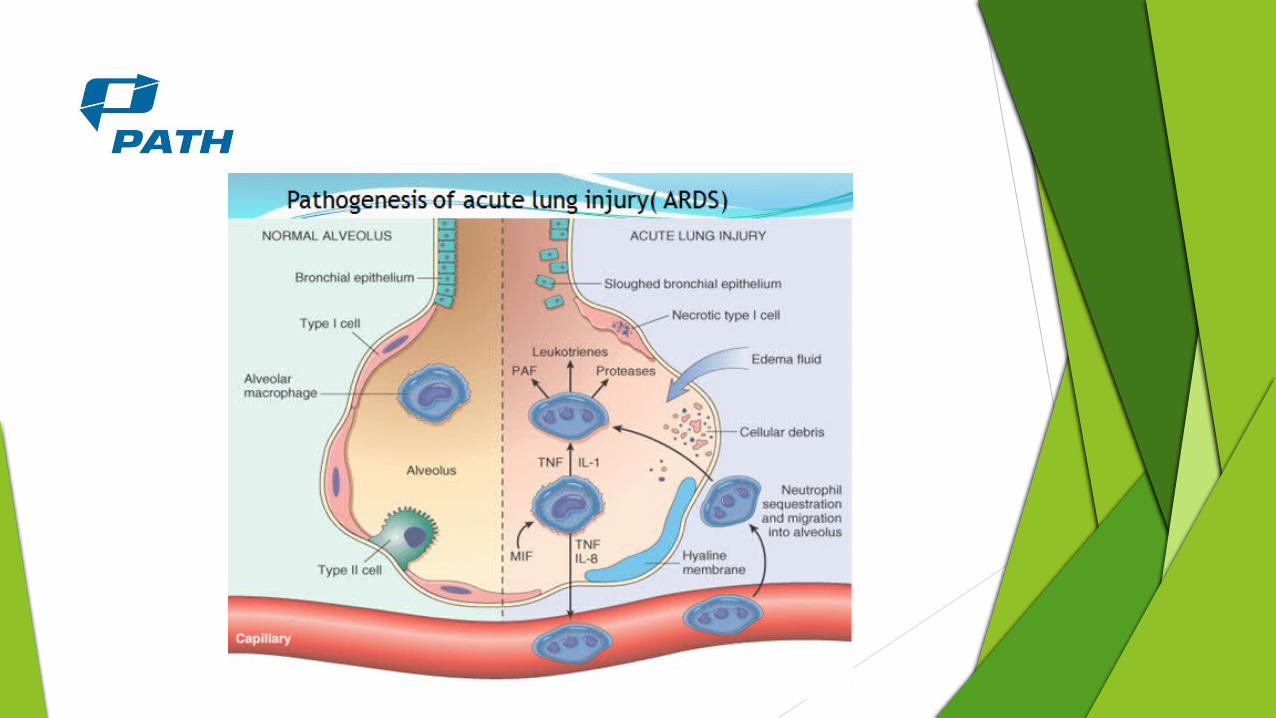

Cardiogenic pulmonary edema

Challenges with xray and CT
ARDS not associated with cardiomegaly and cephalization of pulmonary vasculature. Also, not usually associated with pleural effusions.
These differences are difficult to discern in a supine patient and if there is a white out
It takes 12-24 hours for these differences to show up on chest x ray.
In initial stages, CT shows bilateral areas of diffuse opacification, with aerial bronchograms which can be found in both ARDS and CPE.
CT not an option in unstable patient, is more costly, and exposes patients to radiation.

What’s the utility of sonography is differentiating ARDS from CPE?
Copetti et al, Cardiovascular Ultrasound, 2008.
Methods 18 patients admitted to ICU with ARDS based on American-European
Consensus Conference:
- 1) acute onset, bilateral infiltrates on chest radiography 2) pulmonary- artery wedge pressure less than 18 mmHg or the absence of clinical evidence of left atrial hypertension 3) PaO2/FiO2 ratio <= 200 in ARDS
40 patients with CPE based on:
- clinical signs and symptoms, electrocardiogram, chest x-ray, and Color-Doppler echocardiography.

-Convex probe: 3.5-5 mHz-Linear probe: 5-7 mHz- 5 areas

Ultrasound performed on first day of admission after diagnosis. Evaluated based on following signs:
AIS defined as more than 3 ULCs for each area
Pleural line abnormalities
Areas with reduced lung sliding
Spared areas
Consolidations
Pleural effusion
Lung pulse
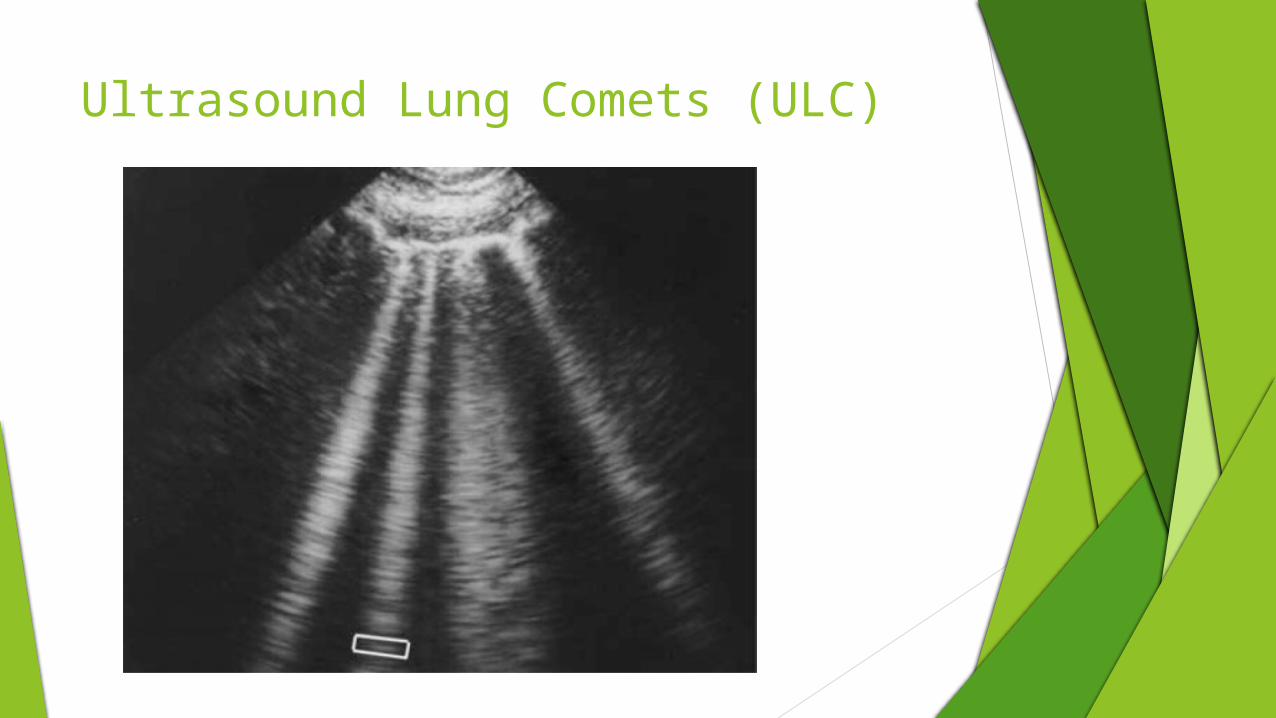
Ultrasound Lung Comets (ULC)

Pleural Line Abnormalities

Spared Areas
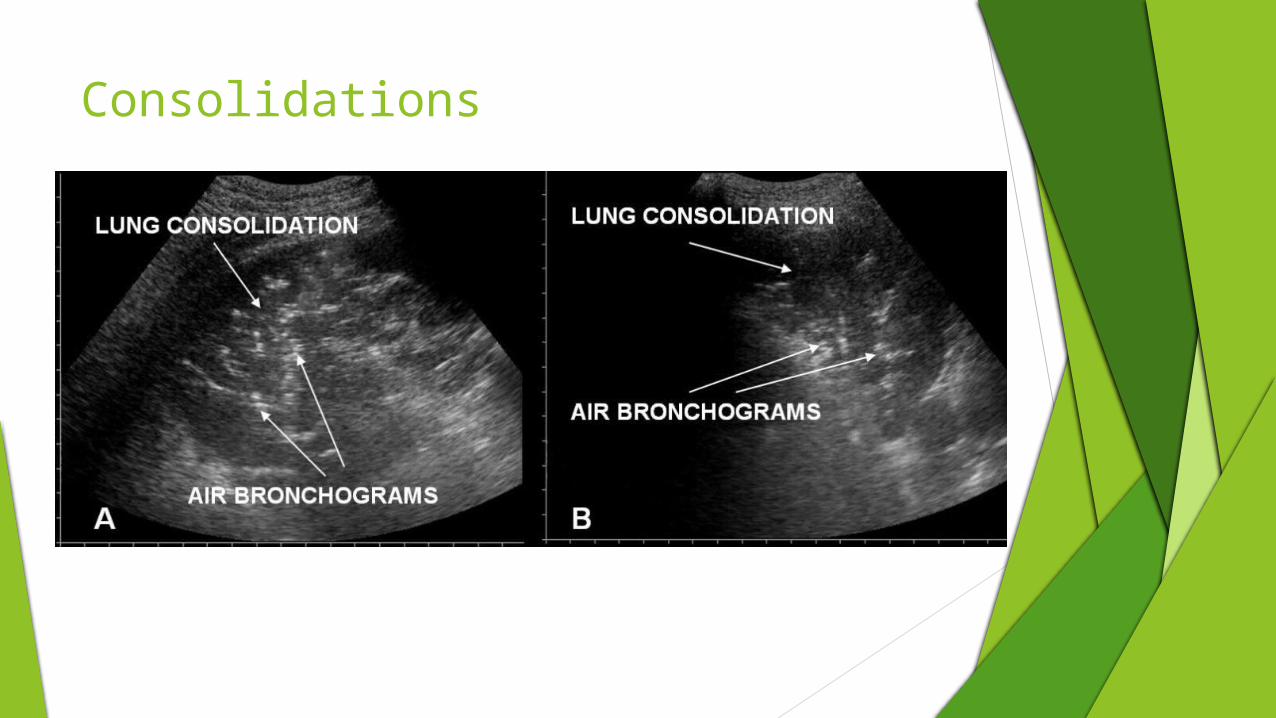
Consolidations

Pleural Effusion

Lung Pulse
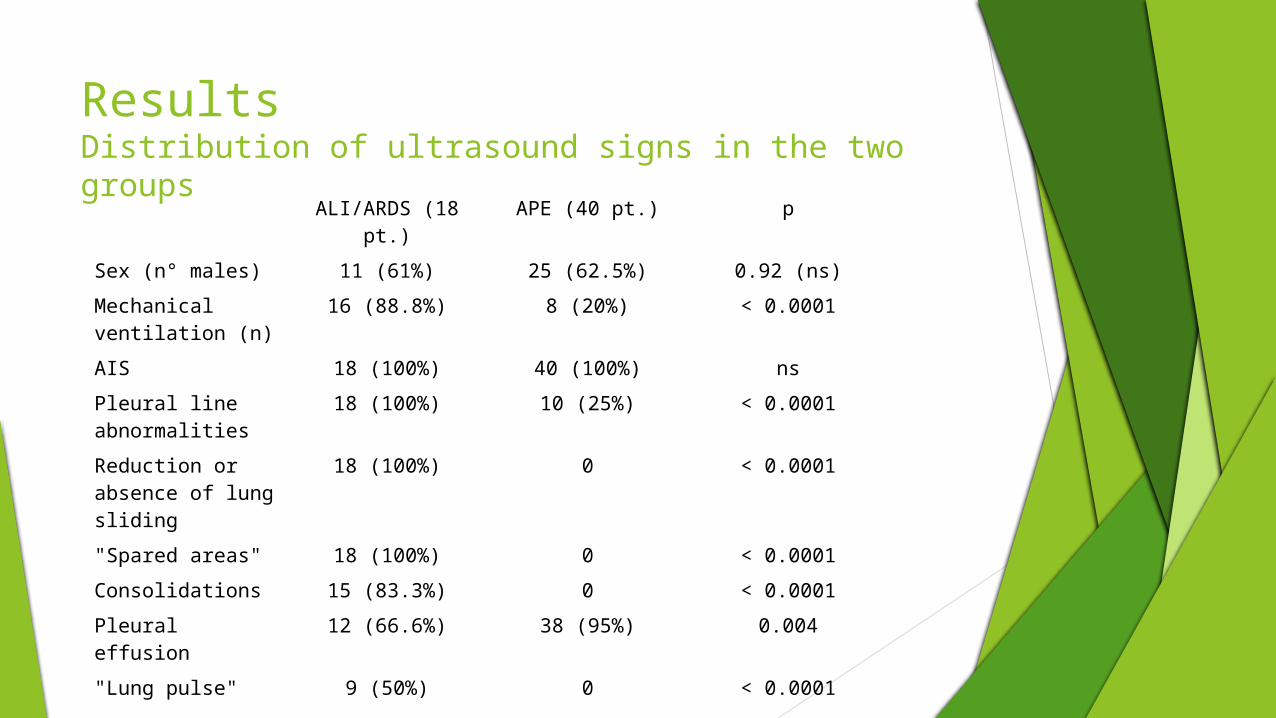
ResultsDistribution of ultrasound signs in the two groups
ALI/ARDS (18 pt.) APE (40 pt.) p
Sex (n° males) 11 (61%) 25 (62.5%) 0.92 (ns)
Mechanical ventilation (n)
16 (88.8%) 8 (20%) < 0.0001
AIS 18 (100%) 40 (100%) ns
Pleural line abnormalities
18 (100%) 10 (25%) < 0.0001
Reduction or absence of lung sliding
18 (100%) 0 < 0.0001
"Spared areas" 18 (100%) 0 < 0.0001
Consolidations 15 (83.3%) 0 < 0.0001
Pleural effusion 12 (66.6%) 38 (95%) 0.004
"Lung pulse" 9 (50%) 0 < 0.0001

Sensitivity and Specificity of Sonographic Signs in Each Group
SONOGRAPHIC SIGNS
SENSITIVITY SPECIFICITY
ALI/ARDS APE ALI/ARDS APE
AIS 100% 100% 0% 0%
Pleural line abnormalities
100% 25% 45% 0%
Reduction or absence of lung
sliding
100% 0% 100% 0%
"Spared areas" 100% 0% 100% 0%
Consolidations 83.3% 0% 100% 0%
Pleural effusion 66.6% 95% 5% 33.3%
"Lung pulse" 50% 0% 100% 50%
Other Observations Posterior lung fields had more homogenous evidence of AIS.
Areas of consolidation and air bronchograms were often found in posterior lung fields at the bases.
Relative compactness of ULCs seemed to correlate with reduced lung sliding in those areas and level of lung injury.
Compactness of ULCs also seemed to correlate with the lung pulse sign
Involvment of pleural line followed degree and distribution of ALI.
Pleural effusion more often present and larger in CPE vs ARDS, but cannot be relied upon for differential diagnosis.
Changes in consolidation areas were observed using sono after start of mechanical ventilation in ARDS.
Limitations Diagnosis known before lung findings
Chest x ray as part of the criteria
Sample size
Mixed picture
Time from presentation to ultrasonography
Counfounding comorbidities
Skill of ultrasonographer?

Conclusion“In critically ill patients ultrasound demonstration of a dyshomogeneous AIS with spared areas, pleural line modifications and lung consolidations is strongly predictive, in an early phase, of a non cardiogenic pulmonary edema”
There is utility of ultrasound in distinguishing between ARDS and CPE in the critically ill patient. The repeatability of ultrasound may be useful in assessing patient responsiveness to mechanical ventilation in ARDS.
References American Journal Of Emergency Medicine (2012). "Three-view Bedside
Ultrasound for the Differentiation of Acute Respiratory Distress Syndrome from Cardiogenic Pulmonary Edema." American Journal of Emergency Medicine 30 (2012): n. pag. Web.
Copetti, Roberto, Gino Soldati, and Paolo Copetti. "Chest Sonography: A Useful Tool to Differentiate Acute Cardiogenic Pulmonary Edema from Acute Respiratory Distress Syndrome." Cardiovascular Ultrasound 6.16 (2008): n. pag. Web.
Ishii, Hiroshi. "Comparison Of Ct Features Of Ali/Ards And Cardiogenic Pulmonary Edema." Chest (2011): n. pag. Web.
Durant, Andrea. "Ultrasound Detection of Lung Hepatization." Western Journal of Emergency Medicine 11.4 (2010): n. pag. Web.


