ULTRASTRUCTURE OF THE PRIMARY CELL WALL OF SOFTWOOD FIBRES STUDIED USING DYNAMIC FT-IR SPECTROSCOPY Jasna Stevanic Srndovic Licentiate Thesis Supervisors: Associate Professor Lennart Salmén Professor Lars Wågberg The work has been carried out at STFI-Packforsk Royal Institute of Technology Department of Fibre and Polymer Technology Division of Fibre Technology Stockholm 2008 KTH Fibre and Polymer Technology
Transcript
ULTRASTRUCTURE OF THE PRIMARY CELL WALL OF
SOFTWOOD FIBRES STUDIED USING DYNAMIC FT-IR
SPECTROSCOPY
Jasna Stevanic Srndovic
Licentiate Thesis
Supervisors:
Associate Professor Lennart Salmén
Professor Lars Wågberg
The work has been carried out at STFI-Packforsk
Royal Institute of Technology
Department of Fibre and Polymer Technology
Division of Fibre Technology
Stockholm 2008
KTH Fibre and Polymer Technology
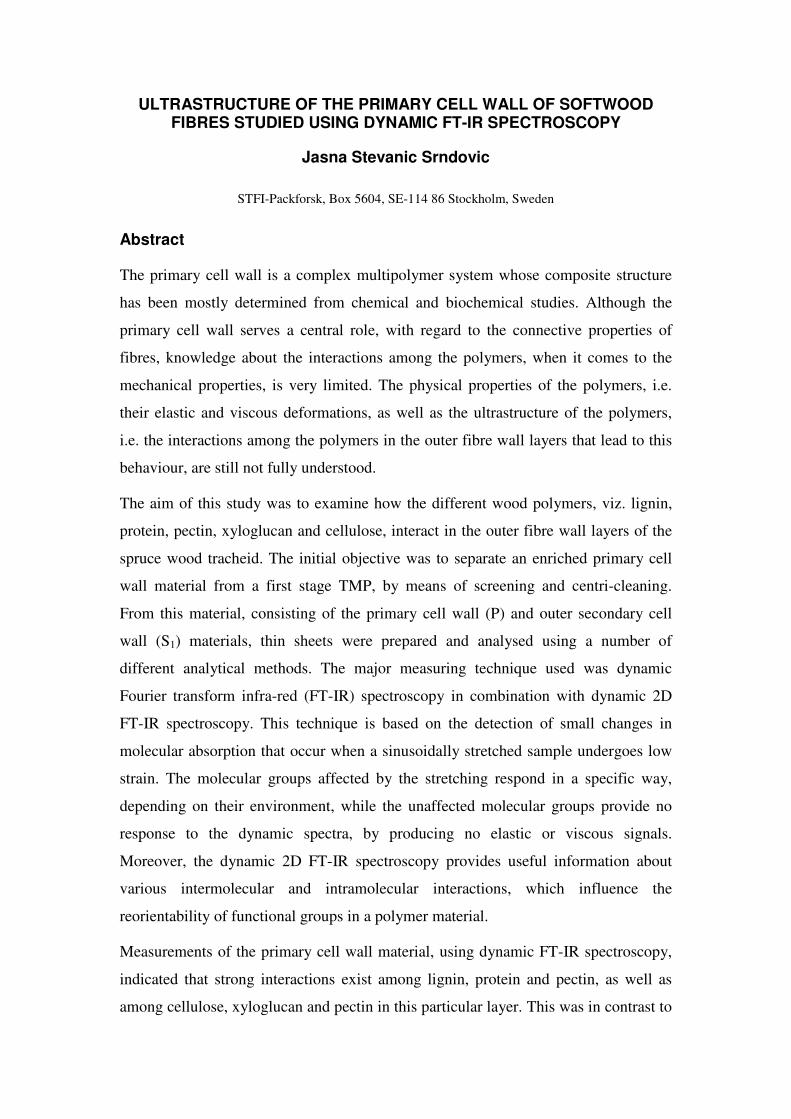
ULTRASTRUCTURE OF THE PRIMARY CELL WALL OF SOFTWOOD FIBRES STUDIED USING DYNAMIC FT-IR SPECTROSCOPY
Jasna Stevanic Srndovic
STFI-Packforsk, Box 5604, SE-114 86 Stockholm, Sweden
Abstract
The primary cell wall is a complex multipolymer system whose composite structure
has been mostly determined from chemical and biochemical studies. Although the
primary cell wall serves a central role, with regard to the connective properties of
fibres, knowledge about the interactions among the polymers, when it comes to the
mechanical properties, is very limited. The physical properties of the polymers, i.e.
their elastic and viscous deformations, as well as the ultrastructure of the polymers,
i.e. the interactions among the polymers in the outer fibre wall layers that lead to this
behaviour, are still not fully understood.
The aim of this study was to examine how the different wood polymers, viz. lignin,
protein, pectin, xyloglucan and cellulose, interact in the outer fibre wall layers of the
spruce wood tracheid. The initial objective was to separate an enriched primary cell
wall material from a first stage TMP, by means of screening and centri-cleaning.
From this material, consisting of the primary cell wall (P) and outer secondary cell
wall (S1) materials, thin sheets were prepared and analysed using a number of
different analytical methods. The major measuring technique used was dynamic
Fourier transform infra-red (FT-IR) spectroscopy in combination with dynamic 2D
FT-IR spectroscopy. This technique is based on the detection of small changes in
molecular absorption that occur when a sinusoidally stretched sample undergoes low
strain. The molecular groups affected by the stretching respond in a specific way,
depending on their environment, while the unaffected molecular groups provide no
response to the dynamic spectra, by producing no elastic or viscous signals.
Moreover, the dynamic 2D FT-IR spectroscopy provides useful information about
various intermolecular and intramolecular interactions, which influence the
reorientability of functional groups in a polymer material.
Measurements of the primary cell wall material, using dynamic FT-IR spectroscopy,
indicated that strong interactions exist among lignin, protein and pectin, as well as
among cellulose, xyloglucan and pectin in this particular layer. This was in contrast to
the secondary cell wall, where interactions of cellulose with glucomannan and of
xylan with lignin were dominant. It was also indicated that the most abundant
crystalline cellulose in the primary cell wall of spruce wood fibres is the cellulose I�
allomorph, which was also in contrast to the secondary cell wall, where the cellulose
I� allomorph is more dominant. The presence of strong interactions among the
polymers in the primary cell wall and, especially, the relatively high content of pectin
and protein, showed that there is a very good possibility of selectively attacking these
polymers in the primary cell wall. The first selective reaction chosen was a low
degree of sulphonation, applied by an impregnation pretreatment of chips with a very
low charge of sodium sulfite (Na2SO3). This selective reaction caused some structural
modification of the lignin, a weakening of the interactions between lignin;pectin,
lignin;protein and pectin;protein, as well as an increased softening of the sulphonated
primary cell wall material, when compared to the unsulphonated primary cell wall
material. All this resulted in an increased swelling ability of the material.
1.2. Aim of the study ........................................................................................................................3
1.3. TMP and CTMP processes........................................................................................................4
1.4. The wood fibre structure ..........................................................................................................4
1.5. The primary cell wall .................................................................................................................6
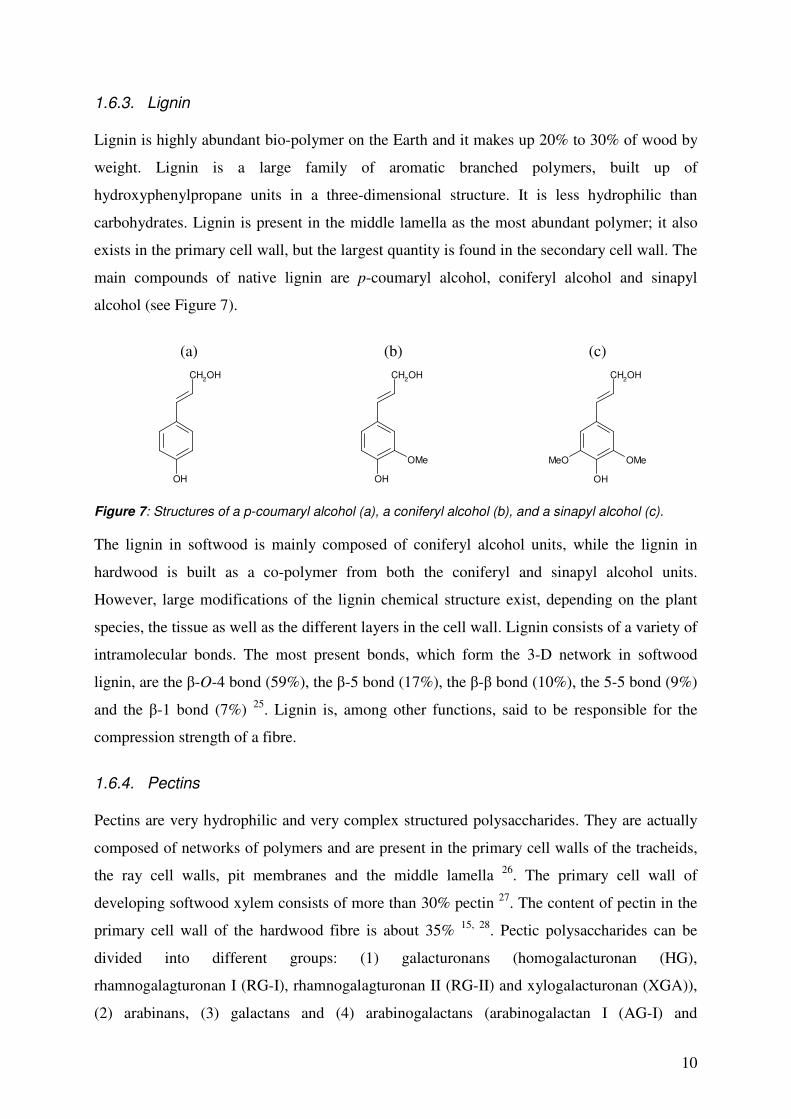
1.6. The wood polymers...................................................................................................................6 1.6.1. Cellulose (�-1,4-D-glucan) ......................................................................................................7 1.6.2. Hemicelluloses ........................................................................................................................8 1.6.3. Lignin .....................................................................................................................................10 1.6.4. Pectins...................................................................................................................................10 1.6.5. Protein ...................................................................................................................................13
1.7. Dynamic FT-IR spectroscopy .................................................................................................14 1.7.1. Theory of dynamic FT-IR spectroscopy ................................................................................14 1.7.2. Theory of dynamic 2D FT-IR spectroscopy ..........................................................................16
2. ULTRASTRUCTURAL ASPECTS AND INTERACTIONS OF THE PRIMARY CELL WALL – PAPERS I AND II ...................................................................................................................................19
2.1. Load-bearing polymers in the primary cell wall ...................................................................19
2.2. Relative content of cellulose allomorphs .............................................................................20
2.3. Interactions among polymers in the primary cell wall ........................................................22
3. EFFECT OF LOW DEGREE OF SULPHONATION ON THE MOLECULAR INTERACTION IN THE PRIMARY CELL WALL – PAPER III ............................................................................................24
3.1. Load-bearing polymers in the sulphonated primary cell wall ............................................24
3.2. Interactions among polymers in the sulphonated primary cell wall ..................................25
4. CONCLUSIONS AND FUTURE WORK .......................................................................................28
Mechanical pulping is a highly energy intensive process. One of the major tasks for the pulp-
making industries today has been to focus on saving energy. It is also a well known fact that
the fibre separation process, if not energy intensive in itself, determines the amount of energy
required in the refining process. The chemical and physical properties of the outer fibre wall
layers in Norway spruce (Picea abies (L) Karst.) differ from those of the inner fibre wall
layers. The presence of strong interactions among polymers and, especially, the relatively
high content of pectin and protein in the primary cell wall mean that there is a very good
possibility of selectively attacking the polymers in the primary cell wall 1, 2. Some studies
showed that, by attacking the primary cell wall using different chemical and/or enzymatic
treatments 3, pulp with good properties can be produced. Changing fibre properties by
utilising such treatments, if they are controlled properly, is also a means of significantly
reducing energy consumption in the refining process 4, 5. For a good fibre separation, it is
however necessary to have an appropriate surface fibrillation or roughness in the fibre rupture
zone. A softening of pectin at a relatively low moisture level, or an addition of protease that
attacks protein in the primary cell wall could make the primary cell wall quite compliant for
such a surface fibrillation, in order to be able to develop the fibre in the subsequent refining
process 1.
Improved knowledge of the primary fibre wall is thus of essential importance for attaining a
more efficient refining process in mechanical pulping as well as for producing a high quality
mechanical pulp. Dynamic FT-IR spectroscopy, in combination with dynamic 2D FT-IR
spectroscopy, is a technique suitable for studying complex polymeric materials. This
technique offers an opportunity of analysing the molecular interactions as well as the
viscoelastic behaviour of polymeric materials 6. It has been utilised here for studying the
primary cell wall.
1.2. Aim of the study
The main aim of this work was to determine the interactions among the polymers in the
primary cell wall of spruce wood fibre and its ultrastructural organisation, in order to better
understand ways of attacking this layer for a more energy efficient defibration process.
Moreover, an additional aim was to gain more knowledge when it came to the effect of a low
4
degree of sulphonation on the changes in the molecular interactions and the ultrastructure of
the primary cell wall.
1.3. TMP and CTMP processes
Mechanical pulps are mainly produced as a source for the production of printing papers.
Production mostly entails the mechanical refining of wet wood chips at a high temperature
(140 °C to 160 °C). The most commonly used wood for this purpose is softwood, Norway
spruce in particular. The principle of the thermomechanical pulping (TMP) and the
chemithermomechanical pulping (CTMP) processes is the separation of fibres from the wood
by softening and mechanical forces, followed by a refining process, which makes the fibres
suitable for the paper-making process. This means that the chips are first preheated with steam
at an elevated temperature and under pressure and then mechanically treated. Chips used for
producing CTMP are also chemically pre-treated. In the refining process, the fibres are
supposed to be separated but also the fibre fragments and fines are supposed to be created.
This is accomplished by means of a softening of lignin and hemicellulose, either by using
moisture and a high temperature, as in TMP, or by a chemical alteration, as in CTMP. Fibre
separation takes place in different regions of the cell wall, depending on the refining process
applied. In the case of TMP, where a temperature higher than 100 °C is used, the fracture
zones can appear either in the primary cell wall region or in the secondary cell wall regions,
both the outer (S1) and middle (S2) secondary cell walls. In the case of the CTMP pulping
processes, the chemical treatment causes the fracture zones to move towards the middle
lamella region, due to a softening of the lignin 1, 7.
1.4. The wood fibre structure
The structure of wood is composed from wood cells. The most important wood cells are
longitudinal tracheids, in softwoods, and libriform fibres, in hardwoods. These cells are often
referred to as fibres. Apart from fibres, there is an abundance of ray cells in softwoods, while
ray cells and vessel cells exist in hardwoods. Softwood mostly consists of fibres that are
structured in annual rings, where one ring consists of both earlywood tracheids and latewood
tracheids. Earlywood tracheids are formed in the spring and summer. They have thinner walls
and a larger lumen than the latewood tracheids, formed at the end of the growing season. The
fibre cell wall is composed of two phases, a fibrillar phase and a matrix phase. The fibrillar
phase serves as a kind of reinforcement and is composed of cellulose microfibrils, while the
5
matrix phase consists of hemicelluloses, lignin, and in the case of the primary cell wall of
small amounts of pectin and protein. The fibre cell wall is further built up by an assembly of
concentric layers, which differ in their structure as well as in their chemical composition. The
cell wall layers are mostly characterised by the angular orientation of the microfibrils, i.e. the
crystalline cellulose regions, with respect to the longitudinal cell axes, i.e. by the right
direction (Z-helix) and the left direction (S-helix) of the microfibrils. The layers are clearly
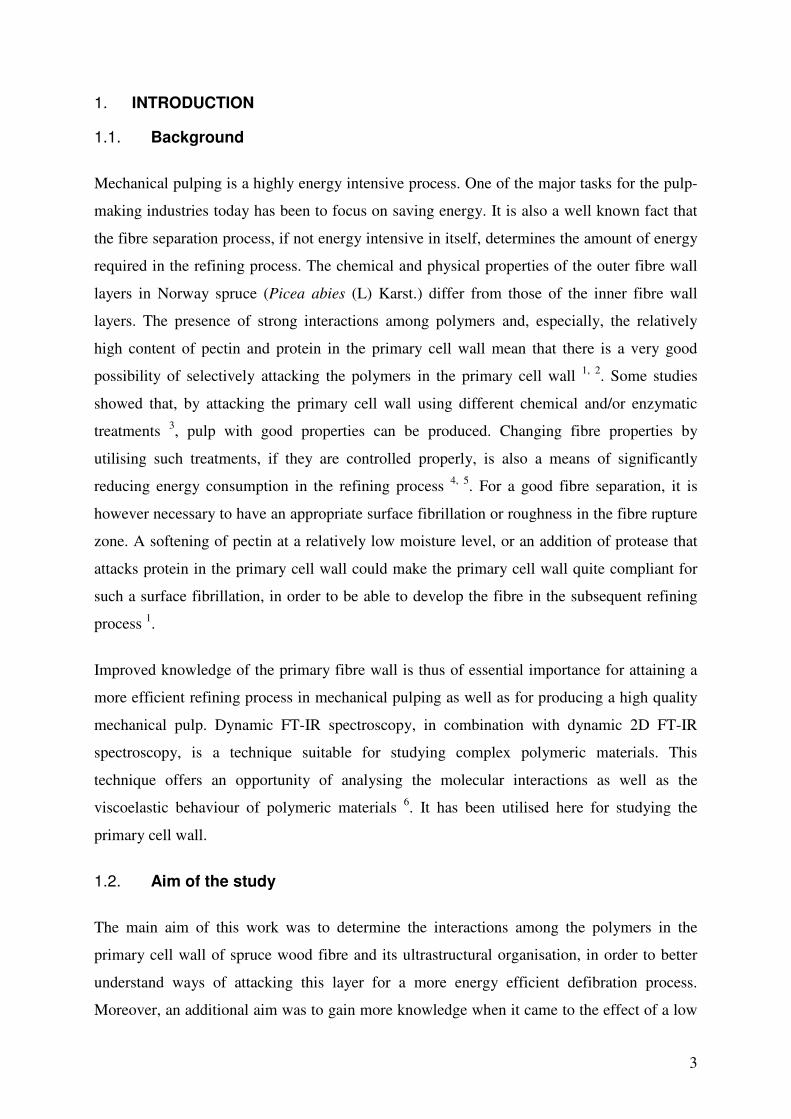
visible in an electron microscope 8. This is schematically shown in Figure 1.
S1
S2
S3
P
Figure 1: Structure of a fibre cell wall, as illustrated by Brändström 9. P – primary wall, S1 – outer secondary wall, S2 – middle secondary wall and S3 – inner secondary wall.
The cells are surrounded by a middle lamella (ML), which acts as a gluing medium holding
the cells together. The middle lamella has varying thicknesses, especially at the cell corners,
between 0.1µm and 1 �m. The main substances in the middle lamella are pectin (at an early
stage of growth) and lignin (at a later stage of growth). The primary cell wall (P) is a thin
layer (0.1µm to 0.3 �m) composed of cellulose, hemicelluloses, pectin, protein and lignin. The
secondary cell wall (S) is formed during the thickening of a cell wall. It is divided into three
layers, viz. the thin outer layer (S1) (0.1µm to 0.2 �m), the thick middle layer (S2) (1µm to 5
�m) and the thin inner layer (S3) (about 0.1 �m). The outer layer (S1) is closest to the primary
cell wall. Its microfibril angles are between 50˚ and 70˚, in a clockwise direction (S-helix).
The middle layer (S2) forms the larger portion of the cell wall, having microfibril angles (Z-
helix), which vary between 10° and 30˚ in earlywood and between 0° and 10˚ in latewood.
The inner layer (S3), adjacent to the cell lumen (L), contains microfibrils in an S-helix, with
angles between 50° and 90˚. The microfibrils in the S3 layer are oriented almost perpendicular
to the microfibrils in the S2 layer 10. The warty layer (W) is a thin amorphous membrane,
6
located inside the S3 layer, i.e. the cell lumen, L. All conifers (softwoods) have this segment
in their cell wall, however not all dicots (hardwoods) do.
1.5. The primary cell wall
The primary cell wall is an essential unit of all cells that is formed at the beginning of the cell
development. It therefore has a function different from the other cell wall layers and is
consequently constructed in a somewhat different way. The cellulose microfibrils are formed
as an irregular network in the outer side of the primary cell wall. The inner side of the primary
cell wall contains microfibrils that are more perpendicularly oriented to the cell axis 11.
Relatively large distances are present among the microfibrils in the thin primary cell wall,
which results in a low amount of cellulose. The primary cell wall is the most lignified of all
the fibre layers. It is sometimes difficult to separate the middle lamella from the primary cell
wall, which is the reason why the middle lamella and the primary cell wall are often
collectively referred to in the literature as the compound middle lamella (CML). When it
comes to the ultrastructure of the primary cell wall, it is known that lignin can make covalent
cross-links with both protein and pectin 12. It is also suggested that xyloglucan is hydrogen
bonded to cellulose and covalently linked to pectin 13, 14. Numerous other studies based on
different chemical and biochemical analyses, have shown that pectin and protein are linked by
ionic bonds and that cellulose and pectin form covalent bonds 15. It was recently suggested
that there are covalent links between lignin and carbohydrates in lignin-carbohydrate
complexes (LCCs) in the primary cell wall of softwood 16, 17.
1.6. The wood polymers
The principal bio-polymers in wood are cellulose, hemicelluloses and lignin. Pectin, protein,
extractives and some inorganic compounds are also present in the wood, but only as minor
compounds. To some extent the composition of the primary cell wall differs from the
composition of the secondary cell wall. In contrast to the secondary cell wall, the primary cell
wall of softwood contains pectin and protein, with the most abundant hemicellulose in it being
xyloglucan. Arabinoglucuronoxylan and galactoglucomannan, the major hemicelluloses in the
secondary cell wall, also occur as minor components of the primary cell wall.
7
1.6.1. Cellulose (�-1,4-D-glucan)
Cellulose is the most abundant organic material on the Earth. Wood contains about 40% to
50% cellulose, which is mostly located in the secondary cell wall of the wood fibre. Cellulose
is a linear homopolysaccharide, composed of �-D-glucopyranose units, linked together by
covalent �-1,4-glycosidic bonds that are first formed as disaccharide units, i.e. cellobioses
(Figure 2). The �-D-glucopyranose units have a chair conformation in the cellulose molecules
and their degree of polymerisation (DP) is about 10,000 in wood 11. The native cellulose,
cellulose I, is built up of two crystalline allomorphs, I� and I�, demonstrated by CP-MAS 13C-
NMR techniques 18. An examination using ray and electron diffraction techniques shows that
cellulose I� has a one-chain triclinic unit cell, while cellulose I� has a two-chain monoclinic
unit cell 19, 20.
O
OH
OH
O
OHO
OH
O
OH
OH
O
Figure 2: Structure of a cellobiose residue (length 1.03 nm) with the �-1,4-glycosidic bond. The �-D-glucopyranose units are in a chair conformation. They are at an angle of 180˚ in relation to each other.
The cellulose molecules arrange themselves in longitudinal strands, microfibrils that are
composed of several crystalline regions (60 nm in length) interrupted by noncrystalline or
paracrystalline areas along its length. The cellulose molecules, 2,500 nm to 5,000 nm long,
have a degree of crystallinity ranging from 67% to 90% in wood 21. The width, crystallinity
and DP of cellulose differ, depending on the source and the age of the tissue. The DP of the
primary cell wall cellulose is about 2,000-6,000 and quite polydisperse, while the DP of the
secondary cell wall cellulose is about 14,000 and more homogeneous 13. The cellulose
molecules have a strong tendency to form intermolecular and intramolecular hydrogen bonds.
Two intramolecular hydrogen bonds, O2’-H…O6 and O3-H…O5’, and one intermolecular
hydrogen bond, O6-H…O3 exist 22. This parallel hydrogen-bonded structure of the chain
cellulose molecules are what is called fibrils. The diameter of softwood fibrils is about 3.5 nm 23. The bundle aggregations of the fibrils are referred to as fibril aggregates. They have
variable dimensions in the cell wall of wood, with an average size of between 10 nm and 30
nm 8, 24. This structure of the cellulose is responsible for the longitudinal tensile strength of
wood fibres.
8
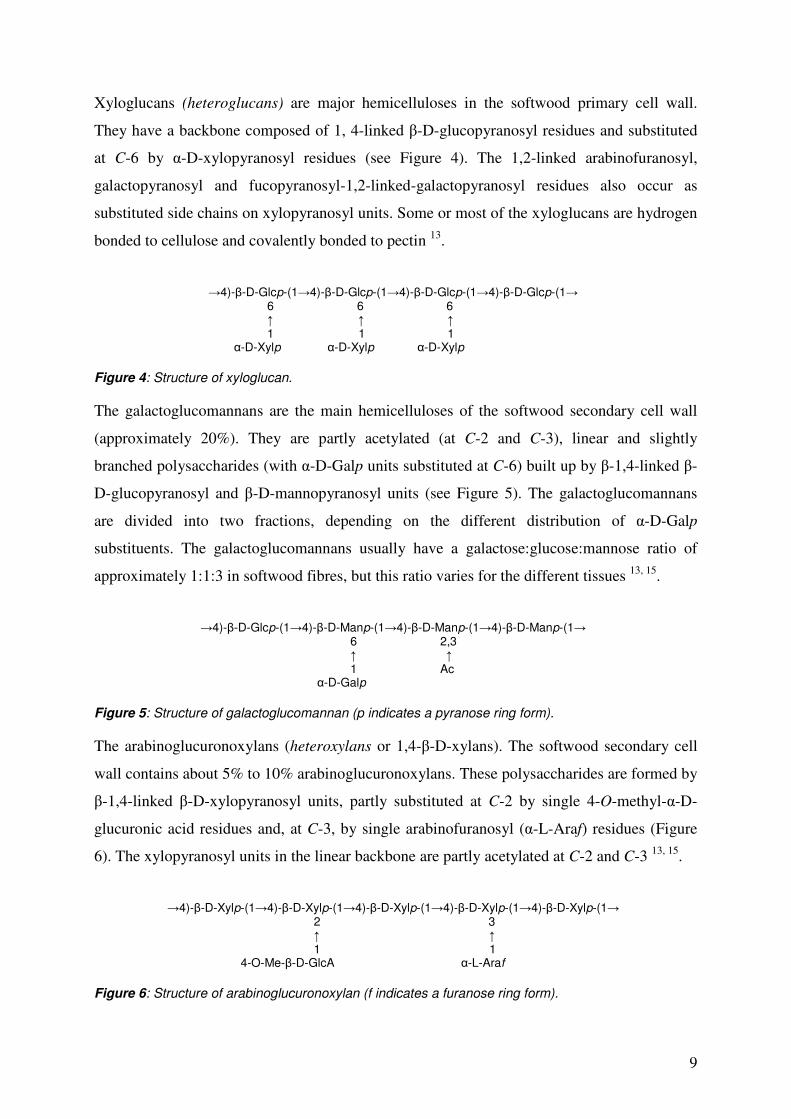
1.6.2. Hemicelluloses
Hemicelluloses are heteropolysaccharides, with a degree of polymerisation of around 100 in
softwoods and 200 in hardwoods. Hemicelluloses are isolated from both the primary and the
secondary cell walls and, in a small amount also from the middle lamella region.
Hemicelluloses are a large group of polymers, composed of several different monomer units
in the form of pyranose and furanose rings (see Figure 3), such as: (a) D-glucose (Glc), (b) D-
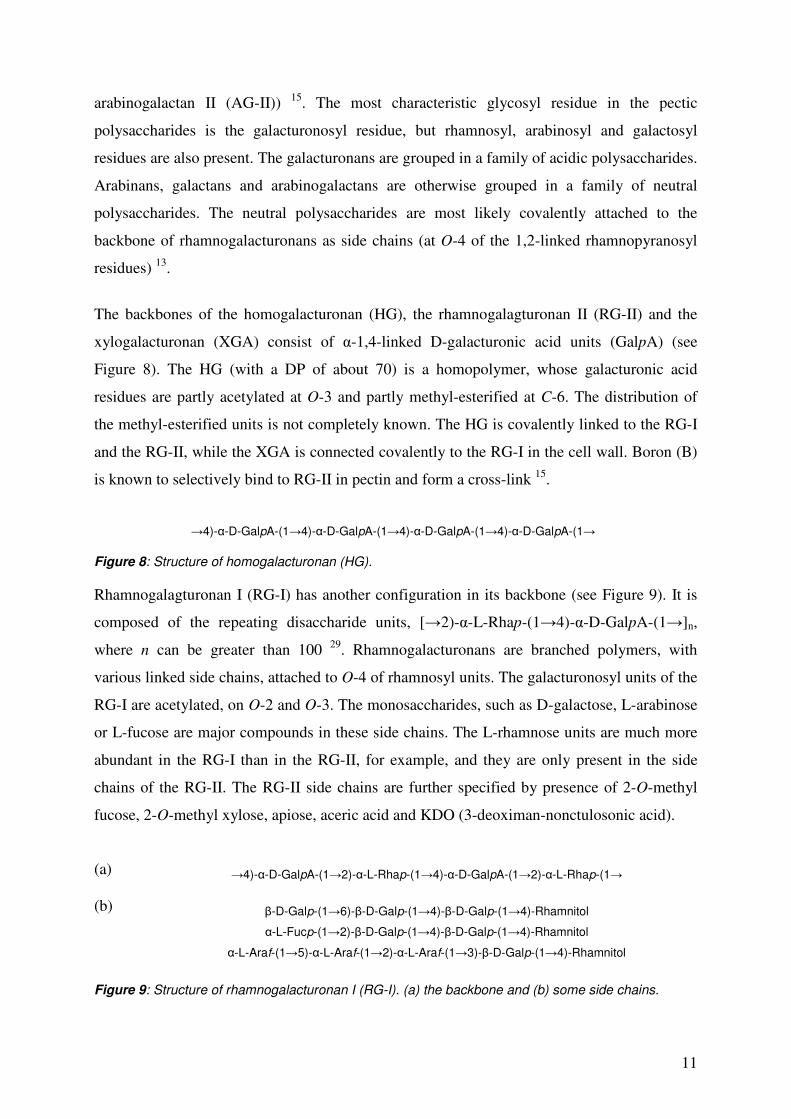
Figure 12: Structure of the glycosilated region of the hydroxyproline-rich glycoprotein, extensin 13.
14
Pro-Val). The carbohydrate portion of the extensins contains the mono-, di-, tri- or tetra-
arabinofuranosyl units (arabinose side chains) that are linked to the hydroxyproline residues
and the single galactopyranosyl units linked to many of the serine residues (see Figure 12).
Proteins make intramolecular cross-links, protein-protein or protein-phenolic-protein
(isodithyrosine) links, as well as covalent cross-links between extensin and RG-I 32.
1.7. Dynamic FT-IR spectroscopy
IR spectroscopy is an important tool for the characterisation of the chemical and physical
nature of polymeric materials. It is based on the principal that a molecule absorbs IR radiation
at a specific frequency, exciting it into a higher energy stage. The IR radiation beam covers a
broad frequency range. When this radiation goes through a sample the energy, at certain
frequencies, is absorbed by the sample. As a result of this absorption, a graph of the energy
absorbed plotted against the frequency is obtained. This graph is termed a spectrum, where
the characteristics of different molecular motions are specified. FT-IR spectroscopy is based
on measuring the absorbance as a function of time, i.e. the time-domain spectroscopy, while
conventional spectroscopy is based on measuring the absorbance as a function of the
frequency or wavelength, i.e. the frequency-domain spectroscopy. One time-domain spectrum
contains the same information as one frequency-domain spectrum and these spectra can be
converted (or modulated) to each other using mathematical manipulations.
1.7.1. Theory of dynamic FT-IR spectroscopy
The dynamic FT-IR spectroscopy technique is based on a combination of the FT-IR
spectroscopy with a dynamic mechanical analysis (DMA). This measuring technique is useful
for studying molecular interactions in complex polymeric systems, where the macroscopic
properties, i.e. viscoelasticity, of the polymeric material are closely coupled to submolecular
cooperation, i.e. ultrastructure, depending on the local environment in this polymeric material.
An external perturbation, i.e. a non-destructive sinusoidal strain with very low amplitude, less
than 0.3% of the sample length, is applied to the polymeric material and causes reversible
stress-induced reorientational changes on the molecular level. Changes in submolecular
reorientation are closely influenced by molecular interactions occurring in the material and
can be related to the viscoelastic behaviour of the material 6. Firstly, the absorption of the
incident IR radiation occurs if the frequency of the electric field vector of this incident
radiation is in resonance with the vibrational frequency of the electric dipole-transition
15
moment of the particular molecular vibration. Secondly, the absorption of the incident IR light
takes place if the electric field vector of the incident radiation and the electric dipole-
transition moment of the particular molecular vibration are oriented parallel, with respect to
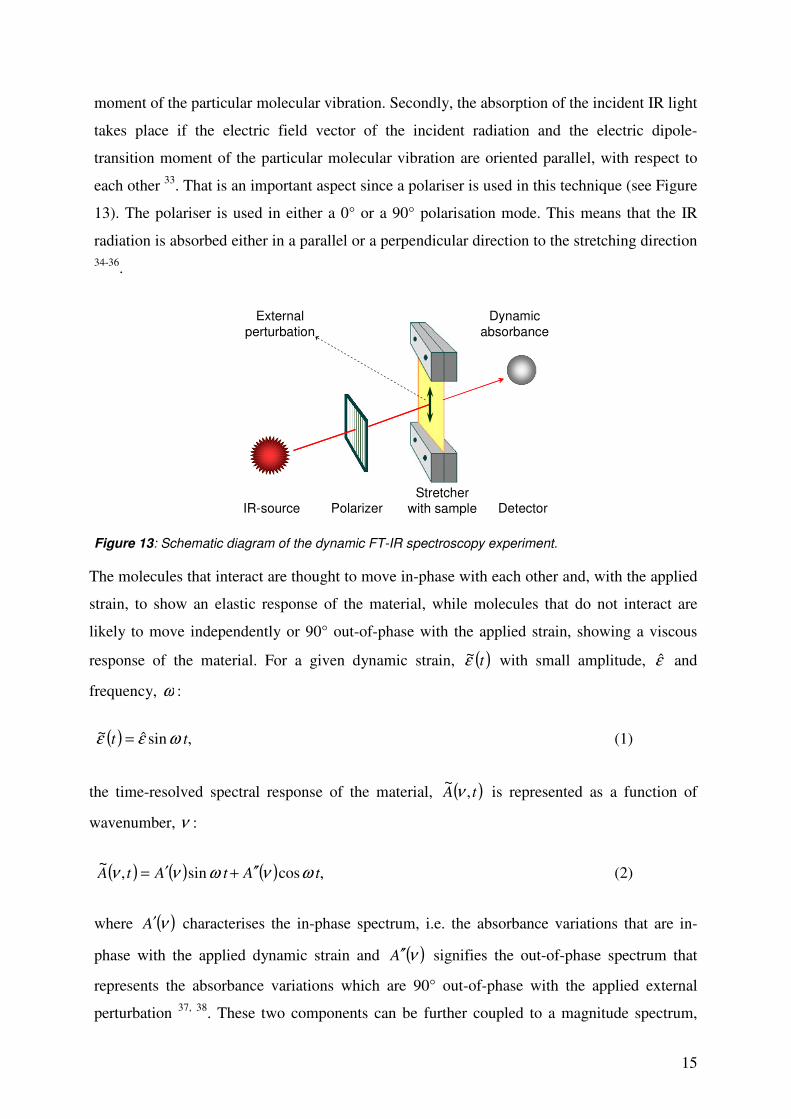
each other 33. That is an important aspect since a polariser is used in this technique (see Figure
13). The polariser is used in either a 0° or a 90° polarisation mode. This means that the IR
radiation is absorbed either in a parallel or a perpendicular direction to the stretching direction 34-36.
The molecules that interact are thought to move in-phase with each other and, with the applied
strain, to show an elastic response of the material, while molecules that do not interact are
likely to move independently or 90° out-of-phase with the applied strain, showing a viscous
response of the material. For a given dynamic strain, ( )tε~ with small amplitude, ε and
frequency, ω :
( ) ωεε sinˆ~ =t t, (1)
the time-resolved spectral response of the material, ( )tA ,~ ν is represented as a function of
wavenumber, ν :
( ) ( ) ωνν sin,~
AtA ′= t ( ) ων cosA ′′+ t, (2)
where ( )νA′ characterises the in-phase spectrum, i.e. the absorbance variations that are in-
phase with the applied dynamic strain and ( )νA ′′ signifies the out-of-phase spectrum that
represents the absorbance variations which are 90° out-of-phase with the applied external
perturbation 37, 38. These two components can be further coupled to a magnitude spectrum,
Dynamicabsorbance
Externalperturbation
Stretcher with sample DetectorPolarizerIR-source
Figure 13: Schematic diagram of the dynamic FT-IR spectroscopy experiment.
16
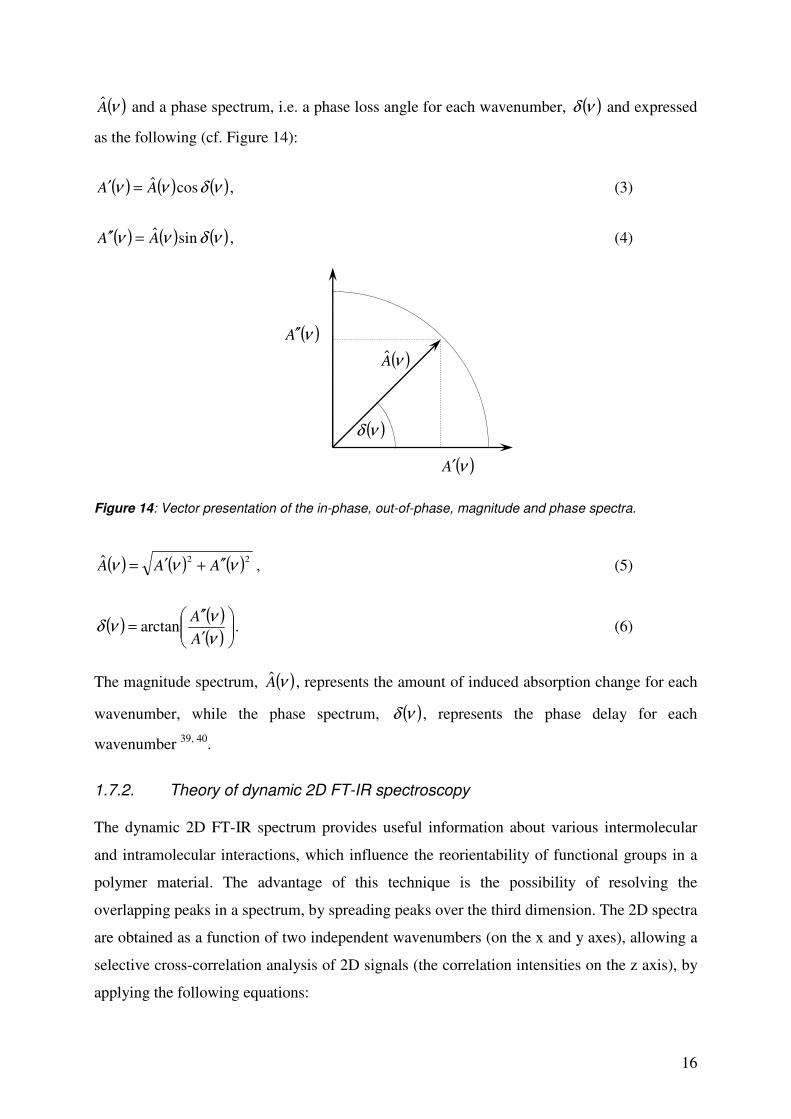
( )νA and a phase spectrum, i.e. a phase loss angle for each wavenumber, ( )νδ and expressed
as the following (cf. Figure 14):
( ) ( ) ( )νδνν cosAA =′ , (3)
( ) ( ) ( )νδνν sinAA =′′ , (4)
( )νA
( )νA ′′
( )νA′
( )νδ
Figure 14: Vector presentation of the in-phase, out-of-phase, magnitude and phase spectra.
( ) ( ) ( )22ˆ ννν AAA ′′+′= , (5)
( ) ( )( ) ���
����
�
′′′
=νννδ
AA
arctan . (6)
The magnitude spectrum, ( )νA , represents the amount of induced absorption change for each
wavenumber, while the phase spectrum, ( )νδ , represents the phase delay for each
wavenumber 39, 40.
1.7.2. Theory of dynamic 2D FT-IR spectroscopy
The dynamic 2D FT-IR spectrum provides useful information about various intermolecular
and intramolecular interactions, which influence the reorientability of functional groups in a
polymer material. The advantage of this technique is the possibility of resolving the
overlapping peaks in a spectrum, by spreading peaks over the third dimension. The 2D spectra
are obtained as a function of two independent wavenumbers (on the x and y axes), allowing a
selective cross-correlation analysis of 2D signals (the correlation intensities on the z axis), by
applying the following equations:
17
( ) ( ) ωνντ cos, 21Φ=Χ t ( ) ωνν sin, 21Ψ+ t, (7)
( ) ( ) ( ) ( ) ( )[ ]212121 21
, νννννν AAAA ′′′′+′′=Φ , (8)
( ) ( ) ( ) ( ) ( )[ ]212121 21
, νννννν AAAA ′′′−′′′=Ψ , (9)
where ( )τΧ is the dynamic IR cross-correlation function, τ is the correlation time, ω is the
frequency of the external sinusoidal perturbation, ( )21 ,ννΦ and ( )21 ,ννΨ are the
synchronous and asynchronous correlation intensities of the dynamic spectrum, respectively,
( )νA′ and ( )νA ′′ are the orthogonal components, in-phase and out-of-phase, of the dynamic
spectra, respectively, and 1ν and 2ν are two different wavenumbers 6, 37, 38, 41.
The synchronous correlation spectrum shows the correspondence for the changes in vibration
with the same phase (in-phase) and is symmetrical with respect to the diagonal line. The
peaks appearing on the diagonal line in a synchronous spectrum are called auto-peaks. They
are always positive. These auto-peaks indicate the transition dipoles, i.e. functional groups,
that have an orientational response to the perturbation. Off-diagonal peaks, called cross-peaks,
can be either positive or negative. Positive cross-peaks indicate that the changes in the two
wavenumbers are in-phase and that the two corresponding dipole moments are reoriented
parallel to each other. The negative cross-peaks indicate that the changes in the two
wavenumbers are 180° out-of-phase with each other and that the two corresponding dipole
moments reorient perpendicularly to each other. The cross-peaks in a synchronous spectrum
generally specify that interactions among different polymers occur in the composite material
Wavenumber, �1
Wav
enum
ber,
�2
Wavenumber, �1
Wav
enum
ber,
�2 Auto peak
Negative cross peak
Positive cross peak
Wavenumber, �1
Wav
enum
ber,
�2
Wavenumber, �1
Wav
enum
ber,
�2 Auto peak
Negative cross peak
Positive cross peak
Wavenumber, �1
Wav
enum
ber,
�2
Wavenumber, �1
Wav
enum
ber,
�2
Negative cross peak
Positive cross peak
(a) (b)
Figure 15: (a) Synchronous spectrum and (b) asynchronous spectrum of primary cell wall material, illustrating strong peaks.
18
(see Figure 15a above). The asynchronous correlation spectrum shows the correlation for
changes with a 90° phase difference (out-of-phase) and is asymmetric in respect to the
diagonal line. There are no auto-peaks and no cross-peaks that identify any elastic response of
the material. The cross-peaks in an asynchronous spectrum usually signify an absence of
strong chemical interactions (see Figure 15b above) 38.
19
2. ULTRASTRUCTURAL ASPECTS AND INTERACTIONS OF THE PRIMARY
CELL WALL – Papers I and II
The primary cell wall of wood fibre plays an important role for the fibre separation
mechanism in the TMP and CTMP pulping processes. The primary cell wall is the outermost
layer of a fibre and has a complex polymeric structure. Its constitutive components are:
cellulose, xyloglucan, pectin, protein and lignin. In order to examine the possibilities of
affecting this layer, the viscoelastic behaviour and interactions among its polymers have been
investigated using dynamic FT-IR spectroscopy in combination with dynamic 2D FT-IR
spectroscopy.
2.1. Load-bearing polymers in the primary cell wall
When exposing a polymeric material to an external sinusoidal strain and mid-IR radiation at
the same time, a dynamic spectral IR absorbance is achieved. The dynamic spectral response
comes from those components in the material that have been actively deformed as result of
the applied load. After studying this spectral absorbance, conclusions about the molecular
interactions can be made.
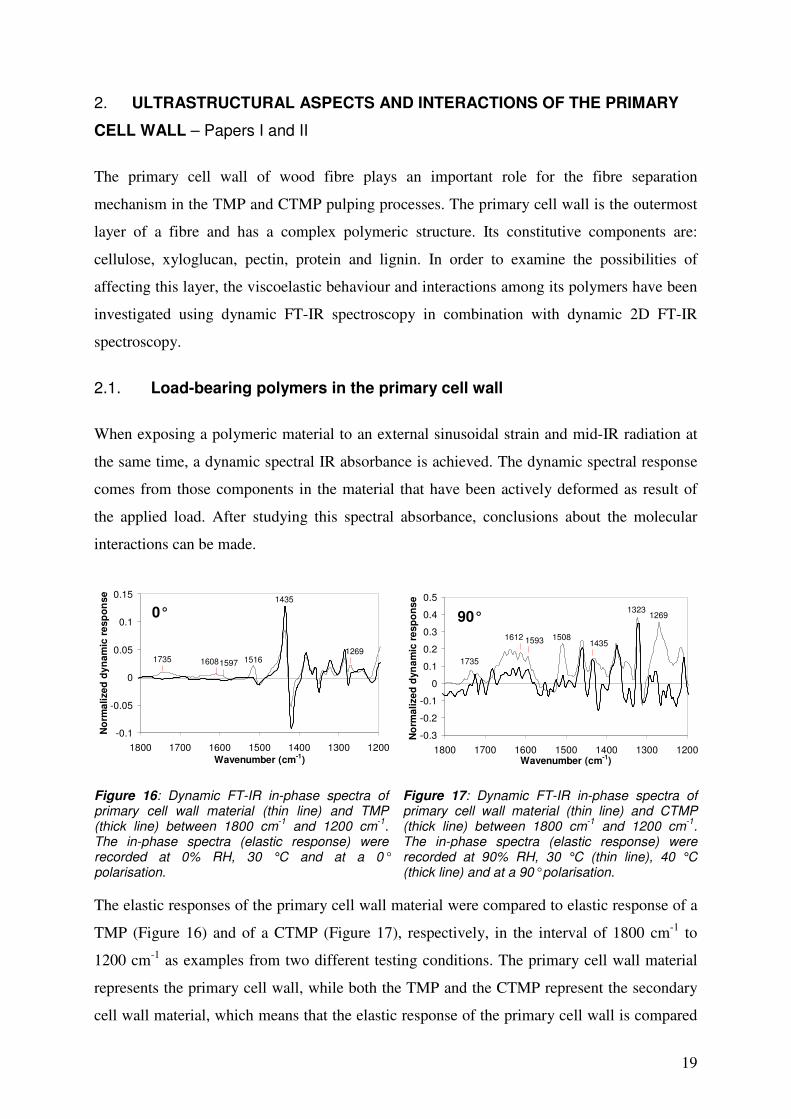
The elastic responses of the primary cell wall material were compared to elastic response of a
TMP (Figure 16) and of a CTMP (Figure 17), respectively, in the interval of 1800 cm-1 to
1200 cm-1 as examples from two different testing conditions. The primary cell wall material
represents the primary cell wall, while both the TMP and the CTMP represent the secondary
cell wall material, which means that the elastic response of the primary cell wall is compared
-0.1
-0.05
0
0.05
0.1
0.15
1200130014001500160017001800Wavenumber (cm-1)
No
rmal
ized
dyn
amic
res
pon
se
1735 15161269
15971608
0°1435
-0.3
-0.2
-0.1
0
0.1
0.2
0.3
0.4
0.5
1200130014001500160017001800Wavenumber (cm-1)
No
rmal
ized
dyn
amic
res
pons
e
1508
1269
1735
1612 1593
90°
1435
1323
Figure 16: Dynamic FT-IR in-phase spectra of primary cell wall material (thin line) and TMP (thick line) between 1800 cm-1 and 1200 cm-1. The in-phase spectra (elastic response) were recorded at 0% RH, 30 °C and at a 0° polarisation.
Figure 17: Dynamic FT-IR in-phase spectra of primary cell wall material (thin line) and CTMP (thick line) between 1800 cm-1 and 1200 cm-1. The in-phase spectra (elastic response) were recorded at 90% RH, 30 °C (thin line), 40 °C (thick line) and at a 90° polarisation.
20
with the elastic response of that of the secondary cell wall. The most intense signals at a 0°
polarisation were the cellulose C-O-H- bending signals, at 1435 cm-1, whereas, at a 90°
polarisation, the cellulose CH2-wagging at 1323 cm-1 was most dominant 42-44. Thus, the
cellulose was determined as the strongest load-bearing polymer in both the primary and
secondary cell walls. Lignin vibrations (the aromatic C-O-stretching vibrations of methoxyl
and phenyl propane units at 1269 cm-1 and the lignin C=C aromatic ring vibrations at 1516
cm-1) 45-51 occurred as significantly more intense in the primary cell wall as in the secondary
cell wall. This illustrates that the lignin from the primary cell wall takes a more active role in
load-bearing than the lignin in the secondary cell wall. Hemicellulose signals at 1735 cm-1 and
1597/1593 cm-1 (C=O stretching vibrations of the carboxylic acid) 52 also seemed to be more
intense for the primary cell wall than for the secondary cell wall. Some contribution to the
more intense signals, occurring in the wavenumber region of 1665 cm-1 to 1550 cm-1 for the
primary cell wall material, comes from protein vibrations (asymmetric stretching vibrations of
the COO--groups or asymmetric wagging of the NH3+-groups) 53 and pectin vibrations
(asymmetric stretching vibrations of the COO--groups from the D-galacturonic acid units) 53.
Peaks seen at 1608/1612 cm-1 may correspond to the vibrations of primary amines (the N-H
stretching vibrations) 54. In wavenumber range between 1650 cm-1 and 1590 cm-1 occur also
the deformation vibrations (scissoring) of the NH2-groups 54. Figures 16 and 17 illustrate that
the primary cell wall material showed a greater elastic response than the secondary cell wall
did, which indicates that there are more interactions among the polymers in the primary cell
wall than among those in the secondary cell wall. This can be due to the more organized
structure in the secondary cell wall, where cellulose dominates the load-bearing. The
measurements suggest that there is an intimately linked network structure among the
polymers in the primary cell wall.
2.2. Relative content of cellulose allomorphs
The crystalline cellulose I� vibration signals usually occur at 3240 cm-1 and 750 cm-1, while
the crystalline cellulose I� signals occur at 3270 cm-1 and 710 cm-1. It is obvious from Figures
18 and 19 that there were no strong signals coming from the cellulose allomorph I� in either
of the cell wall materials, whereas I� vibration signals occurred in the spectra of the primary
cell wall. Indeed, clear vibration signal of the cellulose I� allomorph was found at 3275 cm-1
and also an indication of vibration signal of the cellulose I� allomorph was found at 709 cm-1
in the primary cell wall material 52.
21
Further calculations, using the height of the cellulose I� peak, H710 43 (cf. Figure 20), indicated
that the relative content of cellulose I� was around 80% in the primary cell wall. The relative
content of the cellulose I� in the secondary cell wall was estimated to be approximately 40% 43. An NMR examination of the cellulose structure of the primary cell wall also showed
cellulose I� at 88 ppm, in the C4 region, as well as signals at 104 ppm and 106 ppm, while no
signals from the cellulose I�, that usually occur at 89.5 ppm, could be found (see Figure 21).
From the spectral fitting of the NMR spectra, the content of the crystalline cellulose in the
primary cell wall was determined to be 14%. By taking the sensitivity of the NMR technique
into consideration, the relative content of the cellulose I�, was estimated to be less than 20%.
-0.25
0
0.25
700720740760780800Wavenumber (cm-1)
Nor
mal
ized
dyn
amic
res
pons
e
RH 0%RH 40%RH 60%RH 80%RH 90%
0
200
400
600
8090100110120Chemical shift (ppm)
Inte
nsity
I�
I�
I�89.5
Figure 20: Dynamic FT-IR in-phase spectra of primary cell wall material normalised to 1.0 at 1435 cm-1 in the region from 800 cm-1 to 700 cm-1, at a 0° polarisation. Measurements were recorded at 0% RH (thin solid line), 40% RH (thin dotted line), 60% RH (thick dotted line), 80% RH (thick solid line) and 90% RH (thin solid line with black squares).
Figure 21: Solid state CP/MAS 13C-NMR spectrum of primary cell wall material, illustrating the region of 120 ppm to 80 ppm.
-0.5
0
0.5
1
31003200330034003500Wavenumber (cm-1)
No
rmal
ized
dyn
amic
res
pons
e 327590°
3240
-0.2
-0.1
0
0.1
7007508008509009501000Wavenumber (cm-1)
No
rmal
ized
dyn
amic
res
pon
se
7090°
750
Figure 18: Dynamic FT-IR in-phase spectra of primary cell wall material (thin line) and TMP (thick line) between 3500 cm-1 and 3100 cm-1. The in-phase spectra (elastic response) were recorded at 0% RH, 30 °C and at a 90° polarisation.
Figure 19: Dynamic FT-IR in-phase spectra of primary cell wall material (thin line) and TMP (thick line) between 1000 cm-1 and 700 cm-1. The in-phase spectra (elastic response) were recorded at 0% RH and 30 °C at a 0° polarisation.
22
Both the NMR and the dynamic FT-IR spectroscopy showed a very good correlation,
suggesting a relative high occurrence of cellulose I� in the primary cell wall, when compared
to what is observed in the secondary cell wall.
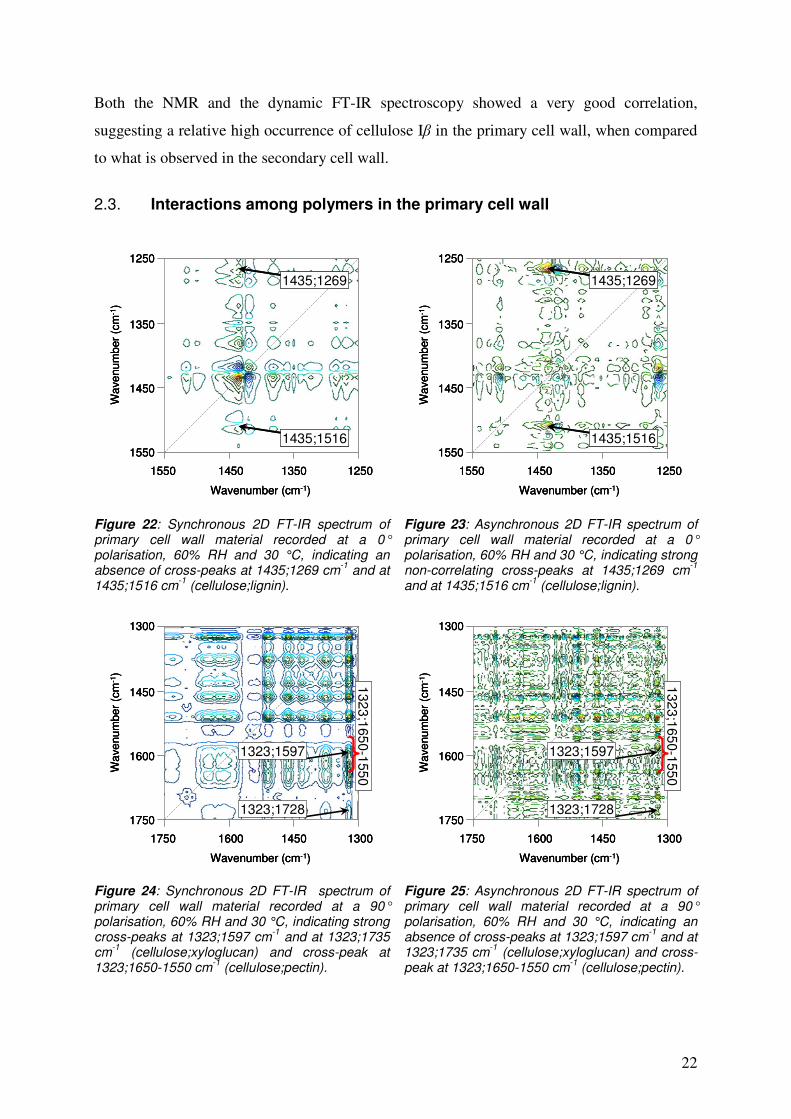
2.3. Interactions among polymers in the primary cell wall
1550 1450 1350 1250
Wavenumber (cm-1)
Wav
enum
ber (
cm-1
)
1250
1350
1450
1550
1435;1269
1435;1516
1550 1450 1350 1250
Wavenumber (cm-1)
Wav
enum
ber (
cm-1
)
1250
1350
1450
1550
1550 1450 1350 1250
Wavenumber (cm-1)
Wav
enum
ber (
cm-1
)
1250
1350
1450
1550
1435;1269
1435;1516
1435;1269
1435;1516
1550 1450 1350 1250
Wavenumber (cm-1)
Wav
enum
ber (
cm-1
)
1250
1350
1450
1550
1435;1269
1435;1516
1550 1450 1350 1250
Wavenumber (cm-1)
Wav
enum
ber (
cm-1
)
1250
1350
1450
1550
1550 1450 1350 1250
Wavenumber (cm-1)
Wav
enum
ber (
cm-1
)
1250
1350
1450
1550
1435;1269
1435;1516
1435;1269
1435;1516
Figure 22: Synchronous 2D FT-IR spectrum of primary cell wall material recorded at a 0° polarisation, 60% RH and 30 °C, indicating an absence of cross-peaks at 1435;1269 cm-1 and at 1435;1516 cm-1 (cellulose;lignin).
Figure 23: Asynchronous 2D FT-IR spectrum of primary cell wall material recorded at a 0° polarisation, 60% RH and 30 °C, indicating strong non-correlating cross-peaks at 1435;1269 cm-1 and at 1435;1516 cm-1 (cellulose;lignin).
1750 1600 1450 1300
Wavenumber (cm-1)
Wav
enum
ber (
cm-1
)
1300
1450
1600
1750
1323;1597
1323;1728
1323;1650-1550
1750 1600 1450 1300
Wavenumber (cm-1)
Wav
enum
ber (
cm-1
)
1300
1450
1600
1750
1750 1600 1450 1300
Wavenumber (cm-1)
Wav
enum
ber (
cm-1
)
1300
1450
1600
1750
1323;1597
1323;1728
1323;1650-1550
1750 1600 1450 1300
Wavenumber (cm-1)
Wav
enum
ber (
cm-1
)
1300
1450
1600
1750
1323;1597
1323;1728
1323;1650-1550
1750 1600 1450 1300
Wavenumber (cm-1)
Wav
enum
ber (
cm-1
)
1300
1450
1600
1750
1750 1600 1450 1300
Wavenumber (cm-1)
Wav
enum
ber (
cm-1
)
1300
1450
1600
1750
1323;1597
1323;1728
1323;1650-1550
Figure 24: Synchronous 2D FT-IR spectrum of primary cell wall material recorded at a 90° polarisation, 60% RH and 30 °C, indicating strong cross-peaks at 1323;1597 cm-1 and at 1323;1735 cm-1 (cellulose;xyloglucan) and cross-peak at 1323;1650-1550 cm-1 (cellulose;pectin).
Figure 25: Asynchronous 2D FT-IR spectrum of primary cell wall material recorded at a 90° polarisation, 60% RH and 30 °C, indicating an absence of cross-peaks at 1323;1597 cm-1 and at 1323;1735 cm-1 (cellulose;xyloglucan) and cross-peak at 1323;1650-1550 cm-1 (cellulose;pectin).
23
Dynamic 2D spectroscopy is a technique for making evaluations, especially applicable to the
study of molecular interactions. It is based on cross-correlating analysis, which helps to
resolve the overlapping vibration bands and, therefore, providing a better understanding of the
molecular cooperation between a pair of polymers.
The 2D spectra for the primary cell wall material, recorded at a 0° polarisation, showed an
absence of the cellulose;lignin cross-correlation signals (1435;1269 cm-1 and 1435;1516 cm-1)
in the synchronous spectrum (Figure 22), but a presence of these peaks in the asynchronous
spectrum (Figure 25). This suggests that cellulose and lignin do not interact when the
mechanical load transfer takes place in the primary cell wall. On the other hand, in the cross-
correlating spectra collected at a 90° polarisation, an appearance of cellulose;xyloglucan
cross-peaks at 1323;1597 cm-1 and 1323;1735 cm-1 were observed in the synchronous
spectrum, while corresponding signals were absent in the asynchronous spectrum. The
cellulose;pectin signals at 1323;1650-1550 cm-1 displayed an analogous pattern. Furthermore,
a cross-peak of lignin; protein at 1508;1612 cm-1 could be found in the synchronous spectrum,
but not in the asynchronous spectrum. This cross-peak is dealt with more in detail in Section
3. These cross-correlation signals suggest that there are strong interactions between cellulose
and xyloglucan, between cellulose and pectin as well as between lignin and protein in the
primary cell wall.
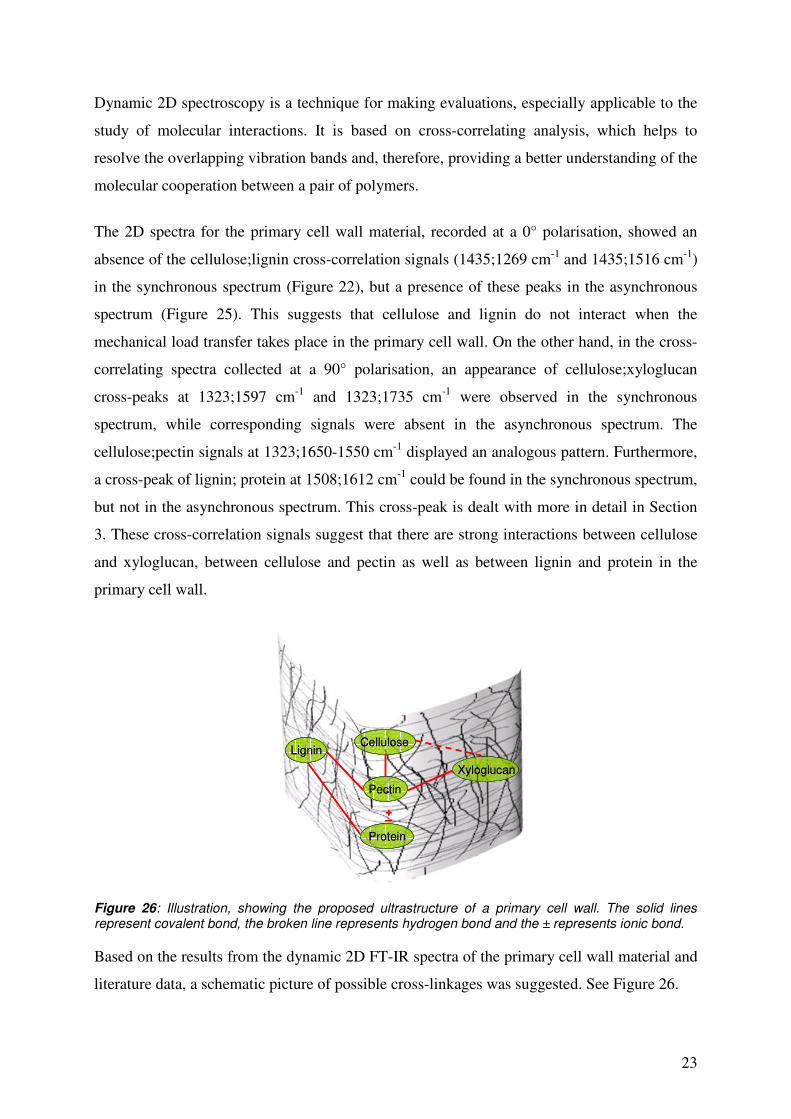
Based on the results from the dynamic 2D FT-IR spectra of the primary cell wall material and
literature data, a schematic picture of possible cross-linkages was suggested. See Figure 26.
+–
Pectin
Lignin
Xyloglucan
Protein
Cellulose
+–+–
Pectin
Lignin
Xyloglucan
Protein
Cellulose
Pectin
Lignin
Xyloglucan
Protein
Cellulose
Figure 26: Illustration, showing the proposed ultrastructure of a primary cell wall. The solid lines represent covalent bond, the broken line represents hydrogen bond and the ± represents ionic bond.
24
3. EFFECT OF LOW DEGREE OF SULPHONATION ON THE MOLECULAR
INTERACTION IN THE PRIMARY CELL WALL – Paper III
At low levels of sulphonation (0.11% Na2SO3) of wood, the primary cell wall is selectively
affected 2. This results in a more energy efficient mechanical pulping process 4, 5. The
reduction in electrical energy consumption for refining of chips with a low degree of
sulphonation amounts to approximately 200 kWh/t, when compared to TMP refining at the
same tensile index. At high levels of sulphonation (1% to 3% Na2SO3), the secondary cell
wall is affected and the refining process requires even more energy than in conventional TMP.
The low sulphonation process has, however, been shown to be extremely difficult to control.
This is the reason why a better understanding of the mechanism may be a way of improving
its applicability. Consequently, a low sulphonation reaction was carried out on spruce wood
chips during an impregnation pretreatment. The chips were first impregnated in water,
according to the steam/cold liquor method, in order to ensure a uniform impregnation of the
Na2SO3. The pulp, produced from these impregnated chips, displayed mechanical and optical
properties similar to a TMP type of pulp, with an anticipated lower consumption of energy.
Primary cell wall material was prepared from a first stage pulp obtained during these trials.
The ultrastructural changes due to the low sulphonation reaction were examined using both
dynamic FT-IR spectroscopy and dynamic 2D FT-IR spectroscopy.
3.1. Load-bearing polymers in the sulphonated primary cell wall
The dynamic in-phase FT-IR spectra of the unsulphonated primary cell wall material and the
sulphonated primary cell wall material are compared in Figure 27. The two materials had
quite a similar elastic response. The same polymers appear as load-bearing in both the
unsulphonated and sulphonated primary cell wall materials. This illustrates that the
ultrastructure of the sulphonated primary cell wall remained more or less unchanged from the
native cell wall. However, some differences were observed for the pectin vibrations, at 1643
cm-1 (asymmetric stretching vibrations of the COO--groups from the D-galacturonic acid
units) 53, and for the protein vibrations, at 1612 cm-1 (N-H stretching vibrations of the primary
amines) 53, 54. The xyloglucan absorption peak at 1597 cm-1 was observed for the
unsulphonated primary cell-wall material, but this was not at all obvious in the sulphonated
primary cell-wall material. The most significant difference between the two materials was that
the lignin peak, occurring at 1276 cm-1 (Caryl-O vibrations) 45, 48, 55, seemed to have
25
disappeared in the spectra of the sulphonated material, indicating a change in lignin structure,
due to sulphonation.
-0.2
0
0.2
0.4
1200130014001500160017001800Wavenumber (cm-1)
Nor
mal
ized
dyn
amic
res
pons
e
1276
1643
161290°1597
Figure 27: Dynamic in-phase FT-IR spectra of sulphonated primary cell wall material (thin line) and unsulphonated primary cell wall material (thick line), recorded at a 90° polarisation, 60% RH and 30 °C.
3.2. Interactions among polymers in the sulphonated primary cell wall
To obtain more information on any changes in the interactions between lignin;pectin, between
lignin;protein as well as between protein;pectin, 2D correlation analyses were done. The
synchronous and asynchronous 2D FT-IR correlation spectra of the unsulphonated primary
cell wall material, recorded at 60% RH in a 90° polarisation mode, are shown in Figures 28
and 29. The correlation spectra of the sulphonated primary cell wall material are illustrated in
Figures 30 and 31. As discussed above (see Figures 24 and 25 in Section 2), the spectra of the
unsulphonated primary cell wall shows cross-correlations between cellulose;xyloglucan and
cellulose;pectin.
In the synchronous spectra of the unsulphonated material, lignin indicated cross-peaks with
both pectin and protein, at 1508;1643 cm-1 and 1508:1612 cm-1, respectively (Figure 28). The
analogous signals were absent in the asynchronous spectra (Figure 29). This indicated that
lignin interacts with both pectin and protein in the unsulphonated material. The cross-peak at
1612;1643 cm-1 (protein;pectin) was found in the synchronous spectra of the unsulphonated
material (Figure 28), while the corresponding asynchronous cross-peak appeared as very
weak (Figure 29), indicating that protein and pectin also interact in the primary cell wall. For
the sulphonated material, the lignin;pectin and lignin; protein cross-peaks were observed in
the synchronous spectra (Figure 30), while the corresponding cross-peaks in the asynchronous
spectra appeared as very strong (Figure 31). This means that the interactions of lignin with
pectin and protein were significantly weakened in the material after the low sulphonation
pretreatment. The absence of the protein;pectin (1612;1643 cm-1) cross-peak in the
26
synchronous spectra and the presence of peaks in the asynchronous spectra, point to a
destabilized association between protein and pectin after the sulphonation reaction.
These results indicate that the sulphonation has primarily altered the interactions of lignin
with other components in the primary cell wall. Based on the viscoelastic measurements at
1650 1600 1550 1500
Wavenumber (cm-1)
Wav
enum
ber (
cm-1
)
1500
1550
1600
1650
1508;16431612;1643
1508;1612
1650 1600 1550 1500
Wavenumber (cm-1)
Wav
enum
ber (
cm-1
)
1500
1550
1600
1650
1650 1600 1550 1500
Wavenumber (cm-1)
Wav
enum
ber (
cm-1
)
1500
1550
1600
1650
1650 1600 1550 1500
Wavenumber (cm-1)
Wav
enum
ber (
cm-1
)
1500
1550
1600
1650
1508;16431612;1643
1508;1612
1508;16431612;1643
1508;1612
1650 1600 1550 1500
Wavenumber (cm-1)W
aven
umbe
r (cm
-1)
1500
1550
1600
1650
1508;16431612;1643
1508;1612
1650 1600 1550 1500
Wavenumber (cm-1)W
aven
umbe
r (cm
-1)
1500
1550
1600
1650
1650 1600 1550 1500
Wavenumber (cm-1)W
aven
umbe
r (cm
-1)
1500
1550
1600
1650
1650 1600 1550 1500
Wavenumber (cm-1)W
aven
umbe
r (cm
-1)
1500
1550
1600
1650
1508;16431612;1643
1508;1612
1508;16431612;1643
1508;1612
Figure 28: Synchronous 2D FT-IR spectrum of unsulphonated primary cell wall material, recorded at a 90° polarisation, 60% RH and 30 °C, indicating a strong cross-peak at 1508;1643 cm-1 (lignin;pectin), a strong cross-peak at 1508;1612 cm-1 (lignin;protein) and a strong cross-peak at 1612;1643 cm-1 (protein;pectin).
Figure 29: Asynchronous 2D FT-IR spectrum of unsulphonated primary cell wall material, recorded at a 90° polarisation, 60% RH and 30 °C, indicating a weak cross-peak at 1508;1643 cm-1 (lignin;pectin), a weak cross-peak at 1508;1612 cm-1 (lignin;protein) and a weak cross-peak at 1612;1643 cm-1 (protein;pectin).
1650 1600 1550 1500
Wavenumber (cm-1)
Wav
enum
ber (
cm-1
)
1500
1550
1600
1650
1508;16431612;1643
1508;1612
1650 1600 1550 1500
Wavenumber (cm-1)
Wav
enum
ber (
cm-1
)
1500
1550
1600
1650
1650 1600 1550 1500
Wavenumber (cm-1)
Wav
enum
ber (
cm-1
)
1500
1550
1600
1650
1650 1600 1550 1500
Wavenumber (cm-1)
Wav
enum
ber (
cm-1
)
1500
1550
1600
1650
1508;16431612;1643
1508;1612
1508;16431612;1643
1508;1612
1650 1600 1550 1500
Wavenumber (cm-1)
Wav
enum
ber (
cm-1
)
1500
1550
1600
1650
1508;16431612;1643
1508;1612
1650 1600 1550 1500
Wavenumber (cm-1)
Wav
enum
ber (
cm-1
)
1500
1550
1600
1650
1650 1600 1550 1500
Wavenumber (cm-1)
Wav
enum
ber (
cm-1
)
1500
1550
1600
1650
1650 1600 1550 1500
Wavenumber (cm-1)
Wav
enum
ber (
cm-1
)
1500
1550
1600
1650
1508;16431612;1643
1508;1612
1508;16431612;1643
1508;1612
Figure 30: Synchronous 2D FT-IR spectrum of sulphonated primary cell wall material, recorded at a 90° polarisation, 60% RH and 30 °C, indicating a strong cross-peak at 1508;1643 cm-1 (lignin;pectin), a strong cross-peak at 1508;1612 cm-1 (lignin;protein) and a weak cross-peak at 1612;1643 cm-1 (protein;pectin).
Figure 31: Asynchronous 2D FT-IR spectrum of sulphonated primary cell wall material, recorded at a 90° polarisation, 60% RH and 30 °C, indicating a strong cross-peak at 1508;1643 cm-1 (lignin;pectin), a strong cross-peak at 1508;1612 cm-1 (lignin;protein) and a strong cross-peak at 1612;1643 cm-1 (protein;pectin).
27
different relative humidities, it was established that an increased softening of the primary cell
wall occurs as a result of the sulphonation. It was suggested that this increased viscoelasticity,
due to the breakdown of bonds between lignin;pectin and lignin;protein, could be recognised
as the main reason for the lower consumption of energy achieved during the refining of such
pulps, when compared to unsulphonated TMP.
28
4. CONCLUSIONS AND FUTURE WORK
These studies using dynamic FT-IR spectroscopy on primary cell wall material, demonstrated
that the cellulose, among all the other components in the primary cell wall material, was the
one polymer that took the most part in the load-bearing. However, the lignin in the primary
cell wall material showed a much greater ability for taking part in the load-bearing than the
lignin in the secondary cell wall did. To a certain extent, all the polymers in the primary cell
wall took part in the stress transfer. Dynamic FT-IR spectroscopy also demonstrated that the
dominating crystalline cellulose in the primary cell wall was that of the cellulose I�
allomorph. This indicated that these cellulose microfibrils are formed in a more stress-free
environment than those in the S2 cell wall.
Based on dynamic 2D correlation FT-IR spectra, it was established that strong interactions
exist among cellulose, xyloglucan and pectin as well as among lignin protein and pectin in the
primary cell wall. This suggested the presence of a highly interconnected structure and the
probable existence of an interpenetrating network structure in the primary cell-wall of the
spruce wood fibre.
When it came to wood with a low degree of sulphonation, it was found that fractures could be
found in the range between the primary cell wall and the middle lamella of spruce chips. This
could be explained by the development of a more unstable ultrastructure in the outer fibre
wall. The dynamic FT-IR measurements suggested that the sulphonation reaction caused the
cooperation to become weaker, i.e. between the lignin;pectin and the lignin;protein as well as
between the pectin;protein. This resulted in an increased softening of the primary cell wall
material, which could be the primary reason behind the energy efficiency of this refining
process.
The general conclusion proposed in this work is that there is a good possibility of reducing the
energy demand when refining spruce wood chips, by utilising treatments that would give a
similar softening of the primary cell wall, such as a low degree of sulphonation pretreatment.
Such energy savings may be achieved by applying other chemical and/or enzymatic
treatments that show selective affinities to the components in the primary cell wall. Screening
of such specific reactions using dynamic FT-IR spectroscopy could improve our knowledge
about the ultrastructure of the primary cell wall as well as being an aid in designing an energy
efficient mechanical pulping process.
29
5. ACKNOWLEDGEMENTS
This work was partly carried out within the framework of the Wood Ultrastructure Research
Center (WURC) in Uppsala, Sweden, financed by VINNOVA, the Nordic pulp and paper
industry and SLU. The study, itself, was carried out at STFI-Packforsk. I wish to express my
sincere gratitude to all of these.
I would especially like to thank my supervisor, Associate Professor Lennart Salmén, for his
support, guidance and genuine engagement during this work.
I would like to express my gratitude to Dr. Margaretha Åkerholm for her invaluable advice
concerning dynamic FTIR spectroscopy. I am indebted to Ms. Joanna Hornatowska for kindly
working on the light microscopy images. I would sincerely like to acknowledge Dr. Tomas
Larsson is for carrying out the NMR measurements and for our fruitful discussions.
I would also like to thank all my colleagues at STFI-Packforsk for their kindness and all their
help. I would like to make special mention of Ms. Anne-Mari Olsson for her help and endless
patience.
Finally, I would like to express my gratitude to my family for all the love, understanding and
support they have given me during this time.
30
6. REFERENCES
1 L. Salmén and B. Petterson, Cellulose Chemistry and Technology, 1995, 29, 331-337. 2 U. Westermark, B. Samuelsson, R. Simonson, and R. Pihl, Nordic Pulp & Paper
Research Journal, 1987, 2, 146-151. 3 F. Peng, R. Ferritsius, and U. Ängsås, 2003 International Mechanical Pulping
Conference, Cape Town, 2003, p. 335-340. 4 P. Axelson and R. Simonson, Svensk Papperstidning, 1982, 85, R132-139. 5 P. Axelson and R. Simonson, Svensk Papperstidning, 1983, 86, R149-R151. 6 I. Noda, Analytical Chemistry, 1994, 66, 1065-1075. 7 L. Salmén, M. Lucander, E. Härkönen, and J. Sundholm, in 'Fundamentals of
mechanical pulping', ed. J. Sundholm, Fapet Oy, Helsinki, Finland, 1999, 34-65. 8 D. Fengel and G. Wegener, 'Wood: Chemistry, Ultrastructure, Reactions', Walter de
Gruyter, Berlin, New York, 1984, 613. 9 J. Brändström, 'Morphology of Norway Spruce Tracheids with Emphasis on Cell Wall
Organisation', Ph.D. Thesis, Swedish University of Agricultural Science, Uppsala,
2002. 10 H. A. Core, W. A. Côté, and A. C. Day, 'Wood Structure and Identification', Syracuse
University Press, New York, 1979, 32. 11 E. Sjöström, 'Wood chemistry. Fundamentals and applications', Academic Press Inc.,
Orlando, 1981, 223. 12 H. Harrak, H. Chamberland, and M. Plante, Plant and Cell Physiology, 1999, 121,
557-564. 13 A. Bacic, P. J. Harris, and B. A. Stone, in 'Structure and Function of Plant Cell Walls',
ed. J. Preiss, Academic Press, New York, 1988, 297-371. 14 S. E. C. Whitney and M. J. Gidley, Plant Physiology, 1999, 121, 657-663. 15 T. Ishii and K. Shimizu, in 'Chemistry of Cell Wall Polysaccharides', ed. N. S. David
N.-S. Hon, Marcel Dekker, Inc., Basel, 2001, 175-212. 16 M. Lawoko, G. Henriksson, and G. Gellerstadt, Holzforschung, 2006, 60, pp. 156-161. 17 L. Christiane, 'Structures of hemicelluloses and pectins in wood and pulp', Ph.D.
Thesis, Helsinki University of Technology, Helsinki, 2005. 18 R. H. Atalla and D.L.VanderHart, Science, 1984, 223, 283-285. 19 E. M. Debzi, H. Chanzy, J. Sugiyama, P. Tekely, and G. Excoffier, Macromolecules,
1991, 24, 6816-6822.
31
20 A. C. O´Sullivan, Cellulose, 1997, 4, 173-207. 21 R. J. Thomas, in 'Wood: Formation and Morphology', ed. M. Lewin and I. S.
Goldstein, International Fibre Science and Technology, New York, 1991, 7-46. 22 Y. Kataoka and T. Kondo, Macromolecules, 1998, 31, 760-764. 23 A. J. Kerr and D. A. I. Goring, Cellulose Chemistry and Technology, 1975, 9, 563-
573. 24 F. F. P. Kollmann and J. Wilfred A. Côté, 'Principles of Wood Science and
Technology I', ed. F. F. P. Kollmann and J. Wilfred A. Côté, Springer-Verlag New
York Inc., New York, 1968, 1-54. 25 N. Terashima, J. Hafrén, U. Westermark, Y. Xie, K. Fukushima, C. Lapierre, and D.
Vanderhart, 10th International Symposium on Wood and Pulping Chemistry,
Yokohama, 1999, p. 106-109. 26 J. Hafrén, 'Ultrastructure of the wood cell wall', Ph.D. Thesis, KTH, Stockholm, 1999. 27 Y. Edashige, T. Ishii, T. Hiroi, and T. Fujii, Holzforschung, 1995, 49, 197-202. 28 M. O'Neill, P. Albersheim, and A. Darvill, Methods in Plant Biochemistry, 1990, 2,
415-441. 29 J.-P. Vincken, Plant and Cell Physiology, 2003, 132, 1781-1789. 30 J. Hafrén and U. Westermark, Nordic Pulp & Paper Research Journal, 2001, 16, 284-
290. 31 J. Hafrén, G. Daniel, and U. Westermark, IAWA, 2000, 21, 157-168. 32 X. Qi, B. X. Behrens, P. R. West, and A. J. Mort, Plant Physiology, 1995, 108, 1691-
1701. 33 I. Noda, A. E. Dowrey, and C. Marcott, in 'Characterization of polymers using
polarization-modulation infrared techniques: dynamic infrared linear dichroism
(DIRLD) spectroscopy', ed. H. Ishida, Plenum, New York, 1987, 33-59. 34 I. Noda, A. E. Dowrey, and C. Marcott, Journal of Polymer Science: Polymer Letters
Edition, 1983, 21, 99-103. 35 I. Noda, A. E. Dowrey, and C. Marcott, Applied Spectroscopy, 1988, 42, 203-216. 36 I. Noda, A. E. Dowrey, and C. Marcott, in 'Two-Dimensional Infrared (2D IR)
Spectroscopy', ed. G. Zerbi, Wiley-VCH, Weinheim, 1999, 1-32. 37 I. Noda, Journal of American Chemical Society, 1989, 111, 8116-8118. 38 I. Noda, Applied Spectroscopy, 1990, 44, 550-561. 39 B. O. Budevska, C. J. Manning, and P. R. Griffith, Applied Spectroscopy, 1994, 48,
1556-1559.
32
40 B. O. Budevska, C. J. Manning, P. R. Griffiths, and R. T. Roginski, Applied
Spectroscopy, 1993, 47, 1843-1851. 41 I. Noda, Applied Spectroscopy, 1993, 47, 1329-1336. 42 B. Hinterstoisser, M. Åkerholm, and L. Salmén, Carbohydrate Research, 2001, 334,
27-37. 43 M. Åkerholm, B. Hinterstoisser, and L. Salmén, Carbohydrate Research, 2004, 339,
569-578. 44 K. Almgren, 'Stress-Transfer Mechanisms in Wood-Fibre Composites', Lic. Thesis,
KTH, Stockholm, 2007. 45 M. Åkerholm and L. Salmén, Holzforschung, 2003, 57, 459-465. 46 M. Åkerholm and L. Salmén, Seventh European Workshop on Lignocellulosics and
Pulp, Åbo, 2002, p. 27-30. 47 W. Collier, V. F. Kalasinsky, and T. P. Schulz, Holzforschung, 1997, 51, 167-168. 48 W. E. Collier, T. P. Schultz, and V. F. Kalasinsky, Holzforschung, 1992, 46, 523-528. 49 O. Faix, Holzforschung, 1991, 45, 21-27. 50 U. P. Agarwal and S. A. Ralph, Applied Spectroscopy, 1997, 51, 1648-1655. 51 U. P. Agarwal, S. A. Ralph, and R. H. Atalla, 9th International symposium on wood
and pulping chemistry (ISWPC), Montreal, 1997, p. 8-1-8-4. 52 M. Åkerholm, 'Ultrastructural aspects of pulp fibers as studied by dynamic FT-IR
spectroscopy', Ph.D. Thesis, KTH, Stockholm, 2003. 53 L. Chen, H. Wilson, and M. C. McCANN, Journal of Microscopy, 1997, 188, 62-71. 54 H. Günzeler and H.-U. Gremlich, 'IR Spectroscopy', WILEY-VCH Verlag GmhH,
Weinheim, 2002, 171-278. 55 O. Faix, Holzforschung, 1986, 40, 273-280.