29
EXPANDING ONE OF CANADA’S HIGHEST GRADE COPPER MINES MINING MILLING MARKETS JULY 2016
EXPANDING ONE OF CANADA’S HIGHEST GRADE COPPER MINES
MINING MILLING MARKETS
JULY 2016

FORWARD LOOKING STATEMENTS
Caution Regarding Forward Looking Statements: Certain information included in this presentation, including information relating to future financial or operating performance and other statements that express the expectations of management or estimates of future performance constitute “forward-looking statements”. Such forward-looking statements include, without limitation, statements regarding copper, gold and silver forecasts for fiscal 2016 (including the information provided in any tables relating to production and concentrate forecasts for fiscal 2016), the financial strength of the Company, estimates regarding timing of future development and production and statements concerning possible expansion opportunities for the Company. Where the Company expresses or implies an expectation or belief as to future events or results, such expectation or belief are based on assumptions made in good faith and believed to have a reasonable basis. Such assumptions include, without limitation, the price of and anticipated costs of recovery of, copper concentrate, gold and silver, the presence of and continuity of such minerals at modeled grades and values, the capacities of various machinery and equipment, the availability of personnel, machinery and equipment at estimated prices, mineral recovery rates, and others. However, forward-looking statements are subject to risks, uncertainties and other factors, which could cause actual results to differ materially from future results expressed, projected or implied by such forward-looking statements. Such risks include, but are not limited to, interpretation and implications of drilling and geophysical results; estimates regarding timing of future capital expenditures and costs towards profitable commercial operations. Other factors that could cause actual results, developments or events to differ materially from those anticipated include, among others, increases/decreases in production; volatility in metals prices and demand; currency fluctuations; cash operating margins; cash operating cost per pound sold; costs per ton of ore; variances in ore grade or recovery rates from those assumed in mining plans; reserves and/or resources; the ability to successfully integrate acquired assets; operational risks inherent in mining or development activities and legislative factors relating to prices, taxes, royalties, land use, title and permits, importing and exporting of minerals and environmental protection. Accordingly, undue reliance should not be placed on forward-looking statements and the forward-looking statements contained in this press release are expressly qualified in their entirety by this cautionary statement. The forward-looking statements contained herein are made as at the date hereof and the Company does not undertake any obligation to update publicly or revise any such forward-looking statements or any forward-looking statements contained in any other documents whether as a result of new information, future events or otherwise, except as required under applicable law. RMM’s qualified person, Mr. Larry Pilgrim, P. Geo., is responsible for verification and quality assurance of the exploration data and the analytical results set forth in this presentation. RMM is in full compliance with all NI43-101 rules and regulations.
2

ABOUT RAMBLER
3
Copper-Gold Producer in Newfoundland Operating the 100% owned Ming Mine, Nugget Pond Mill & Transshipment facility Canada - Stable & low risk mining jurisdiction. Ranked in the top quartile on the Fraser
Institute scale
Funded for Significant Expansion Growing from Phase 1 (650 mtpd) to Phase II (1,250 mtpd) by end of fiscal 2017 Expanding underground output & mill throughput Targeting to increase saleable copper output from 13M pounds to 16M pounds over the
next 2 years Leveraged with 6,000 ounces of annual gold production with massive sulphide production (~10 years)
*Note: Fiscal Year-End of 31 July
Further Potential Further increase in throughput to Phase III (2,000 mtpd)
at the mine pending detailed engineering on ore pre-concentration (DMS) and shaft rehabilitation; targeting saleable annual copper output >25M pounds
Continue engineering studies aimed at boosting gold recoveries
SHARE STRUCTURE
4
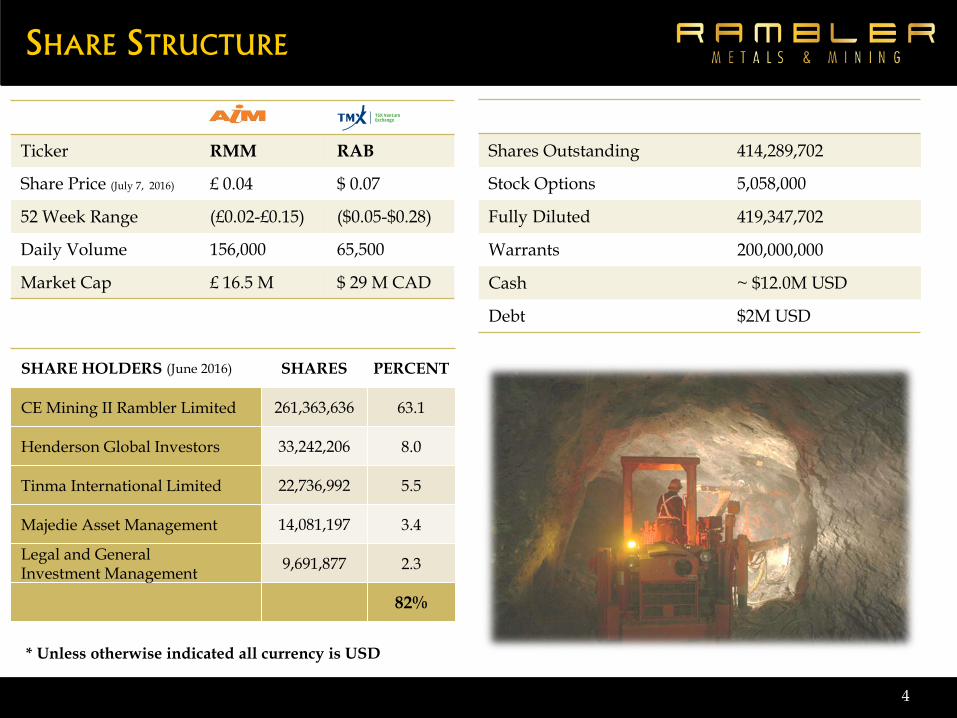
Ticker RMM RAB
Share Price (July 7, 2016) £ 0.04 $ 0.07
52 Week Range (£0.02-£0.15) ($0.05-$0.28)
Daily Volume 156,000 65,500
Market Cap £ 16.5 M $ 29 M CAD
SHARE HOLDERS (June 2016) SHARES PERCENT
CE Mining II Rambler Limited 261,363,636 63.1
Henderson Global Investors 33,242,206 8.0
Tinma International Limited 22,736,992 5.5
Majedie Asset Management 14,081,197 3.4
Legal and General Investment Management 9,691,877 2.3
82%
Shares Outstanding 414,289,702
Stock Options 5,058,000
Fully Diluted 419,347,702
Warrants 200,000,000
Cash ~ $12.0M USD
Debt $2M USD
* Unless otherwise indicated all currency is USD

MANAGEMENT & BOARD OF DIRECTORS
5
Norman Williams, CA – President and CEO Chartered Accountant with 20 years of financial and management experience. CFO of Rambler from 2010 to 2014.
Tim Slater, ACA, CTA – Interim CFO Managing Director of Harmer Slater Chartered Accountants in the United Kingdom. Has worked with Rambler since 2006.
Peter Mercer – Vice President, Corp. Secretary Geologist with over 15 years of exploration and development experience. Responsible for strategic growth in addition to managing the investor relations and corporate secretary aspects of the business.
Tim Sanford, P. Eng. – VP Technical Services Professional Engineer with 23 years of experience at various supervisory levels , primarily related to underground development and production.
Bob McGuire, P. Eng. – General Manager Professional Engineer with over 35 years experience in underground mining, with a diverse background in supervisory and managerial positions in Canada and internationally.
Norman Williams– Director Bradford Mills – Non-Executive Director, Chairman 30+ years in the resource industry. Founder and managing director of Plinian. Currently Executive Chairman at Mandalay Resources.
Glenn Poulter – Non-Exec., Independent Lead Director Executive MBA, Cass Business School, specializing in finance and strategy. Glenn has over 30 years of experience with financial services in the City of London.
Mark Sander – Non-Executive Director PhD in Ore Deposits and Exploration and active in the mineral resource industry for over 25 years. Currently President and CEO at Mandalay Resources.
Belinda Labatte– Non-Executive Director MBA from Rotman School of Management and CFA charterholder. Currently Head of Stakeholder Engagement and Corporate Affairs at Mandalay Resources.
Terrell Ackerman– Non-Executive Director 40+ years in the recourse industry. Was interim CEO at Stillwater Mining until 2013, having joined in March 2000 as Director of Corporate Planning.
Eason Chen – Non-Executive Director Has extensive knowledge and experience in Canadian and cross-border listings, corporate governance and internal controls.
MANAGEMENT BOARD OF DIRECTORS

SAFETY & HEALTH
6
• 1 lost time accident since beginning of construction
• 1,736 Days Since Last Lost Time Accident (540 Days since last medical aid)
• Fiscal 2016 TIFR Target < 3 • Over 1,930,446 person hours worked
Winner of the 2016 John T Ryan Safety Award from the Canadian Institute of
Mining, Metallurgy and Petroleum ('CIM')
• No reportable exceedances or environmental incidents in last 3 fiscal years
• Strong commitment to safety and environment • Committed to community engagement with a
focus on regional benefits
ENVIRONMENT & COMMUNITY
SAFETY, HEALTH, ENVIRONMENT & COMMUNITY
4
6
2 1
2
4.3
6.4
1.14 0.57 1.26
0 01234567
0
5
10
15
2011 2012 2013 2014 2015 2016
Freq
uenc
y Ra
te
Num
ber
Fiscal Year
Fatalities Lost Times Medical Aids Total Injury Freq. Rate
Construction
Production
CURRENT OPERATIONS
7
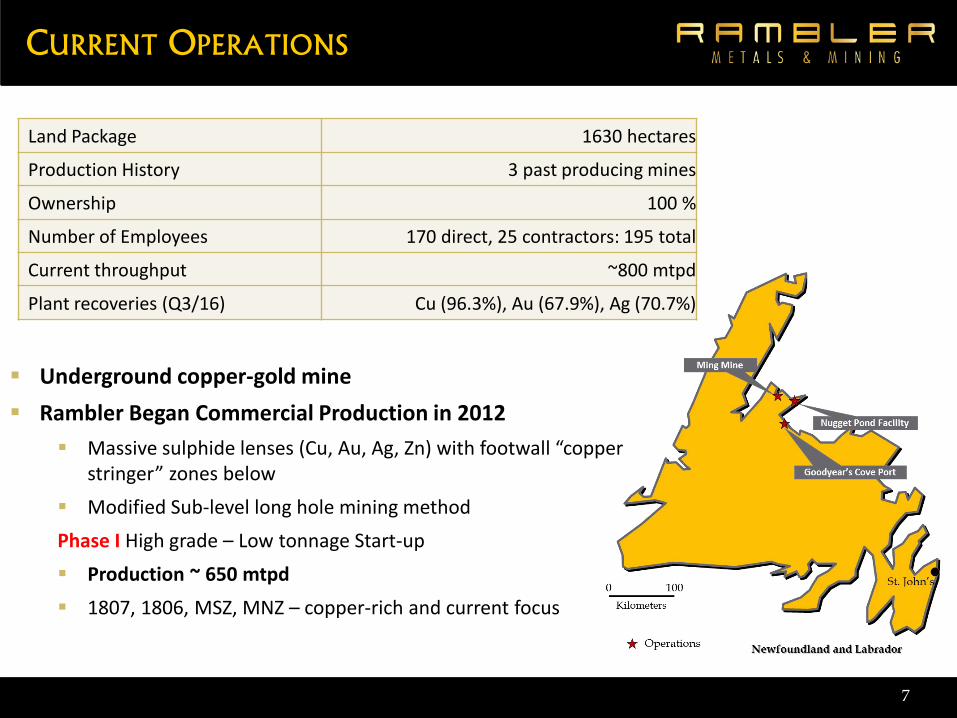
Underground copper-gold mine Rambler Began Commercial Production in 2012
Massive sulphide lenses (Cu, Au, Ag, Zn) with footwall “copper stringer” zones below
Modified Sub-level long hole mining method Phase I High grade – Low tonnage Start-up Production ~ 650 mtpd 1807, 1806, MSZ, MNZ – copper-rich and current focus
Land Package 1630 hectares
Production History 3 past producing mines
Ownership 100 %
Number of Employees 170 direct, 25 contractors: 195 total
Current throughput ~800 mtpd
Plant recoveries (Q3/16) Cu (96.3%), Au (67.9%), Ag (70.7%)

CURRENT PRODUCTION KPI’S
8 *Note: Fiscal Year-End of 31 July
0.00
1.00
2.00
3.00
-
1.0
2.0
3.0
4.0
1Q/15 2Q/15 3Q/15 4Q/15 1Q/16 2Q/16 3Q/16
$US
Cu M
Lbs
Pounds of Saleable Cu and C1 Cost Cu M lbs C1 $US
0
50
100
150
-
20,000
40,000
60,000
80,000
1Q/15 2Q/15 3Q/15 4Q/15 1Q/16 2Q/16 3Q/16
$US/
Tonn
e
Tonn
es
Production Tonnes and Mining Cost Tonnes Milled Mining Cost Per Tonne US
0
10
20
30
40
-
20,000
40,000
60,000
80,000
1Q/15 2Q/15 3Q/15 4Q/15 1Q/16 2Q/16 3Q/16
$US/
Tonn
e
Tonn
es
Production Tonnes and Milling Cost Tonnes Milled Milling Cost Per Tonne US
Continuing Improvements
Mining and milling production (expansion)
Lower C1 costs per pound of saleable copper
With a goal to optimize and improve operating efficiency

PRODUCTION HISTORY 2016 FISCAL GUIDANCE
9
* Quarter Actuals
*Note: Fiscal Year-End of 31 July
Fiscal 2016 plan ramping up production from 650 mtpd to 850 mtpd by yearend
On track to meet copper, gold and silver production guidance
4.2
4.0
3.8
3.5
3.1
2.8
2.2 2.1
2.7
2.1
2.6
1.5
2.0
2.5
3.0
3.5
4.0
4.5
20,000
25,000
30,000
35,000
40,000
45,000
50,000
55,000
60,000
65,000
1Q'14 3Q'14 1Q'15 3Q'15 1Q'16 3Q'16
Cop
per H
ead
Gra
de %
M
lbs
Cu
Dry
Ton
nes
Tonnes Milled Cu M lbs Copper Head Grade %
PRODUCTION Guidance – Fiscal 2016 Dry Tonnes Milled 235,000 - 250,000 Copper Recovery 94 - 96 % Gold Recovery 65 - 70 % Silver Recovery 65 - 75 % Copper Head Grade (%) 2.0 - 2.5 Gold Head Grade (g/t) 1 - 2 Silver Head Grade (g/t) 6 - 10
Copper Metal (tonnes) 4,500 - 6,000 Gold (ounces ) 5,500 - 6,500 Silver (ounces) 42,000 - 57,000
Q3 2016 – FINANCIAL RESULTS
10 *Note: Fiscal Year-End of 31 July
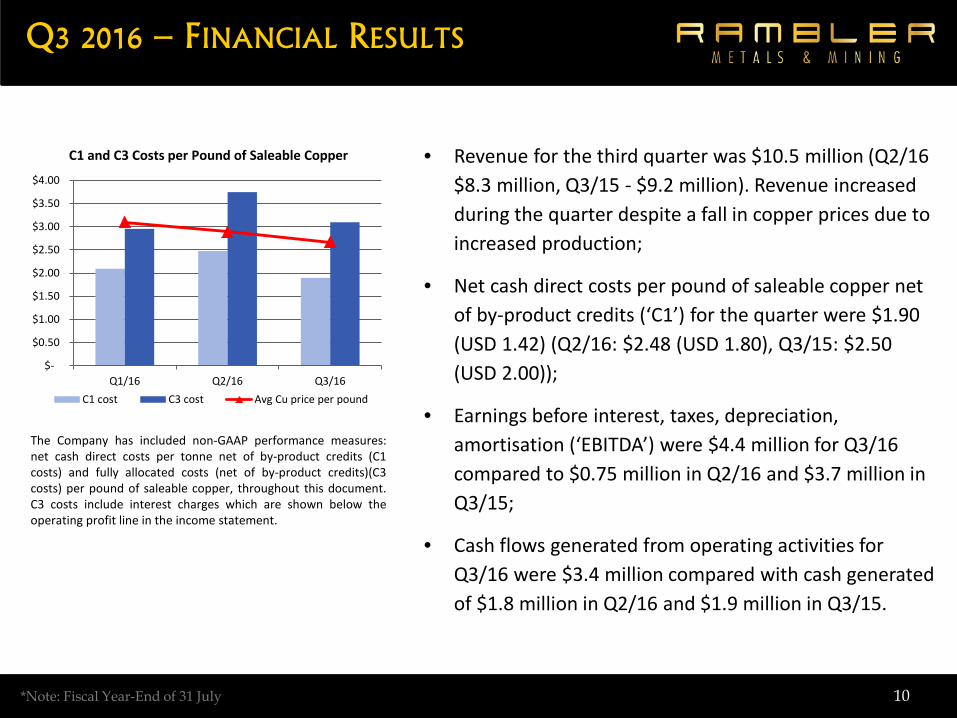
The Company has included non-GAAP performance measures: net cash direct costs per tonne net of by-product credits (C1 costs) and fully allocated costs (net of by-product credits)(C3 costs) per pound of saleable copper, throughout this document. C3 costs include interest charges which are shown below the operating profit line in the income statement.
• Revenue for the third quarter was $10.5 million (Q2/16 $8.3 million, Q3/15 - $9.2 million). Revenue increased during the quarter despite a fall in copper prices due to increased production;
• Net cash direct costs per pound of saleable copper net of by-product credits (‘C1’) for the quarter were $1.90 (USD 1.42) (Q2/16: $2.48 (USD 1.80), Q3/15: $2.50 (USD 2.00));
• Earnings before interest, taxes, depreciation, amortisation (‘EBITDA’) were $4.4 million for Q3/16 compared to $0.75 million in Q2/16 and $3.7 million in Q3/15;
• Cash flows generated from operating activities for Q3/16 were $3.4 million compared with cash generated of $1.8 million in Q2/16 and $1.9 million in Q3/15.
$-
$0.50
$1.00
$1.50
$2.00
$2.50
$3.00
$3.50
$4.00
Q1/16 Q2/16 Q3/16
C1 and C3 Costs per Pound of Saleable Copper
C1 cost C3 cost Avg Cu price per pound

11
WHY COPPER? WHY EXPAND?
11
Copper is arguably the most useful industrial metal, a conductive metal used heavily in the manufacturing, construction, electrical, technological, and auto industries — some of the most important driving forces behind the development of a country.
Copper is used to make sinks, wires, connectors, electrical springs and doors, appliances, polished coverings and much more. One house may not contain a significant amount of copper on its own, but added up across the United States and the rest of the world, the demand is significant
‘The world needs Copper’
WHY COPPER?
WHY EXPAND?
Relatively low capital required Good time to access labor markets and
equipment Timed in anticipation of a rebound in the
copper market

12
Ramp
MING COPPER-GOLD MINE
1807 Zone
North Zone
Open at Depth
Massive Sulphide
Zones
Shaft
Historically Mined Areas
South Zone
1,800 ft level
Lower Footwall
Zone
1806 Zone
12
WHY EXPAND? Significant proven and
probable reserves to support expansion
Untested exploration targets Opportunity for further growth
though the LFZ
Mineral Reserve Classification
T (‘000)
Cu (%)
Au (g/t)
Cu M lbs
Au K Oz
Proven* 5,205 1.98 0.43 226.9 71.6
Probable* 3,050 1.99 0.76 133.8 74.2
Total Reserve (diluted, recovered) 8,667 1.79 0.48 341.2 133.5
Note: Proven and Probable (undiluted and unrecovered)

13
EXPANDING EXISTING OPERATIONS
Phase II - Optimizing Existing Infrastructure: Board approved Phase II Expansion to 1,250 mtpd.
Aimed to optimize mill throughput while continuing to reduce unit costs
Ming Mine • Transition to include integration of Lower Footwall Zone
(LFZ) with new mining method. U/G development underway.
• Underground equipment purchases ongoing • Ventilation upgrade in process with equipment purchased • Maintenance building completed • Increase production to 1,250 mtpd – late fiscal 2017 • Further engineering to include DMS and shaft refurbishment
Nugget Pond Mill • Add grinding and floatation capacity via new ball mill and
other infrastructure. Milling capacity test underway • Tailings pond lift/expansion • Further improve gold recovery
Goodyear’s Cove port • Fully equipped to handle planned expansion with 15,000
tonnes of storage capacity
Geo-Politically Stable
Favourable Tax Regime
Supportive Communities
Experienced Workforce
Paved Roads
Fresh Water
Provincial Electrical Grid
Regional Airport
Nugget Pond Mill

PHASE II LIFE OF MINE PLAN
14
Maintain consistent production of copper concentrate throughout 21 year mine life with potential to increase production beyond 1,250 mtpd with further DMS and shaft studies
?)
05,00010,00015,00020,00025,00030,00035,00040,00045,00050,000
050,000
100,000150,000200,000250,000300,000350,000400,000450,000500,000
Con
cent
rate
, t
Mill
Fee
d, t
Mill Feed and Concentrate Production Profile
LFZ Mill Feed MS Mill Feed Concentrate
* Data source NI43-101 Technical Report July 2015

15
PHASE II PERMITTING STRATEGY
Item Current State After Expansion1
Production tonnes, per annum 230,000 435,000
Copper produced, accountable (million lbs), per annum 13.5 16
Gold produced (ozs), average per annum 6,000 3,400
Life of Project
Mine Life (2016 to 2036) 6 Years 21 Years
Total Copper Produced (M lbs) 81 325
Total Gold Produced (ozs) 36,000 72,413
Copper head grade (%) 2.25 1.79
Gold head grade (g/t) 1.5 0.5
Mill Recoveries MMS (Cu, Au) 96.1%, 67.8%
Mill Recoveries LFZ (Cu, Au) 98.9%, 63.6%
1 does not factor in upside potential
Accelerated Mine Plan
Rambler is funded for the execution of expansion plan outlined in the July 2015 technical report. This plan is being accelerated with the mine and mill production increasing from 650 mtpd to 1,250 mtpd by the end of Fiscal 2017
Permitting Strategy
Phase II – expansion of the existing operation
Key Milestones Q4 2016 (Calendar) – submit updated
Development Plan including LFZ mine plan. Mine: increase in production; ventilation
upgrade; paste plant; with options for DMS and shaft
Mill: expansion of existing tailings impound; new grinding capacity
Port: no new infrastructure required
Production will continue during the permitting process

16
FUTURE GROWTH OPPORTUNITIES (PHASE III)
1. Ore Pre-concentration (DMS) Pilot plant purchased and installed. Testing focused on a variety of crush and feed rates Additional variability lab testing completed Results to date showing 87-97% Copper Recovery Head grade increased with a 20-40% removal of waste material Further engineering studies to confirm potential benefits:
Install at mine site reducing haulage to mill Provides backfill source for LFZ mining method Delivers higher grade feed to the copper concentrator
Dense Media Separator
16
Test Grain Size (mm)
Feed Rate (tonne/h)
Cu Head Grade (%)
Cu Recovery (%)
Final Cu Grade (%)
Mass Recovery
(%)
Mass Rejection
(%)
Upgrade Factor
- 20 / + 8 40 1.28 93.0 2.03 58.5 41.5 1.59 - 8 / + 12 22 1.02 87.3 1.52 58.8 41.2 1.49
- 40 / + 20 60 1.29 96.9 1.60 78.3 21.7 1.24
17
FUTURE GROWTH OPPORTUNITIES (PHASE III)
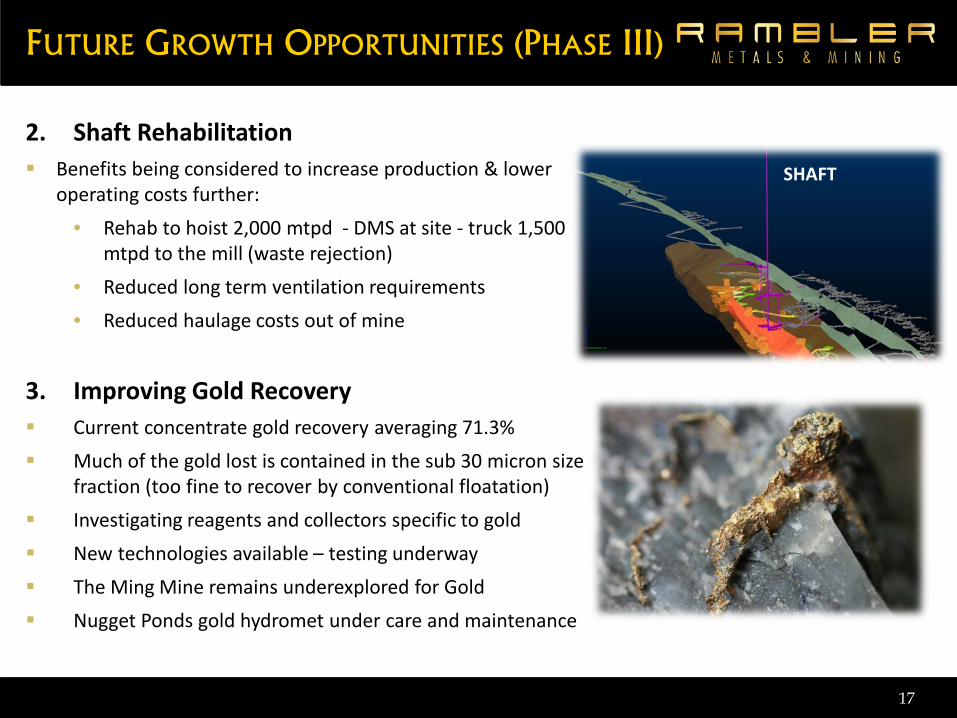
2. Shaft Rehabilitation Benefits being considered to increase production & lower
operating costs further: • Rehab to hoist 2,000 mtpd - DMS at site - truck 1,500
mtpd to the mill (waste rejection) • Reduced long term ventilation requirements • Reduced haulage costs out of mine
3. Improving Gold Recovery Current concentrate gold recovery averaging 71.3% Much of the gold lost is contained in the sub 30 micron size
fraction (too fine to recover by conventional floatation) Investigating reagents and collectors specific to gold New technologies available – testing underway The Ming Mine remains underexplored for Gold Nugget Ponds gold hydromet under care and maintenance
17
SHAFT

MING MINE – MMS EXPLORATION
18
1807 Zone
Ming South Zone
Ming North Zone
1806 Zone Gold Potential DDH with 5.5 m grading 3.4 g/t Au
Previous Mining Horizon Intersection of:
16.8 m of 1.8% Cu with 1.8 g/t Au
1800 lv
RM03-02 intersected 4.1 meters of 3.0 % Cu with 2.8 g/t Au ~1 km beyond historic workings All Zones Remain Open at Depth
Surface Surface Portal
East West
Lower Footwall Zone 26 Mt @ 1.47% Cu
Short term exploration focused on: 1. Replacement of Reserve
& Resource 2. Explore down-plunge of
know mineralization 3. Outward exploration
MING MINE – LFZ EXPLORATION
19
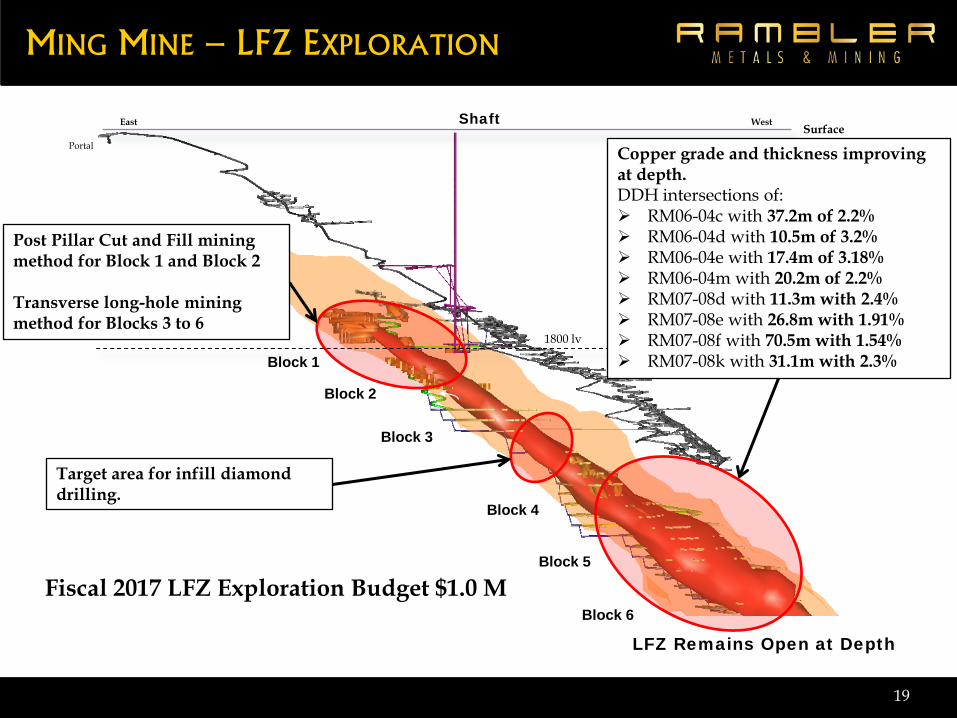
Shaft
1800 lv
LFZ Remains Open at Depth
Surface Portal
East West
Post Pillar Cut and Fill mining method for Block 1 and Block 2 Transverse long-hole mining method for Blocks 3 to 6
Copper grade and thickness improving at depth. DDH intersections of: RM06-04c with 37.2m of 2.2% RM06-04d with 10.5m of 3.2% RM06-04e with 17.4m of 3.18% RM06-04m with 20.2m of 2.2% RM07-08d with 11.3m with 2.4% RM07-08e with 26.8m with 1.91% RM07-08f with 70.5m with 1.54% RM07-08k with 31.1m with 2.3% Block 1
Block 2
Block 3
Block 4
Block 5
Block 6
Target area for infill diamond drilling.
Fiscal 2017 LFZ Exploration Budget $1.0 M

20
DISTRICT POTENTIAL
Little Deer Mine
Operations
Exploration / Strategic Investment
Hammerdown Mine
Newfoundland and Labrador
Hammerdown Mine (Gold)* All work funded by Maritime Resource 15% ownership in property holder Maritime
Resources Corp. Former Producing UG Mine (2000 – 2004) Mined 291,400 at 15.8g/t Gold (7g/t cut-off) Processed at Rambler’s Nugget Pond Mill Recently signed Engineering & Evaluation Agreement “Near-Mill” Opportunity: leverage Rambler’s
infrastructure
Little Deer Project (Copper)* 100% owned Potential satellite deposit to the Ming 96 diamond drill holes for 54,998 m and historical
information; ~7 million tonnes in M&I, 2.1% Cu $8M invested by previous operators Excellent infrastructure (roads, power, water)
*See Appendix

Near Term Focus on Ming Mine and Nugget Pond Mill
Implement the fully funded PFS expansion increasing production to 1,250 mtpd by end of Fiscal 2017; accelerate mine expansion rate increase
Detailed investigation of increasing gold recovery and milling rate increase
Strong balance sheet post transaction
Continue mine-site exploration Longer Term Strategy
Further advance engineering studies on ore pre-concentration (DMS) and shaft
rehabilitation with a view to increase production to 2,000 mtpd from the Ming Mine
21
LOOKING FORWARD

22
INVESTMENT SUMMARY
Excellent position to take advantage of next Copper cycle – it’s the right time to Expand
Producing copper-gold miner funded for expansion
Management with strong track-record of mine development and operation
Further strengthen by the Plinian team and Board of Directors
Expanding towards a 21 year life of mine targeting the operation to run at 1,250 mtpd by 2017
Upside potential with ore pre-concentration and shaft rehabilitation
Fully funded with 37% free float providing tremendous value for new shareholders.
Mandalay Resources Case Study (see appendix)
Stable low risk jurisdiction in historical mining district
Newfoundland and Labrador is in the top quartile on the Fraser Institute
District exploration potential
23
APPENDIX

MINERAL RESERVE AND RESOURCE (RESERVE AS OF 20 JULY 2015)
24
Classification
Quantity Grade Contained Metal
tonnes Copper %
Gold g/t
Silver g/t
Zinc %
Copper M lbs
Gold K oz
Silver K oz
Zinc M lbs
Total Proven Reserve (undiluted, unrecovered)
5,205,300 1.98 0.43 3.08 0.07 226.9 71.6 515.5 8.4
Total Probable Reserve (undiluted, unrecovered)
3,050,100 1.99 0.76 3.19 0.10 133.8 74.2 312.4 6.6
Dilution (all sources) 1,374,500 0.61 0.06 0.70 0.01 18.5 2.6 30.7 0.3
Reserve (diluted and recovered) 8,667,000 1.79 0.48 2.77 0.07 341.2 133.5 772.8 13.8
Mineral Reserve Estimate Summary for the Ming Copper-Gold Mine(1)
Mineral Resource Estimate Summary for the Ming Copper-Gold Mine(2)
Measured Total 19,127 1.50 0.23 1.90 0.05 632.0 141.8 1,167.9 19.9
Indicated Total 9,199 1.53 0.39 2.07 0.07 310.5 115.3 613.5 14.3
M&I Total 28,326 1.51 0.28 1.96 0.05 942.5 257.1 1,781.4 34.2
Inferred Total 5,086 1.51 0.66 3.75 0.21 169.7 107.8 613.4 23.6
Resources are Inclusive of Reserves

LOWER FOOTWALL ZONE RESOURCE (COPPER CUT-OFF SENSITIVITY)
25
Copper Cut-off Grade
Quantity Grade Contained Metal
(000't) Copper %
Gold g/t
Silver g/t
Zinc %
Copper lbs
Gold oz
Silver oz
Zinc lbs
0.25 68,622 0.96 0.09 0.98 0.02 1,451,097,627 193,484 2,159,594 29,245,136
0.50 57,632 1.07 0.09 1.05 0.02 1,357,287,418 169,203 1,942,167 24,593,816
0.75 40,936 1.25 0.10 1.16 0.02 1,126,324,596 128,553 1,527,440 17,296,650
1.00 25,958 1.47 0.11 1.28 0.02 839,593,090 87,667 1,071,175 10,875,301
1.25 16,025 1.69 0.11 1.41 0.02 595,434,650 57,649 727,852 6,574,685
1.50 9,427 1.91 0.12 1.56 0.02 396,656,024 36,580 472,111 3,845,516
1.75 5,380 2.13 0.13 1.73 0.02 252,605,662 22,393 298,499 2,220,336
2.00 2,860 2.36 0.14 1.88 0.02 149,083,363 12,685 172,891 1,203,654
Measured and Indicated Mineral Resource Estimate Combined
(1) All figures are rounded to reflect the accuracy of the estimate; numbers may not total due to this rounding. This reserve statement reflects changes to reserves in the massive sulphides based on depletion due to mining and additions due to new exploration drilling results. The NSR for the reserve material was calculated using an all-in costs of $147 per tonne of ore milled for the massive sulphides and $118 per tonne of ore milled for the lower footwall zone. Forecast long term metal prices of USD$2.79 per pound copper and USD$1,100 per ounce gold, and USD$15.50 per ounce silver with a long term USD/CDN FX rate of 1:0.88.
(2) Mineral Resources are not Mineral Reserves and have not demonstrated economic viability. All figures are rounded to reflect the accuracy of the estimate. Cut-off grades of 1.0 per cent copper for the massive sulphides, 1.25 grams per tonne gold for any gold zones and 1.00 per cent copper for the stringer sulphides have been used in the estimate. Cut-offs are based on an NSR model and forecast long term metal prices of USD$2.79 per pound copper and USD$1,100 per ounce gold, and USD$15.50 per ounce silver with a long term USD/CDN FX rate of 1:0.88. Zinc does not contribute to the revenues. Resources are inclusive of reserves.

26
LITTLE DEER PROJECT (100% OWNERSHIP)
Little Deer – Whalesback 3D View (Looking West)
Resource Classification/Zone
Quantity tonnes
Cu %
Cu M lbs
Whalesback
Indicated Mineral Resources 797,000 1.67 29.3
Inferred Mineral Resources 443,000 1.57 15.3
Little Deer
Indicated Mineral Resources
Little Deer Zone 1,911,000 2.37 99.8
Inferred Mineral Resources
Little Deer Zone 1,240,000 1.93 52.8
Little Deer Footwall Zone 1,711,000 2.04 77.0
Little Deer FWZ Splay 797,000 2.64 46.2
Total Indicated Resources 2,708,000 2.16 129.1
Total Inferred Resources 4,191,000 2.07 191.3
Notes: 1. Mineral resources which are not mineral reserves do not have
demonstrated economic viability. The estimate of mineral resources may be materially affected by environmental, permitting, legal, title, taxation, socio-political, marketing, or other relevant issues.
2. A variable bulk density based on numerous field measurements was used for tonnage calculations. Whalesback: A copper price of US$3.82/lb (June 30, 2012 two year trailing average) and an exchange rate of US$0.99=C$1.00 was utilized to derive the 1% Cu cut-off grade. Mining costs were C$45/t, process costs were C$16/t and G&A was C$6/t. Concentrate freight and smelter treatment charges were C$10/t mined. Concentrate mass pull was 7%, process recovery was 97%, smelter payable was 96% and Cu refining was US$0.07/lb.
3. Little Deer: A copper price of US$3.42/lb (May 31, 2011 24 two year trailing average) and an exchange rate of US$0.95=C$1.00 was utilized to derive the 1% Cu cut-off grade. Mining costs were C$40/t, process costs were C$15/t and G&A was C$5/t. Concentrate freight and smelter treatment charges were C$10/t mined. Concentrate mass pull was 7%, process recovery was 97%, smelter payable was 96% and Cu refining was US$0.07/lb.

27
MARITIME RESOURCES CORP. (15% OWNERSHIP)
*While Maritime Resources Corp. has completed a NI43-101 technical report on the property, a qualified person from Rambler has not done sufficient work to classify the work as current mineral resources or mineral reserves; as such Rambler is not treating the historical estimate as current mineral resources or mineral reserves.
Category Deposit Tonnes Gold (g/t)
Ounces
Measured Hammerdown 157,050 12.35 62,358
Rumbullion 45,810 11.31 16,660
Measured Subtotal 202,860 12.12 79,018 Indicated Hammerdown 289,300 11.71 108,912
Rumbullion 235,300 11.00 83,194
Indicated Subtotal 524,600 11.39 192,106
M&I Total 727,460 11.59 271,124
Inferred Hammerdown 922,000 8.13 240,882
Rumbullion 773,000 6.46 160,640
Muddy Shag 72,000 14.91 34,505
Inferred Total 1,767,000 7.68 436,027
ORION
Indicated Orion 1,096,500 4.47 157,488
Inferred Orion 1,288,000 5.44 225,129

Au E
q. O
z/Q
tr
50%
100%
150%
200%
250%
300%
Q32009
Q12010
Q32010
Q12011
Q32011
Q12012
Q32012
Q12013
Q32013
Q12014
Q32014
Q12015
Q32015
Q12016
Mandalay Cumulative Returns 13.8% Annual Compounded Rate of ReturnGold Silver
13.8% Cumulative Total Return (% Value Change)*
Value Creation Case Study: Mandalay Resources Corp
*Q3 2009 to Q1 2016, includes all dividends paid. Source: MetalPrices.com for metal spot prices Index: September 30, 2009 = 100. Mandalay share price: $0.89. Graph updated quarterly, prices as at the last trading day of each respective quarter.
(1) The Company defines EBITDA as earnings before interest, taxes and non cash charges/ (income). EBITDA should not be considered by an investor as an alternative to net income or cash flow as determined in accordance with IFRS.
(2) Annual cash dividend paid quarterly, based on 6% of the Company’s trailing quarter’s gross revenue and the future cash requirements of the Company
500
700
900
1,100
1,300
1,500
1,700
-
10,000
20,000
30,000
40,000
50,000
60,000
2010 2011 2012 2013 2014 2015 2016
Production Cash Cost AISC
1 mine restart
1 mine restart 1 mine transformation 2 mines producing
2 mines producing 1 mine transformation
Growing Number of Operations, Lowering Costs and Volatility
1.7
32.0
79.9 67.7 64.4 $68.0
-$0.8
$30.6
$61.2 $75.9
$52.4
$73.4
20.6
92.2
171.8 166.9 184.6
$194.5
-50
0
50
100
150
200
250
2010 2011 2012 2013 2014 2015
US$
MM
Steadily Growing Revenue, EBITDA and Cash Generation
Cash from Operations
EBITDA(1)
Revenue
$/O
z Au
Eq.
(Cos
t) or
Au
(Pric
e)
$0
$2,000,000
$4,000,000
$6,000,000
$8,000,000
$10,000,000
$12,000,000
$14,000,000
2010 2011 2012 2013 2014 2015 1H-2016
Div
iden
ds P
aid
US$
Dividends Paid(2)

“A Leading Mine Operator And Resource Developer”
Rambler Metals & Mining PLC Salatin House 19 Cedar Road Sutton Surrey, SM2 5DA United Kingdom Tel: +44(0) 20 8652 2700 Fax: +44(0) 20 8652 2719
Rambler Metals & Mining Canada Ltd P.O. Box 610 Baie Verte, NL, A0K 1B0 Route # 418, Ming's Bight Road, NL Tel: 709-800-1929 Fax: 709-800-1921
www.ramblermines.com


