27
Dr. Reddy’s Laboratories Limited Hyderabad, India NYSE: RDY Dr. Reddy’s Jefferies 2014 Global Healthcare Conference 3 rd June, 2014 New York Umang Vohra
Dr. Reddy’s Laboratories Limited
Hyderabad, India
NYSE: RDY
Dr. Reddy’s Jefferies 2014 Global Healthcare Conference
3rd June, 2014
New York
Umang Vohra
This presentation contains forward-looking statements and information that involve risks, uncertainties and assumptions. Forward-
looking statements are all statements that concern plans, objectives, goals, strategies, future events or performance and underlying
assumptions and other statements that are other than statements of historical fact, including, but not limited to, those that are
identified by the use of words such as “anticipates,” “believes,” “estimates,” “expects,” “intends,” “plans,” “predicts,” “projects” and
similar expressions. Risks and uncertainties that could affect us include, without limitation:
• General economic and business conditions in India and other key global markets in which we operate;
• The ability to successfully implement our strategy, our research and development efforts, growth & expansion plans and
technological changes;
• Changes in the value of the Rupee and other currency changes;
• Changes in the Indian and international interest rates;
• Allocations of funds by the Governments in our key global markets;
• Changes in laws and regulations that apply to our customers, suppliers, and the pharmaceutical industry;
• Increasing competition in and the conditions of our customers, suppliers and the pharmaceutical industry; and
• Changes in political conditions in India and in our key global markets.
Should one or more of such risks and uncertainties materialize, or should any underlying assumption prove incorrect, actual
outcomes may vary materially from those indicated in the applicable forward-looking statements.
For more detailed information on the risks and uncertainties associated with the Company’s business activities, please see the
Company’s Form 20-F for the fiscal year ended March 31, 2013, and Form 6-k for the quarter ended June 30, 2013, and its other
filings with the Securities and Exchange Commission. Any forward-looking statement or information contained in this presentation
speaks only as of the date of the statement. We are not required to update any such statement or information to either reflect events
or circumstances that occur after the date the statement or information is made or to account for unanticipated events.
1
Safe Harbor Statement

Contents
1. Company Overview
2. Strong performance over the past decade
3. Exciting future
2

Global Generics
• Finished dosage businesses
in distribution-driven as well as
detailing-driven markets
• North America, India, Russia
are key markets in this
segment.
• Building a sustainable
Biosimilar business
Pharmaceutical Services &
Active Ingredients
• Amongst the leaders in
supply of generic APIs
globally
• Customers include generic
manufacturers, innovator
companies
Proprietary Products
• Focus on building sustainable
and profitable proprietary
products business
• Strong pipeline of
differentiated formulations
Access to affordable medicines Partner of Choice Meeting unmet medical needs
FY14 Revenue mix 80% of total FY14 Revenue mix 20% of total
We have a vertically Integrated business model with 3 distinct
segments
3

Key strengths and capabilities
Industry leading chemistry skills
• Several niche product opportunities (tacrolimus , metoprolol succinate, azacitidine, divalproex sodium ER, sumatriptan auto-injector)
Deep market presence
Branded generic markets - India, Russia (entry in 1991), CIS countries, Venezuela and others
Generic markets – USA (1997 – first ANDA filing), UK and Germany
Vertically integrated organization with modern Infrastructure
• R&D centers in India, UK, Netherlands and US
• 9 formulation manufacturing facilities (4 USFDA inspected) with 25+ billion units in generics capacity
• 8 USFDA inspected API manufacturing facilities
• Biologics development and manufacturing in India
Early mover advantage in Biosimilars
• First to launch Biosimilar rituximab in 2007
• 4 biosimilar* products being marketed
4
*Similar biologic approved under abbreviated processes preceding the establishment of formal biosimilar regulatory guidelines

Contents
1. Company Overview
2. Strong performance over the past decade
3. Exciting future
5

463 447 546
1,510
1,250 1,365
1,563 1,677
1,901
2,133 2,203
Strong revenue growth over the last decade
Revenues
Million USD
All figures converted at respective periods’ convenience translation rates (as reported in our Form 20-F)
FY13 FY12 FY11 FY10 FY09 FY08 FY07 FY06 FY05 FY04 FY14
+17%
• Authorized
generic launches
6
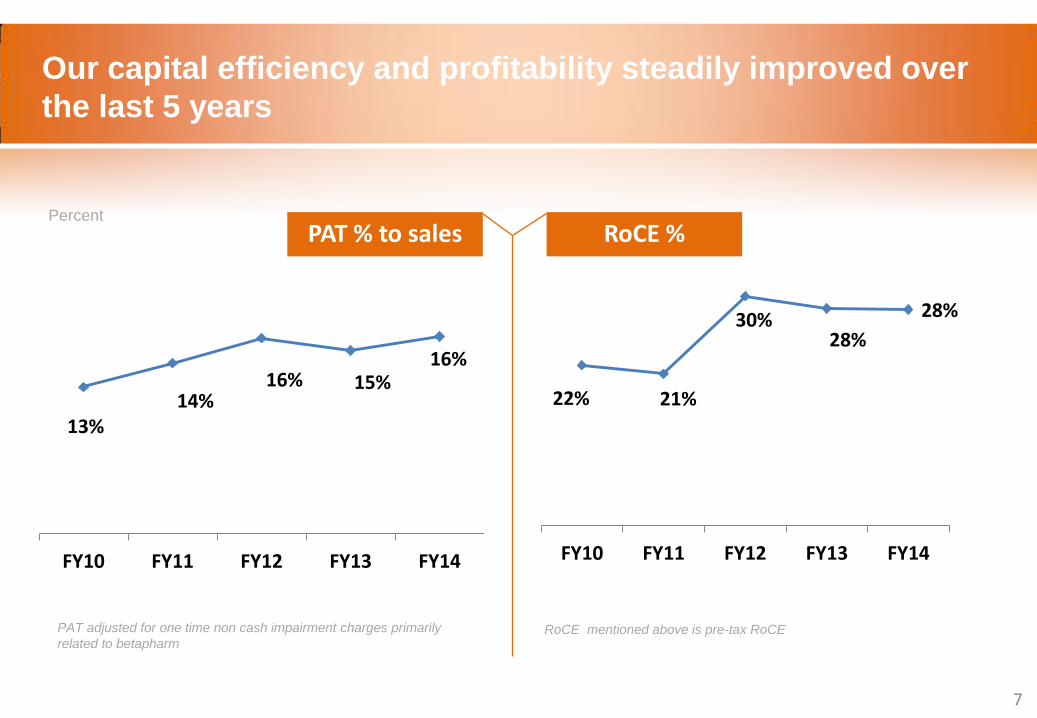
Our capital efficiency and profitability steadily improved over
the last 5 years
PAT adjusted for one time non cash impairment charges primarily
related to betapharm
22% 21%
30% 28%
28%
FY10 FY11 FY12 FY13 FY14
13% 14%
16% 15% 16%
FY10 FY11 FY12 FY13 FY14
RoCE mentioned above is pre-tax RoCE
RoCE % PAT % to sales
7
Percent

Our North America Generics base business grew at 32% CAGR* while building a pipeline of limited competition products
Revenues
Million USD
* Excluding upside revenues
Market shares of limited competition
products have been stable Base Revenues grew at 32% CAGR*
Jan-14 Apr-14
Fondaparinux 34% 34%
Metoprolol ER 16% 19%
Atorvastatin 17% 18%
Zoledronic acid (Reclast) 60% 68%
Decitabine 100% 100%
Azacitidine 56% 50%
Donepezil 23 mg 61% 43%
(Volume – Generics Market; Source: IMS Health)
Healthy pipeline of high entry barrier products
• 62 pending ANDAs of ~$40 billion of innovator brand
sales value
‒ incl. 39 para-IV and 9 first to file products
8
+32%
Upside revenues
301 417
570
738 54
100
FY13 FY14 FY12 FY11 FY10
921

125 145
165 170
27
51
67 88
FY14
258
FY13 FY12
232
FY11
196
152
FY10
Our Russia business grew at 15% CAGR while building a growing OTC business
Revenues
Million USD
Source: IMS and internal reports
+15%
Consistent performance Revenues grew at 15% CAGR
Current year performance better than market
‒ IMS Rx: Fastest growing among top 20 pharma companies
‒ IMS OTC: Growth of 19% Vs Market growth of 1.4%.
Gained 5 ranks compared to PY
18%
26%
29%
34%
37%
FY10 FY11 FY12 FY13 FY14
Increasing mix of OTC sales: De-risking Russian business
9 OTC Rx
165
105
270
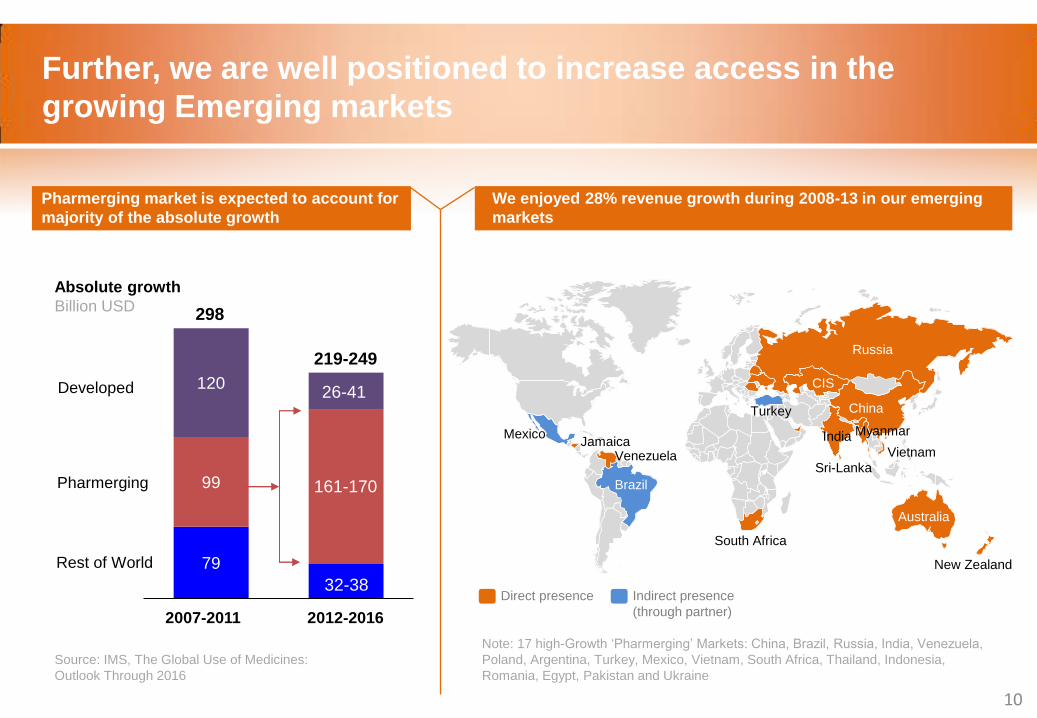
Absolute growth
Billion USD
Source: IMS, The Global Use of Medicines:
Outlook Through 2016
79
99
120
Rest of World
Pharmerging
Developed
2012-2016 2007-2011
298
32-38
We enjoyed 28% revenue growth during 2008-13 in our emerging
markets
Pharmerging market is expected to account for
majority of the absolute growth
Further, we are well positioned to increase access in the
growing Emerging markets
26-41
219-249
Note: 17 high-Growth ‘Pharmerging’ Markets: China, Brazil, Russia, India, Venezuela,
Poland, Argentina, Turkey, Mexico, Vietnam, South Africa, Thailand, Indonesia,
Romania, Egypt, Pakistan and Ukraine
Direct presence Indirect presence
(through partner)
161-170
Venezuela
New Zealand
South Africa
India
Sri-Lanka
China
Russia
Jamaica Vietnam
Australia
Myanmar
CIS
Brazil
Mexico
Turkey
10

1,016
Our India business grew at 12% CAGR while improving business health
Revenues
Rs Cr.
FY14 FY13 FY12 FY11 FY10
+12% 1,571 1,456
1,294 1,169
• MAT March 2014 growth of 12.2% vs IPM growth of
9.9% (Source: IMS)
• 6th largest growing among Top 20 compaines.
Strong volume expansion in the NLEM portfolio during
FY14
• Beginning to launch differentiated formulations with
strong patient benefits:
‒ Metsmall (Metformin): smaller tablet for patient
convenience
‒ Optidoz (combination of Telmisartan, Amlodipine
and HCTZ): to drive better adherence for
Hypertension patients
• Strong relationships with Oncologists,
Gastroenterologists, Dermatologists and Consultant
Physicians
• Overall coverage of > 350,000 doctors
11

Despite modest growth, Pharmaceutical Services & Active
Ingredients continues to be strategic business
Revenue
Million USD
All figures converted at respective years’ average translation rate
FY14 FY13 FY12 FY11 FY10
• Partnerships with leading innovator and generic
companies
430 427
501
568
404 • Our value proposition
‒ Accelerate first to market access for our
partners through non-infringing IP
positions
‒ Invest in technology platforms to
develop complex APIs
‒ Flexible to meet customer demands
• Vertical integration helps us to be first to market
in products with complex APIs (e.g. Azacitidine)
Business faced demand challenges on the
external front this year
12
Contents
1. Company Overview
2. Strong performance over the past decade
3. Exciting future
13

Our purpose has guided our customer value proposition leading
to specific strategic choices
To provide
affordable and
innovative
medicines for
healthier lives
Customer value
proposition
Key Strategic
choices
Drivers for future growth
Purpose
• Bring expensive
medicines within reach
• Address unmet patient
needs
• Help patients manage
disease better
• Equip partners to succeed
• Ensure products are
always on the shelf
• First-to-market,
Tough-to-make products
• Differentiated formulations
for unmet medical needs
• Value added services for patients
and customers
• Reliable & flexible supply
chain
14
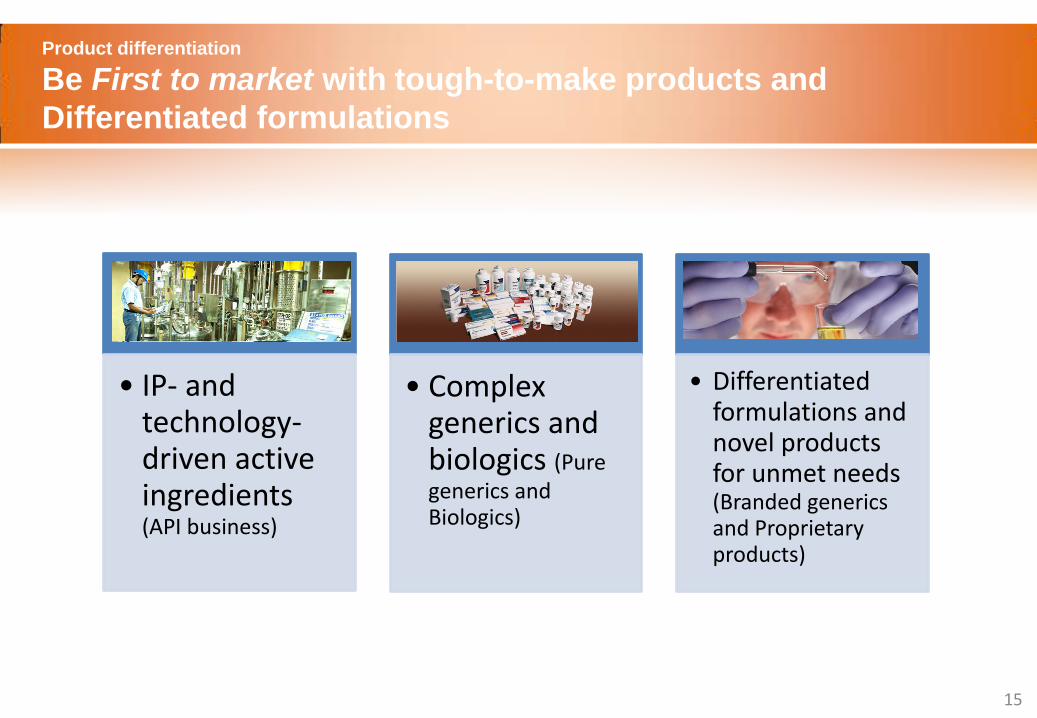
Product differentiation
Be First to market with tough-to-make products and
Differentiated formulations
1
• IP- and technology-driven active ingredients (API business)
2
• Complex generics and biologics (Pure generics and Biologics)
3 • Differentiated
formulations and novel products for unmet needs (Branded generics and Proprietary products)
15

Product differentiation
We globalized R&D to get access to right talent to solve complex
scientific challenges
• Industry leading Chemistry skills
• Building niche technology capabilities in dosage form
development
Chirotech Technology Development Centre Cambridge, UK
Octoplus Technology Development Centre Leiden, Netherlands
Integrated Product Development Centre Hyderabad, India
Development centre Princeton, NJ, USA
17
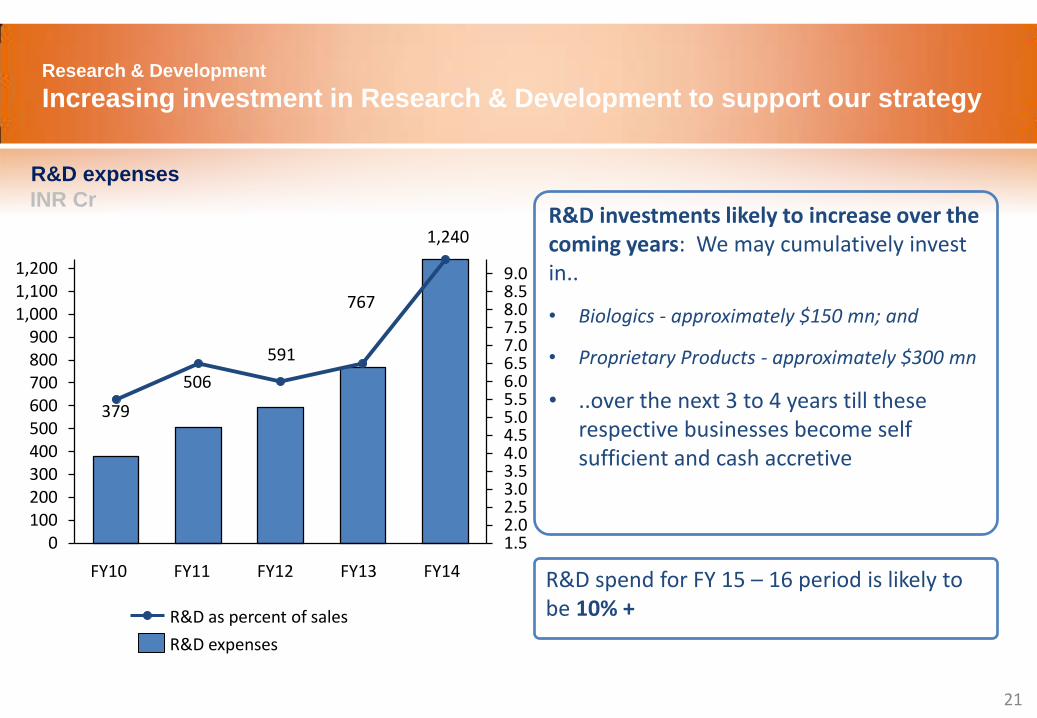
Research & Development
Increasing investment in Research & Development to support our strategy
21
R&D investments likely to increase over the coming years: We may cumulatively invest in..
• Biologics - approximately $150 mn; and
• Proprietary Products - approximately $300 mn
• ..over the next 3 to 4 years till these respective businesses become self sufficient and cash accretive
R&D spend for FY 15 – 16 period is likely to be 10% +
379
506
591
767
1,240
1.52.02.53.03.54.04.55.05.56.06.57.07.58.08.59.0
0100200300400500600700800900
1,0001,1001,200
FY11 FY12 FY13 FY10 FY14
R&D expenses
R&D as percent of sales
R&D expenses
INR Cr

Biologics
We are well positioned to participate in the Biosimilar opportunity…
Filgrastim Rituximab Darbepoetin alfa Pegfilgrastim
First approved biosimilar* monoclonal antibody
First biosimilar* filgrastim (G-CSF) in India
First biosimilar* darbepoetin alfa
Break-through in affordable pegfilgratsims
2001 2007 2010 2011
Successfully commercialized products in Emerging Markets ~35% CAGR growth in Biologics revenues from India & other Emerging Markets over the past 4 years ($94 Mn. Sales)
EMERGING MARKETS DEVELOPED MARKETS
Growth arising from the need for access to expensive treatments
In the near term (FY’17), almost all revenues are expected to come from Emerging Markets
Growth arising from payer pressure to reduce healthcare costs
Two assets in clinical development with three others in pre-clinical development
Revenues to scale significantly post FY’20
Exciting future opportunity for us Market opportunity of around $20 Bn through a large number of biotech drugs ($75-85 Bn.) coming off-patent by 2020.
Our current portfolio covers most of the top biologics coming off patent.
18
*Similar biologic approved under abbreviated processes preceding the establishment of formal biosimilar regulatory guidelines

Biologics
… with our strengths well complemented by Merck Serono’s
Our Key Capabilities
Fully integrated development team
skilled in end-to-end development
of biosimilars
Advanced cGMP manufacturing
capabilities across drug substance
manufacturing and fill-finish
Expertise in understanding and
interpreting evolving biosimilar
guidelines and regulations
Key Capabilities harnessed
from our partner, Merck Serono
Significant expertise and capacity in
biologics manufacturing and
experience with large clinical
development programs
Strong presence in EU and large
emerging markets with long
standing experience and relations
with specialty physicians
19

Proprietary Products
Building targeted Dermatology and Neurology franchises powered by lower
risk innovation model
15+ Products at different developmental / clinical stages with peak sales potential
from $ 30 mn to $ 300 mn
• Target only specific segments of patients,
with specific conditions within
Dermatalogy and Neurology
• Pursue an innovative R&D approach
with lower risk
• Develop and bring these products all the
way to the patient – not through a
licensing partner
• Complement products with patient-
oriented solutions that can further
improve outcomes for these conditions
Key business choices & approach
• Commercial footprint for Dermatology - $ 40 mn in sales - 54 sales reps - Portfolio of steroid
responsive dermatoses and Acne
• First set of NDA filings
• 1-2 NDA filings per year
Key milestones
2015/16
In place already
2016/17 onwards
20
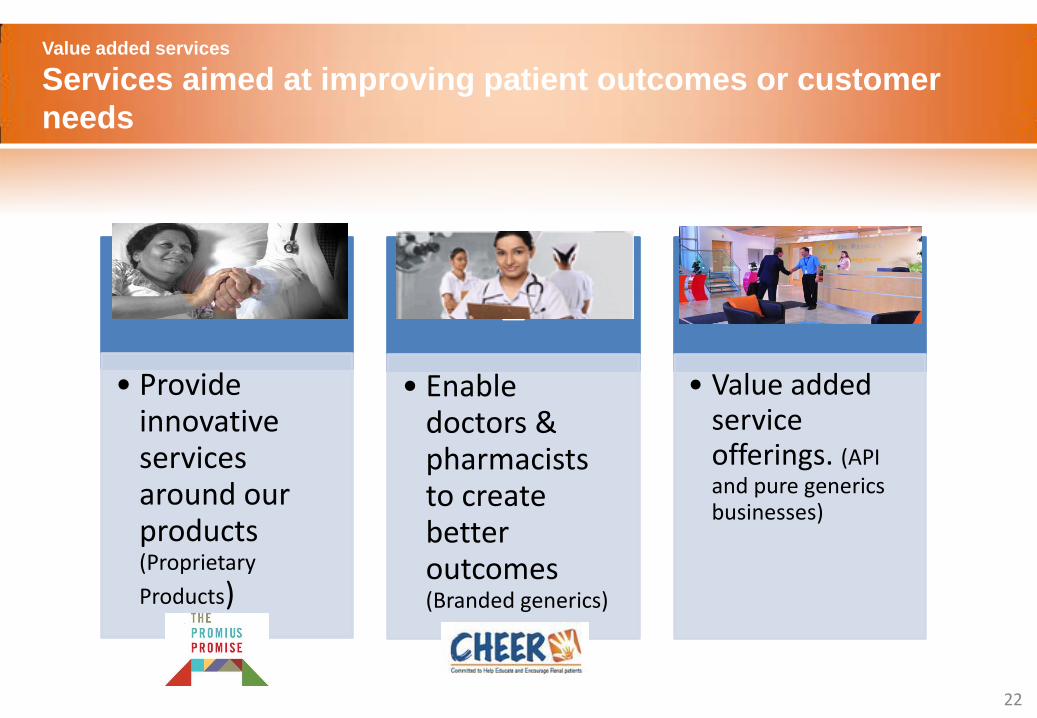
Value added services
Services aimed at improving patient outcomes or customer
needs
1
• Provide innovative services around our products (Proprietary
Products)
2
• Enable doctors & pharmacists to create better outcomes (Branded generics)
3
• Value added service offerings. (API and pure generics businesses)
22

• During the last decade, our top line grew at 17% CAGR with a healthy profitability, on the
back of strong performance from US generics and branded formulations in Emerging markets.
• We are excited about profitable growth opportunities in the future. We are well placed to
harness these opportunities, on the back of our aggressive short-medium term investments in
R&D and infrastructure
‒ Differentiated APIs for key customers early enough to create consistent first-to-market
opportunities
‒ Strong growth in pure generics through tough-to make products with significant ramp up in
complex Injectables and Topicals
‒ Growth in branded generics markets driven by differentiated products for addressing unmet
patient needs, supported by services that enhance patient outcomes
‒ Reliable and flexible supply chain, capable of meeting demand surges and ensuring on-the-
shelf medicine availability always
‒ Investment in biologics and proprietary products to power growth beyond FY20
In summary…
23

Backup
24

FY14 Performance
• 12 ANDA filed
• 1 NDA filed
• 61 DMFs filed
• $207 mn
9.4% to sales
• $553 mn
25% to sales
19% YoY gr
• $ 2,203 Million
14% YoY gr
Revenue EBITDA
Filings R&D
All US dollar figures based on convenience translation rate of 1USD = Rs 60.00 25
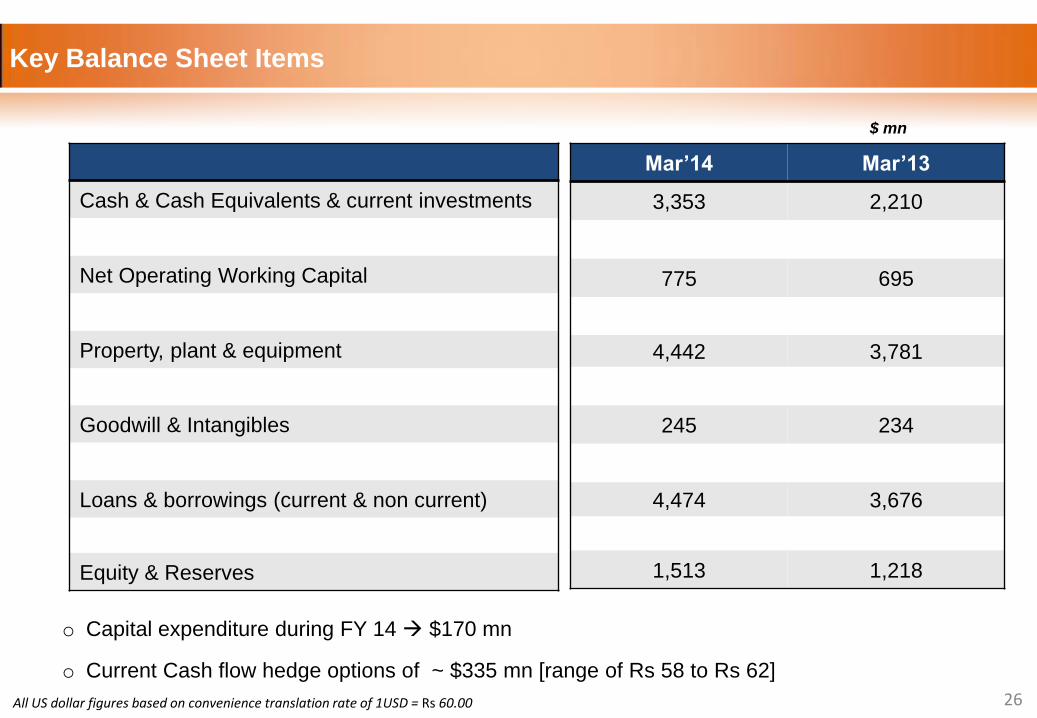
Key Balance Sheet Items
Cash & Cash Equivalents & current investments
Net Operating Working Capital
Property, plant & equipment
Goodwill & Intangibles
Loans & borrowings (current & non current)
Equity & Reserves
Mar’14 Mar’13
3,353 2,210
775 695
4,442 3,781
245 234
4,474 3,676
1,513 1,218
$ mn
o Capital expenditure during FY 14 $170 mn
o Current Cash flow hedge options of ~ $335 mn [range of Rs 58 to Rs 62]
All US dollar figures based on convenience translation rate of 1USD = Rs 60.00 26

©2014 Dr. Reddy's Laboratories Limited. All Rights Reserved.
27


