15
2 September 2015 Andaz London Liverpool Street
| Date post: | 07-Jan-2017 |
| Category: |
Investor Relations |
| Upload: | umicore |
| View: | 18,152 times |
| Download: | 2 times |

2 September 2015Andaz London Liverpool Street
Driving Returns
Filip PlatteeuwChief Financial Officer
Speaker
and Value
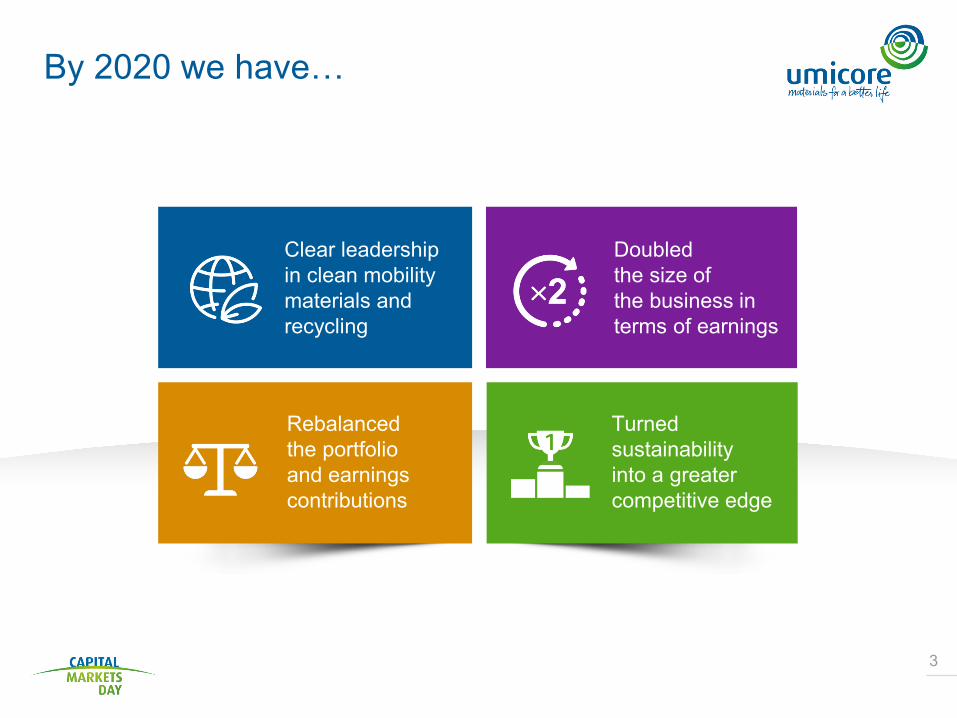
By 2020 we have…
3
Clear leadership in clean mobility materials and recycling
Rebalanced the portfolio and earnings contributions
Doubled the size of the business in terms of earnings
Turned sustainability into a greater competitive edge
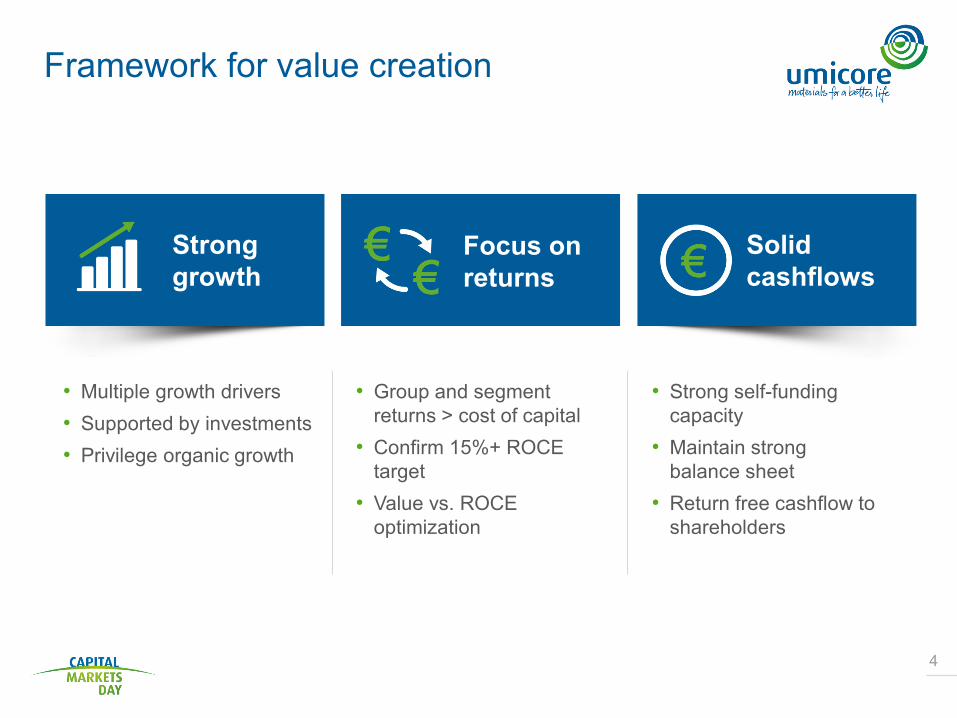
Framework for value creation
4
Strong growth
Focus on returns
Solidcashflows
• Multiple growth drivers • Supported by investments • Privilege organic growth
• Group and segment returns > cost of capital
• Confirm 15%+ ROCE target
• Value vs. ROCE optimization
• Strong self-funding capacity
• Maintain strong balance sheet
• Return free cashflow to shareholders

High investments and R&D in
secular growth projects
Dedicated growth & return mandate per business unit
5
Create value primarily through growth
acceleration
Manage both for growth
and returns
Grow value by defending
existing market positions and
margins
Create value primarily through margin
improvement
1/3rd of revenues and capital employed
2/3rd of revenues and capital employed
Selective investments
and R&D that offer short term
return profiles
2/3rd of revenues
and capital employed
1/3rd of revenues
and capital employed
Disproportionate focus on ROCE improvement
Continuous ROCE improvement
Disproportionate focus on
outpacing market growth
Growth in line with served
market
Significant potential for disproportionate performance
Maximize value vs maximize growth / return
Note: Revenues and capital employed 1H15 excluding Discontinued operations and Corporate.
6
0
750
1500
2250
3000
3750
2010 2015E 2020E0
200
400
600
800
2010 2015E 2020E
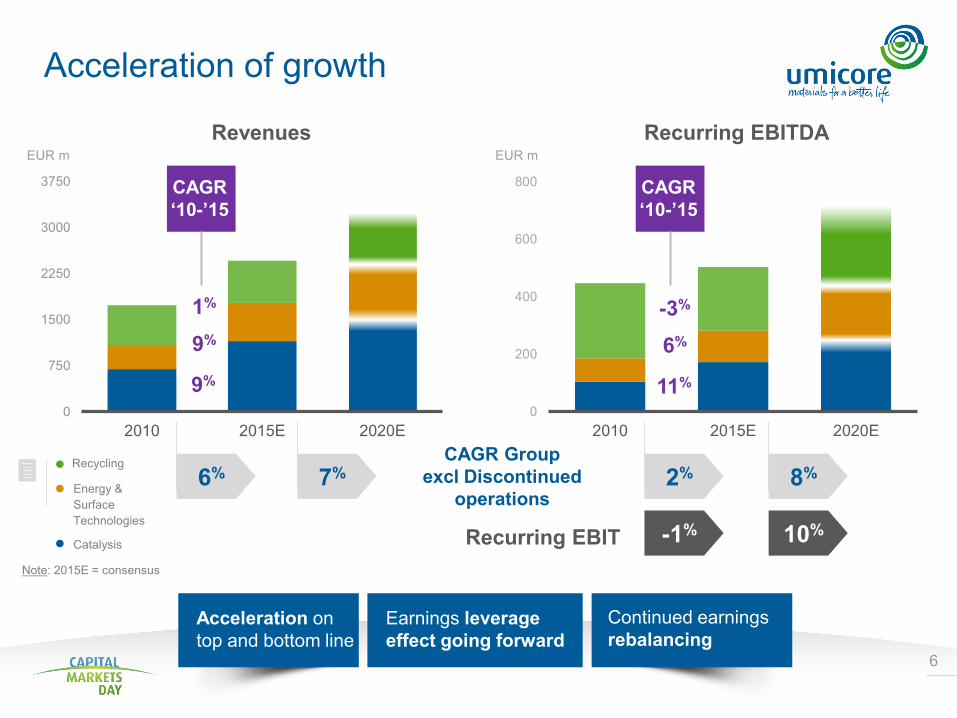
Recurring EBITDARevenues
Recycling
Energy & Surface Technologies
CAGR Group excl Discontinued
operations
Catalysis
1%
9%
9%
CAGR‘10-’15
CAGR‘10-’15
-3%
6%
11%
2% 8%6% 7%
EUR m EUR m
Acceleration on top and bottom line
Continued earnings rebalancing
Earnings leverage effect going forward
-1% 10%Recurring EBIT
Acceleration of growth
Note: 2015E = consensus
7
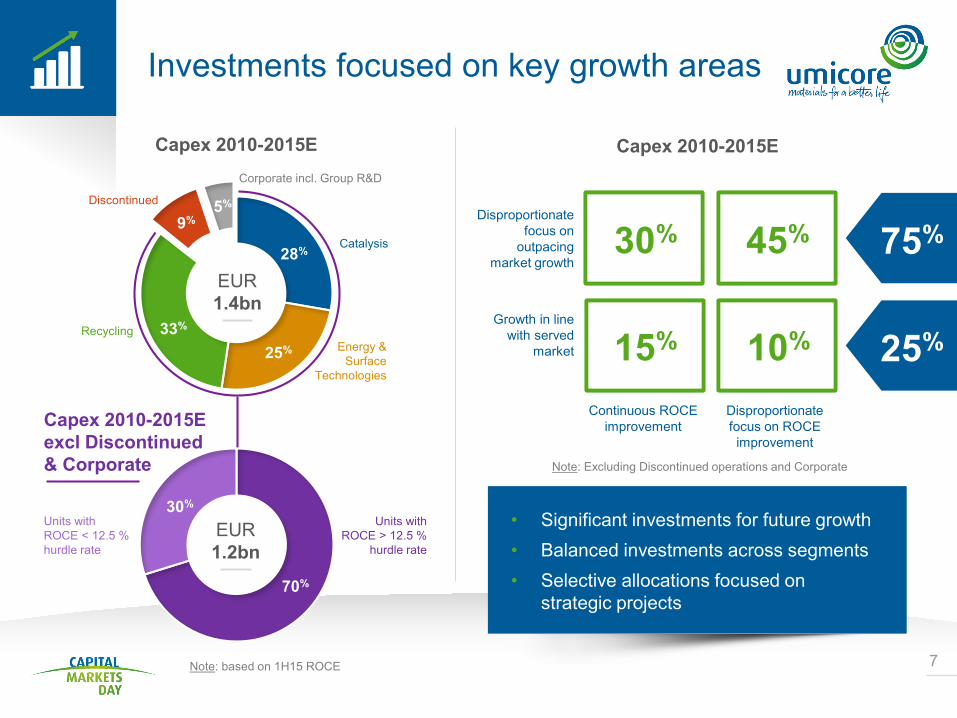
Investments focused on key growth areas
Disproportionate focus on ROCE improvement
Continuous ROCE improvement
Disproportionate focus on
outpacing market growth
Growth in line with served
market
30% 45%
10%15%
75%
25%
Corporate incl. Group R&D
Catalysis
Energy & Surface
Technologies
Recycling
Discontinued 5%
28%
25%
9%
EUR 1.4bn
33%
EUR 1.2bn
Units with ROCE < 12.5 % hurdle rate
Units withROCE > 12.5 %
hurdle rate
30%
70%
Capex 2010-2015E
Capex 2010-2015E excl Discontinued & Corporate
Note: based on 1H15 ROCE
• Significant investments for future growth• Balanced investments across segments• Selective allocations focused on
strategic projects
Capex 2010-2015E
Note: Excluding Discontinued operations and Corporate
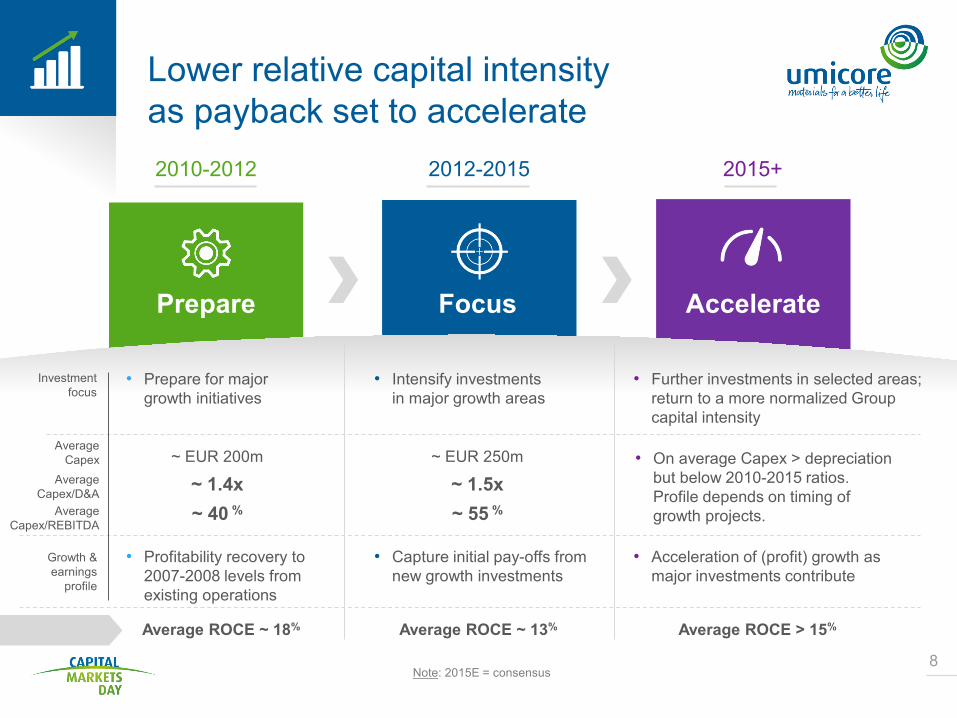
8
Lower relative capital intensity as payback set to accelerate2010-2012
Prepare
2012-2015
Focus
2015+
Accelerate
• Acceleration of (profit) growth as major investments contribute
• Prepare for major growth initiatives
• Intensify investments in major growth areas
• Further investments in selected areas; return to a more normalized Group capital intensity
~ EUR 200m
~ 1.4x~ 40 %
~ EUR 250m
~ 1.5x~ 55 %
• On average Capex > depreciation but below 2010-2015 ratios. Profile depends on timing of growth projects.
Average ROCE ~ 18% Average ROCE ~ 13% Average ROCE > 15%
Investment focus
Growth & earnings
profile
Average Capex
AverageCapex/D&A
AverageCapex/REBITDA
• Profitability recovery to 2007-2008 levels from existing operations
• Capture initial pay-offs from new growth investments
Note: 2015E = consensus

9
List of recent investments still to yield full contribution
Business Group
Business Unit Location Start-up
(expected)
New production facility Nowa Ruda, Poland Q4 2015
AC New technology development center Incheon, South Korea H2 2015
New production facility Hemaraj, Thailand H2 2016
RBM
Production capacity expansion Cheonan, South Korea H1 2016
Production capacity expansion Jiangmen, China H1 2016
CSM Expansion for Co fine powders Olen, Belgium 2015
RecyclingPMR Expansion of capacity by 40% Hoboken, Belgium 2016
Energy &Surface
Technologies
Catalysis
Total Capex: EUR 220m
10
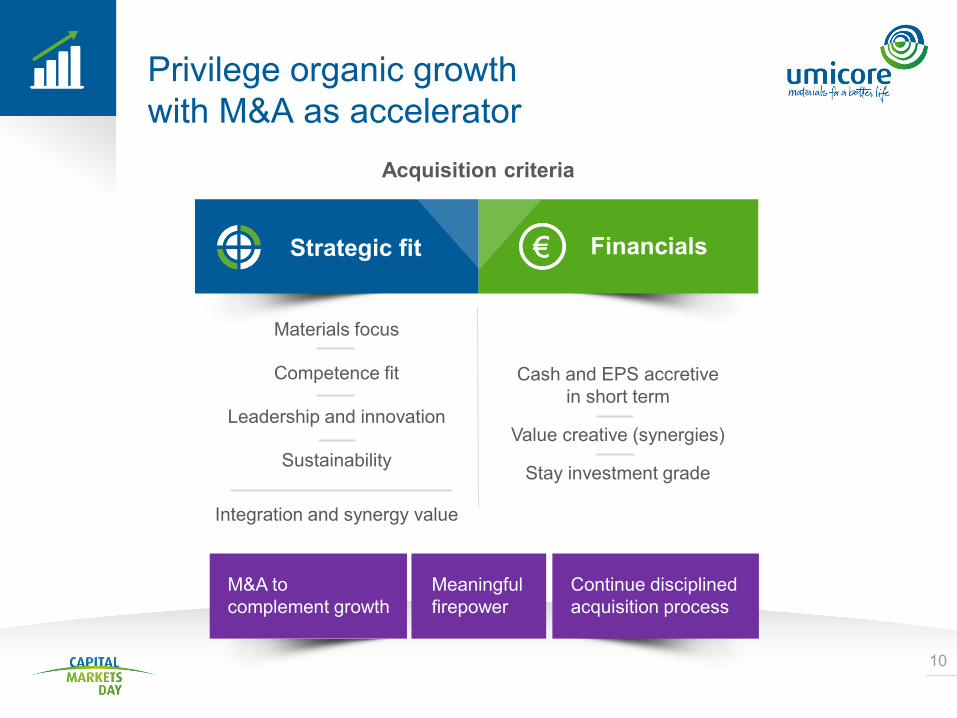
Privilege organic growth with M&A as accelerator
Materials focus
Competence fit
Leadership and innovation
Sustainability
Integration and synergy value
Cash and EPS accretive in short term
Value creative (synergies)
Stay investment grade
Acquisition criteria
Strategic fit Financials
Meaningful firepower
M&A to complement growth
Continue disciplined acquisition process

11
Consistent and broad base for value creation
0%1%2%3%4%5%6%7%8%
0
100
200
300
400
500
600
2010 2011 2012 2013 2014 1H15Post-tax return premium
Cumulative post-tax value creation
Post tax value creation (excl Discontinued operations)
18%
26%
41%
15%
Below 10.5% ROCE Above
15% ROCE
Between 12.5-15% ROCE
Between 10.5-12,5% ROCE
1H15 ROCE distribution based on Capital Employed
(excl Corporate & Discontinued operations)
Note: calculated as difference between effective post tax return on capital employed and 8.5 % post tax hurdle rate
Continue consistent value creation
Maintain 15%+ ROCE target rate
Value-based resource allocation
EUR m
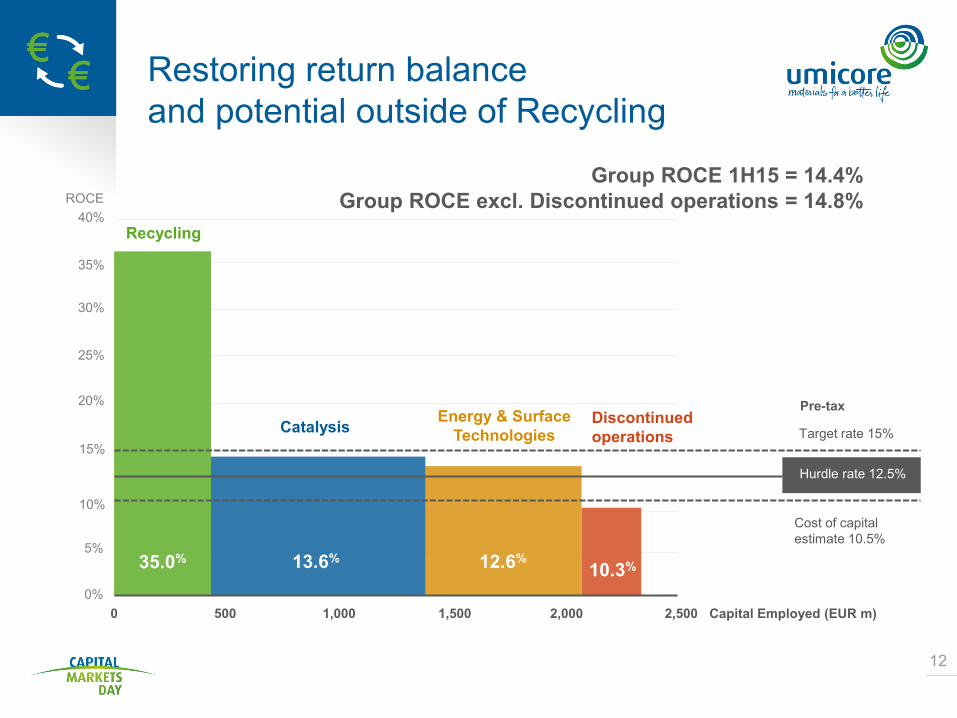
12
Restoring return balance and potential outside of Recycling
Target rate 15%Catalysis Energy & Surface Technologies
Discontinued operations
35.0%
0 500 1,000 1,500 2,000 2,500
13.6% 12.6%10.3%
Hurdle rate 12.5%
Cost of capital estimate 10.5%
Pre-tax
40%
35%
30%
25%
20%
15%
10%
5%
0%
Recycling
Capital Employed (EUR m)
Group ROCE 1H15 = 14.4%Group ROCE excl. Discontinued operations = 14.8%ROCE
13
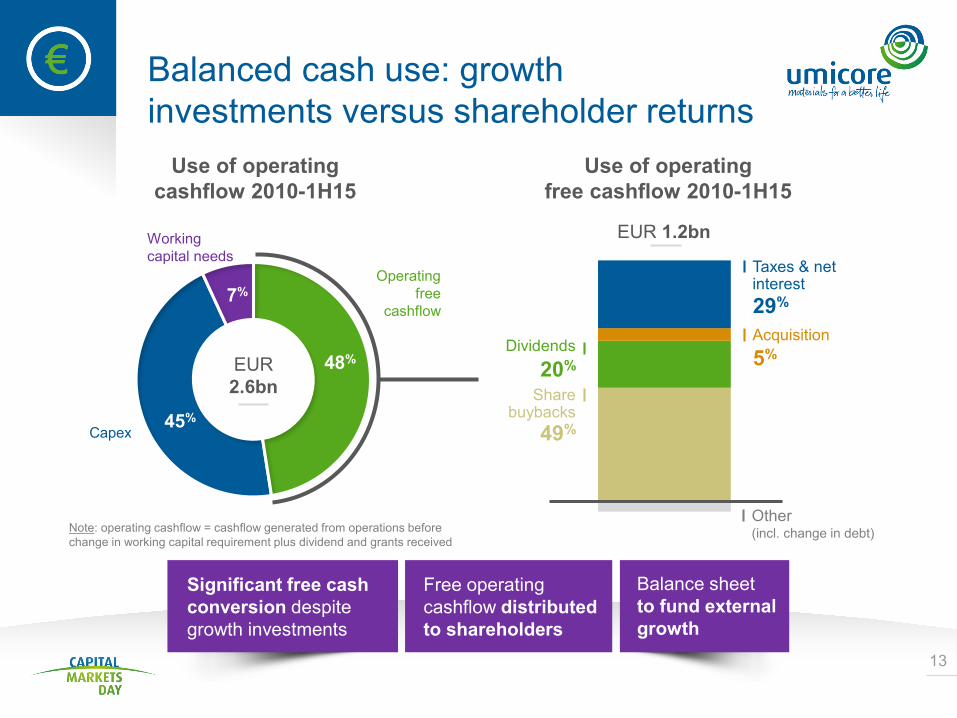
Balanced cash use: growth investments versus shareholder returns
Use of operating cashflow 2010-1H15
Use of operating free cashflow 2010-1H15
45%
7%
48%
Capex
Working capital needs
Operating free
cashflow
Taxes & net interest
Acquisition
Other (incl. change in debt)
Dividends
Share buybacks
49%
20% 5%
29%
Significant free cash conversion despite growth investments
Balance sheet to fund external growth
Free operating cashflow distributed to shareholders
EUR 2.6bn
Note: operating cashflow = cashflow generated from operations before change in working capital requirement plus dividend and grants received
EUR 1.2bn
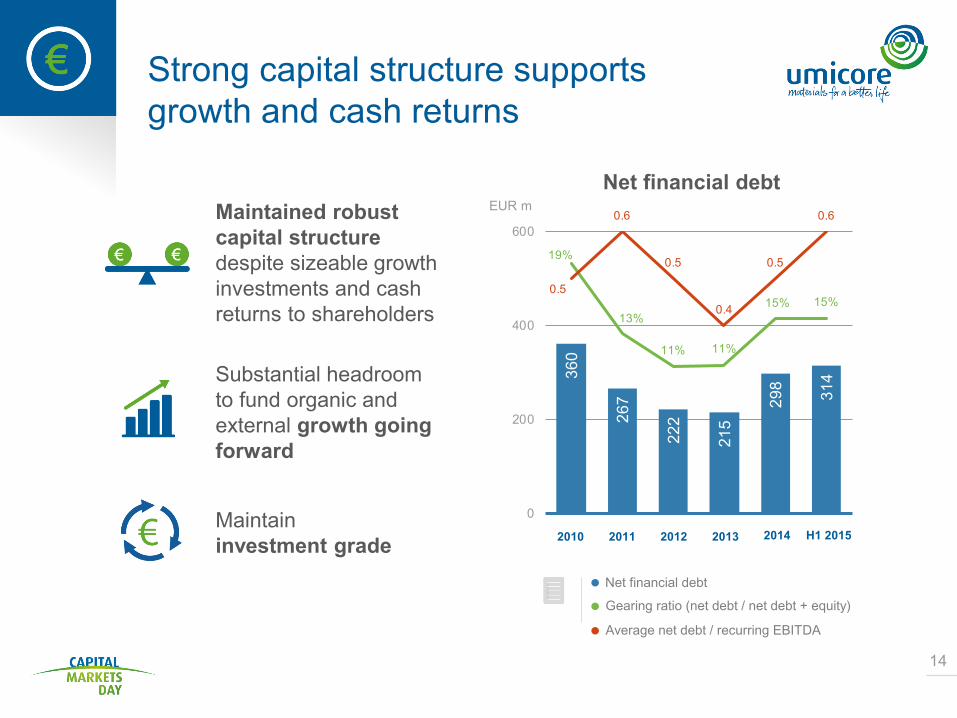
360
267
222
215
298 314
19%
13%
11% 11%
15% 15%0.5
0.6
0.5
0.4
0.5
0.6
0
200
400
600
2010 2011 2012 2013 2014 H1 2015
14
Strong capital structure supports growth and cash returns
Net financial debt
Gearing ratio (net debt / net debt + equity)
Net financial debt
Average net debt / recurring EBITDA
2010 2011 2012 2013 2014 H1 2015
Maintained robust capital structure despite sizeable growth investments and cash returns to shareholders
Substantial headroom to fund organic and external growth going forward
Maintain investment grade
EUR m

Investment in key growth areas
Strong growth profile
How we will achieve our 2020 goals
15
Solid cashflows
Focus on returns


