34
UMSYSTEM.EDU 1 University of Missouri Staff Compensation October 6, 2009 University of Missouri – Kansas City Betsy Rodriguez Vice President for Human Resources
| Date post: | 21-Dec-2015 |
| Category: |
Documents |
| View: | 219 times |
| Download: | 0 times |
UMSYSTEM.EDU 11
University of MissouriStaff Compensation
October 6, 2009University of Missouri – Kansas City
Betsy RodriguezVice President for Human Resources

UMSYSTEM.EDU 2UMSYSTEM.EDU 2
People Excellence Synergy
UM System Human Resources Strategic Plan 2009-2013
UMSYSTEM.EDU 33
Vision
University of Missouri is recognized as having a positive, inclusive, high performance culture based on cooperation and respect and where the work environment reflects a community that promotes work/life balance, values unique contributions, and allows individuals to make a difference through their service.

UMSYSTEM.EDU 44
Mission
People First: To provide strategic guidance for the implementation of best practice human resource management that enables UM excellence and values
our people as its primary resource.
UMSYSTEM.EDU 55
Critical Focus Areas
• Fully engaged workforce (people first)
• Effective processes
• Excellent service to customers
• Strategic resourcing

UMSYSTEM.EDU 66
People First: Total Rewards System
• Total Rewards System is driver of people strategy---making possible a diverse, high quality, engaged, and productive faculty and staff
• Compensation and rewards must align with and be part of university/campus strategic plans
• Total rewards sends a message to (prospective and current) employees
• Effective use of Total Rewards System resources requires philosophy, strategy, planning, analysis, and accountability
• And investment!

UMSYSTEM.EDU 77
Philosophy/Strategy Question
If we value people first, why do our budgets always begin with mandates such as utilities, maintenance, and insurance? Why isn’t compensation the first ‘mandate’?
Compare people assets to physical assets – we’ve deferred the ‘maintenance’ and that is causing structural problems.

UMSYSTEM.EDU 88
Additional Questions
• Can faculty and staff explain their salary level, esp in relation to similarly situated colleagues?
• Can faculty and staff explain their career path, and the compensation changes that accompany promotions?
• Can we reward longevity (seniority) and also pay for performance?
• How important is internal equity?• How much value do we get for the cost of
benefits?
UMSYSTEM.EDU 99
Consequences of Below Market Salaries• Higher turnover, and the associated greater cost of
training new faculty and staff• Longer time to fill positions and the costs of extended
vacancies in key positions• Filling positions with 2nd and even 3rd tier candidates
as top-tier candidates accept positions at organizations that provide higher levels of compensation (and the longer-term implications this has for the University's image, ability to draw students both within and out-of-state, impact on development and research funding, etc.)
• Lower morale and associated reduced productivity
UMSYSTEM.EDU 1010
Total Rewards Framework: CompensationBegins with philosophy (to mirror our vision): Examples… To provide total compensation that attracts and retains
high quality faculty and staff, and that rewards (seniority?) high performers.
To be competitive within appropriate occupational peer groups for high performing faculty and staff with programs that focus on recruitment and retention.
To be at the competitive average by campus, with a core set of centers of excellence that are leaders in their fields.

UMSYSTEM.EDU 1111
Total Rewards Framework: Compensation (con’t)
Includes a strategy: e.g., • Where are we now? – see next slide • Where do we want to be? • What needs to be done?• How is it funded?• How much focus on salary and benefits vs
other ‘rewards’?

UMSYSTEM.EDU 1212
Total Rewards Framework: Compensation (con’t)Is defined by a set of Objectives and/or Core Values:e.g.– for Salary:• Salary ranges will be established based on appropriate markets• Initial compensation will be within the established ranges, based on
experience and skills– with consideration for internal equity• Compensation changes will be based solely/mostly on merit• Merit will be determined by college/campus established metrics• Differentiation and decision making regarding high vs. low performance• Metrics will consider all areas of performance critical to university mission• Salary structure will manage employee growth and development• Faculty promotions will include a flat dollar amount or a % of salary• All employee groups will be treated equally for annual increases
(regardless of market position? Regardless of funding?)
Objectives lead to building and communicating salary STRUCTURE

UMSYSTEM.EDU 1313
Quick detour to review current structure
UMSYSTEM.EDU 1414
Salary Data: Hourly Employees
Hourly employees Total payroll $233 million + benefits $49.8 million
Service/Maintenance & Skilled Trades
• Titles such as Police Officer, Child Care Assistant, Food Services, Custodians, Power Plant Operators, Electricians, Pipefitters
• Approximately 2,150 employees• Majority are union eligible positions (about 20% are union
members) • Meet and confer for annual agreement, nonbinding• Average hourly rate = $14.50 (range from $8 to $31)

UMSYSTEM.EDU 1515
Salary Data: Hourly Employees
Hourly employees (continued)
Office administration / Support •Titles such as Administrative Assistant, Office Support Staff, Fiscal Assistant•Approximately 3,320 employees•Average hourly rate = $14.50 (range from $7.25 to $35.00)
Technical•Titles such as Research Technician, Optician Assistant, Broadcast Technician, Reactor Operator, Computer Operator, Hygienist•Approximately 2,050 employees•Average hourly rate = $16.75 (range from$8.00 to $39.50)

UMSYSTEM.EDU 1616
Salary Data: Hourly Employees
Salary Market Data – Hourly Employees
• Compared to local/regional marketsNote: Columbia IS the market for many positions
• Union salary structure is discussed during annual ‘meet and confer’
• Union salary structure is a step system by which employees in same title with same length of service receive same hourly pay

UMSYSTEM.EDU 1717
Salary Data: Salaried Employees
Salaried employeesTotal payroll $772 million + benefits $165 million
Professional
• Titles such as Programmer / Analyst, Attorney, Psychologist, Accountant, Engineer, Chemist
• About 4,100 employees• Average annual salary $50,400

UMSYSTEM.EDU 1818
Salary Data: Salaried Employees
Salaried employees (continued)
Administrative / Manager / Executive• Titles such as Farm Supervisor, Ticket Manager, Admissions Director,
Placement Director, Coach, Provost, Chancellor, President• About 1,900 employees• Average annual salary $79,000
UMSYSTEM.EDU 1919
Salary Data: Salaried Employees
Salary Market Data – Professional, Administrators and Executives
• Sources: Salary.com and other purchased or generated market databases
• Administrative work varies across many industries (e.g., agriculture, entertainment, sports, retail, finance, print, power generation, restaurant, resource management, housing, research, healthcare, student services)

UMSYSTEM.EDU 2020
Salary Data: Salaried Employees
Salary Market Data – Professional, Administrators and Executives (continued)
• Maintaining competitive pay across these industries is constant balancing act as each industry moves in response to economic conditions and labor markets
• Large salary differences across industries lead to issues of ‘fairness’ and ‘equity’ among university employees (e.g., typically student services have lower market salaries than finance)
• Assess markets and salary needs within Occupational Group(s) Exception: Senior Leadership and strategic valued positionare often individually compared to market

UMSYSTEM.EDU 2121
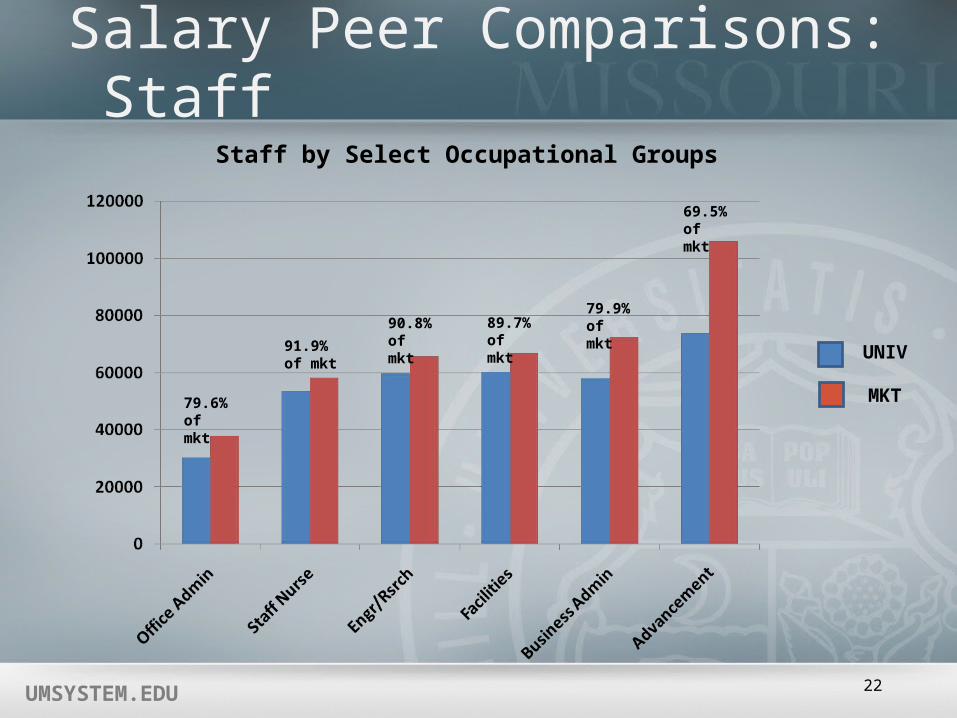
Salary Peer Comparisons: Staff
• Do not have complete data on every staff position compared to market
• Need to do significant work to develop accurate market comparisons (due to title inflation and other considerations)
• Selected 150 titles—salaried only for comparison
UMSYSTEM.EDU 22
79.6% of mkt
91.9% of mkt
90.8% of mkt
89.7% of mkt
79.9% of mkt
69.5% of mkt
MKT
UNIV
Salary Peer Comparisons: StaffStaff by Select Occupational Groups
UMSYSTEM.EDU 2323
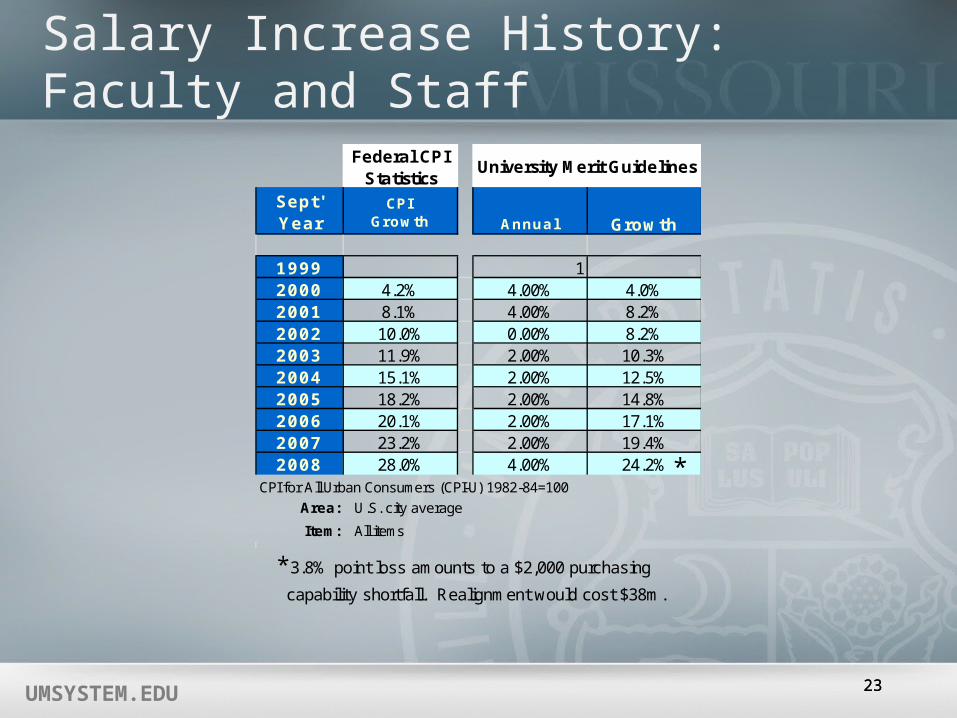
Salary Increase History: Faculty and Staff
Federal CPI Statistics
Sept' Year
CPIGrowth Annual Growth
1999 12000 4.2% 4.00% 4.0%2001 8.1% 4.00% 8.2%2002 10.0% 0.00% 8.2%2003 11.9% 2.00% 10.3%2004 15.1% 2.00% 12.5%2005 18.2% 2.00% 14.8%2006 20.1% 2.00% 17.1%2007 23.2% 2.00% 19.4%2008 28.0% 4.00% 24.2%
Area: U.S. city average
Item: All itemsArea:
University Merit Guidelines
* 3.8% point loss amounts to a $2,000 purchasing
capability shortfall. Realignment would cost $38m.
CPI for All Urban Consumers (CPI-U) 1982-84=100*
UMSYSTEM.EDU 2424
Total Rewards Framework (con’t)
Is defined by a set of Objectives and/or Core Values:
e.g.-- for other Compensation:• Compensation programs will be flexible to
meet individual, department, and campus needs
• Total Rewards considers issues beyond salary and benefits– total value proposition

UMSYSTEM.EDU 2525
Total Value Proposition
• What are other reasons/programs beyond traditional compensation (salary and benefits) that attract and retain faculty and staff?
• What do employees value? Faculty: Environment/culture, collegiality, academic freedom, recognition, shared governance, collaboration opportunities, gifted/high performing students, lab space/equipment, professional travel, work/life balance, etc.

UMSYSTEM.EDU 2626
Total Rewards Framework (con’t)
Must be based on Analysis
Our current staff compensation structure is decades out of date!

UMSYSTEM.EDU 2727
Total Rewards Framework (con’t)
Concludes with Accountability:• Require annual performance evaluations to
justify annual salary changes• Provide market data to decision makers• Hold decision makers responsible for ensuring
compensation objectives are met, or there is a strategy to get there
• Ensure faculty and staff understand the compensation philosophy, strategy, objectives

UMSYSTEM.EDU 2828
Cost of Salary Changes
Cost of salary increases:$638m operating (state) budget• Each 1% increase = $8 million• 2% salary increase would cost $16 million
How to pay for increases?• Tuition: 1% comp increase = 2% tuition increase• Other:
Increases in revenues Decreases in expenses (e.g. reduction in work force,
program closures, efficiency savings, vacancy savings)Do we allow variation by campus?
UMSYSTEM.EDU 2929
Quick Review of Benefits

UMSYSTEM.EDU 3030
Comparator Institution BenchmarksHewitt Associates Relative Value Study
Employer Paid Value Total Value
Index Rank Index Rank
Retirement 117.9 3rd 77.6 15th
Retirement* 101.1 7th 77.6 15th
Pre Retirement Death-Group Life 107.7 7th 91.2 10th
Long Term Disability 143.9 4th 107.9 8th
Dental 85.3 12th 93.0 12th
Preretirement Health 98.9 10th 102.8 8th
Post Retirement Health-prior to age 65 161.9 3rd 127.5 2nd
Post Retirement Health-age 65 and higher 88.4 8th 103.1 9th
All Post Retirement Health 116.3 8th 110.7 6th
All Benefits (Including Tuition) 106.3 6th 92.3 13th
All Benefits (Including Tuition)* 98.5 11th 92.3 13th
*After 7/1/09 pension plan amendment

UMSYSTEM.EDU 3131
Summary Observations of Benefits
• UM offers a competitive array of benefit programs that are currently slightly below the average of its peer group
• UM, strategically, assumes risk through self-insurance when appropriate
• UM employees, through premiums/contributions bear a significant portion of the cost of providing UM benefit programs

UMSYSTEM.EDU 3232
Summary Observations of Benefits
• UM employees, at the time of purchasing health care services bear a significant portion of cost for services rendered
• Areas of significant deviation from the average of the peer group include:
Above average Employer Paid Value of Long Term Disability Base Plan Employer Paid Value of Post Retirement/Pre 65 Medical Benefits
Below Average Employer Paid Value and Total Value of Dental Benefits
UMSYSTEM.EDU 3333
Summary Observations of Benefits
• The 7/1/09 change that requires employees to contribute to the pension plan has resulted in a decrease in UM’s ranking among peer institutions in both the pension and overall categories
• The majority of peer institutions continue to offer subsidized post employment health care benefits
• UM is unique in offering a defined benefit plan as the primary pension plan avenue

UMSYSTEM.EDU 3434
History of Actual UM Contribution Rates% of payroll


