Unaudited interim condensed financial statements For the six month period ended 30 th June 2018 Registered office and principal place of business: Bank Dhofar Building Bank Al Markazi street Post Box 1507,Ruwi Postal Code 112 Sultanate of Oman
Transcript
Unaudited interim condensed financial statements For the six month period ended 30th June 2018
Registered office and principal place of business: Bank Dhofar Building Bank Al Markazi street Post Box 1507,Ruwi Postal Code 112 Sultanate of Oman
CONTENTS OF THE INTERIM CONDENSED FINANCIAL STATEMENTS
Page
The Board of Director’s report 1 & 2 Interim condensed statement of financial position 4 Interim condensed statement of comprehensive income 5 Interim condensed statement of changes in equity 6 to 8 Interim condensed statement of cash flows 9 Notes to the interim condensed financial statements 10 – 43
BANK DHOFAR S.A.O.G.
THE BOARD OF DIRECTORS’ REPORT FOR THE QUARTER ENDED
30th June 2018
Dear Shareholders,
On behalf of the Board of Directors of Bank Dhofar S.A.O.G., I am pleased to present to you the Bank’s Financial Statements for the quarter ended 30th June 2018.
The Bank’s Financial Performance during first half of 2018
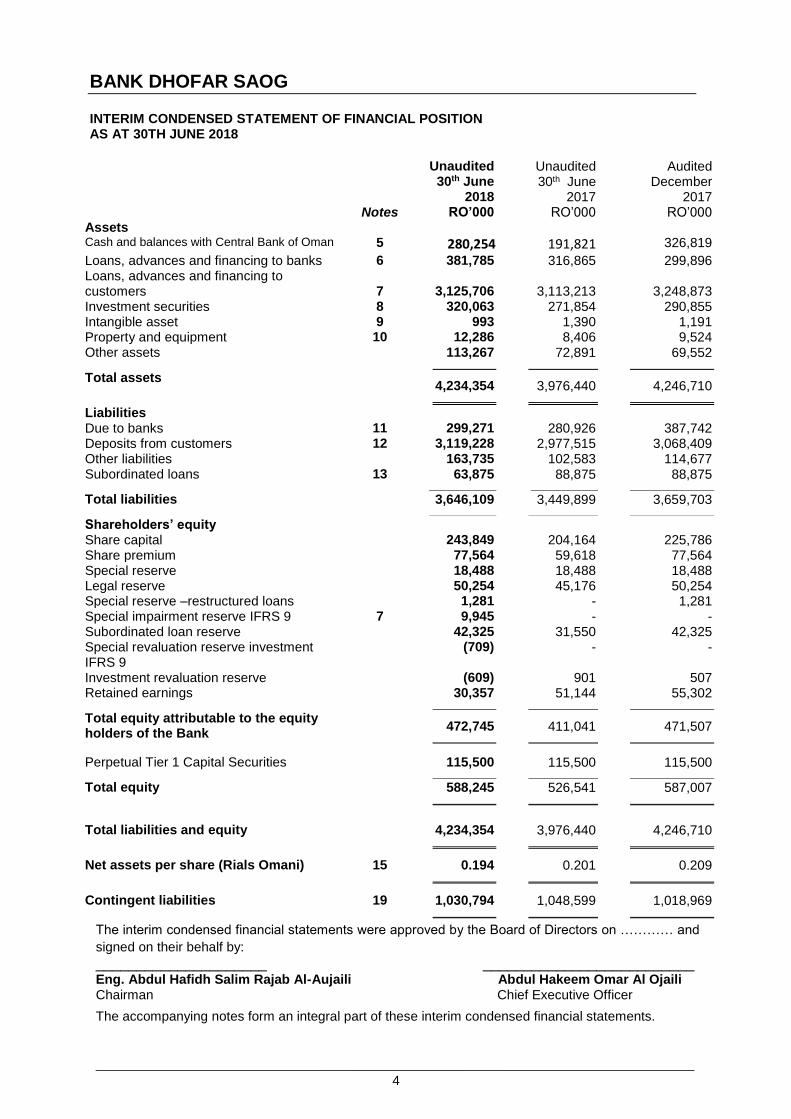
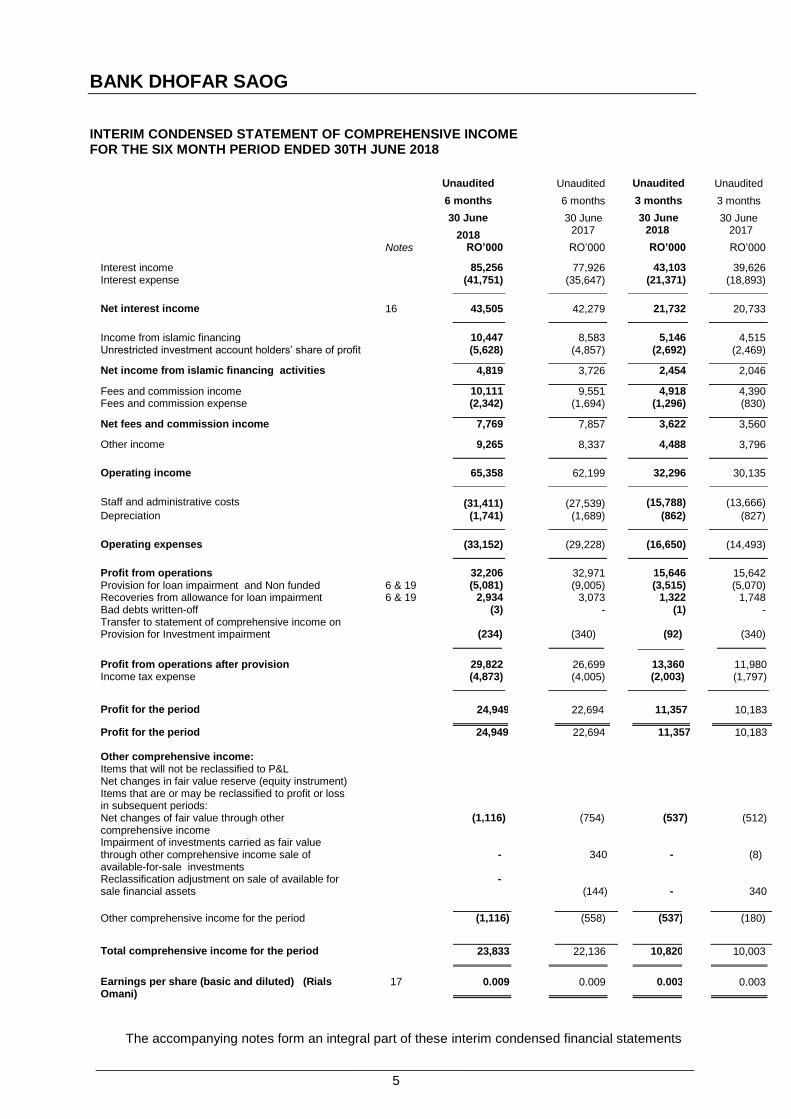
The bank posted a net profit of OMR 24.949 million for the first half of 2018 compared to OMR 22.694 million same period last year, registering a year-on-year growth of 9.94%. Net Loans, Advances and Financing to customers’ is at OMR 3.126 billion as at 30th June 2018, compared to OMR 3.113 billion at the end of 30th June 2017, 0.42% increase. Customer Deposits, including Islamic deposits registered a growth of 4.73% to reach OMR 3.119 billion as at 30th June 2018 as compared to OMR 2.978 billion as at 30th June 2017. Net interest income and income from Islamic Financing activities for the six-months period ended 30th June 2018 stood at OMR 48.32 million compared to OMR 46.00 million for the first half of 2017, an increase of 5.04% year-on-year. Moreover, Non-interest income such as fees and commissions, foreign exchange profit, investment income etc. grew by 5.25% reaching OMR 17.04 during the 6-month period ended 30th of June 2018 million as against OMR 16.19 million for the same period last year. Total operating income reached OMR 65.36 million during first half 2018 as against OMR 62.19 million for the corresponding period of 2017, an increase of 5.10%. Operating cost to Operating Income ratio for the six-months period ended 30th June 2018 is at 50.72% as compared to 46.99% during the same period in 2017. Net provisions for loan impairment improved by 62.04% to OMR 2.38 million for the six-month period ended 30th June 2018 as against OMR 6.27 million during the same period of last year mainly due to recent changes in provision (Expected Credit Loss) calculation in compliance with International Financial Reporting Standards 9 (IFRS-9). Non-performing loans to gross loans ratio increased from 2.92% as at 30th June 2017 to 3.44% as at 30th June 2018, while Non-performing loans, net of interest suspense, to gross loans ratio stood at 1.86% as at 30th June 2018 as against 1.59% during the corresponding period of year 2017. The earnings per share (EPS) for the 6-months period ended 30th June 2018 are 0.009 similar to corresponding period of year 2017 of OMR 0.009.
Maisarah Financial Performance Highlights:-
Maisarah gross financing portfolio has grown from RO 351.15 million as at 30th June 2017 to OMR 369.29 million as at 30th June 2018, a growth of 5.17%. Gross Sukuk investment portfolio increased by 31.11% from OMR 32.139 million as at 30th June 2017 to OMR 42.139 million as at 30th June 2018. Total customer deposits is at OMR 312.44 million on 30th of June 2018, compared to OMR 314.99 30th June 2017. The net financing income after cost of funds increased by 29.33% year-on-year reaching OMR 4.819 million during half year ended 30th June 2018 compared to OMR 3.726 million same period 2017. Non-financing Income such as fees and commissions, foreign exchange profit, investment income and other income have increased by 77.47% to OMR 1.977 million first half 2018 compared to OMR 1.114 million first half of 2017. Cost to income ratio have improved to 49.60% for the period ended 30th June 2018 compared to 63.49% during same period of year 2017. Maisarah posted 6-months year to date profit before tax of OMR 3.456 million, an increase of 317.90% compared first half of 2017, OMR 827,000 thousand.
Awards & Accolades
Following key awards were won by the Bank during six months period ended 30th June 2018 and those awards are testimony to the continued efforts put in by the Bank in developing the Bank’s business:
No. 1 in Large Sized Banks Category at Best Banks Report by Oman Economic Review (OER)
Best Islamic bank in Oman - Maisarah Islamic Banking Services at the Middle East Banking Awards 2017 (EMEA Finance)
Best Corporate Banking Institution – Oman in The Business Awards 2017 by MEA Markets
Best Islamic Retail Bank Oman 2017 – Maisarah Islamic Banking by Global Banking & Finance Review
The Business Excellence Award from the BIZZ AWARDS (World Confederation of Business) 2018
Best mobile app from Pan Arab Web Awards 2018
Best Private Bank Oman 2017 – BankDhofar by Global Banking & Finance Review
Corporate Social Responsibility (CSR):
The Board of Directors contributed OMR 1 million in a demonstration of Bank’s support to the citizens in Dhofar and Wusta governorates to support the repair and restoration efforts for the damages caused by Cyclone Mekunu that hit Dhofar region in May 2018. Within the same context, BankDhofar also offered loan instalment deferments for customers in Dhofar Governorate as support to the affected families. BankDhofar has always been at the forefront in providing support to the community and continue delivering on its commitment to innovating strategic sustainable CSR initiatives ensuring lasting positive benefits to the local community.
Acknowledgment
On behalf of the Board, I would like to thank our valuable customers for their patronage and confidence reposed in the Bank. I thank the shareholders for the continuous support and the Bank’s diligent staff and management for the good performance during the period.
The Board of Directors also thanks the Central Bank of Oman and the Capital Market Authority for their valuable guidance to the local banking sector and the listed companies
Finally, the Board of Directors and all staff of the Bank would like to express our most sincere gratitude to His Majesty Sultan Qaboos Bin Said for his wise leadership and generous support to the private sector.
Profit from operations 32,206 32,971 15,646 15,642 Provision for loan impairment and Non funded 6 & 19 (5,081) (9,005) (3,515) (5,070) Recoveries from allowance for loan impairment 6 & 19 2,934 3,073 1,322 1,748 Bad debts written-off (3) - (1) - Transfer to statement of comprehensive income on Provision for Investment impairment
(234)
(340)
(92)
(340)
Profit from operations after provision 29,822 26,699 13,360 11,980 Income tax expense (4,873) (4,005) (2,003) (1,797)
Profit for the period 24,949 22,694 11,357 10,183
Profit for the period 24,949
22,694 11,357 10,183
Other comprehensive income: Items that will not be reclassified to P&L Net changes in fair value reserve (equity instrument) Items that are or may be reclassified to profit or loss in subsequent periods:
Net changes of fair value through other comprehensive income
(1,116) (754) (537) (512)
Impairment of investments carried as fair value through other comprehensive income sale of available-for-sale investments
-
340
-
(8)
Reclassification adjustment on sale of available for sale financial assets
- (144)
-
340
Other comprehensive income for the period (1,116) (558) (537) (180)
Total comprehensive income for the period 23,833 22,136 10,820 10,003
Earnings per share (basic and diluted) (Rials Omani)
17 0.009 0.009 0.003 0.003
The accompanying notes form an integral part of these interim condensed financial statements
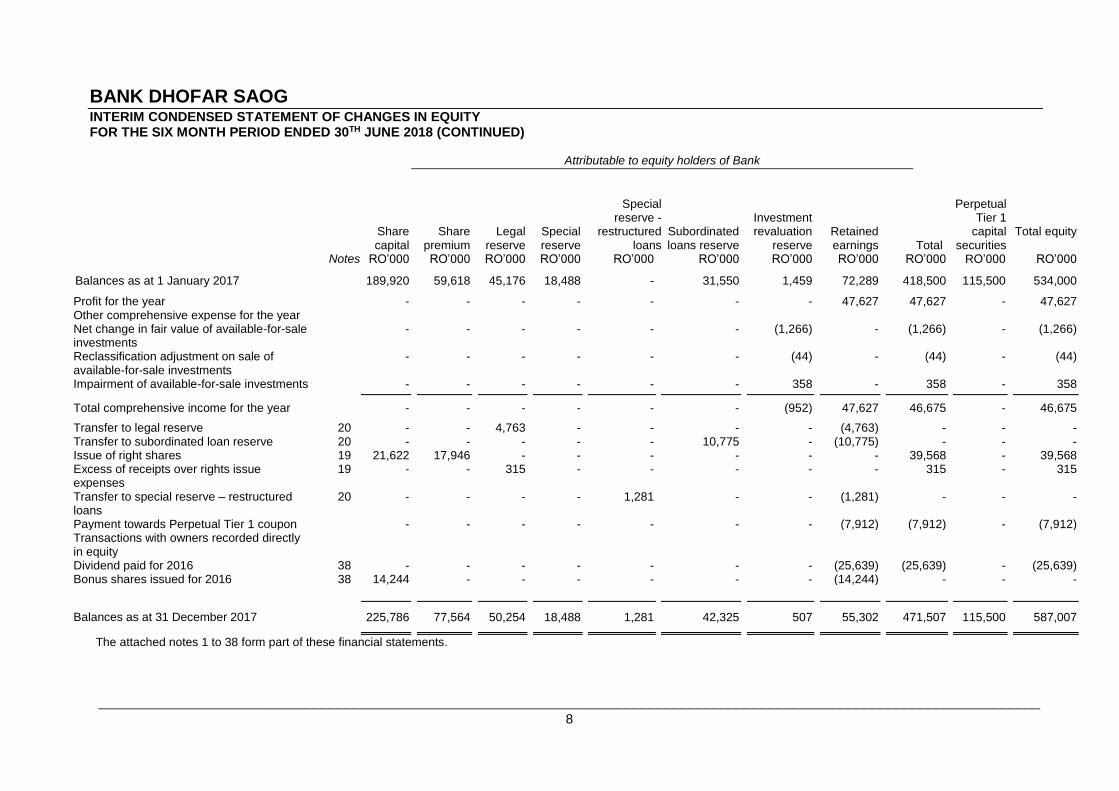
Balances as at 1 January 2017 189,920 59,618 45,176 18,488 - 31,550 1,459 72,289 418,500 115,500 534,000
Profit for the year - - - - - - - 47,627 47,627 - 47,627 Other comprehensive expense for the year Net change in fair value of available-for-sale investments
- - - - - - (1,266) - (1,266) - (1,266)
Reclassification adjustment on sale of available-for-sale investments
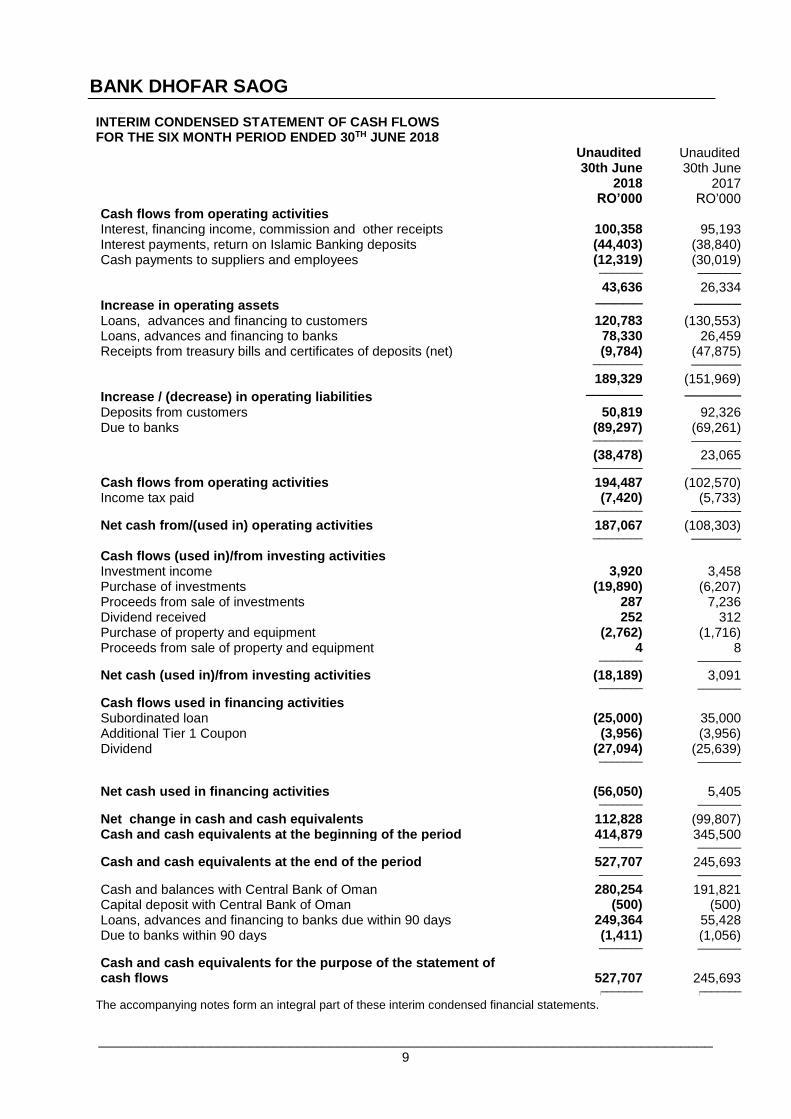
INTERIM CONDENSED STATEMENT OF CASH FLOWS FOR THE SIX MONTH PERIOD ENDED 30TH JUNE 2018
Unaudited 30th June
2018
Unaudited 30th June
2017 RO’000 RO’000 Cash flows from operating activities Interest, financing income, commission and other receipts 100,358 95,193 Interest payments, return on Islamic Banking deposits (44,403) (38,840) Cash payments to suppliers and employees (12,319) (30,019) ─────── ───────
43,636 26,334
Increase in operating assets ───── ─────
Loans, advances and financing to customers 120,783 (130,553) Loans, advances and financing to banks 78,330 26,459 Receipts from treasury bills and certificates of deposits (net) (9,784) (47,875) ──────── ────────
189,329 (151,969)
Increase / (decrease) in operating liabilities ────── ──────
Deposits from customers 50,819 92,326 Due to banks (89,297) (69,261) ──────── ────────
(38,478) 23,065 ──────── ────────
Cash flows from operating activities 194,487 (102,570) Income tax paid (7,420) (5,733) ──────── ────────
Net cash from/(used in) operating activities 187,067 (108,303) ──────── ────────
Cash flows (used in)/from investing activities Investment income 3,920 3,458 Purchase of investments (19,890) (6,207) Proceeds from sale of investments 287 7,236 Dividend received 252 312 Purchase of property and equipment (2,762) (1,716) Proceeds from sale of property and equipment 4 8 ─────── ───────
Net cash (used in)/from investing activities (18,189) 3,091 ─────── ───────
Net change in cash and cash equivalents 112,828 (99,807) Cash and cash equivalents at the beginning of the period 414,879 345,500 ─────── ───────
Cash and cash equivalents at the end of the period 527,707 245,693 ─────── ───────
Cash and balances with Central Bank of Oman 280,254 191,821 Capital deposit with Central Bank of Oman (500) (500) Loans, advances and financing to banks due within 90 days 249,364 55,428 Due to banks within 90 days (1,411) (1,056) ─────── ───────
Cash and cash equivalents for the purpose of the statement of cash flows
527,707
245,693
[─────── [─────── The accompanying notes form an integral part of these interim condensed financial statements.
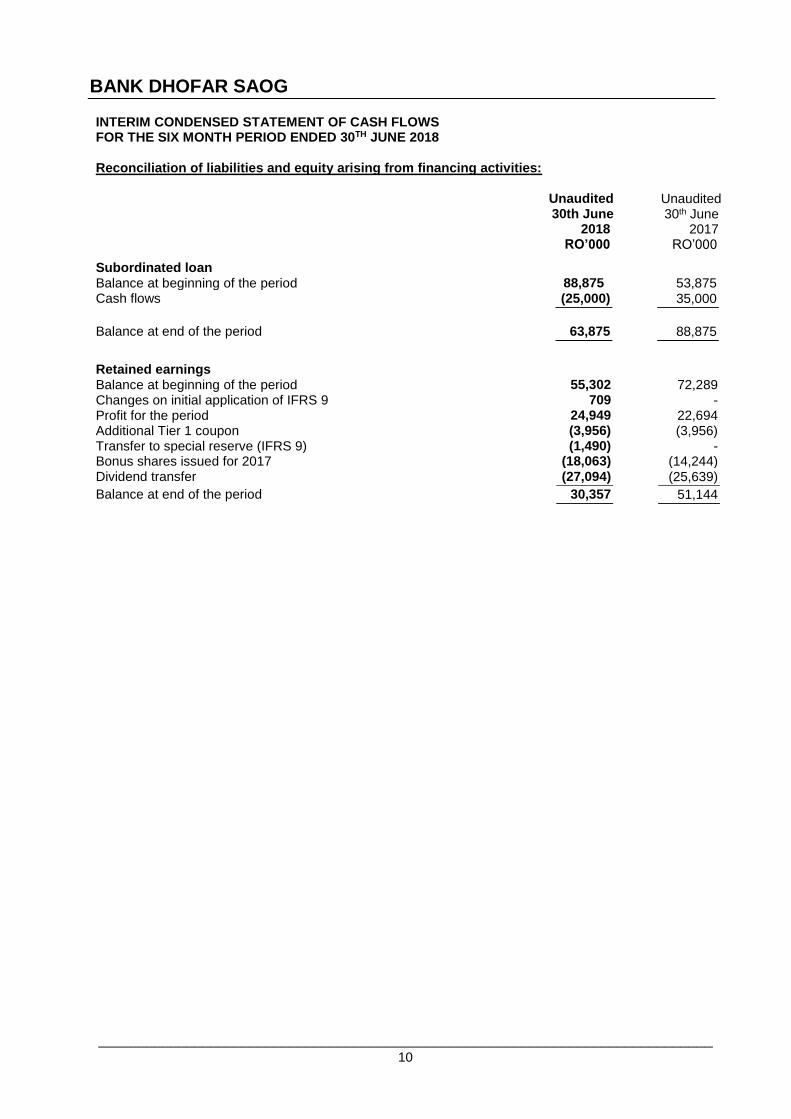
INTERIM CONDENSED STATEMENT OF CASH FLOWS FOR THE SIX MONTH PERIOD ENDED 30TH JUNE 2018 Reconciliation of liabilities and equity arising from financing activities:
Unaudited 30th June
2018
Unaudited 30th June
2017 RO’000 RO’000
Subordinated loan Balance at beginning of the period 88,875 53,875 Cash flows (25,000) 35,000 Balance at end of the period 63,875 88,875
Retained earnings Balance at beginning of the period 55,302 72,289 Changes on initial application of IFRS 9 709 - Profit for the period 24,949 22,694 Additional Tier 1 coupon (3,956) (3,956) Transfer to special reserve (IFRS 9) (1,490) - Bonus shares issued for 2017 (18,063) (14,244) Dividend transfer (27,094) (25,639)
NOTES TO THE INTERIM CONDENSED FINANCIAL STATEMENTS FOR THE SIX MONTH PERIOD ENDED 30TH JUNE 2018
3 Changes in significant accounting policies (continued)
A . IFRS 9 Financial instruments (continued)
Impairment (continued)
Forward-looking information
The measurement of expected credit losses for each stage and the assessment of significant increases
in credit risk considers information about past events and current conditions as well as reasonable
and supportable forecasts of future events and economic conditions. The estimation and application
of forward-looking information requires significant judgement.
Macroeconomic factors
In its models, the Bank relies on a broad range of forward looking information as economic inputs,
such as: real gross domestic product (GDP) growth and oil revenue (as % of GDP). The inputs and
models used for calculating expected credit losses may not always capture all characteristics of the
market at the date of the financial statements. To reflect this, qualitative adjustments or overlays are
made as temporary adjustments using expert credit judgement.
Assessment of significant increase in credit risk
When determining whether the risk of default on a financial instrument has increased significantly
since initial recognition, the Bank considers reasonable and supportable information that is relevant
and available without undue cost or effort. This includes both quantitative and qualitative
information and analysis, based on the Bank’s historical experience and expert credit assessment and
including forward-looking information.
The following quantitative guidelines are used to determine the staging of accounts: 1. An account will migrate to stage 2 if any of the changes in rating below are met
For risk grades 1 – 4: >= 3 notch downgrade
Risk grade 5: 2 notch downgrade
Risk grade 6 and 7: 1 notch downgrade
2. An account will also migrate to stage 2 if it is more than 30 days past due
3. An account will also be considered stage 2 if has been placed under special mention
In addition to the above, qualitative criteria as per the CBO guidelines (BM 1149, Para 12
(d)), for assessing the significant increase in credit risk are applicable to corporate clients
NOTES TO THE INTERIM CONDENSED FINANCIAL STATEMENTS FOR THE SIX MONTH PERIOD ENDED 30TH JUNE 2018
3. Changes in significant accounting policies (continued)
A. IFRS 9 Financial instruments (continued)
Hedge accounting
IFRS9 introduces a new hedge accounting model that expands the scope of hedged items and risks
eligible for hedge accounting and alignes hedge accounting more closely with risk management
objectives and strategy with more qualitative approach to assess hedge effectiveness. IFRS9 also
introduces new requirements on rebalancing hedge relationships and prohibiting voluntary
discontinuation of hedge accounting.
The Bank has entered into interest rate swaps to hedge the variability in cash flows arising from
changes in interest rates relating to investments. The types of hedge accounting relationships that the
Bank currently designates meet the requirements of IFRS 9 and are aligned with Bank’s risk
management strategy and objective.
Based on Bank’s assessment, there is no impact from the adoption of new standard on hedge
accounting.
Transition
Changes in accounting policies resulting from the adoption of IFRS 9 have been applied
retrospectively, except as described below.
• Comparative periods have not been restated. Differences in the carrying amounts of financial assets
and financial liabilities resulting from the adoption of IFRS 9 are recognised in retained earnings and
reserves as at 1 January 2018. Accordingly, the information presented for 2017 does not reflect the
requirements of IFRS 9 and therefore is not comparable to the information presented for 2018 under
IFRS 9.
• The following assessments have been made on the basis of the facts and circumstances that existed
at the date of initial application.
- The determination of the business model within which a financial asset is held. - The designation and revocation of previous designations of certain financial assets and
financial liabilities as measured at FVTPL.
- The designation of certain investments in equity instruments not held for trading as at
FVOCI.
- For financial liabilities designated as at FVTPL, the determination of whether presenting the effects
of changes in the financial liability’s credit risk in OCI would create or enlarge an accounting
mismatch in profit or loss.
• If a debt security had low credit risk at the date of initial application of IFRS 9, then the Bank has
assumed that credit risk on the asset had not increased significantly since its initial recognition.
For more information and details on the changes and implications resulting from the adoption of
NOTES TO THE INTERIM CONDENSED FINANCIAL STATEMENTS FOR THE SIX MONTH PERIOD ENDED 30TH JUNE 2018
3 Changes in significant accounting policies (continued)
A. IFRS 9 Financial instruments (continued)
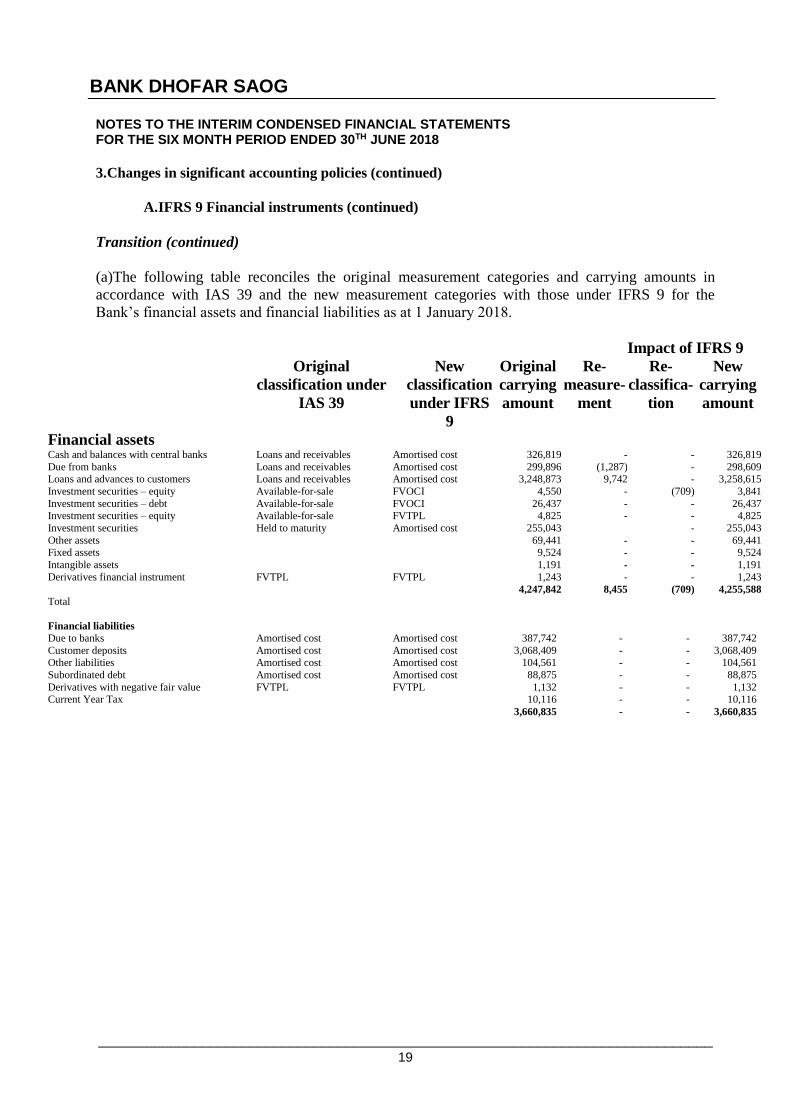
Transition (continued)
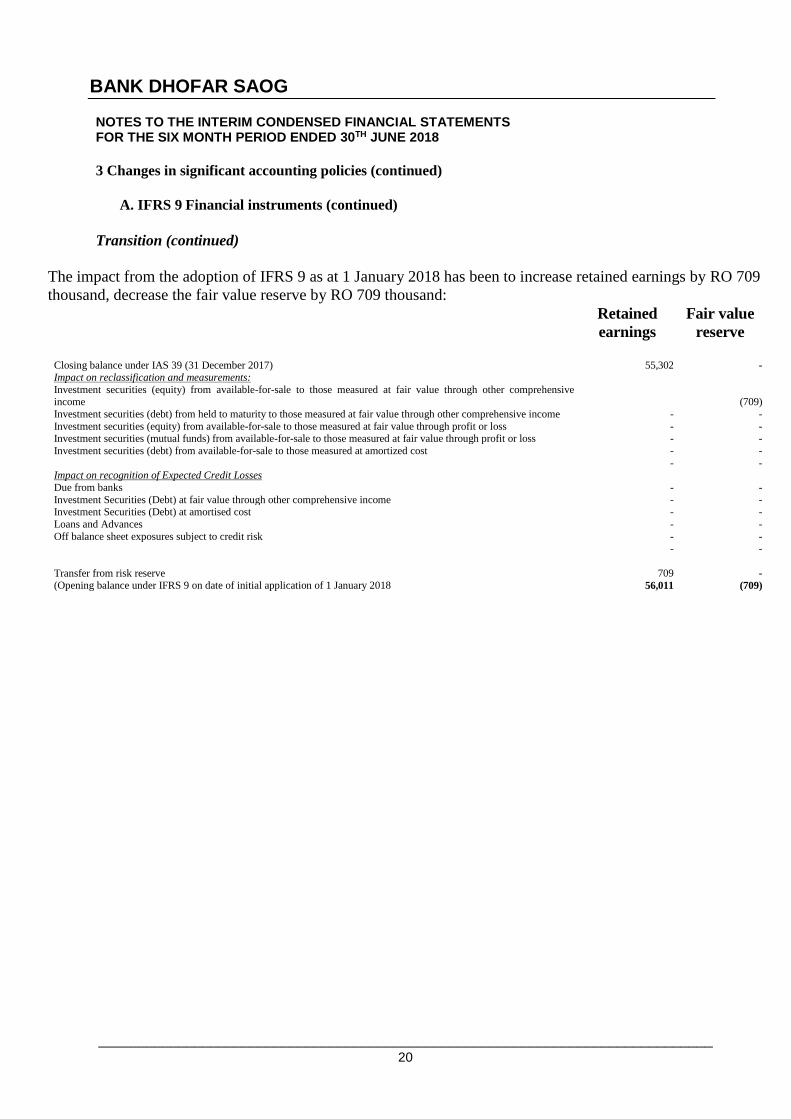
The impact from the adoption of IFRS 9 as at 1 January 2018 has been to increase retained earnings by RO 709
thousand, decrease the fair value reserve by RO 709 thousand:
Retained
earnings
Fair value
reserve
Closing balance under IAS 39 (31 December 2017) 55,302 - Impact on reclassification and measurements:
Investment securities (equity) from available-for-sale to those measured at fair value through other comprehensive income
XX
(709)
Investment securities (debt) from held to maturity to those measured at fair value through other comprehensive income - -
Investment securities (equity) from available-for-sale to those measured at fair value through profit or loss - - Investment securities (mutual funds) from available-for-sale to those measured at fair value through profit or loss - -
Investment securities (debt) from available-for-sale to those measured at amortized cost - -
- - Impact on recognition of Expected Credit Losses
Due from banks - -
Investment Securities (Debt) at fair value through other comprehensive income - - Investment Securities (Debt) at amortised cost - -
Loans and Advances - -
Off balance sheet exposures subject to credit risk - -
- -
Transfer from risk reserve 709 - (Opening balance under IFRS 9 on date of initial application of 1 January 2018 56,011 (709)
NOTES TO THE INTERIM CONDENSED FINANCIAL STATEMENTS FOR THE SIX MONTH PERIOD ENDED 30TH JUNE 2018
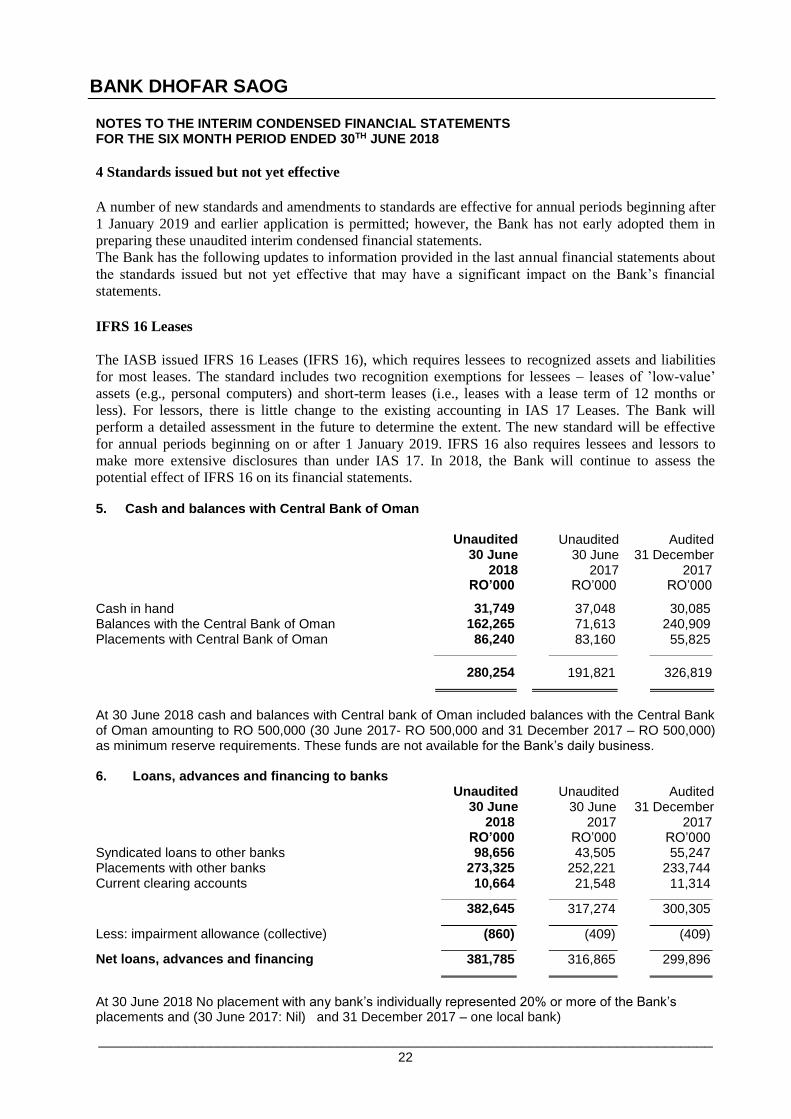
4 Standards issued but not yet effective
A number of new standards and amendments to standards are effective for annual periods beginning after
1 January 2019 and earlier application is permitted; however, the Bank has not early adopted them in
preparing these unaudited interim condensed financial statements.
The Bank has the following updates to information provided in the last annual financial statements about
the standards issued but not yet effective that may have a significant impact on the Bank’s financial
statements.
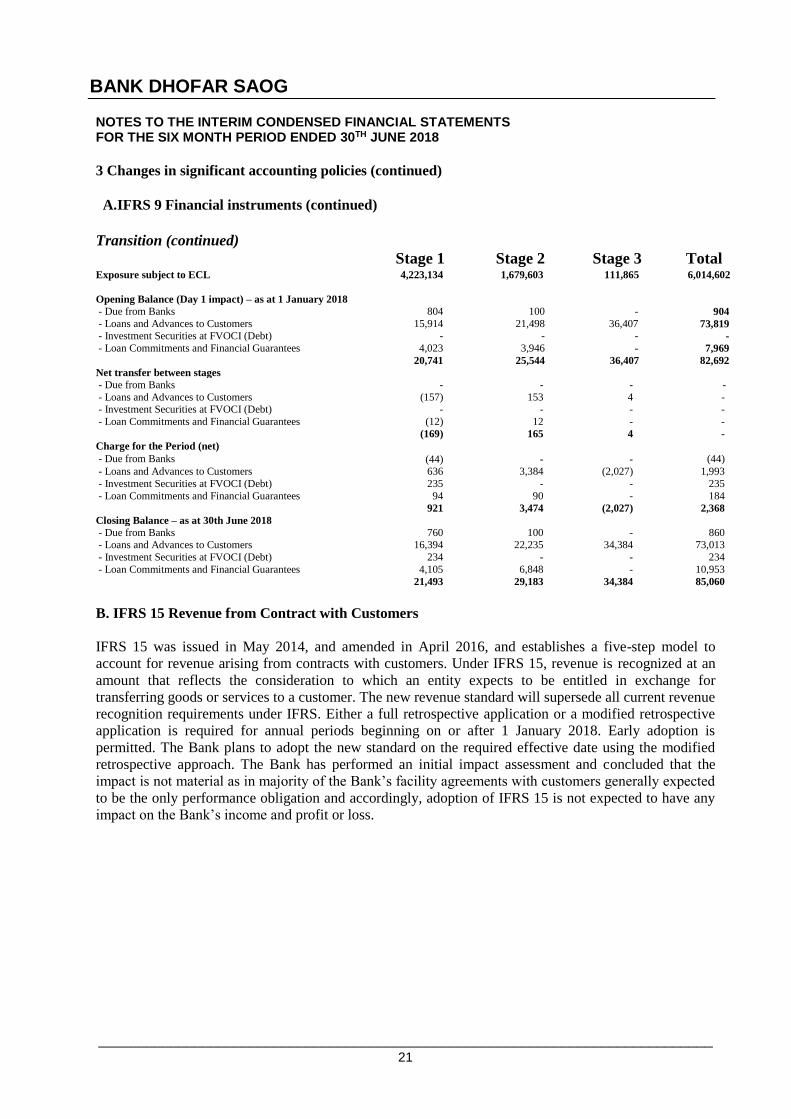
IFRS 16 Leases
The IASB issued IFRS 16 Leases (IFRS 16), which requires lessees to recognized assets and liabilities
for most leases. The standard includes two recognition exemptions for lessees – leases of ’low-value’
assets (e.g., personal computers) and short-term leases (i.e., leases with a lease term of 12 months or
less). For lessors, there is little change to the existing accounting in IAS 17 Leases. The Bank will
perform a detailed assessment in the future to determine the extent. The new standard will be effective
for annual periods beginning on or after 1 January 2019. IFRS 16 also requires lessees and lessors to
make more extensive disclosures than under IAS 17. In 2018, the Bank will continue to assess the
potential effect of IFRS 16 on its financial statements. 5. Cash and balances with Central Bank of Oman
Unaudited 30 June
2018
Unaudited 30 June
2017
Audited 31 December
2017 RO’000 RO’000 RO’000
Cash in hand 31,749 37,048 30,085 Balances with the Central Bank of Oman 162,265 71,613 240,909 Placements with Central Bank of Oman 86,240 83,160 55,825
280,254 191,821 326,819
At 30 June 2018 cash and balances with Central bank of Oman included balances with the Central Bank of Oman amounting to RO 500,000 (30 June 2017- RO 500,000 and 31 December 2017 – RO 500,000) as minimum reserve requirements. These funds are not available for the Bank’s daily business. 6. Loans, advances and financing to banks
Unaudited 30 June
2018
Unaudited 30 June
2017
Audited 31 December
2017 RO’000 RO’000 RO’000
Syndicated loans to other banks 98,656 43,505 55,247 Placements with other banks 273,325 252,221 233,744 Current clearing accounts 10,664 21,548 11,314
Net loans, advances and financing 381,785 316,865 299,896
At 30 June 2018 No placement with any bank’s individually represented 20% or more of the Bank’s placements and (30 June 2017: Nil) and 31 December 2017 – one local bank)
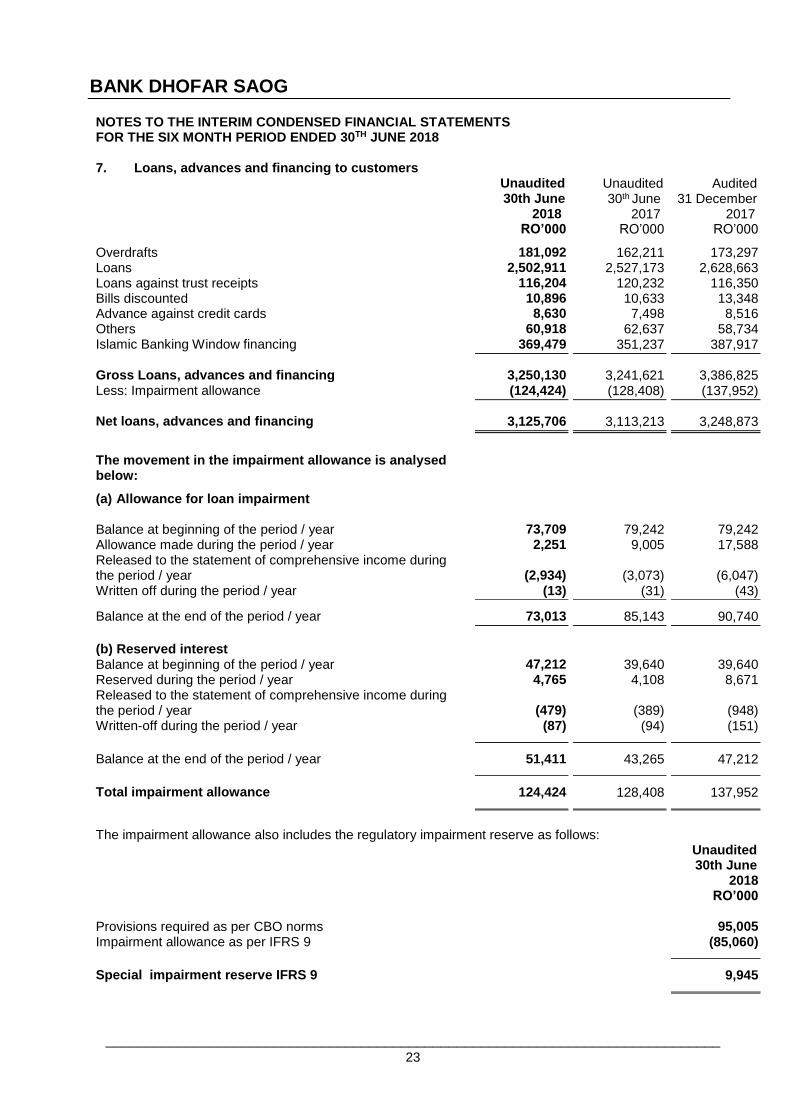
Net loans, advances and financing 3,125,706 3,113,213 3,248,873
The movement in the impairment allowance is analysed below:
(a) Allowance for loan impairment
Balance at beginning of the period / year 73,709 79,242 79,242 Allowance made during the period / year 2,251 9,005 17,588 Released to the statement of comprehensive income during the period / year (2,934) (3,073) (6,047) Written off during the period / year (13) (31) (43) Balance at the end of the period / year 73,013 85,143 90,740
(b) Reserved interest
Balance at beginning of the period / year 47,212 39,640 39,640 Reserved during the period / year 4,765 4,108 8,671 Released to the statement of comprehensive income during the period / year (479) (389)
(948)
Written-off during the period / year (87) (94) (151)
Balance at the end of the period / year 51,411 43,265 47,212
Total impairment allowance 124,424 128,408 137,952
The impairment allowance also includes the regulatory impairment reserve as follows:
Unaudited 30th June
2018 RO’000 Provisions required as per CBO norms 95,005 Impairment allowance as per IFRS 9 (85,060)
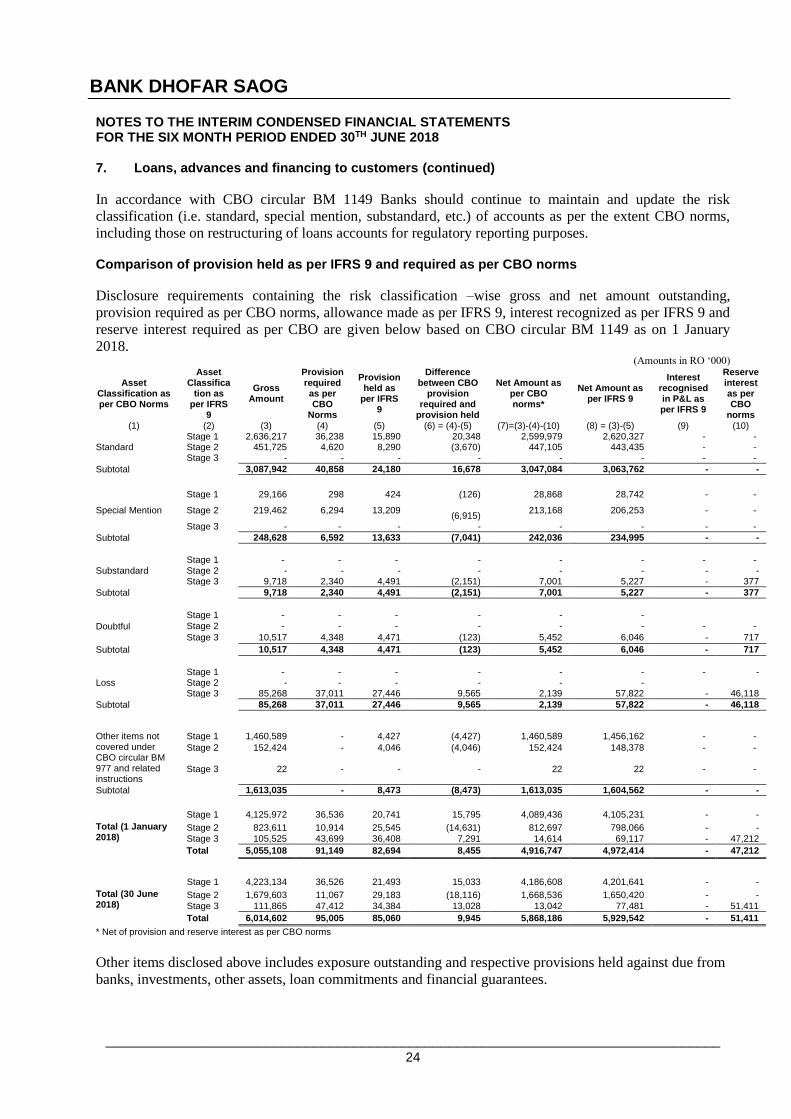
NOTES TO THE INTERIM CONDENSED FINANCIAL STATEMENTS FOR THE SIX MONTH PERIOD ENDED 30TH JUNE 2018 7. Loans, advances and financing to customers (continued)
In accordance with CBO circular BM 1149 Banks should continue to maintain and update the risk
classification (i.e. standard, special mention, substandard, etc.) of accounts as per the extent CBO norms,
including those on restructuring of loans accounts for regulatory reporting purposes. Comparison of provision held as per IFRS 9 and required as per CBO norms
Disclosure requirements containing the risk classification –wise gross and net amount outstanding,
provision required as per CBO norms, allowance made as per IFRS 9, interest recognized as per IFRS 9 and
reserve interest required as per CBO are given below based on CBO circular BM 1149 as on 1 January
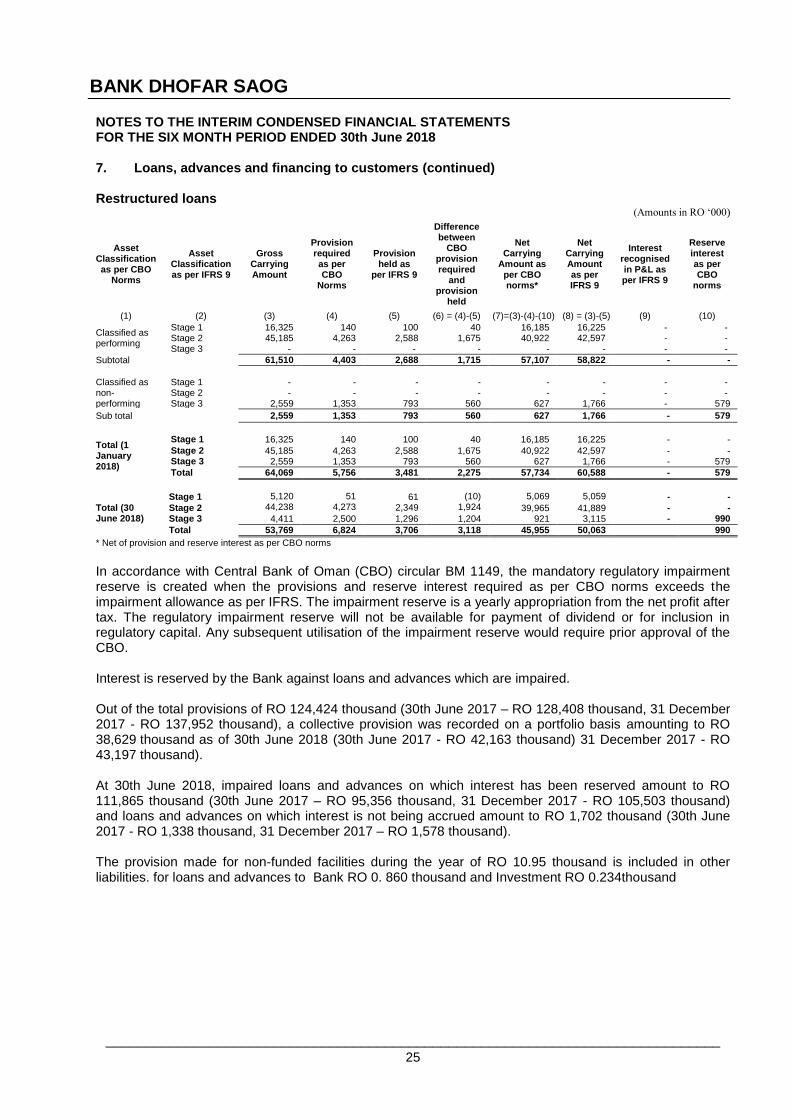
* Net of provision and reserve interest as per CBO norms
In accordance with Central Bank of Oman (CBO) circular BM 1149, the mandatory regulatory impairment reserve is created when the provisions and reserve interest required as per CBO norms exceeds the impairment allowance as per IFRS. The impairment reserve is a yearly appropriation from the net profit after tax. The regulatory impairment reserve will not be available for payment of dividend or for inclusion in regulatory capital. Any subsequent utilisation of the impairment reserve would require prior approval of the CBO. Interest is reserved by the Bank against loans and advances which are impaired. Out of the total provisions of RO 124,424 thousand (30th June 2017 – RO 128,408 thousand, 31 December 2017 - RO 137,952 thousand), a collective provision was recorded on a portfolio basis amounting to RO 38,629 thousand as of 30th June 2018 (30th June 2017 - RO 42,163 thousand) 31 December 2017 - RO 43,197 thousand). At 30th June 2018, impaired loans and advances on which interest has been reserved amount to RO 111,865 thousand (30th June 2017 – RO 95,356 thousand, 31 December 2017 - RO 105,503 thousand) and loans and advances on which interest is not being accrued amount to RO 1,702 thousand (30th June 2017 - RO 1,338 thousand, 31 December 2017 – RO 1,578 thousand). The provision made for non-funded facilities during the year of RO 10.95 thousand is included in other liabilities. for loans and advances to Bank RO 0. 860 thousand and Investment RO 0.234thousand
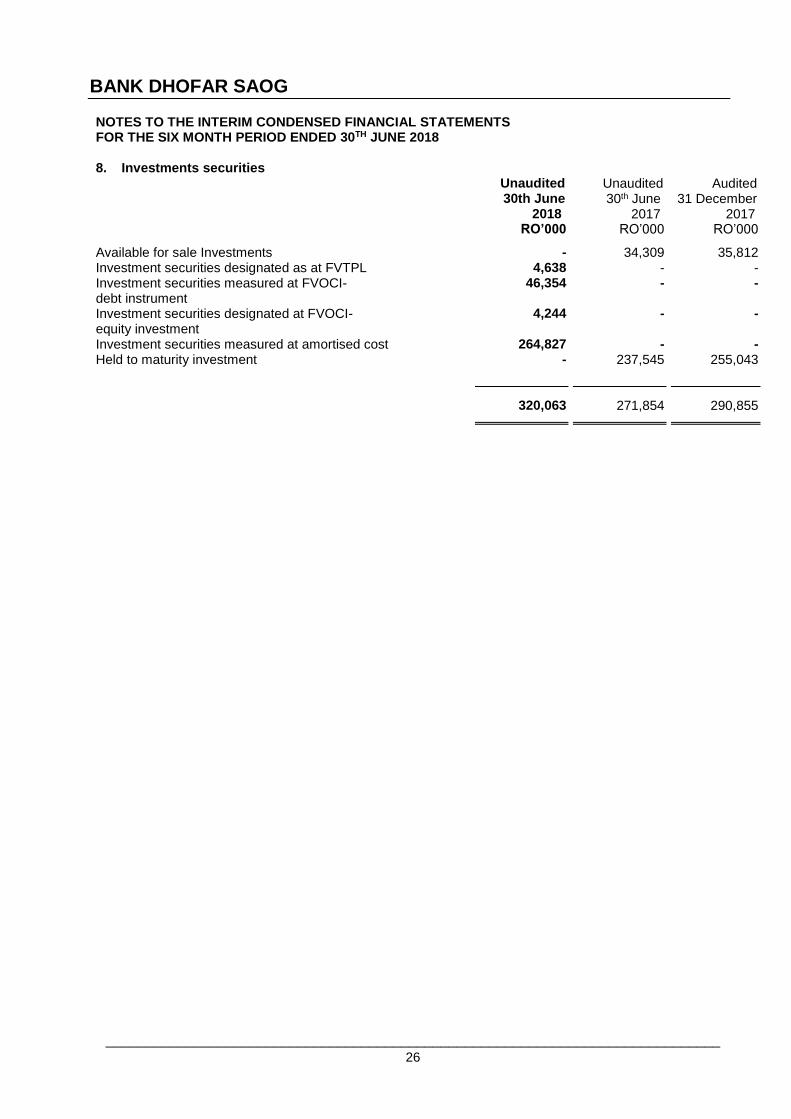
NOTES TO THE INTERIM CONDENSED FINANCIAL STATEMENTS FOR THE SIX MONTH PERIOD ENDED 30TH JUNE 2018 8. Investments securities
Unaudited 30th June
2018
Unaudited 30th June
2017
Audited 31 December
2017 RO’000 RO’000 RO’000
Available for sale Investments - 34,309 35,812 Investment securities designated as at FVTPL 4,638 - - Investment securities measured at FVOCI- debt instrument
46,354 - -
Investment securities designated at FVOCI- equity investment
4,244 - -
Investment securities measured at amortised cost 264,827 - - Held to maturity investment - 237,545 255,043
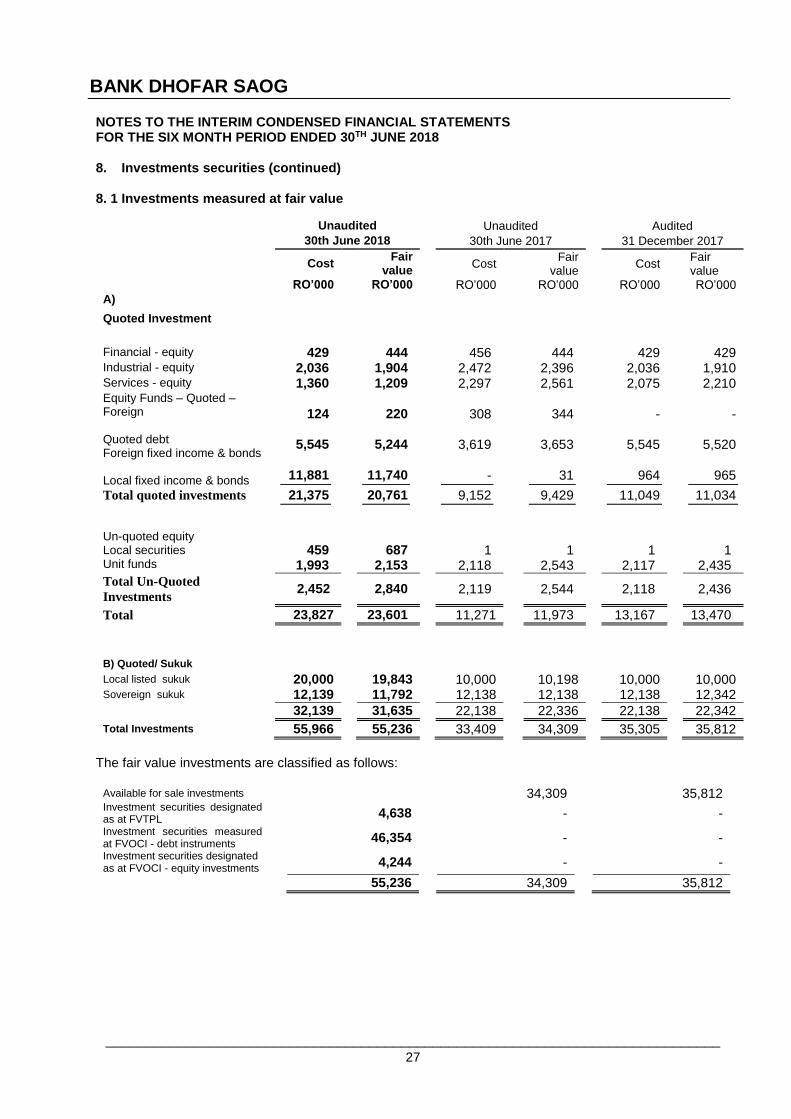
NOTES TO THE INTERIM CONDENSED FINANCIAL STATEMENTS FOR THE SIX MONTH PERIOD ENDED 30TH JUNE 2018 8. Investment securities (continued)
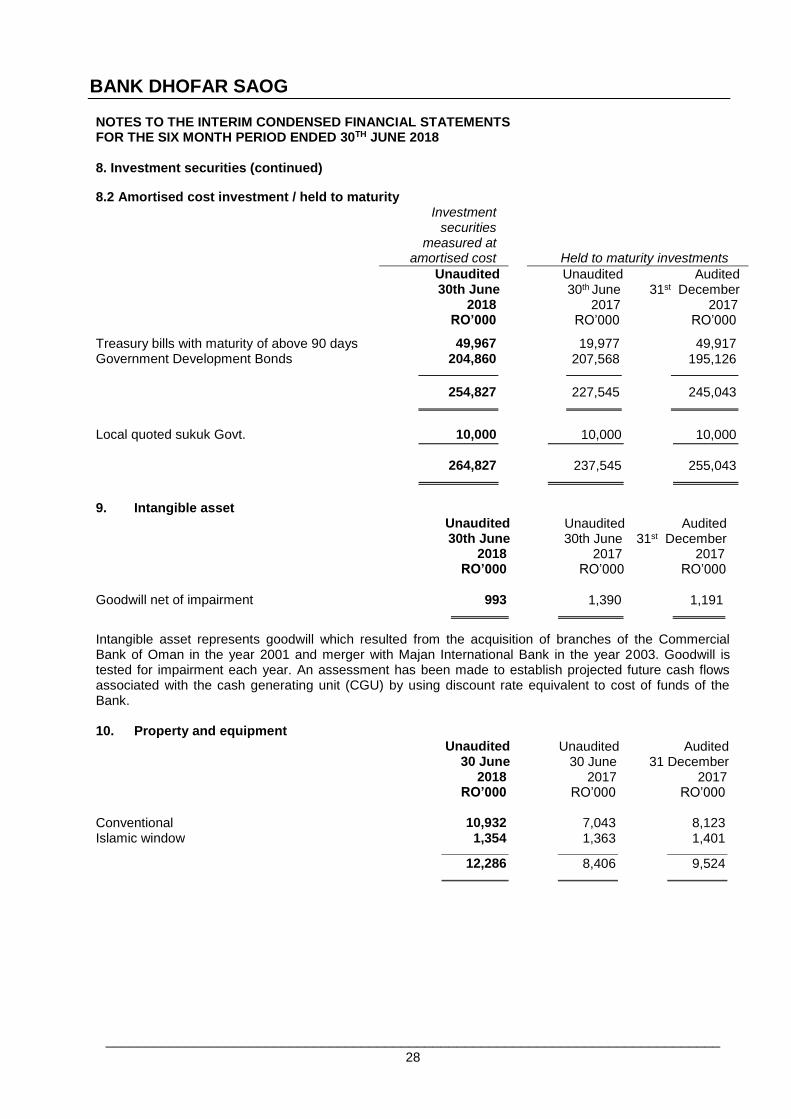
8.2 Amortised cost investment / held to maturity Investment
securities measured at
amortised cost
Held to maturity investments
Unaudited 30th June
2018
Unaudited 30th June
2017
Audited 31st December
2017 RO’000 RO’000 RO’000
Treasury bills with maturity of above 90 days 49,967 19,977 49,917 Government Development Bonds 204,860 207,568 195,126
254,827 227,545 245,043
Local quoted sukuk Govt. 10,000 10,000 10,000
264,827 237,545 255,043
9. Intangible asset
Unaudited 30th June
2018
Unaudited 30th June
2017
Audited 31st December
2017 RO’000 RO’000 RO’000
Goodwill net of impairment 993 1,390 1,191
Intangible asset represents goodwill which resulted from the acquisition of branches of the Commercial Bank of Oman in the year 2001 and merger with Majan International Bank in the year 2003. Goodwill is tested for impairment each year. An assessment has been made to establish projected future cash flows associated with the cash generating unit (CGU) by using discount rate equivalent to cost of funds of the Bank. 10. Property and equipment
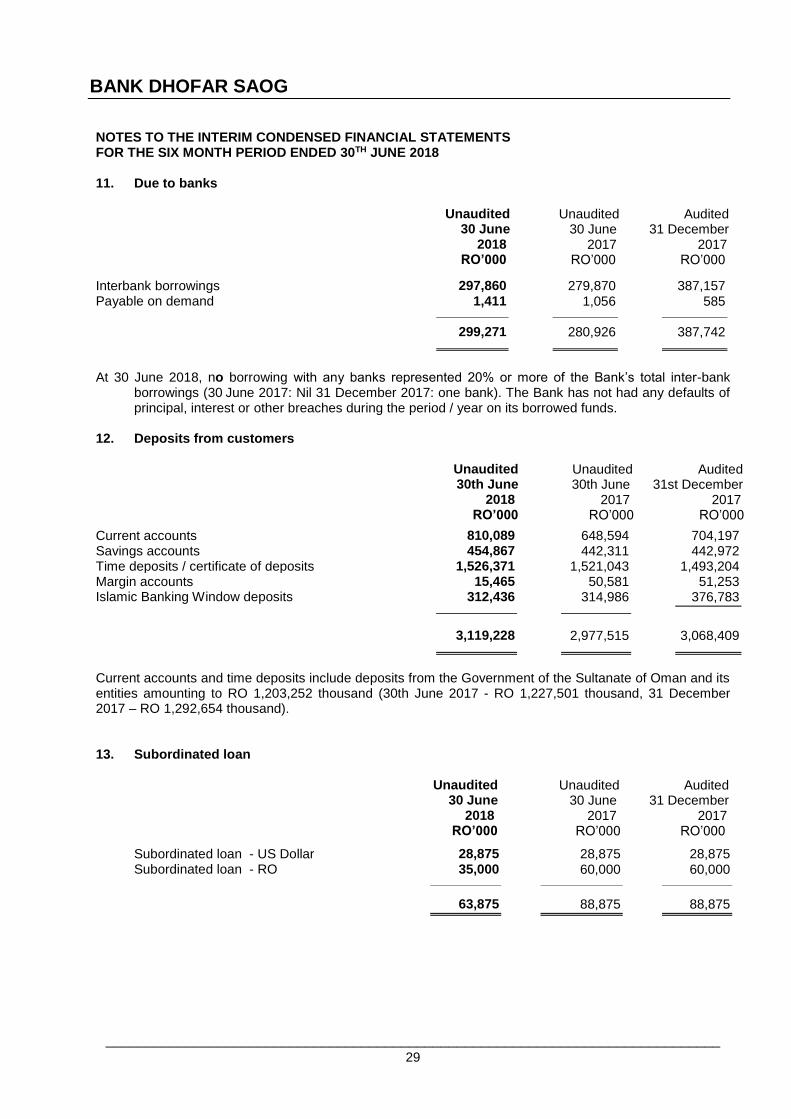
At 30 June 2018, no borrowing with any banks represented 20% or more of the Bank’s total inter-bank borrowings (30 June 2017: Nil 31 December 2017: one bank). The Bank has not had any defaults of principal, interest or other breaches during the period / year on its borrowed funds.
Current accounts and time deposits include deposits from the Government of the Sultanate of Oman and its entities amounting to RO 1,203,252 thousand (30th June 2017 - RO 1,227,501 thousand, 31 December 2017 – RO 1,292,654 thousand).
13. Subordinated loan
Unaudited 30 June
2018
Unaudited 30 June
2017
Audited 31 December
2017 RO’000 RO’000 RO’000
Subordinated loan - US Dollar 28,875 28,875 28,875 Subordinated loan - RO 35,000 60,000 60,000
NOTES TO THE INTERIM CONDENSED FINANCIAL STATEMENTS FOR THE SIX MONTH PERIOD ENDED 30TH JUNE 2018
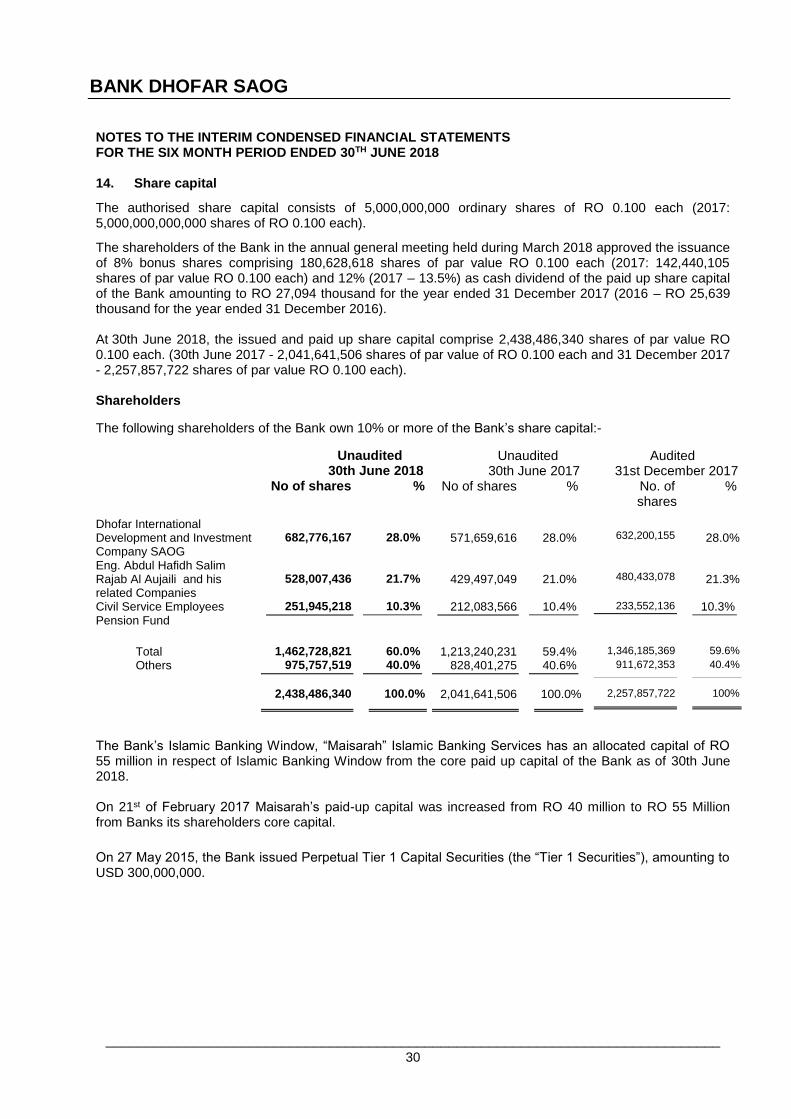
14. Share capital
The authorised share capital consists of 5,000,000,000 ordinary shares of RO 0.100 each (2017: 5,000,000,000,000 shares of RO 0.100 each).
The shareholders of the Bank in the annual general meeting held during March 2018 approved the issuance of 8% bonus shares comprising 180,628,618 shares of par value RO 0.100 each (2017: 142,440,105 shares of par value RO 0.100 each) and 12% (2017 – 13.5%) as cash dividend of the paid up share capital of the Bank amounting to RO 27,094 thousand for the year ended 31 December 2017 (2016 – RO 25,639 thousand for the year ended 31 December 2016). At 30th June 2018, the issued and paid up share capital comprise 2,438,486,340 shares of par value RO 0.100 each. (30th June 2017 - 2,041,641,506 shares of par value of RO 0.100 each and 31 December 2017 - 2,257,857,722 shares of par value RO 0.100 each). Shareholders
The following shareholders of the Bank own 10% or more of the Bank’s share capital:-
Unaudited 30th June 2018
Unaudited 30th June 2017
Audited 31st December 2017
No of shares % No of shares % No. of shares
%
Dhofar International Development and Investment Company SAOG
682,776,167
28.0%
571,659,616
28.0%
632,200,155
28.0%
Eng. Abdul Hafidh Salim Rajab Al Aujaili and his related Companies
The Bank’s Islamic Banking Window, “Maisarah” Islamic Banking Services has an allocated capital of RO 55 million in respect of Islamic Banking Window from the core paid up capital of the Bank as of 30th June 2018. On 21st of February 2017 Maisarah’s paid-up capital was increased from RO 40 million to RO 55 Million from Banks its shareholders core capital.
On 27 May 2015, the Bank issued Perpetual Tier 1 Capital Securities (the “Tier 1 Securities”), amounting to USD 300,000,000.
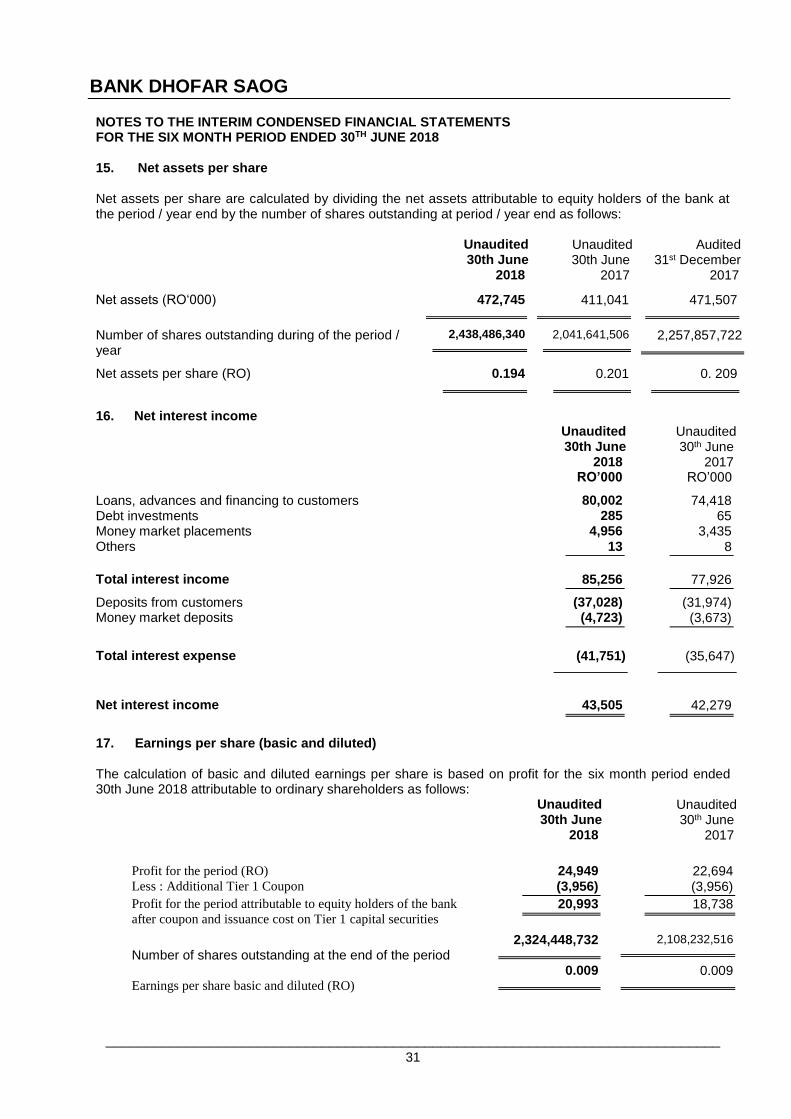
NOTES TO THE INTERIM CONDENSED FINANCIAL STATEMENTS FOR THE SIX MONTH PERIOD ENDED 30TH JUNE 2018 15. Net assets per share Net assets per share are calculated by dividing the net assets attributable to equity holders of the bank at the period / year end by the number of shares outstanding at period / year end as follows: Unaudited
30th June 2018
Unaudited 30th June
2017
Audited 31st December
2017
Net assets (RO‘000) 472,745 411,041 471,507
Number of shares outstanding during of the period / year
2,438,486,340 2,041,641,506 2,257,857,722
Net assets per share (RO) 0.194 0.201 0. 209
16. Net interest income
Unaudited 30th June
2018
Unaudited 30th June
2017 RO’000 RO’000
Loans, advances and financing to customers 80,002 74,418 Debt investments 285 65 Money market placements 4,956 3,435 Others 13 8 Total interest income 85,256 77,926
Deposits from customers (37,028) (31,974) Money market deposits (4,723) (3,673)
Total interest expense (41,751) (35,647)
Net interest income 43,505 42,279
17. Earnings per share (basic and diluted)
The calculation of basic and diluted earnings per share is based on profit for the six month period ended 30th June 2018 attributable to ordinary shareholders as follows:
Unaudited 30th June
2018
Unaudited 30th June
2017
Profit for the period (RO)
24,949
22,694
Less : Additional Tier 1 Coupon (3,956) (3,956)
Profit for the period attributable to equity holders of the bank
after coupon and issuance cost on Tier 1 capital securities 20,993 18,738
Number of shares outstanding at the end of the period 2,324,448,732 2,108,232,516
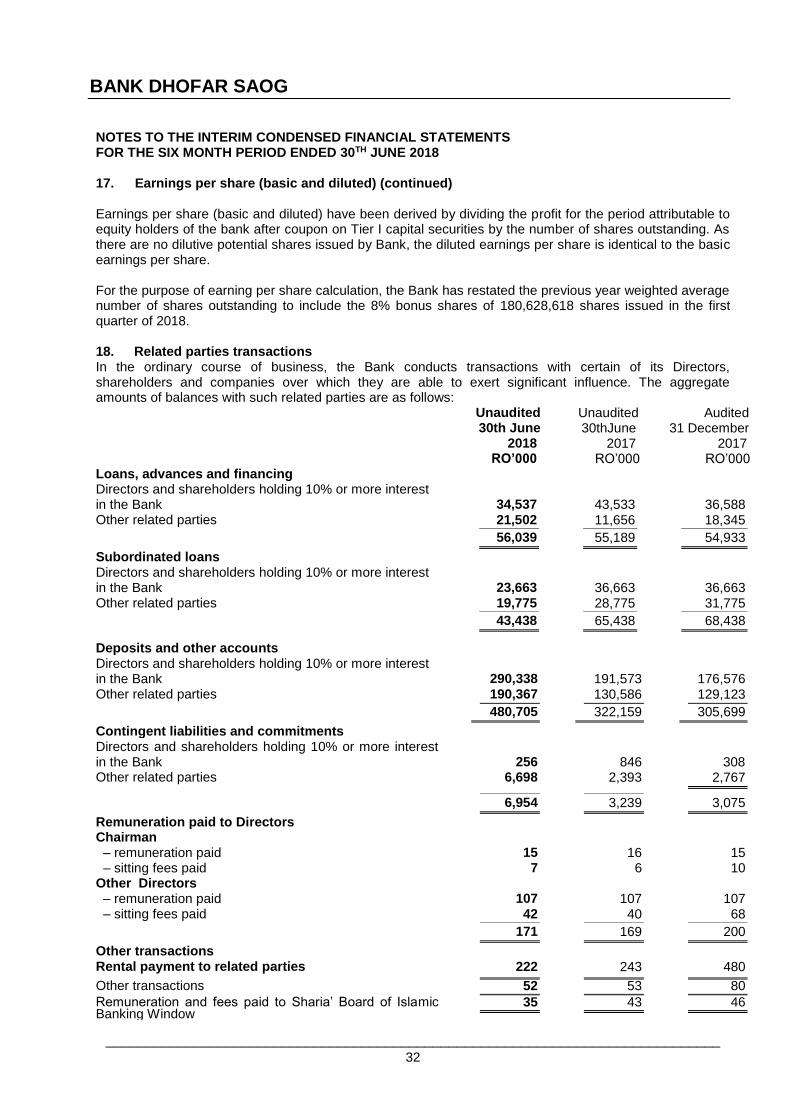
NOTES TO THE INTERIM CONDENSED FINANCIAL STATEMENTS FOR THE SIX MONTH PERIOD ENDED 30TH JUNE 2018 17. Earnings per share (basic and diluted) (continued) Earnings per share (basic and diluted) have been derived by dividing the profit for the period attributable to equity holders of the bank after coupon on Tier I capital securities by the number of shares outstanding. As there are no dilutive potential shares issued by Bank, the diluted earnings per share is identical to the basic earnings per share.
For the purpose of earning per share calculation, the Bank has restated the previous year weighted average number of shares outstanding to include the 8% bonus shares of 180,628,618 shares issued in the first quarter of 2018. 18. Related parties transactions In the ordinary course of business, the Bank conducts transactions with certain of its Directors, shareholders and companies over which they are able to exert significant influence. The aggregate amounts of balances with such related parties are as follows:
Unaudited 30th June
2018
Unaudited 30thJune
2017
Audited 31 December
2017 RO’000 RO’000 RO’000
Loans, advances and financing Directors and shareholders holding 10% or more interest in the Bank 34,537 43,533
36,588
Other related parties 21,502 11,656 18,345
56,039 55,189 54,933
Subordinated loans Directors and shareholders holding 10% or more interest in the Bank
23,663
36,663
36,663
Other related parties 19,775 28,775 31,775
43,438 65,438 68,438
Deposits and other accounts Directors and shareholders holding 10% or more interest in the Bank
290,338
191,573
176,576
Other related parties 190,367 130,586 129,123
480,705 322,159 305,699
Contingent liabilities and commitments
Directors and shareholders holding 10% or more interest in the Bank
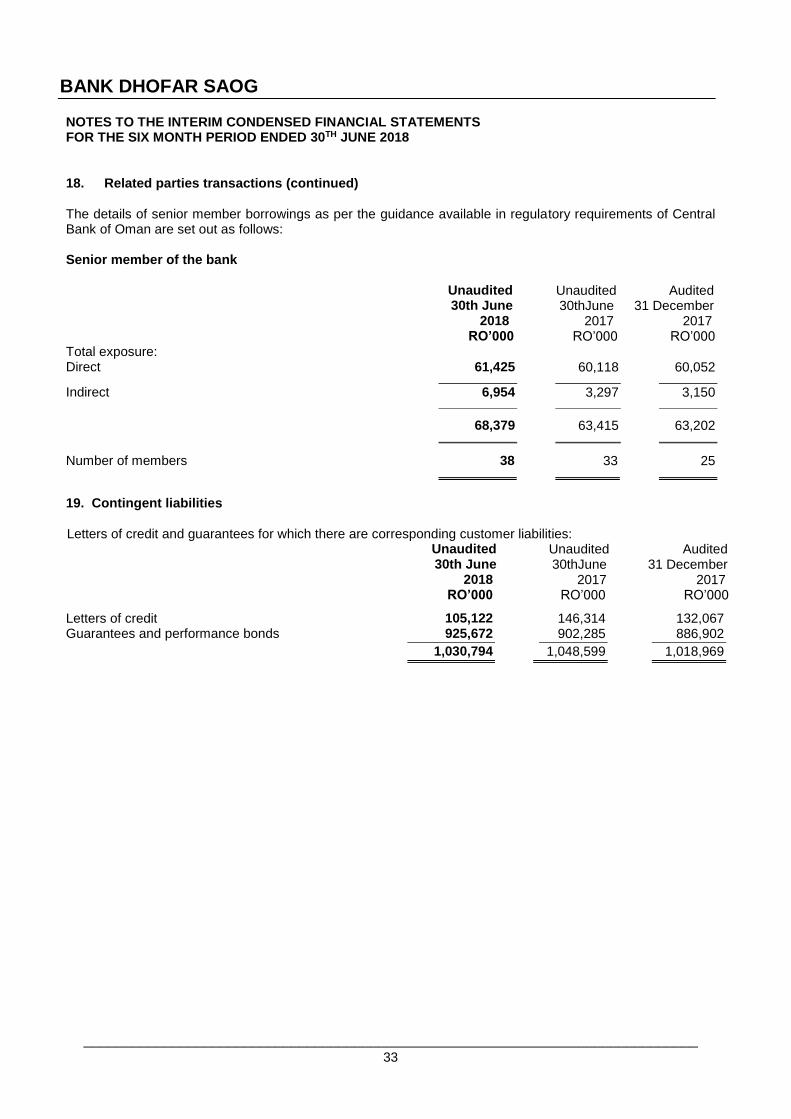
NOTES TO THE INTERIM CONDENSED FINANCIAL STATEMENTS FOR THE SIX MONTH PERIOD ENDED 30TH JUNE 2018 18. Related parties transactions (continued)
The details of senior member borrowings as per the guidance available in regulatory requirements of Central Bank of Oman are set out as follows: Senior member of the bank
Unaudited
30th June 2018
Unaudited 30thJune
2017
Audited 31 December
2017 RO’000 RO’000 RO’000
Total exposure: Direct 61,425 60,118 60,052
Indirect 6,954 3,297 3,150
68,379 63,415 63,202
Number of members 38 33 25
19. Contingent liabilities
Letters of credit and guarantees for which there are corresponding customer liabilities:
Unaudited 30th June
2018
Unaudited 30thJune
2017
Audited 31 December
2017 RO’000 RO’000 RO’000
Letters of credit 105,122 146,314 132,067 Guarantees and performance bonds 925,672 902,285 886,902
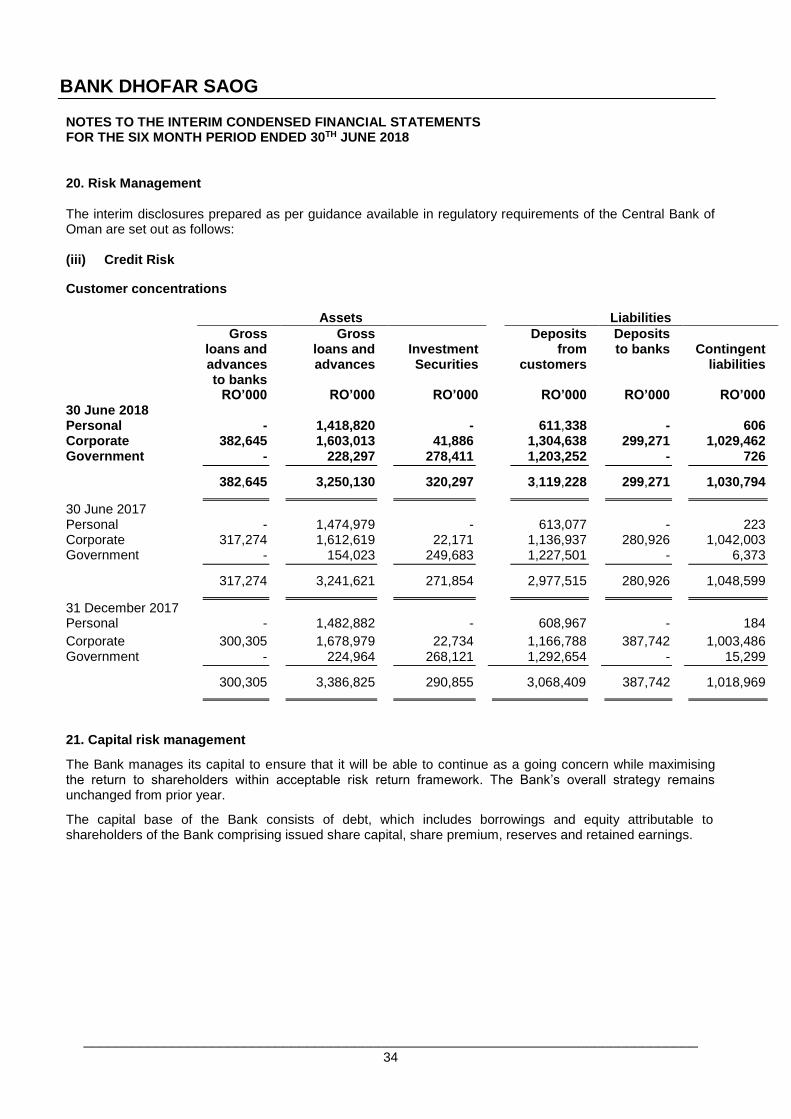
NOTES TO THE INTERIM CONDENSED FINANCIAL STATEMENTS FOR THE SIX MONTH PERIOD ENDED 30TH JUNE 2018 20. Risk Management The interim disclosures prepared as per guidance available in regulatory requirements of the Central Bank of Oman are set out as follows: (iii) Credit Risk
Customer concentrations
Assets Liabilities
Gross loans and advances to banks
Gross loans and advances
Investment Securities
Deposits from
customers
Deposits to banks
Contingent
liabilities
RO’000 RO’000 RO’000 RO’000 RO’000 RO’000 30 June 2018 Personal - 1,418,820 - 611,338 - 606 Corporate 382,645 1,603,013 41,886 1,304,638 299,271 1,029,462 Government - 228,297 278,411 1,203,252 - 726
The Bank manages its capital to ensure that it will be able to continue as a going concern while maximising the return to shareholders within acceptable risk return framework. The Bank’s overall strategy remains unchanged from prior year.
The capital base of the Bank consists of debt, which includes borrowings and equity attributable to shareholders of the Bank comprising issued share capital, share premium, reserves and retained earnings.
BANK DHOFAR SAOG
35
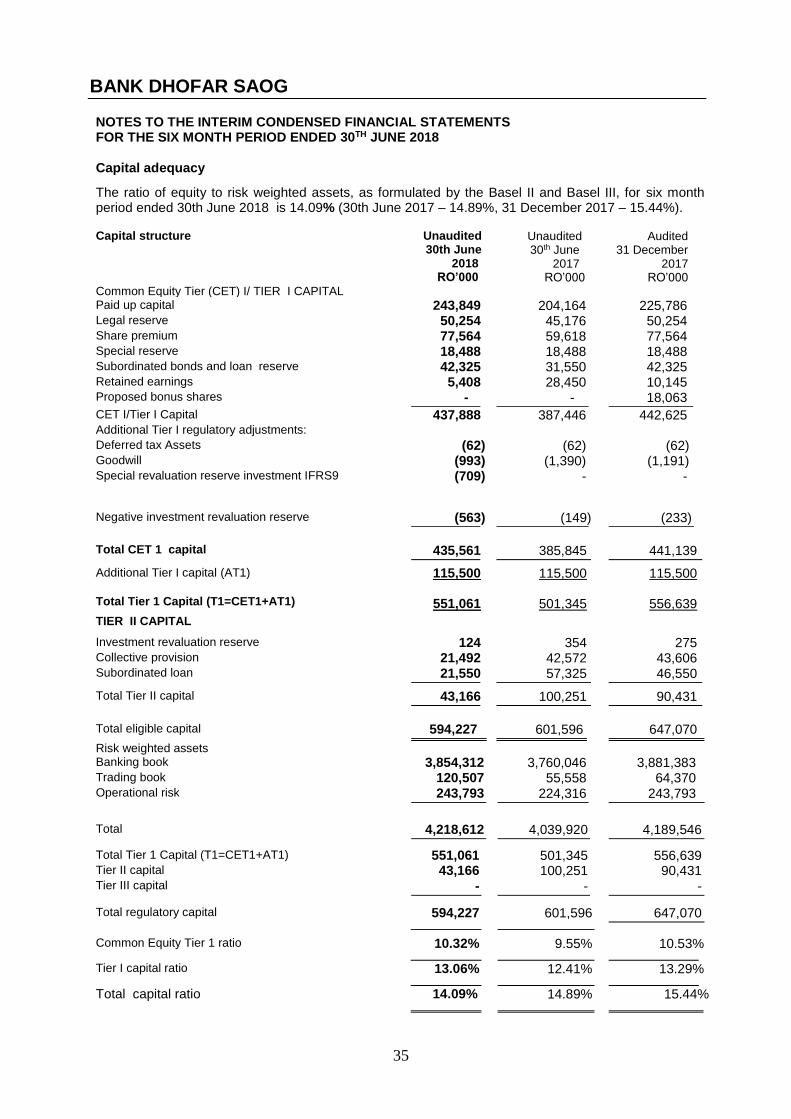
NOTES TO THE INTERIM CONDENSED FINANCIAL STATEMENTS FOR THE SIX MONTH PERIOD ENDED 30TH JUNE 2018 Capital adequacy
The ratio of equity to risk weighted assets, as formulated by the Basel II and Basel III, for six month period ended 30th June 2018 is 14.09% (30th June 2017 – 14.89%, 31 December 2017 – 15.44%). Capital structure Unaudited
30th June 2018
Unaudited 30th June
2017
Audited 31 December
2017 RO’000 RO’000 RO’000 Common Equity Tier (CET) I/ TIER I CAPITAL Paid up capital 243,849 204,164 225,786 Legal reserve 50,254 45,176 50,254 Share premium 77,564 59,618 77,564 Special reserve 18,488 18,488 18,488 Subordinated bonds and loan reserve 42,325 31,550 42,325 Retained earnings 5,408 28,450 10,145 Proposed bonus shares - - 18,063
CET I/Tier I Capital 437,888 387,446 442,625 Additional Tier I regulatory adjustments: Deferred tax Assets (62) (62) (62) Goodwill (993) (1,390) (1,191) Special revaluation reserve investment IFRS9
NOTES TO THE INTERIM CONDENSED FINANCIAL STATEMENTS FOR THE SIX MONTH PERIOD ENDED 30TH JUNE 2018 21. Capital risk management (continued) Capital adequacy (continued)
As per CBO circular BSD/2018/1 dated 20 June 2018, minimum capital adequacy ratio requirement has been reduced by 1% with effect from 1 April 2018. As per new ratio, Tier 2 capital will be restricted to 2% from 3%. CET 1, Tier 1 and capital conservation buffer requirements remained unchanged.
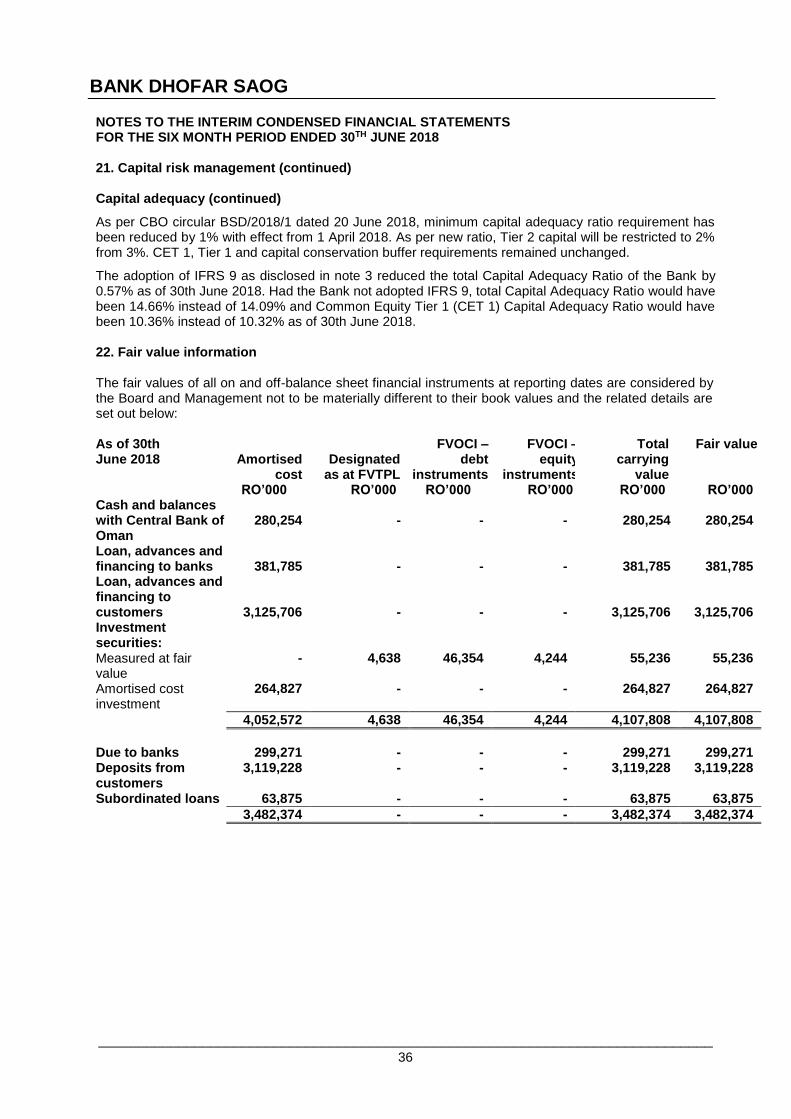
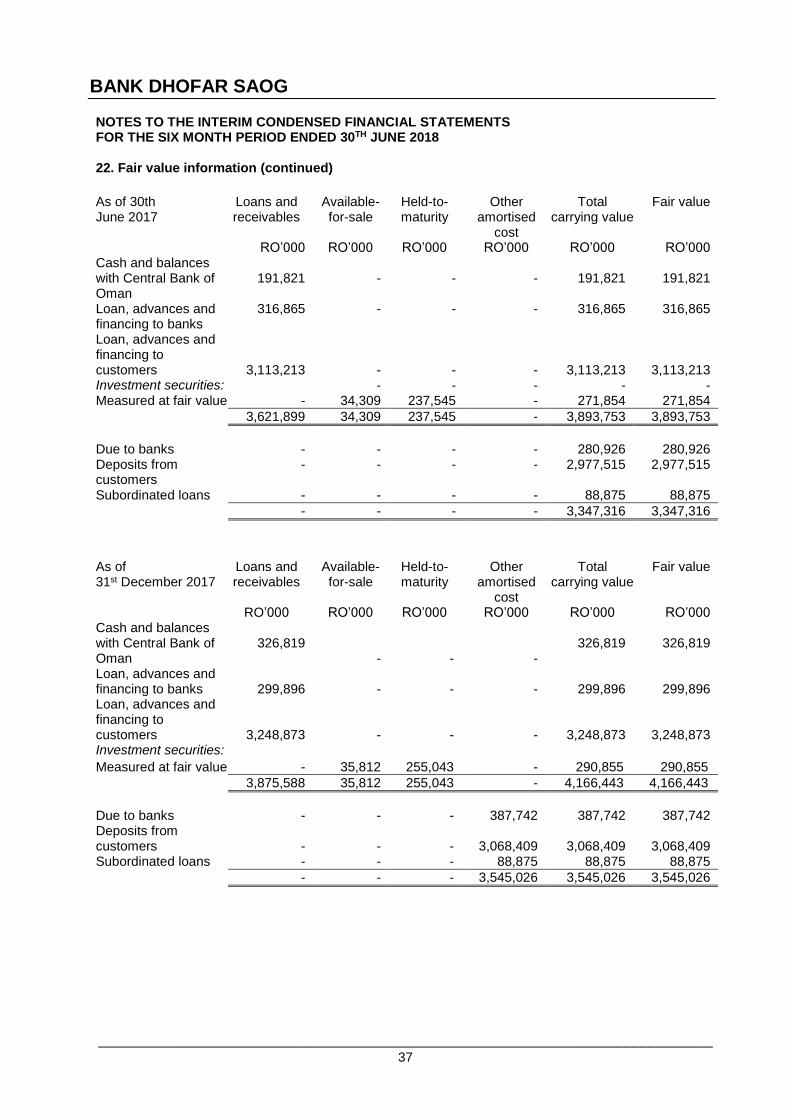
The adoption of IFRS 9 as disclosed in note 3 reduced the total Capital Adequacy Ratio of the Bank by 0.57% as of 30th June 2018. Had the Bank not adopted IFRS 9, total Capital Adequacy Ratio would have been 14.66% instead of 14.09% and Common Equity Tier 1 (CET 1) Capital Adequacy Ratio would have been 10.36% instead of 10.32% as of 30th June 2018. 22. Fair value information The fair values of all on and off-balance sheet financial instruments at reporting dates are considered by the Board and Management not to be materially different to their book values and the related details are set out below: As of 30th June 2018
Amortised
cost
Designated
as at FVTPL
FVOCI – debt
instruments
FVOCI – equity
instruments
Total carrying
value
Fair value
RO’000 RO’000 RO’000 RO’000 RO’000 RO’000 Cash and balances with Central Bank of Oman
280,254
-
-
-
280,254
280,254
Loan, advances and financing to banks
381,785
-
-
-
381,785
381,785
Loan, advances and financing to customers
3,125,706
-
-
-
3,125,706
3,125,706 Investment securities:
Measured at fair value
- 4,638 46,354 4,244 55,236 55,236
Amortised cost investment
264,827 - - - 264,827 264,827
4,052,572 4,638 46,354 4,244 4,107,808 4,107,808
Due to banks 299,271 - - - 299,271 299,271 Deposits from customers
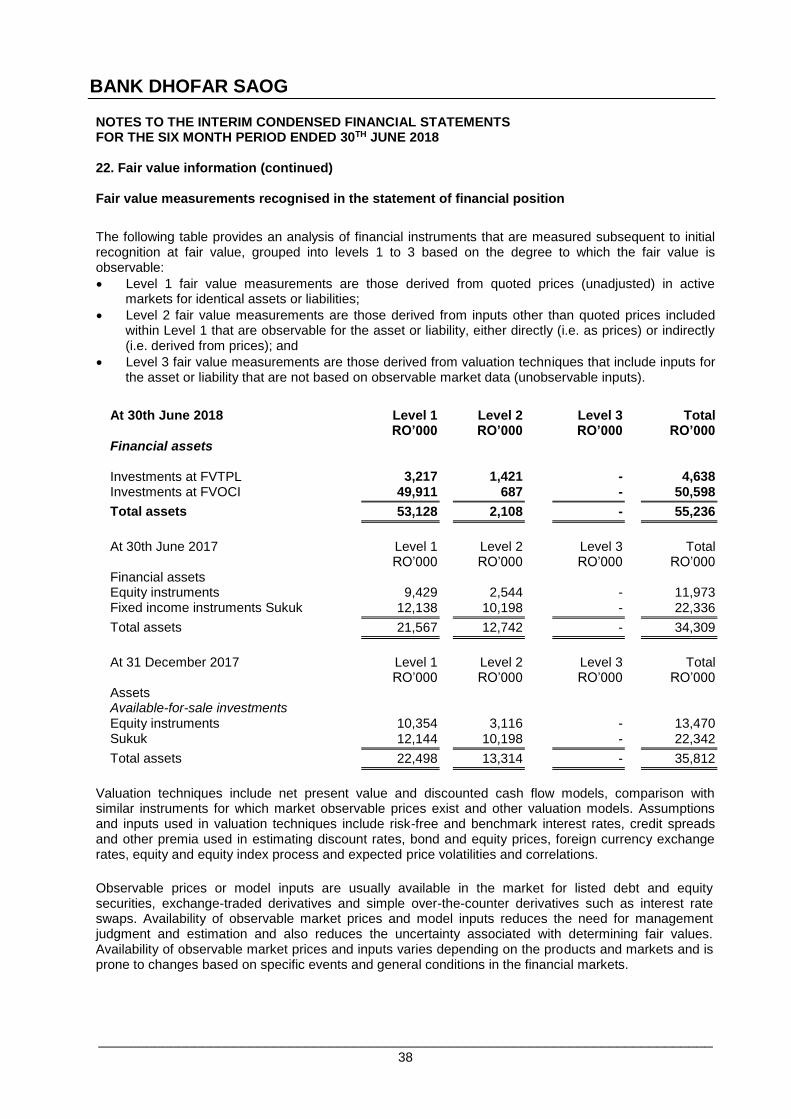
NOTES TO THE INTERIM CONDENSED FINANCIAL STATEMENTS FOR THE SIX MONTH PERIOD ENDED 30TH JUNE 2018 22. Fair value information (continued) Fair value measurements recognised in the statement of financial position
The following table provides an analysis of financial instruments that are measured subsequent to initial recognition at fair value, grouped into levels 1 to 3 based on the degree to which the fair value is observable:
Level 1 fair value measurements are those derived from quoted prices (unadjusted) in active markets for identical assets or liabilities;
Level 2 fair value measurements are those derived from inputs other than quoted prices included within Level 1 that are observable for the asset or liability, either directly (i.e. as prices) or indirectly (i.e. derived from prices); and
Level 3 fair value measurements are those derived from valuation techniques that include inputs for the asset or liability that are not based on observable market data (unobservable inputs).
At 30th June 2018 Level 1 Level 2 Level 3 Total RO’000 RO’000 RO’000 RO’000 Financial assets
Investments at FVTPL 3,217 1,421 - 4,638 Investments at FVOCI 49,911 687 - 50,598
Total assets 53,128 2,108 - 55,236
At 30th June 2017 Level 1 Level 2 Level 3 Total RO’000 RO’000 RO’000 RO’000 Financial assets Equity instruments 9,429 2,544 - 11,973 Fixed income instruments Sukuk 12,138 10,198 - 22,336
Total assets 21,567 12,742 - 34,309
At 31 December 2017 Level 1 Level 2 Level 3 Total RO’000 RO’000 RO’000 RO’000 Assets Available-for-sale investments Equity instruments 10,354 3,116 - 13,470 Sukuk 12,144 10,198 - 22,342
Total assets 22,498 13,314 - 35,812
Valuation techniques include net present value and discounted cash flow models, comparison with similar instruments for which market observable prices exist and other valuation models. Assumptions and inputs used in valuation techniques include risk-free and benchmark interest rates, credit spreads and other premia used in estimating discount rates, bond and equity prices, foreign currency exchange rates, equity and equity index process and expected price volatilities and correlations.
Observable prices or model inputs are usually available in the market for listed debt and equity securities, exchange-traded derivatives and simple over-the-counter derivatives such as interest rate swaps. Availability of observable market prices and model inputs reduces the need for management judgment and estimation and also reduces the uncertainty associated with determining fair values. Availability of observable market prices and inputs varies depending on the products and markets and is prone to changes based on specific events and general conditions in the financial markets.
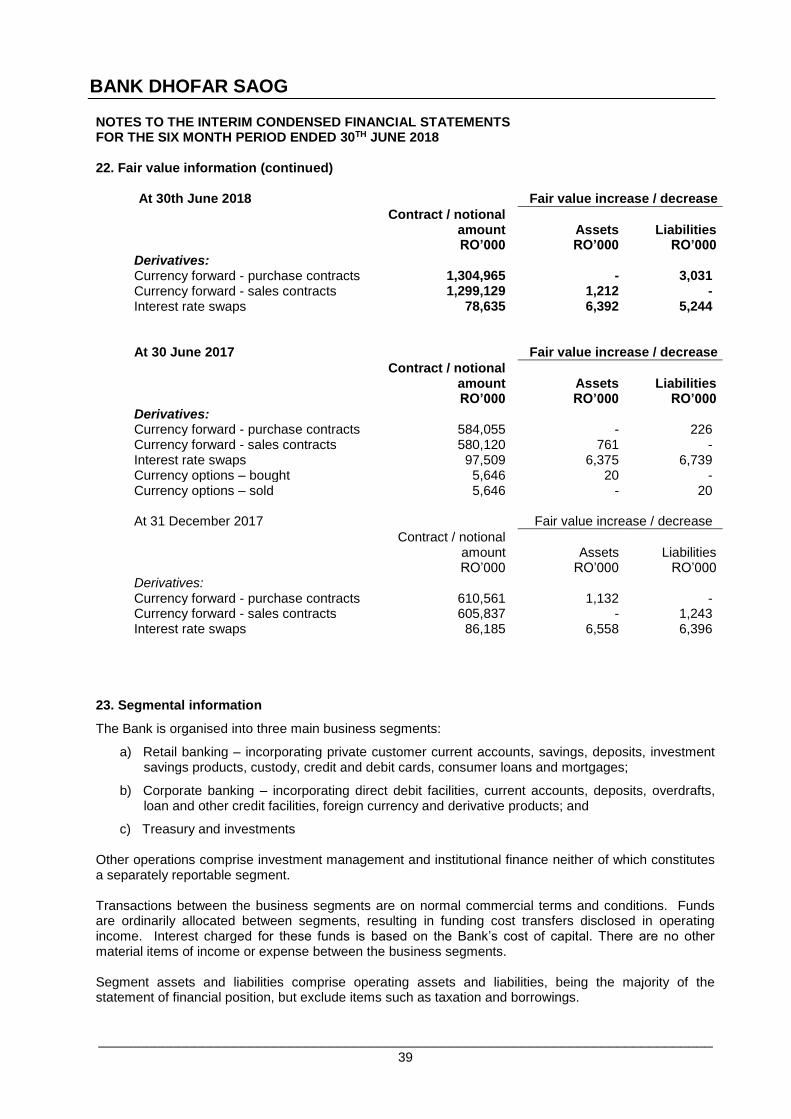
The Bank is organised into three main business segments:
a) Retail banking – incorporating private customer current accounts, savings, deposits, investment savings products, custody, credit and debit cards, consumer loans and mortgages;
b) Corporate banking – incorporating direct debit facilities, current accounts, deposits, overdrafts, loan and other credit facilities, foreign currency and derivative products; and
c) Treasury and investments Other operations comprise investment management and institutional finance neither of which constitutes a separately reportable segment. Transactions between the business segments are on normal commercial terms and conditions. Funds are ordinarily allocated between segments, resulting in funding cost transfers disclosed in operating income. Interest charged for these funds is based on the Bank’s cost of capital. There are no other material items of income or expense between the business segments. Segment assets and liabilities comprise operating assets and liabilities, being the majority of the statement of financial position, but exclude items such as taxation and borrowings.
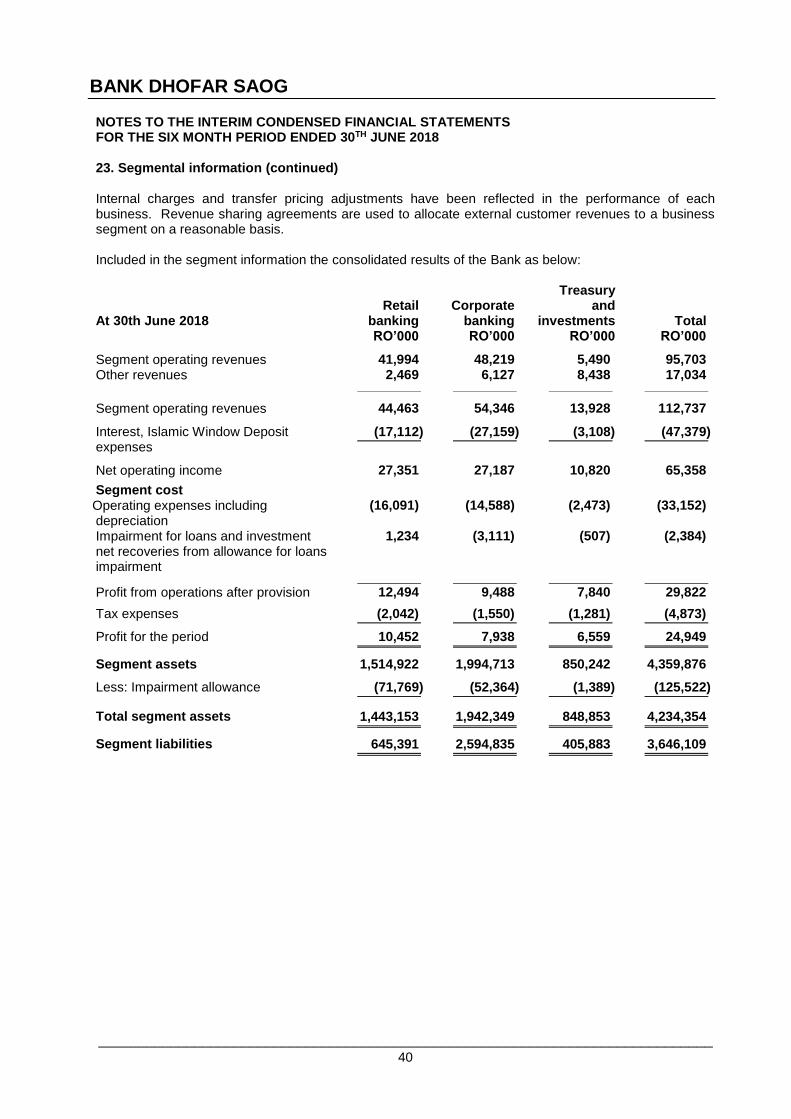
NOTES TO THE INTERIM CONDENSED FINANCIAL STATEMENTS FOR THE SIX MONTH PERIOD ENDED 30TH JUNE 2018 23. Segmental information (continued) Internal charges and transfer pricing adjustments have been reflected in the performance of each business. Revenue sharing agreements are used to allocate external customer revenues to a business segment on a reasonable basis. Included in the segment information the consolidated results of the Bank as below:
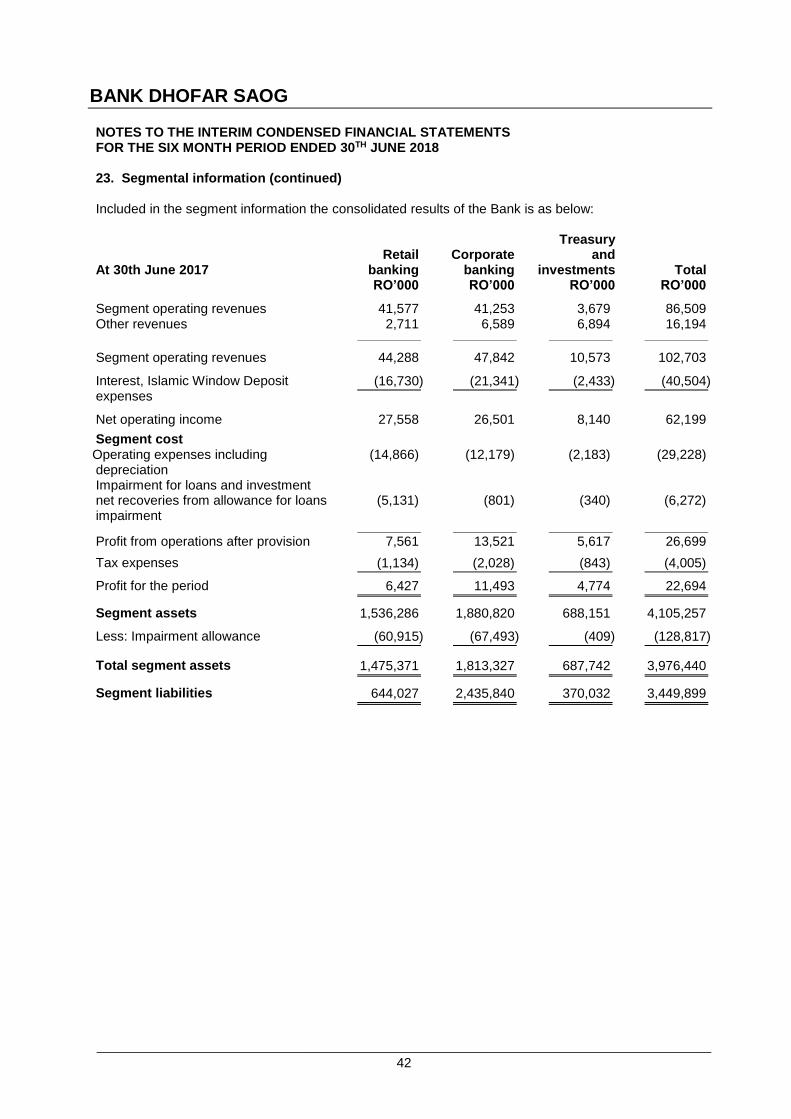
NOTES TO THE INTERIM CONDENSED FINANCIAL STATEMENTS FOR THE SIX MONTH PERIOD ENDED 30TH JUNE 2018 23. Segmental information (continued) Included in the segment information the consolidated results of the Bank is as below:
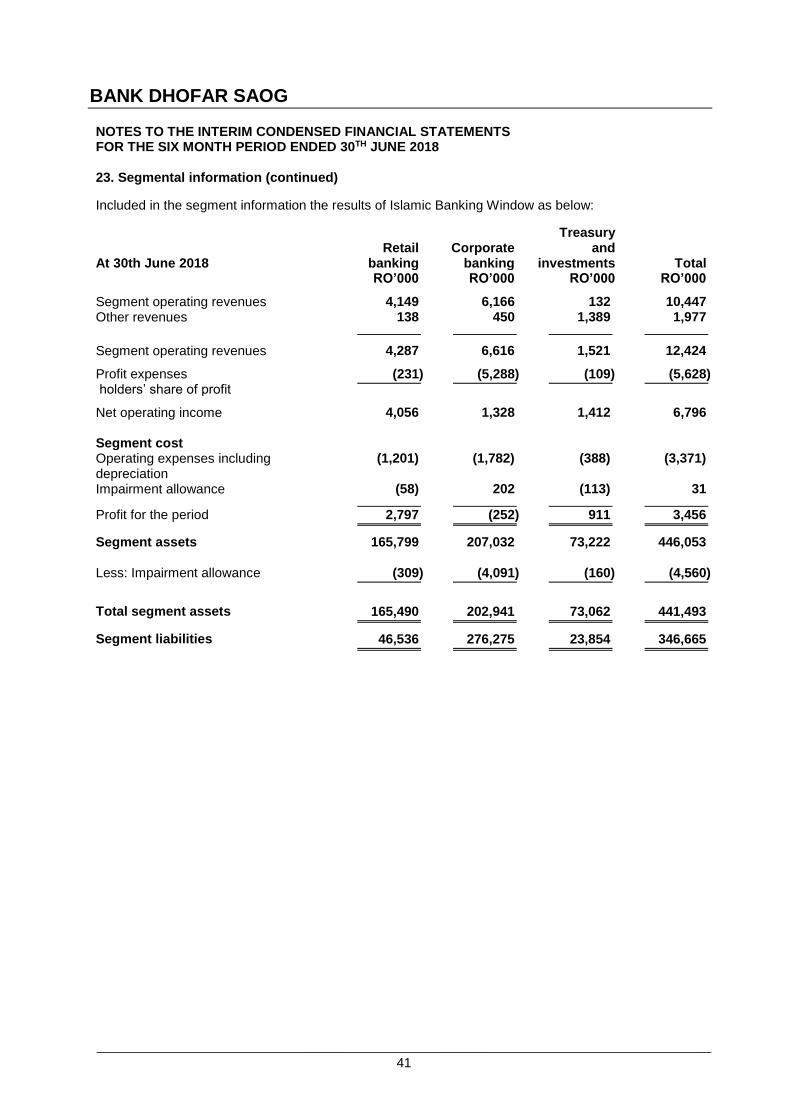
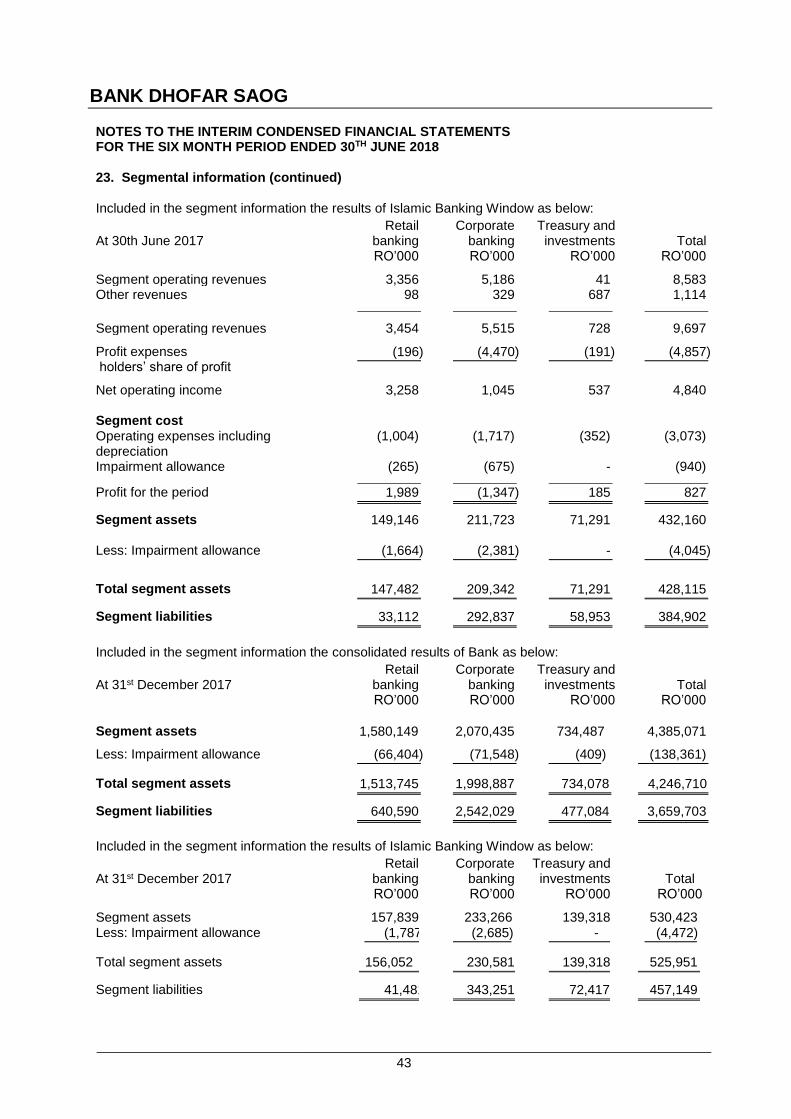
NOTES TO THE INTERIM CONDENSED FINANCIAL STATEMENTS FOR THE SIX MONTH PERIOD ENDED 30TH JUNE 2018 23. Segmental information (continued) Included in the segment information the results of Islamic Banking Window as below:
Segment cost Operating expenses including depreciation
(1,004) (1,717) (352) (3,073)
Impairment allowance (265) (675) - (940)
Profit for the period 1,989 (1,347) 185 827 Segment assets
149,146 211,723 71,291 432,160
Less: Impairment allowance
(1,664) (2,381) - (4,045)
Total segment assets 147,482 209,342 71,291 428,115 Segment liabilities 33,112 292,837 58,953 384,902 Included in the segment information the consolidated results of Bank as below: