Page 1
UNCERTAINTY ANALYSIS OF MICRO DIFFERENTIAL
PRESSURE SENSOR USING INTERVAL ANALYSIS
M. Shanmugavalli, G. Uma, M. Umapathy
Department of Instrumentation & Control Engineering
National Institute of Technology
Tiruchirappalli, Tamilnadu – 620 015, India
Emails: [email protected]
Abstract- A methodology for robust design analysis of micromechanical systems using interval methods
is presented by considering piezo resistive micro differential pressure sensor with uncertainty in its
parameters. The proposed method guides the design of micro sensor to achieve a robust and reliable
design in a most efficient way. The uncertainty analysis is carried out numerically using Coventorware
and analytically using Intlab.
Index terms: Uncertainty Analysis, Interval Analysis, Micro differential Pressure sensor, Uncertainty
Analysis, Coventorware, Intlab
I. INTRODUCTION
The major design objectives in any device design, is to meet the required functional parameters
and the reliability of the device. The functional parameters depend on the geometry of the
structure, material properties and process parameters. The major difficulty the designer faces is
the dimensions and properties used in the simulation of the MEMS devices can not be exactly
followed during fabrication. In order to overcome this problem, the designer must test the device
in simulation for bound of parameters involved in it. This paper demonstrates the use of interval
method to assess the piezo resistive micro differential pressure sensor under the presence of
manufacturing and process uncertainties. The uncertainty analysis is carried out numerically
using Coventorware and analytically using Intlab.
INTERNATIONAL JOURNAL ON SMART SENSING AND INTELLIGENT SYSTEMS, VOL. 2, NO. 3, SEPTEMBER 2009
463
Page 2
Pressure sensors presently constitute the largest market segment of mechanical MEMS devices
[1-7]. The silicon differential pressure sensor that can be fabricated using silicon surface
micromachining, monolithically integrated with twin diaphragms, is described in paper [2]. The
advances in MEMS technology, however, have led to the introduction of solid-state sensors
giving rise to enhanced functionality and performance [8]. The choice for using piezoresistive
pressure sensors has been done mainly due to their relatively straightforward technological
implementation [9]. For ultra miniaturized sensors, piezoresistive detection is often preferred
instead of capacitive detection due to the lower cost, the scaling characteristics, and the
possibility to have the amplifier separate from the sensor [10-11]. Differential pressure sensors
have two requirements such as high static pressure and high differential over-range pressure,
applied to the sensors, which is caused by the mis-operation of valves, must be considered in the
design. Therefore, conventional silicon sensors for these applications must be mounted in a
strong high-pressure vessel, and the output terminals need to be hermetically sealed. Also, a
complex mechanical structure is required to protect each silicon diaphragm from high differential
pressure [2]. Different techniques to compensate for the temperature dependency have been
reported including laser trimming of the resistors, the use of external resistors, material
compositions and self-compensation bridge configurations. The self-compensating bridge
configuration requires precisely matched piezoresistors, which, at least in theory, give a
temperature independency due to cancellation of the common signal in the output signal from the
bridge [12 - 16]. By measuring the temperature with, for instance, a pressure-insensitive
piezoresistor, the output signal can be adjusted by a correction of the signal. The correction value
can be taken from a look-up table containing calibration values. A capacitive pressure sensor for
differential pressure with an overload capability without the need for an external overload
protection is presented [17]. The sensing element consists of a PyredsilicodPyrex sandwich and is
fabricated in silicon/glass technology using anodic bonding. To increase the overpressure range
the sensor element is mounted in a pre-stressed mounting fixture, which was optimized
numerically. A differential pressure sensor which has protectors on both sides for over range
pressure is presented [18]. There are two narrow gaps on both sides of a square diaphragm on the
sensor. When the over range pressure is applied, the diaphragm contacts the planes which face
the narrow gaps and is protected from fracturing. In this work, the differential pressure sensor is
designed with an over-range protection structure. The sensor has two diaphragms with
M. Shanmugavalli, G. Uma, M. Umapathy, Uncertainty Analysis of Micro Differential Pressure Sensor Using Interval Analysis
464
Page 3
piezoresistors working complementarily to each other due to the respective pressures. The sensor
design is optimized for high output with improved sensor linearity, and reduced errors caused by
changes in ambient temperature and static pressure.
Uncertainty analysis is a technique by which one can determine, with good approximation,
whether a system will work within raw specification limits when the parameters vary between
their limits. If the influencing variables are uncertain, a direct consequence is that the response
parameters are uncertain as well. Interval Analysis is a technique used to estimate the bounds on
various model outputs based on the bounds of the model inputs and parameters. Every uncertain
parameter can be described by an interval [4, 5, and 6]. In this work, Interval Analysis has been
applied to micro differential pressure sensor
II. MODELING AND DESIGN OF A MICRO DIFFERENTIAL PRESSURE SENSOR
a. Analytical Modeling
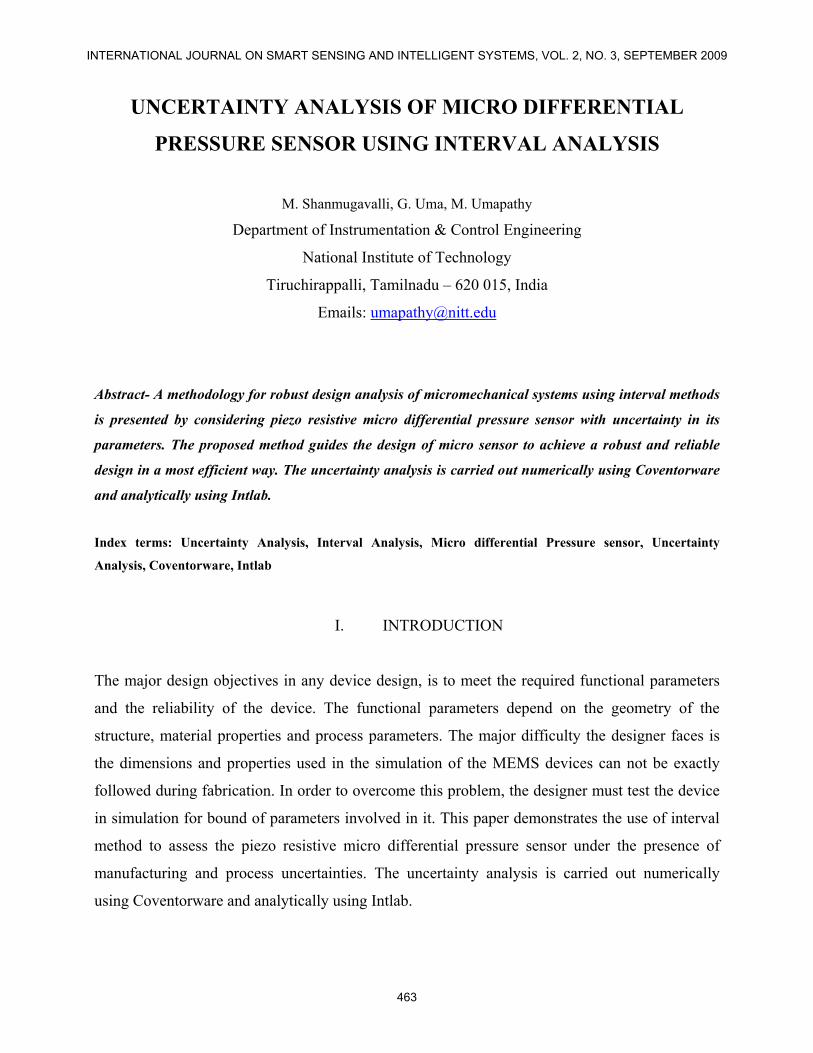
The piezoresistive pressure sensor (Figure 1) measures the applied pressure on one side of the
diaphragm. The stress change in the diaphragm causes the resistance change of the piezoresistor.
Figure 1. A Typical structure of piezoresistive pressure sensor
The deflection of a uniformly loaded square diaphragm with clamped edge is given by
(1)
where 0Y is the deflection at center of the diaphragm,
p is the applied pressure,
( )4
20 3
p aY 0.0141 1E h
×= × × −ν ×
INTERNATIONAL JOURNAL ON SMART SENSING AND INTELLIGENT SYSTEMS, VOL. 2, NO. 3, SEPTEMBER 2009
465
Page 4
a is the dimension of side of the square diaphragm,
E is the modulus of elasticity of diaphragm material,
h is the thickness of the diaphragm, and
ν is the Poisson’s ratio.
The maximum longitudinal stress lσ is at the edge and it is given by
(2)
The maximum tangential stress tσ is at the center and it is given by
( )2
t 2
p a3 132 h
× σ = × + ν ×
(3)
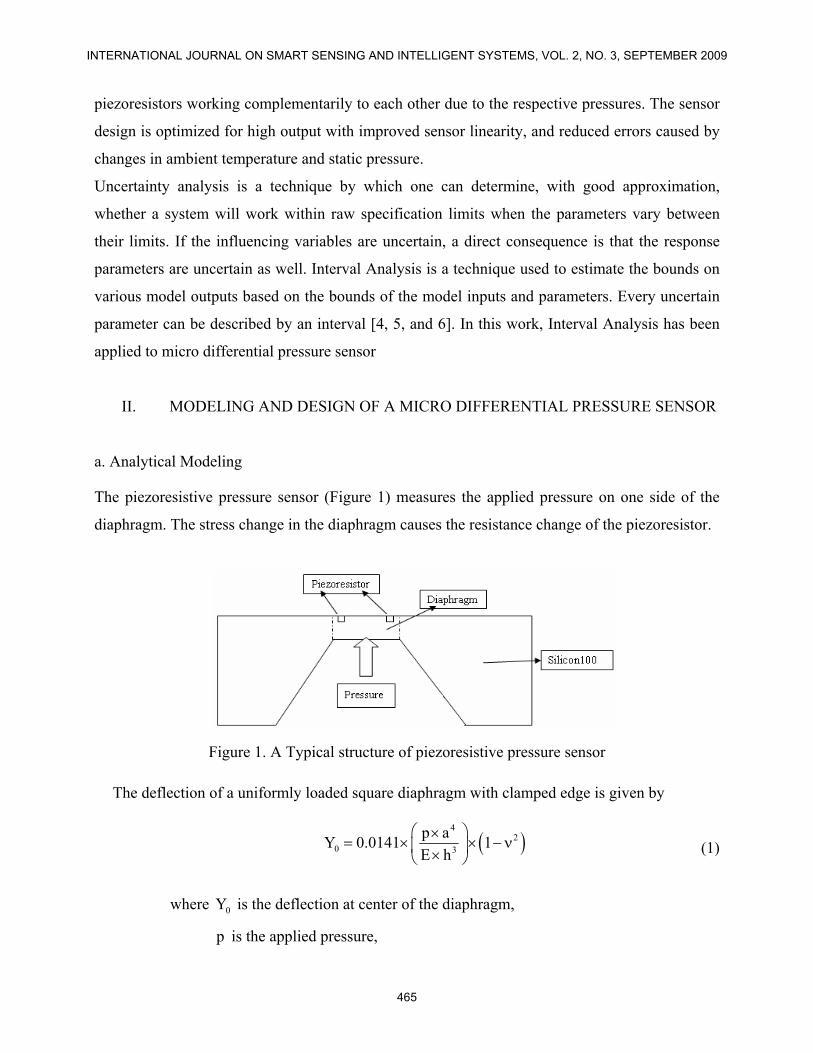
Figure 2 shows the Wheatstone bridge arrangement of piezoresistors. The longitudinal stress
lσ and transverse stress tσ is experienced by the piezoresistors R1 and R3 respectively. Then, the
piezoresistors R2 and R4 experience longitudinal stress tσ and transverse stress lσ which are
rotated 90° compared with the stresses experienced by R1 and R3.
Figure 2. Wheatstone bridge of piezoresistive pressure sensor
The piezoresistive coefficients lπ and tπ are given by
11 12 44l 2
π + π + ππ = & 11 12 44
t 2π + π − π
π = (4)
In a cubic semiconductor, the matrix of piezoresistive coefficients contains only three
independent values, conventionally labeled as 1211,ππ , and 44π .For a diffused resistor subjected to
2
l 2
p a316 h
× σ = ×
M. Shanmugavalli, G. Uma, M. Umapathy, Uncertainty Analysis of Micro Differential Pressure Sensor Using Interval Analysis
466
Page 5
longitudinal and transverse stress components lσ and tσ respectively, the resistance change is
given by
l l t tR
R∆
= π σ + π σ (5)
lσ can be related with tσ via where ν is the Poisson ratio. The differential output
voltage 0V of an ideally balanced bridge with assumed identical (but opposite in sign) resistance
change, ∆R, in response to an applied pressure P, on the sensor is given by
SVRRV ×
∆=0 (6)
The differential pressure can the difference between pressures between the two diaphragms and
the differential voltage can be the difference between the voltage experienced by the two signal
conditioning circuits i.e. the Wheatstone bridge circuits.
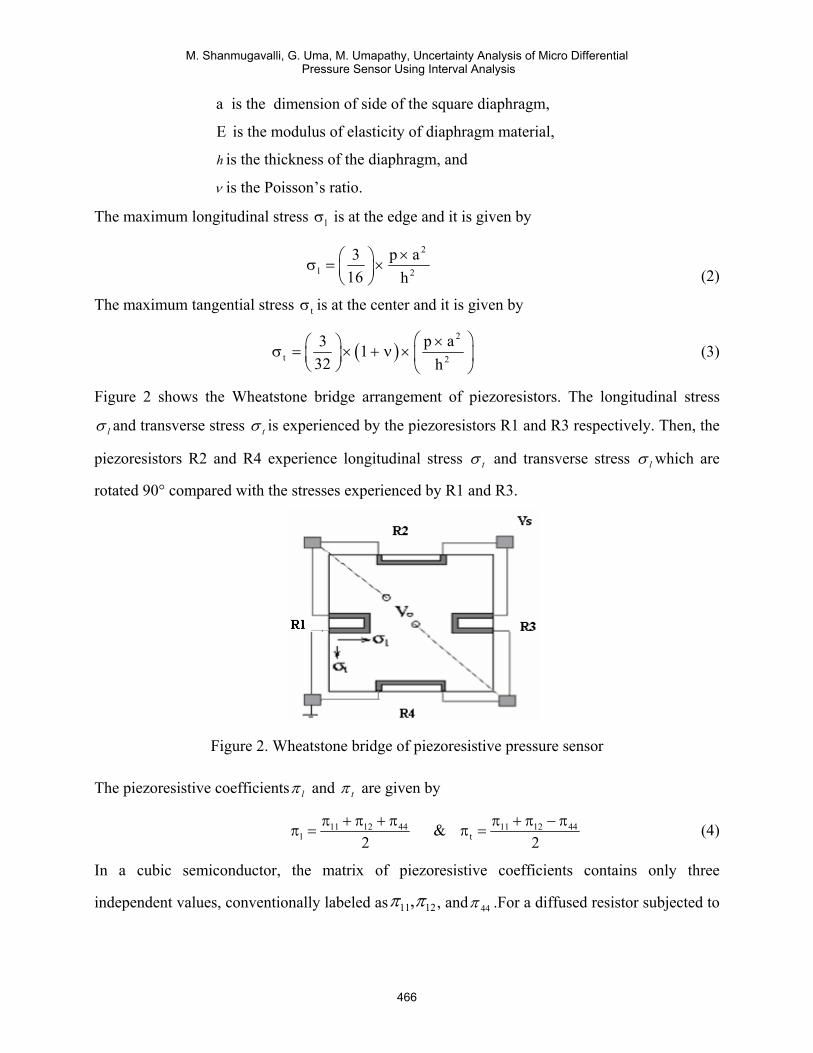
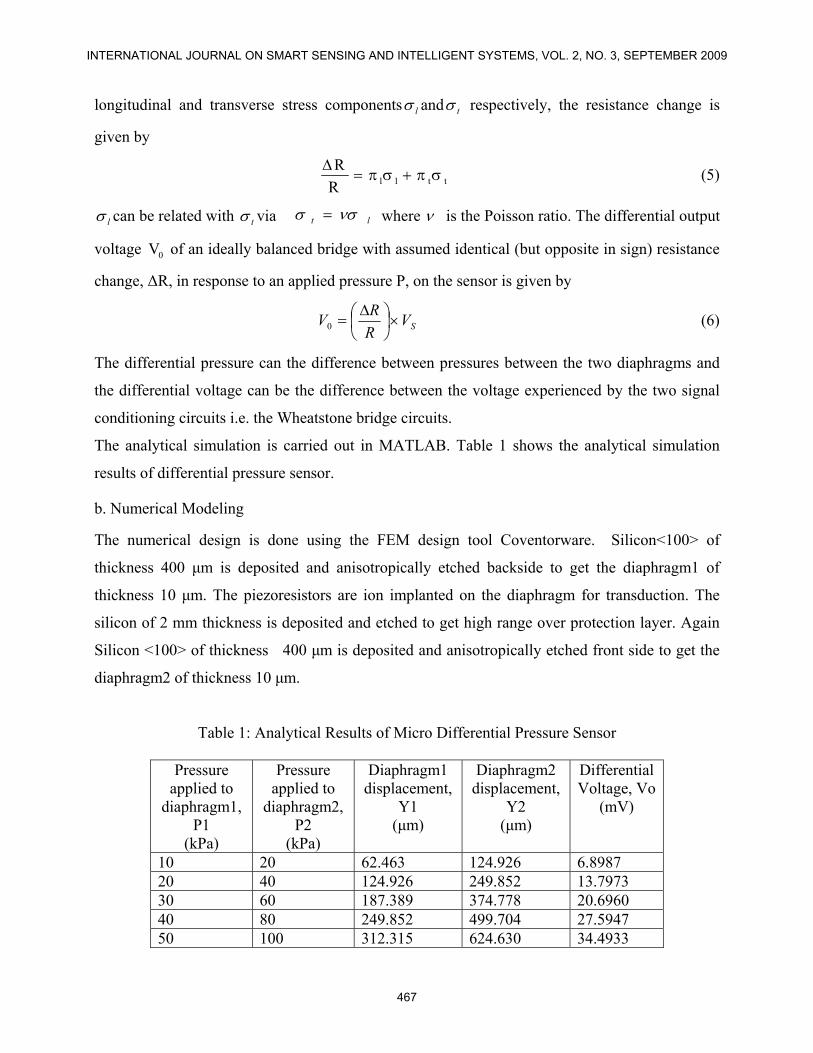
The analytical simulation is carried out in MATLAB. Table 1 shows the analytical simulation
results of differential pressure sensor.
b. Numerical Modeling
The numerical design is done using the FEM design tool Coventorware. Silicon<100> of
thickness 400 µm is deposited and anisotropically etched backside to get the diaphragm1 of
thickness 10 µm. The piezoresistors are ion implanted on the diaphragm for transduction. The
silicon of 2 mm thickness is deposited and etched to get high range over protection layer. Again
Silicon <100> of thickness 400 µm is deposited and anisotropically etched front side to get the
diaphragm2 of thickness 10 µm.
Table 1: Analytical Results of Micro Differential Pressure Sensor
Pressure applied to
diaphragm1, P1
(kPa)
Pressure applied to
diaphragm2, P2
(kPa)
Diaphragm1 displacement,
Y1 (µm)
Diaphragm2 displacement,
Y2 (µm)
Differential Voltage, Vo
(mV)
10 20 62.463 124.926 6.8987 20 40 124.926 249.852 13.7973 30 60 187.389 374.778 20.6960 40 80 249.852 499.704 27.5947 50 100 312.315 624.630 34.4933
lt νσσ =
INTERNATIONAL JOURNAL ON SMART SENSING AND INTELLIGENT SYSTEMS, VOL. 2, NO. 3, SEPTEMBER 2009
467
Page 6
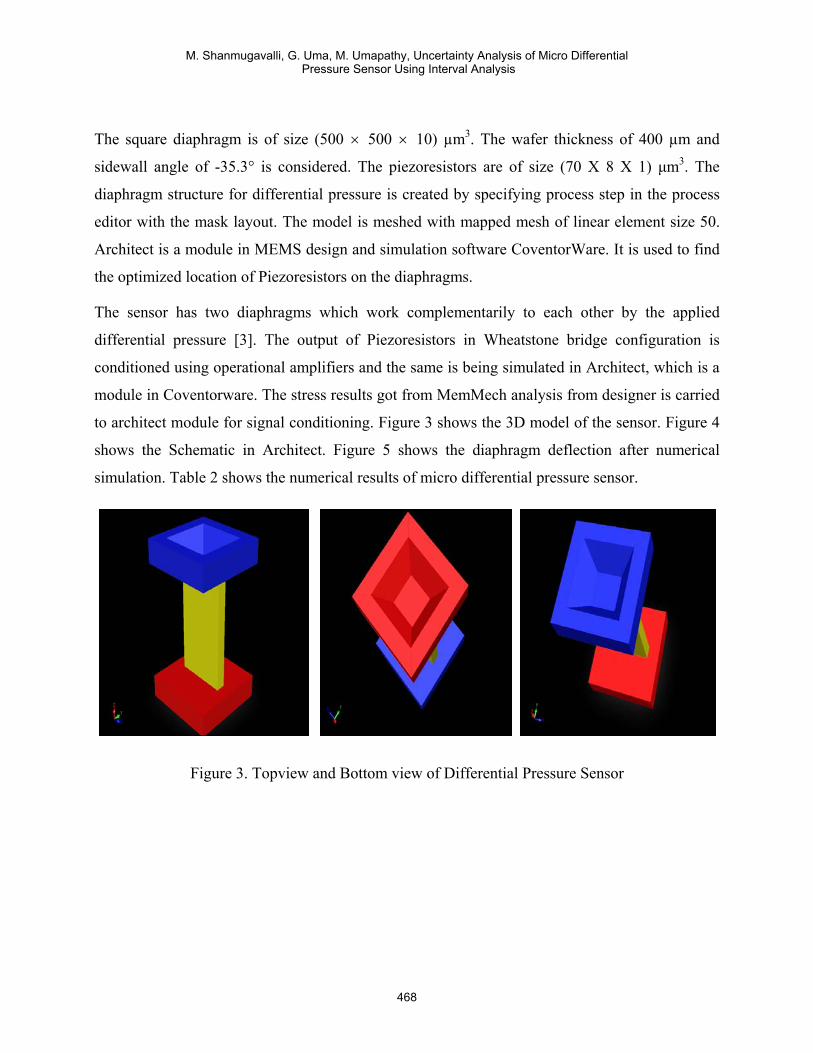
The square diaphragm is of size (500 × 500 × 10) µm3. The wafer thickness of 400 µm and
sidewall angle of -35.3° is considered. The piezoresistors are of size (70 X 8 X 1) µm3. The
diaphragm structure for differential pressure is created by specifying process step in the process
editor with the mask layout. The model is meshed with mapped mesh of linear element size 50.
Architect is a module in MEMS design and simulation software CoventorWare. It is used to find
the optimized location of Piezoresistors on the diaphragms.
The sensor has two diaphragms which work complementarily to each other by the applied
differential pressure [3]. The output of Piezoresistors in Wheatstone bridge configuration is
conditioned using operational amplifiers and the same is being simulated in Architect, which is a
module in Coventorware. The stress results got from MemMech analysis from designer is carried
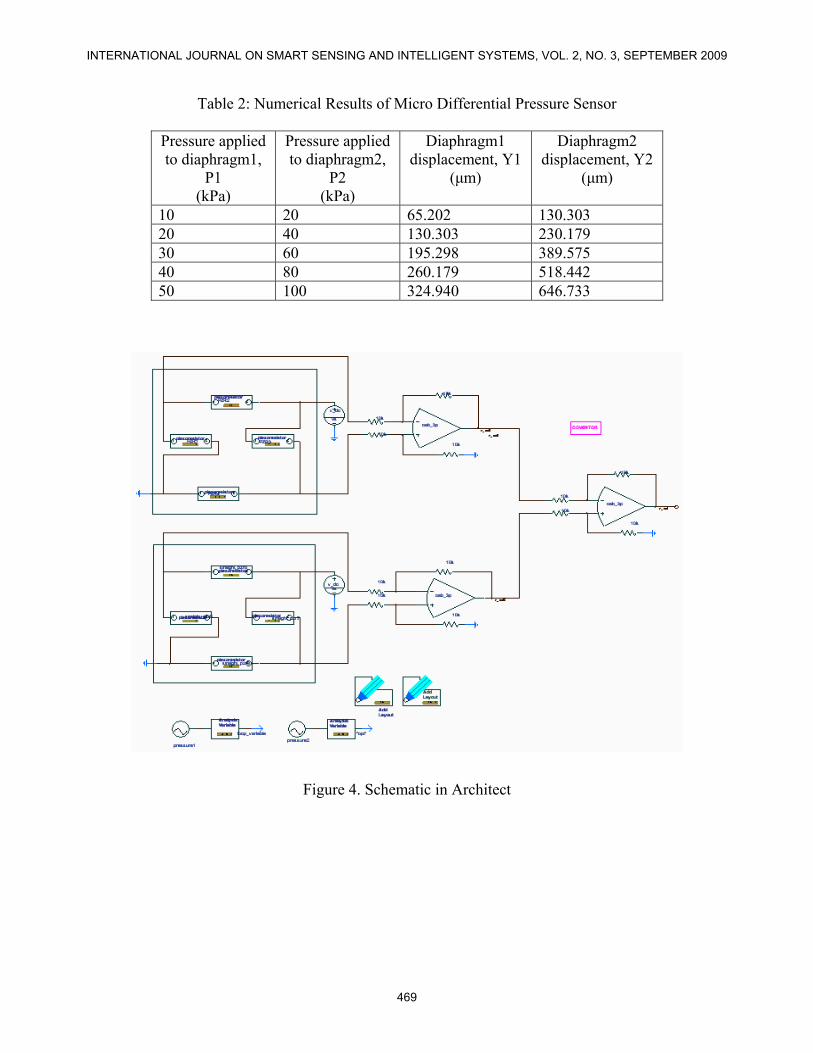
to architect module for signal conditioning. Figure 3 shows the 3D model of the sensor. Figure 4
shows the Schematic in Architect. Figure 5 shows the diaphragm deflection after numerical
simulation. Table 2 shows the numerical results of micro differential pressure sensor.
Figure 3. Topview and Bottom view of Differential Pressure Sensor
M. Shanmugavalli, G. Uma, M. Umapathy, Uncertainty Analysis of Micro Differential Pressure Sensor Using Interval Analysis
468
Page 7
Table 2: Numerical Results of Micro Differential Pressure Sensor
Pressure applied to diaphragm1,
P1 (kPa)
Pressure applied to diaphragm2,
P2 (kPa)
Diaphragm1 displacement, Y1
(µm)
Diaphragm2 displacement, Y2
(µm)
10 20 65.202 130.303 20 40 130.303 230.179 30 60 195.298 389.575 40 80 260.179 518.442 50 100 324.940 646.733
Figure 4. Schematic in Architect
INTERNATIONAL JOURNAL ON SMART SENSING AND INTELLIGENT SYSTEMS, VOL. 2, NO. 3, SEPTEMBER 2009
469
Page 8
Y
Z
X
Displacement Mag.: 0.0E+00 6.2E-01 1.2E+00 1.9E+00 2.5E+00
um COVENTOR
MemMech:sm_2_ARR-ARR05May2008CoventorData
Figure 5. Diaphragm Deflection after simulation in Coventorware
III. DESIGN UNDER UNCERTAINTY
The deflection of a uniformly loaded square diaphragm with clamped edge under uncertainty is
given by
(7)
The maximum longitudinal stress l∆σ is at the edge and under uncertainty it is given by
(8)
The maximum tangential stress t∆σ is at the center and under uncertainty it is given by
( )2
t 2
3 p a132 h
× ∆ ∆σ = + ν ∆ (9)
where 0Y∆ is the deflection at center of the diaphragm under uncertainty, P is the applied
pressure under uncertainty, a∆ is the dimension of side of the square diaphragm under
uncertainty, E∆ is the modulus of elasticity of diaphragm material under uncertainty, h∆ is the
thickness of the diaphragm under uncertainty, andν is the Poisson’s ratio.
X
Y
Z Displacement Mag.: 0.0E+00 6.2E-01 1.2E+00 1.9E+00 2.5E+00
um COVENTOR
MemMech:sm_5_ARR-ARR05May2008CoventorData
( )4
20 3
p aY 0.0141 1E h
× ∆∆ = − ν ∆ × ∆
2
l 2
3 p a16 h
× ∆ ∆σ = × ∆
M. Shanmugavalli, G. Uma, M. Umapathy, Uncertainty Analysis of Micro Differential Pressure Sensor Using Interval Analysis
470
Page 9
Interval Analysis is a technique used to estimate the bounds on various model outputs based on
the bounds of the model inputs and parameters. In the interval method approach, uncertain
parameters are assumed to be unknown but bounded and each of them has upper and lower limits
without a probabilistic structure. Every uncertain parameter is described by an interval [6]. An
interval is a close set in R, which included the possible range of a number. In this paper, an
interval will be represented by the ordered pair [a, b] = {x: a =x = b} where ‘a’ is the lower limit
of the interval and ‘b’ is the upper limit of the interval and ‘a’ and ‘b’ are real numbers. The
number is known to lie between values but the exact value is unknown. Interval arithmetic is an
elegant tool for practical work with inequalities, approximate numbers, error bounds, and more
generally with certain convex and bounded sets.
Let x = [a, b] and y = [c, d] be two interval numbers, a and c are lower limits, b and d are upper
limits and a, b, c, d are real.
1. Addition: x + y = [a, b] + [c, d] = [a + c, b + d]
2. Subtraction: x - y = [a, b] - [c, d] = [a -d, b-c]
3. Multiplication: xy = [min(ac,ad,bc,bd), max(ac,ad,bc,bd)]
4. Division: 1 / x = [1/b, 1/a]
When the pressure of 10 kPa is applied to diaphragm1 (which is at top) and pressure of 20 kPa is
applied to diaphragm2 (which is at bottom), the analytical differential output voltage with
nominal values for all the parameters is 6.8986v. When the same analysis is carried out for
uncertainties in the range of 5% to the parameters like diaphragm thickness, diaphragm side and
Modulus of elasticity, the differential output voltage is [1.6455, 12.4292] v. On the similar line,
considering a single dimensional parameter for example thickness, the sensor is analyzed with
±5% of the nominal value of the thickness and the same procedure is repeated for the diaphragm
side and Modulus of elasticity, considering each parameter individually at a time.
For carrying out uncertainty analysis numerically, the vary analysis is performed in
Coventorware, with all the dimensional parameters and material properties 5% less than the
nominal value and 5% more than the nominal values. The differential output voltage is calculated
analytically by inputting all inputs in interval using INTLAB. INTLAB is a tool for calculating
interval arithmetic’s using MATLAB. Table 3 shows the dimensions of diaphragm. Table 4
shows the diaphragms displacement, y1, y2, differential voltage v. The pressure range of (0-50)
kPa is applied to diaphram1 and (0-100) kPa is applied to diaphragm2. Figure 6 shows the Input
INTERNATIONAL JOURNAL ON SMART SENSING AND INTELLIGENT SYSTEMS, VOL. 2, NO. 3, SEPTEMBER 2009
471
Page 10
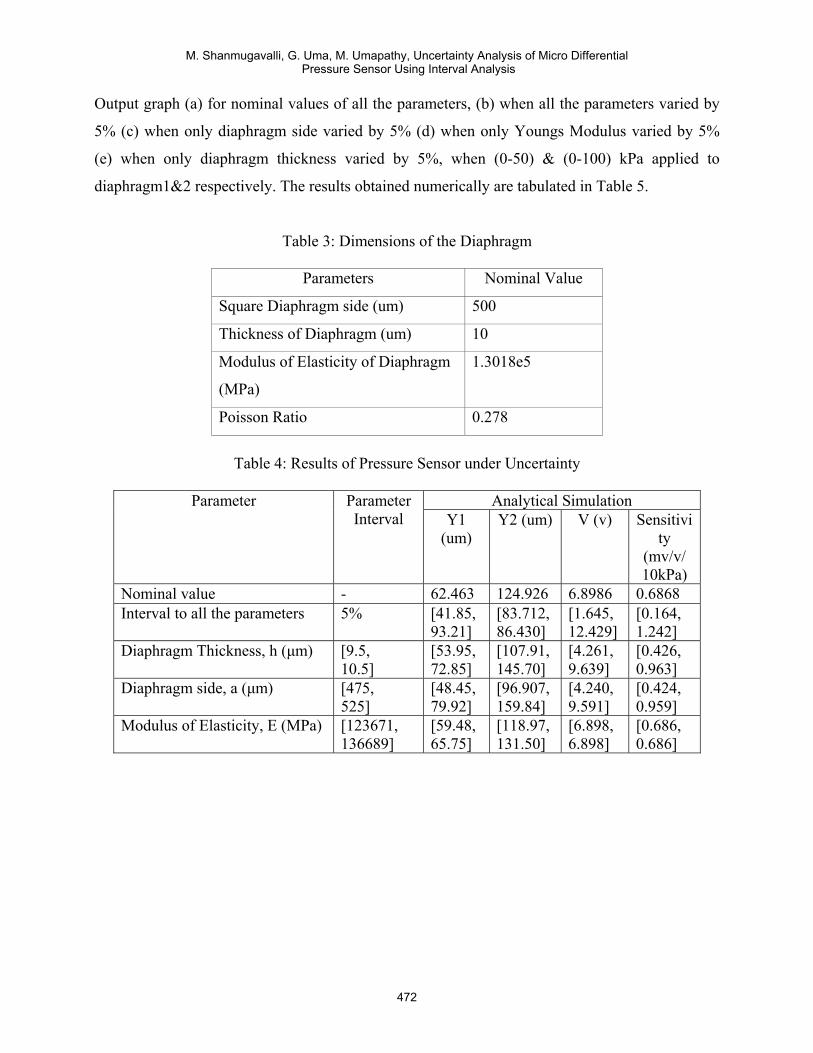
Output graph (a) for nominal values of all the parameters, (b) when all the parameters varied by
5% (c) when only diaphragm side varied by 5% (d) when only Youngs Modulus varied by 5%
(e) when only diaphragm thickness varied by 5%, when (0-50) & (0-100) kPa applied to
diaphragm1&2 respectively. The results obtained numerically are tabulated in Table 5.
Table 3: Dimensions of the Diaphragm
Parameters Nominal Value
Square Diaphragm side (um) 500
Thickness of Diaphragm (um) 10
Modulus of Elasticity of Diaphragm
(MPa)
1.3018e5
Poisson Ratio 0.278
Table 4: Results of Pressure Sensor under Uncertainty
Analytical Simulation Parameter Parameter
Interval Y1 (um)
Y2 (um) V (v) Sensitivity
(mv/v/ 10kPa)
Nominal value - 62.463 124.926 6.8986 0.6868 Interval to all the parameters 5% [41.85,
93.21] [83.712, 86.430]
[1.645, 12.429]
[0.164, 1.242]
Diaphragm Thickness, h (µm) [9.5, 10.5]
[53.95, 72.85]
[107.91, 145.70]
[4.261, 9.639]
[0.426, 0.963]
Diaphragm side, a (µm) [475, 525]
[48.45, 79.92]
[96.907, 159.84]
[4.240, 9.591]
[0.424, 0.959]
Modulus of Elasticity, E (MPa) [123671, 136689]
[59.48, 65.75]
[118.97, 131.50]
[6.898, 6.898]
[0.686, 0.686]
M. Shanmugavalli, G. Uma, M. Umapathy, Uncertainty Analysis of Micro Differential Pressure Sensor Using Interval Analysis
472
Page 11
Figure 6. Input Output graph (a) for nominal values of the parameters, (b) when all the
parameters varied by 5% (c) when only diaphragm side varied by 5% (d) when only youngs
modulus varied by 5% (e) when only diaphragm thickness varied by 5%
INTERNATIONAL JOURNAL ON SMART SENSING AND INTELLIGENT SYSTEMS, VOL. 2, NO. 3, SEPTEMBER 2009
473
Page 12
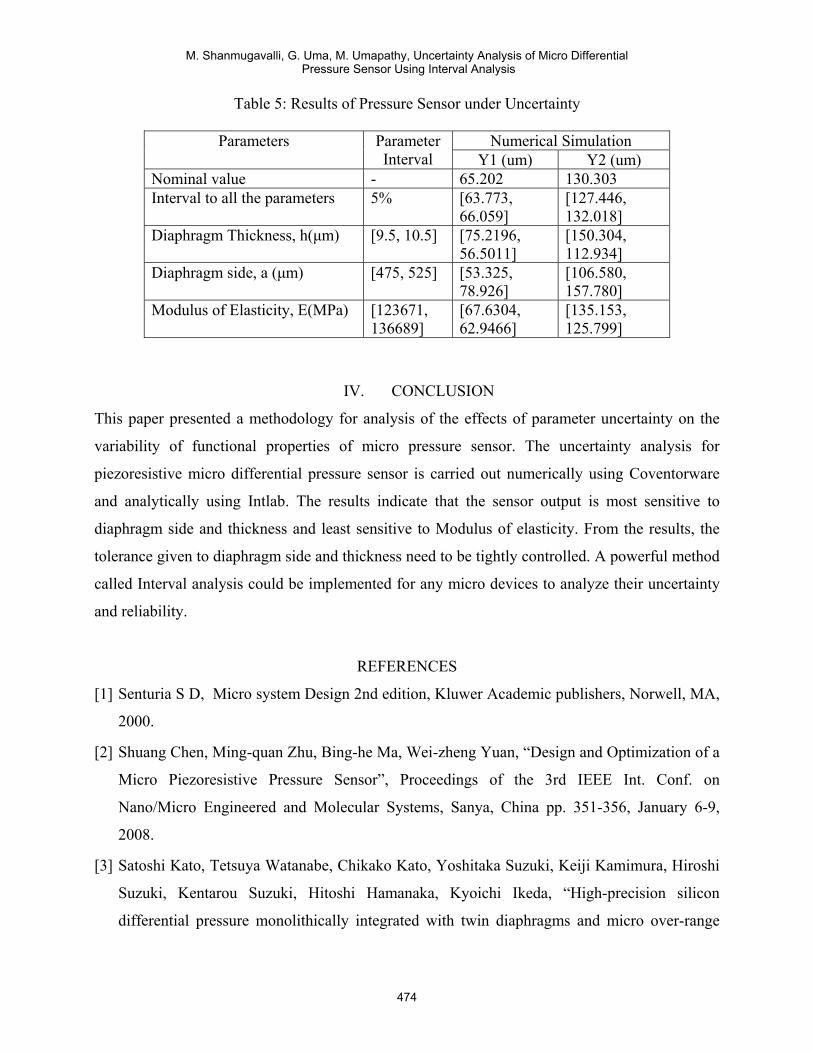
Table 5: Results of Pressure Sensor under Uncertainty
Numerical Simulation Parameters Parameter Interval Y1 (um) Y2 (um)
Nominal value - 65.202 130.303 Interval to all the parameters 5% [63.773,
66.059] [127.446, 132.018]
Diaphragm Thickness, h(µm) [9.5, 10.5] [75.2196, 56.5011]
[150.304, 112.934]
Diaphragm side, a (µm) [475, 525] [53.325, 78.926]
[106.580, 157.780]
Modulus of Elasticity, E(MPa) [123671, 136689]
[67.6304, 62.9466]
[135.153, 125.799]
IV. CONCLUSION
This paper presented a methodology for analysis of the effects of parameter uncertainty on the
variability of functional properties of micro pressure sensor. The uncertainty analysis for
piezoresistive micro differential pressure sensor is carried out numerically using Coventorware
and analytically using Intlab. The results indicate that the sensor output is most sensitive to
diaphragm side and thickness and least sensitive to Modulus of elasticity. From the results, the
tolerance given to diaphragm side and thickness need to be tightly controlled. A powerful method
called Interval analysis could be implemented for any micro devices to analyze their uncertainty
and reliability.
REFERENCES
[1] Senturia S D, Micro system Design 2nd edition, Kluwer Academic publishers, Norwell, MA,
2000.
[2] Shuang Chen, Ming-quan Zhu, Bing-he Ma, Wei-zheng Yuan, “Design and Optimization of a
Micro Piezoresistive Pressure Sensor”, Proceedings of the 3rd IEEE Int. Conf. on
Nano/Micro Engineered and Molecular Systems, Sanya, China pp. 351-356, January 6-9,
2008.
[3] Satoshi Kato, Tetsuya Watanabe, Chikako Kato, Yoshitaka Suzuki, Keiji Kamimura, Hiroshi
Suzuki, Kentarou Suzuki, Hitoshi Hamanaka, Kyoichi Ikeda, “High-precision silicon
differential pressure monolithically integrated with twin diaphragms and micro over-range
M. Shanmugavalli, G. Uma, M. Umapathy, Uncertainty Analysis of Micro Differential Pressure Sensor Using Interval Analysis
474
Page 13
protection structures” IEEE Proceedings on Micro Electro Mechanical Systems (MEMS
2000), Miyazaki, Japan pp 347-351, January 23-27, 2000.
[4] Cludio M. Rocco S, “Variability analysis of electronic systems: classical & interval
methods”, Proceedings Annual Reliability and Maintainability symposium, Philadelphia,
USA, pp. 188-193, 1997.
[5] Luca Schenato, Wei-Chung Wu, Laurent El Ghaoui and Kristofer Pister, “Process Variation
Analysis for MEMS Design” , SPIE Symposium on Smart Materials and MEMS, Melbourne,
Australia, 13-15 December, 2000.
[6] Moore R E Methods and applications of Interval Analysis (SIAM Philadelphia), 1979.
[7] Firtat, B.; Moldovan, C.; Iosub, R.; Necula, D.; Nisulescu, M., “Differential piezoresistive
pressure sensor”, International Semiconductor Conference, CAS 2007, Sinaia, Romania,
Volume 1, pp. 87 – 90, Oct. 15 - Sept. 17, 2007.
[8] C. Dawson, R. Figueroa, L. Comer. “Solid-state pressure sensors enhance domestic
appliances” Vol. 19, No. 6, Sensors Online June 2002, www.sensorsmag.com.
[9] G. Blasquez, P. Pons, A. Eoukabache, “Capabilities and limits of silicon pressure sensors”,
Sensors and Actuators A. Phys., Vol. 17, pp. 387-404, 1989.
[10] D. Belavic, S. Soba, M. Pavlin, D. Rocak, and M. Hrovat, “Silicon pressure sensors with
a thick film periphery,” Microelectron. Int., vol. 15, pp.26–30, 1998.
[11] H. L. Chau and K. D. Wise, “Scaling limits in batch-fabricated silicon pressure sensors,”
IEEE Trans. Electron Devices, vol. ED-34, pp. 850–858, 1987.
[12] P. Kopystynski and E. Obermeier, “An interchangeable silicon pressure sensor with on-
chip compensation circuitry,” Sensors and Actuators A, Phys., vol. 18, pp. 239–245, 1989.
[13] G. Kowalski, “Miniature pressure sensors and their temperature compensation,” Sensors.
and Actuators A, Phys., vol. 11, pp. 367–376, 1987.
[14] J. Gakkestad, P. Ohlckers, and L. Halbo, “Compensation of sensitivity shift in
piezoresistive pressure sensors using linear voltage excitation,” Sensors. and Actuators A,
Phys., vol. A 49, pp. 11–15, 1995.
[15] J. Bryzek, R. Mayer, and P. Barth, “Disposable blood pressure sensors with digital on-
chop laser trimming,” Proceedings of IEEE Solid State Sensor and Actuator Workshop Dig.,
Hilton Head, SC, pp. 121–122, 6-8 June, 1988.
INTERNATIONAL JOURNAL ON SMART SENSING AND INTELLIGENT SYSTEMS, VOL. 2, NO. 3, SEPTEMBER 2009
475
Page 14
[16] O. J. Gregory and Q. Luo, “A self-compensated ceramic strain gage for use at elevated
temperatures,” Sensors and Actuators A, Phys., vol. 88, pp. 234–240, 2001.
[17] S.Hein, K.Holzne, V. Schlichting, E.Obermeie, K.Barton “Capacitive Differential
Pressure Sensor with High Overload Capability Using Silicon Glass Technology”
TRANSDUCERS'97, International Conference on Solid-State Sensors and Actuators
Chicago, June 16- 19, 1997.
[18] Tetsuya Watanabe, Satoshi Fukuhara, Hideo Tsukamoto, Takahiro Kudo and Kyoichi
Ikeda “Differential Pressure Sensor with micro machined over range protectors”
TRANSDUCERS '95, EUROSENSORS IX, The 8th International Conference on Solid-state
Sensors and Actuators, and EurosensorsI X Stockholm, Sweden, pp. 578-581, June 25-29,
1995,.
M. Shanmugavalli, G. Uma, M. Umapathy, Uncertainty Analysis of Micro Differential Pressure Sensor Using Interval Analysis
476