31
Uncertainty Assessment: Uncertainty Assessment: India’s Experience Sumana Bhattacharya Sumana Bhattacharya NATCOM, MoEF, India

Uncertainty Assessment:Uncertainty Assessment: India’s Experiencep
Sumana BhattacharyaSumana BhattacharyaNATCOM, MoEF, India

Approach towards reducing uncertainties in GHG estimates
• Development of country specific GHG i i f temission factors
- Updating the same with timep g- Evaluating key sources over time and
developing new emission factorsdeveloping new emission factors• Identifying uncertainties in the steps of
GHG estimates itself by using the IPCC guidelinesguidelines

NATCOM INATCOM-I

Institutional arrangement: NATCOM I

Moving on to NATCOM IIMoving on to NATCOM - II
• Refinement of existing factors• Development of new emission factorsDevelopment of new emission factors • Moving towards higher tier estimates for
k t ikey source categories• Bridging data gaps identified in NATCOM Idg g data gaps de t ed CO• Launching standard QA/QC procedures
for each of the categoriesfor each of the categories

Key Sources analysisa a ys s

Planning for reducing uncertainties

Planning for reducing uncertainties
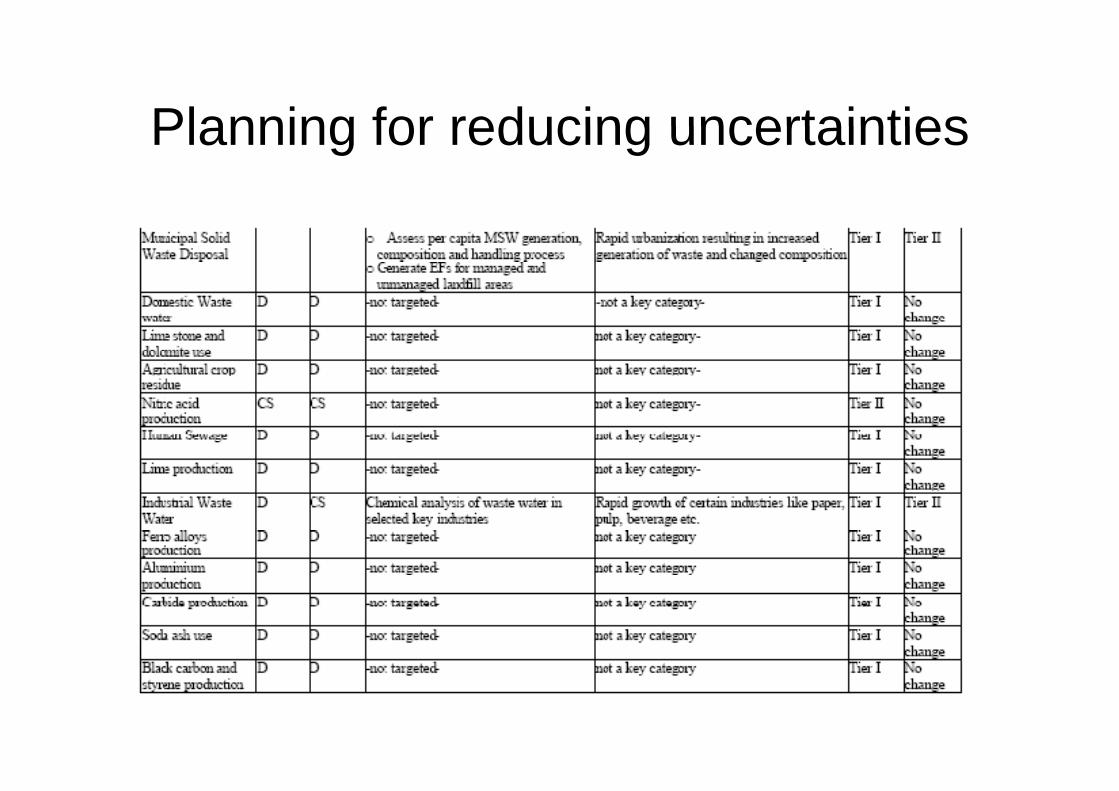
Planning for reducing uncertaintiesPlanning for reducing uncertainties
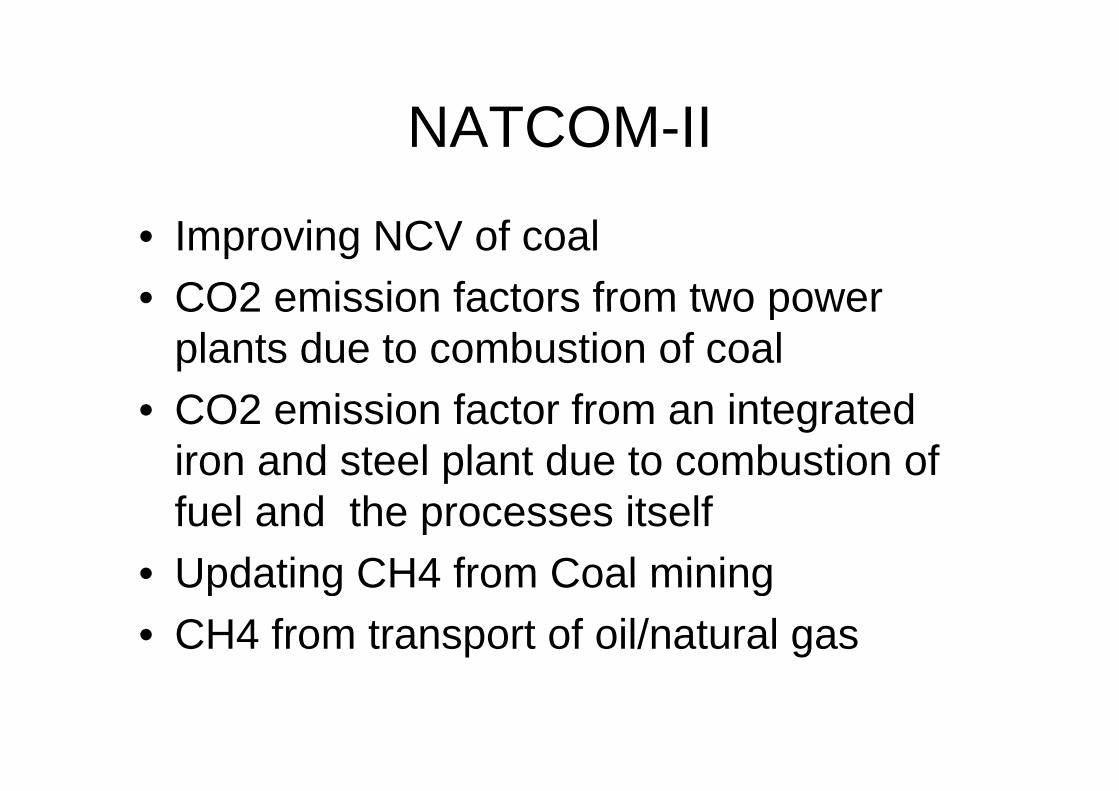
NATCOM IINATCOM-II
• Improving NCV of coal• CO2 emission factors from two powerCO2 emission factors from two power
plants due to combustion of coalCO2 i i f t f i t t d• CO2 emission factor from an integrated iron and steel plant due to combustion of fuel and the processes itself
• Updating CH4 from Coal mining• Updating CH4 from Coal mining• CH4 from transport of oil/natural gas

NATCOM IINATCOM-II
• CH4 from continuously irrigated rice fields• N2O from agricultural soilsN2O from agricultural soils• Improving CH4 EF from enteric fermentation
i Li t kin Livestock• Soil C from ForestsSo C o o ests• CH4 from MSW • CH4 from Waste water from key industries
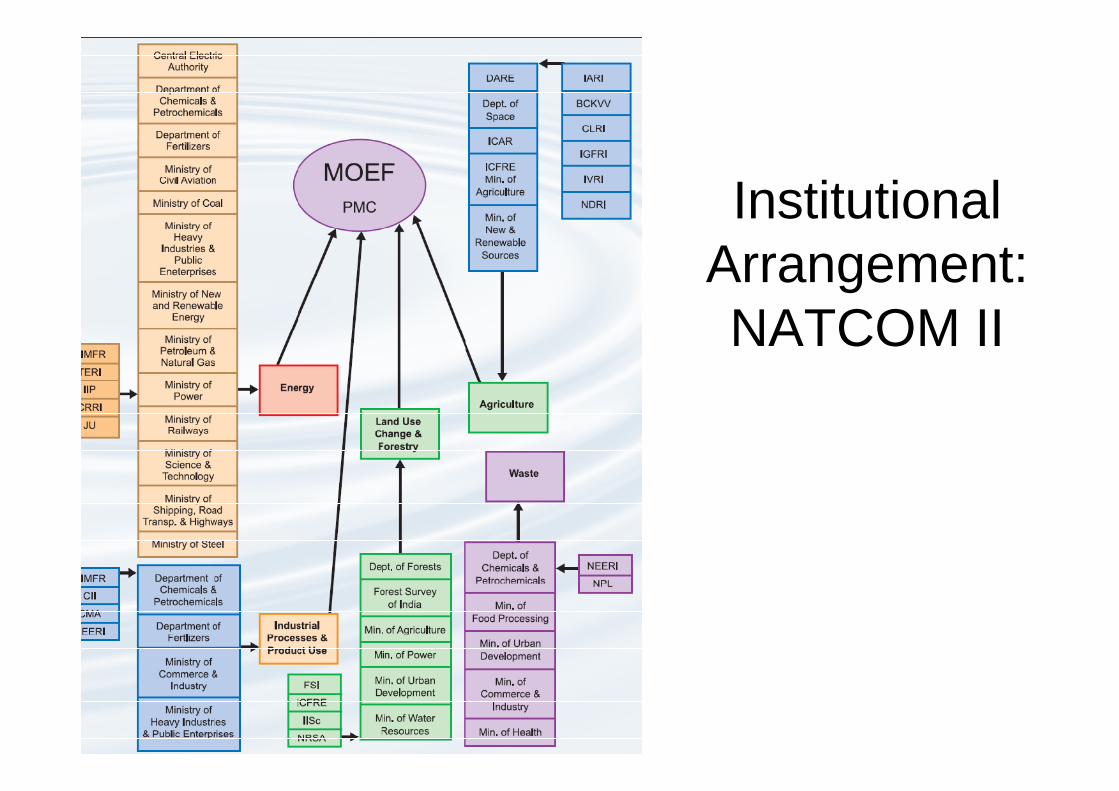
InstitutionalInstitutional Arrangement: NATCOM II
An example – LULUCF – Soil C

Problems to address..
Preparation of Forest type and sub-group type map of India (Champion& Seth, 1968)Harmonization of different spatial layers of India (forest types, actualforest cover, administrative boundaries and collateral data sources), andassigning them uniform spatial standardsNon-existence or localized presence of some of the forest sub-grouptypes and difficulty in locating themEven modern tools like RS and recent published estimates gives onlyEven modern tools like RS and recent published estimates gives onlyforest types and sub-group type associations/equivalents
Opportunities..Opportunities..Preparation of Forest type map and sub-group type details of India intabular format (Champion & Seth, 1968)Harmoni ation of different spatial la ers of India (forest t pes act alHarmonization of different spatial layers of India (forest types, actualforest cover, administrative boundaries and collateral data sources) inGIS and assigning them uniform spatial standardsUse of FSI and DBT-DOS reports
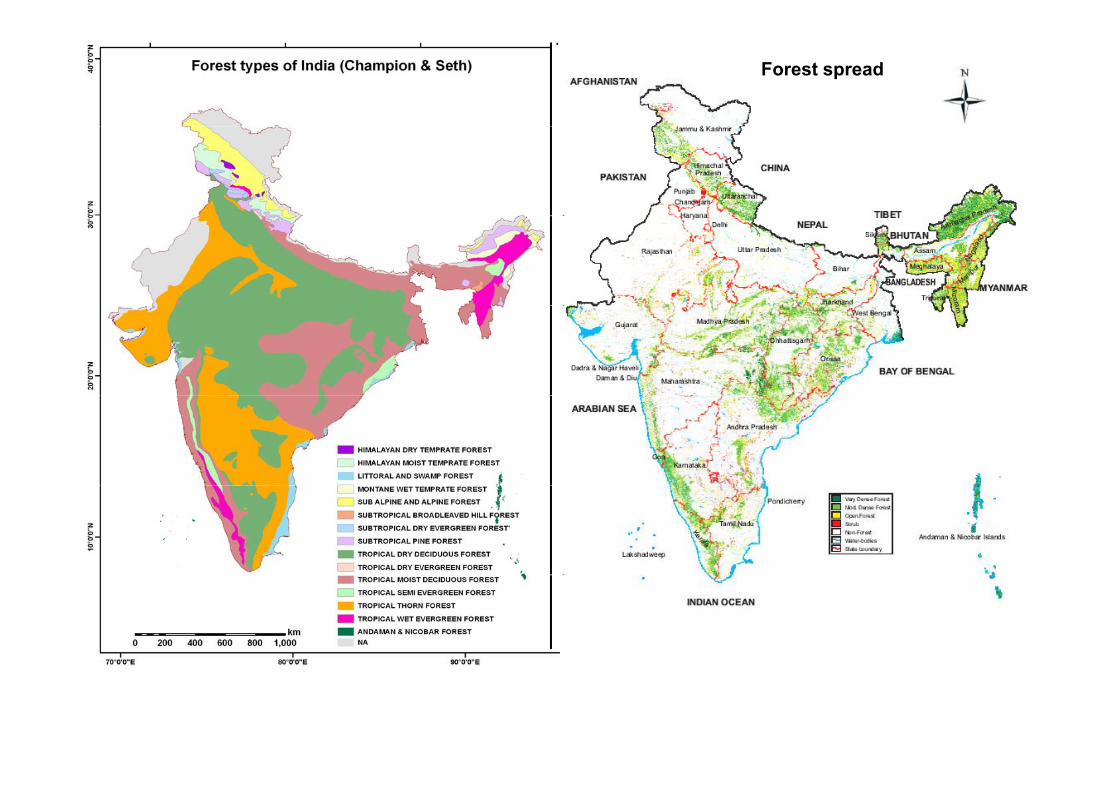
Forest spread

Flow diagram showing overview of methodology
Forest types of India (C&S)
Forest cover(FSI) Admin. boundary
NATCOM-IRegi stration
(Spatial standards)Regi stration
(Spatial standards)Regi stration
(Spatial standards)
DBT/DOS Reports
GIS integrationGIS integration
Other data sources
Spatial layers
Local knowledgeOther data sources
Identification of possible subgroup types
Field verification & soil sampling
subgroup types
Correction
I BT/
DO
SR
SA obal
hers
estimation
Area of forest types/
Soil C content
Soil analysis
FS DB
NR
Glo
Oth
Expert decision
ANALYSISArea of forest types/ major species
Soil C density & stock
Soil C density & stock
ANALYSIS
NATCOM-IIReporting
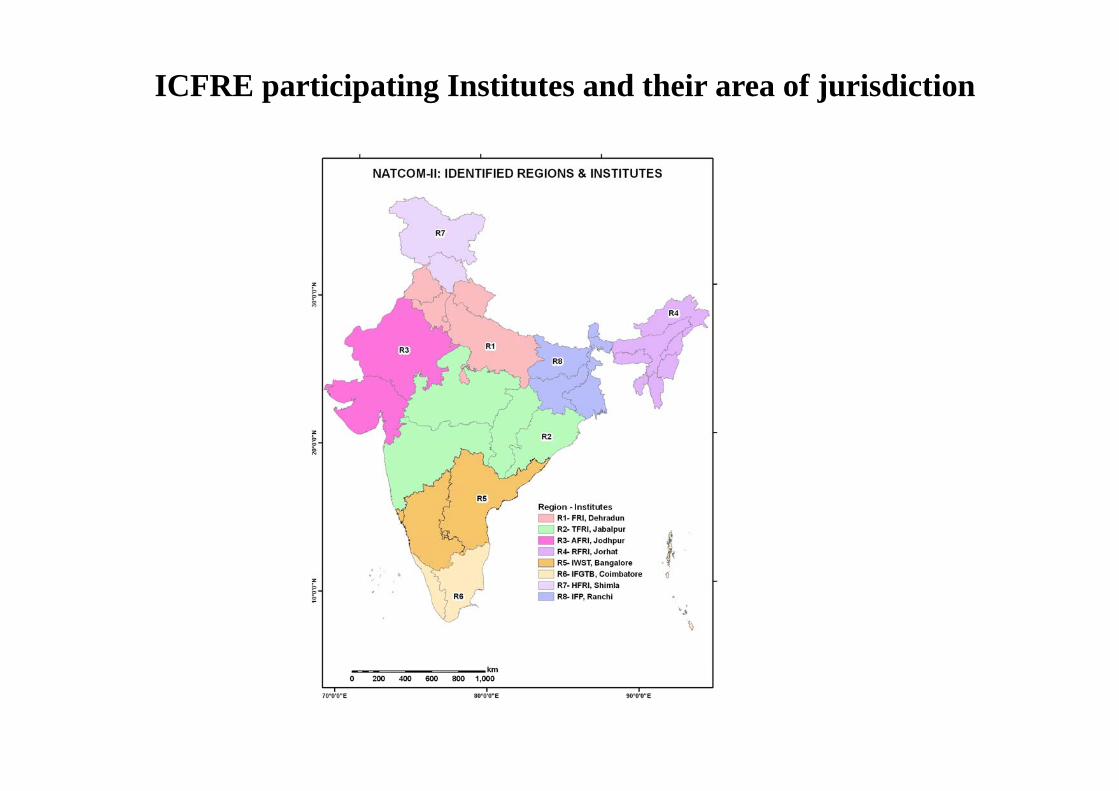
ICFRE participating Institutes and their area of jurisdiction
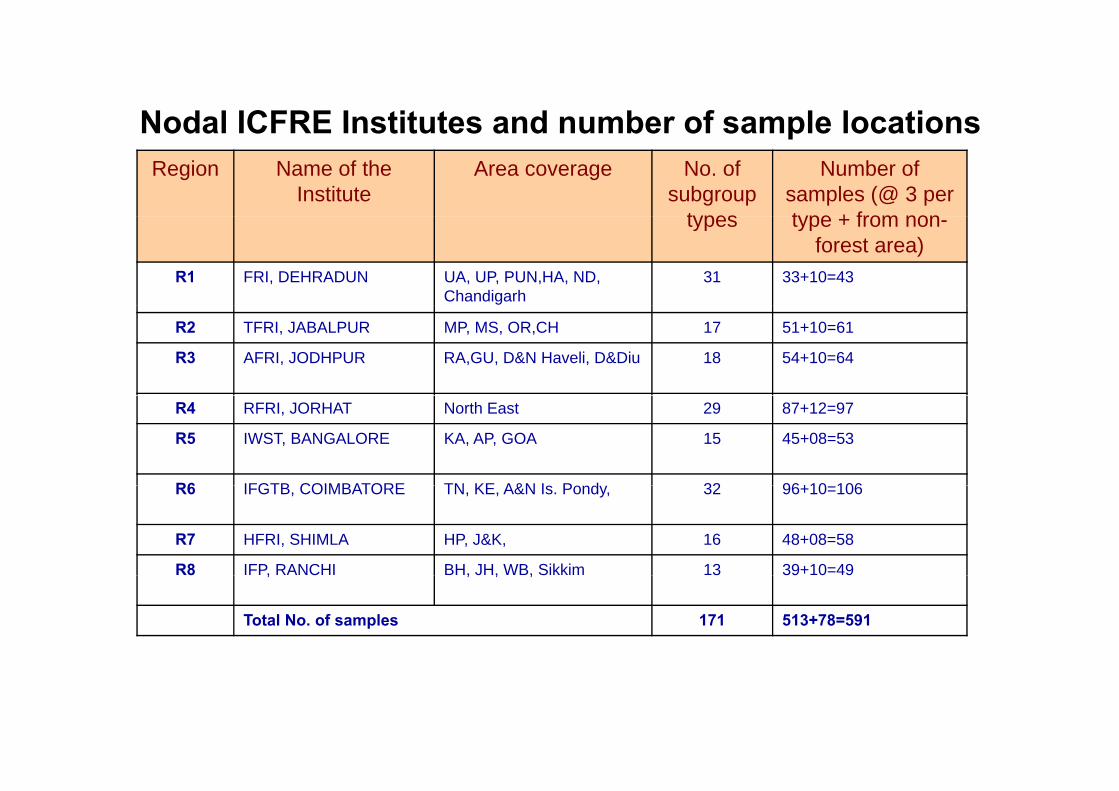
Nodal ICFRE Institutes and number of sample locationsNodal ICFRE Institutes and number of sample locationsRegion Name of the
InstituteArea coverage No. of
subgroup types
Number of samples (@ 3 per type + from nontypes type + from non-
forest area)R1 FRI, DEHRADUN UA, UP, PUN,HA, ND,
Chandigarh31 33+10=43
R2 TFRI, JABALPUR MP, MS, OR,CH 17 51+10=61
R3 AFRI, JODHPUR RA,GU, D&N Haveli, D&Diu 18 54+10=64
R4 RFRI, JORHAT North East 29 87+12=97
R5 IWST, BANGALORE KA, AP, GOA 15 45+08=53
R6 IFGTB COIMBATORE TN KE A&N I P d 32 96+10 106R6 IFGTB, COIMBATORE TN, KE, A&N Is. Pondy, 32 96+10=106
R7 HFRI, SHIMLA HP, J&K, 16 48+08=58
R8 IFP, RANCHI BH, JH, WB, Sikkim 13 39+10=498 , C , J , , S 3 39 0 9
Total No. of samples 171 513+78=591

What is given
Forest types sub groups sub group types C & S code
What is given…
Forest types, sub-groups, sub-group types, C & S code,distribution and dominant species along with theidentified institute is supplied to every participatingidentified institute is supplied to every participatinginstitutes.This will be supplemented with any other map availablefor now or as soon is become available.
Detailed methodology Prepared for :
Sample collectionStorageAnalysis and calculationy
Inception meeting with Nodal officers from different ICFRE Institutes conducted 9 10 MayICFRE Institutes conducted 9-10 May
Sampling procedure to be uniformally adopted by all p g p y p yteams demonstrated in the field
QA/QC plan developedQA/QC plan developed
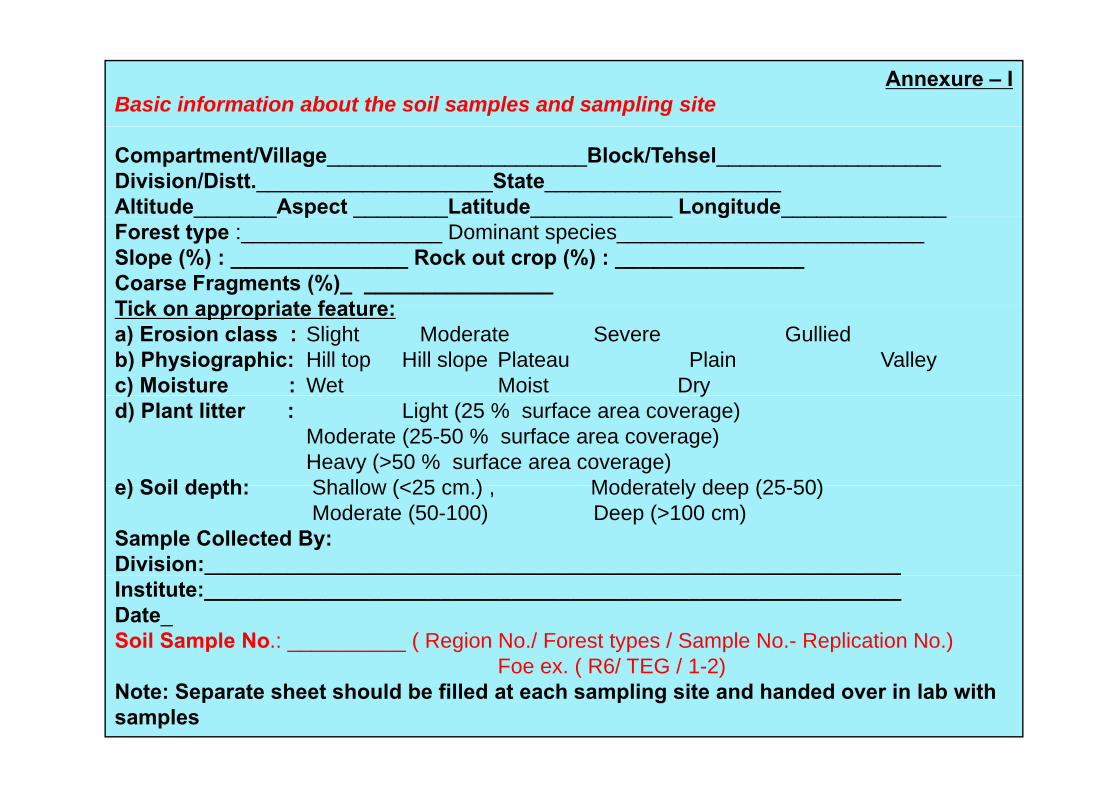
Annexure – IBasic information about the soil samples and sampling site
Compartment/Village______________________Block/Tehsel___________________Division/Distt.____________________State____________________Altitude Aspect Latitude Longitude_______ p ________ ____________ g ______________Forest type :_________________ Dominant species__________________________Slope (%) : _______________ Rock out crop (%) : ________________ Coarse Fragments (%)_ ________________ Tick on appropriate feature:Tick on appropriate feature: a) Erosion class : Slight Moderate Severe Gulliedb) Physiographic: Hill top Hill slope Plateau Plain Valleyc) Moisture : Wet Moist Dry) yd) Plant litter : Light (25 % surface area coverage)
Moderate (25-50 % surface area coverage)Heavy (>50 % surface area coverage)
e) Soil depth: Shallow (<25 cm ) Moderately deep (25 50)e) Soil depth: Shallow (<25 cm.) , Moderately deep (25-50) Moderate (50-100) Deep (>100 cm)
Sample Collected By:Division:______________________________________________________________________________________________________________________Institute:___________________________________________________________Date_Soil Sample No.: __________ ( Region No./ Forest types / Sample No.- Replication No.)
Foe ex ( R6/ TEG / 1 2)Foe ex. ( R6/ TEG / 1-2)Note: Separate sheet should be filled at each sampling site and handed over in lab with samples
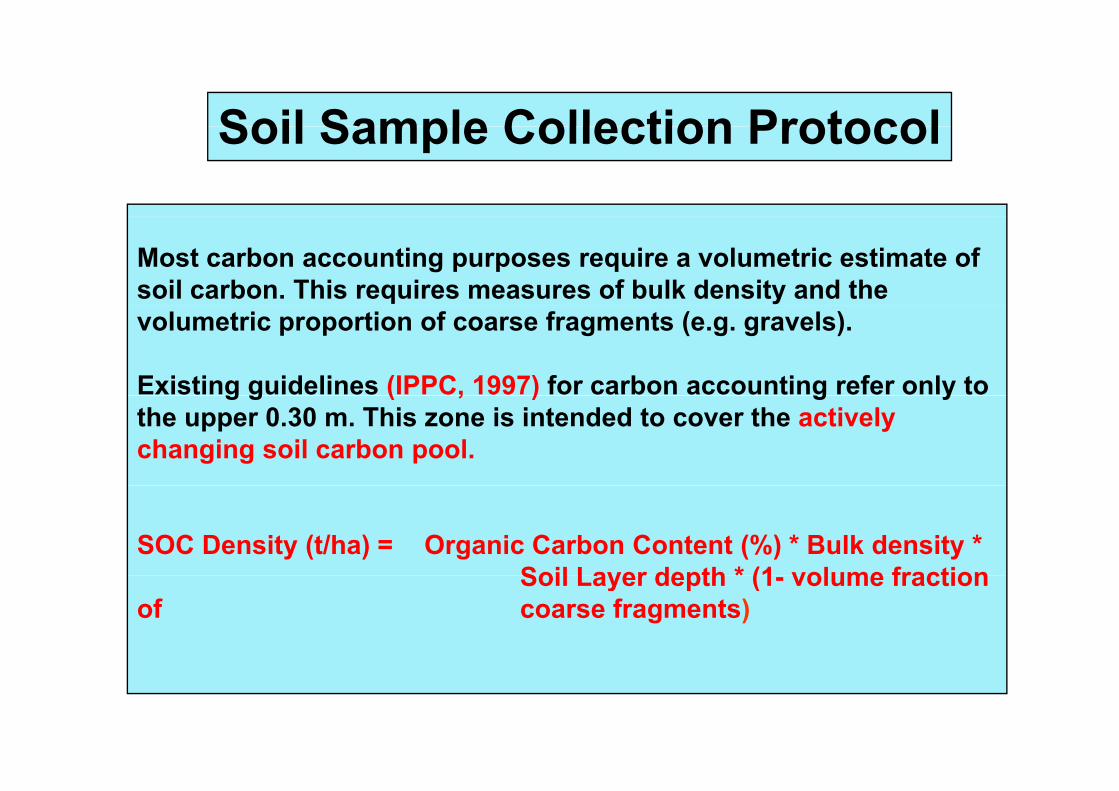
Soil Sample Collection ProtocolSoil Sample Collection Protocol
Most carbon accounting purposes require a volumetric estimate of soil carbon. This requires measures of bulk density and the volumetric proportion of coarse fragments (e.g. gravels).
Existing guidelines (IPPC, 1997) for carbon accounting refer only to g g ( , ) g ythe upper 0.30 m. This zone is intended to cover the actively changing soil carbon pool.
SOC Density (t/ha) = Organic Carbon Content (%) * Bulk density * Soil Layer depth * (1 volume fractionSoil Layer depth * (1- volume fraction
of coarse fragments)
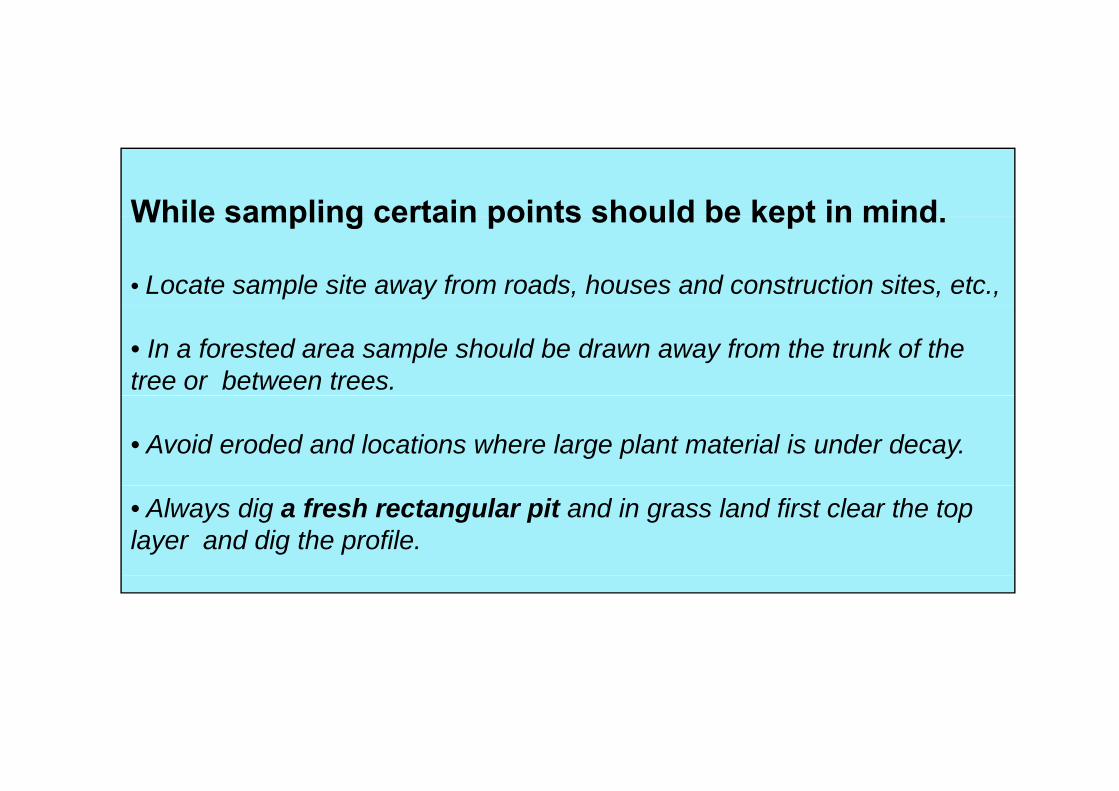
While sampling certain points should be kept in mindWhile sampling certain points should be kept in mind.
• Locate sample site away from roads, houses and construction sites, etc.,
• In a forested area sample should be drawn away from the trunk of the tree or between trees.
• Avoid eroded and locations where large plant material is under decay.
• Always dig a fresh rectangular pit and in grass land first clear the top layer and dig the profile.

1. Estimating Rock Outcrop
It is desirable to have a more accurate estimate of the volume of rock within the soil individual. Measure rock outcrop along a series of linear transects. At each transect intercept, record the length of rock surface (>50 mm). The area of rock outcrop is estimated using:
Aro = 100 (∑r / L)
where Aro is the areal percentage of of rock outcrop, L is the total e e o s t e a ea pe ce tage o o oc outc op, s t e totatransect length and r is the length of rock intercepted (m).
Rock outcrop can also be measured using the 10 m grid (100 m2 area) assuming that the observer is at the middle of the grid. Make schematic sketch of the rock out crop on the grid and estimate the percentagesketch of the rock out crop on the grid and estimate the percentage.
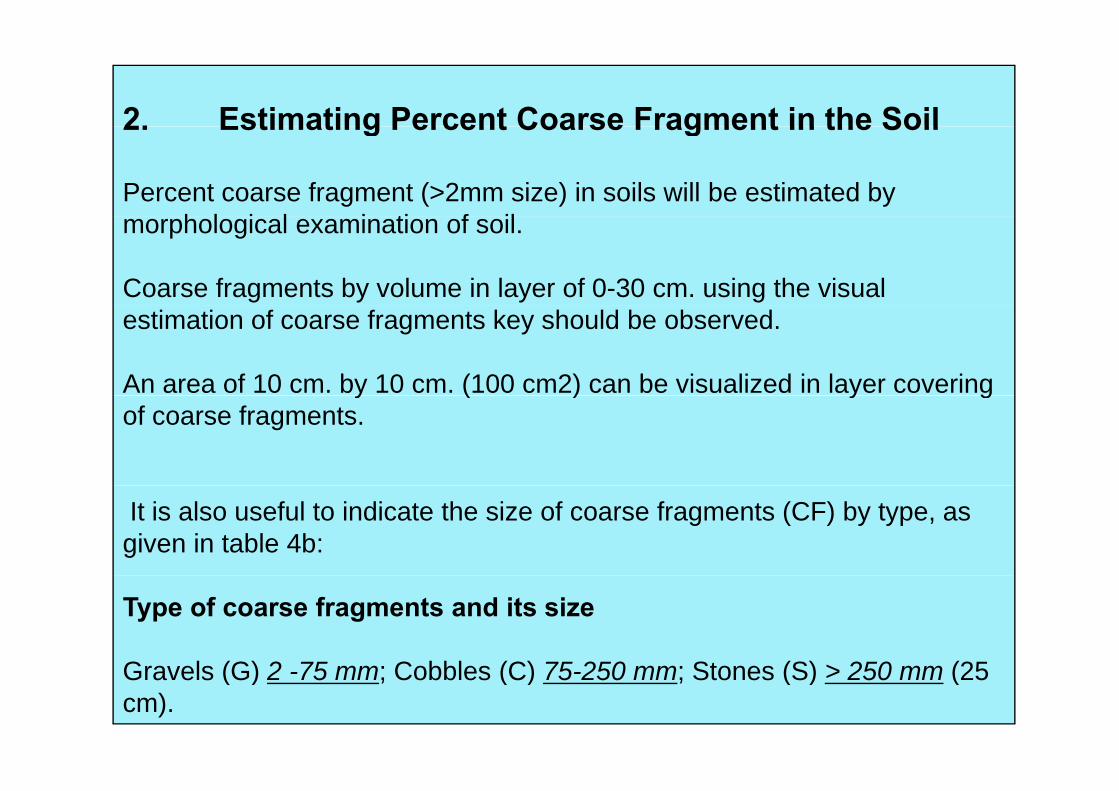
2. Estimating Percent Coarse Fragment in the Soil2. Estimating Percent Coarse Fragment in the Soil
Percent coarse fragment (>2mm size) in soils will be estimated by h l i l i ti f ilmorphological examination of soil.
Coarse fragments by volume in layer of 0-30 cm. using the visual estimation of coarse fragments key should be observed.
An area of 10 cm. by 10 cm. (100 cm2) can be visualized in layer covering y ( ) y gof coarse fragments.
It is also useful to indicate the size of coarse fragments (CF) by type, as given in table 4b:
Type of coarse fragments and its size
G l (G) 2 75 C bbl (C) 75 250 St (S) > 250 (25Gravels (G) 2 -75 mm; Cobbles (C) 75-250 mm; Stones (S) > 250 mm (25 cm).

3. Collection of Samples
In each sampling units, three sampling points will be selected as li treplicates.
At each point soil sample of 0-30 cm. depth will be collected.
One sample will also be collected in non-forested area (agricultural area)close to the major forest types. j yp
Detailed number of samples forest sub types and nodal institutes areDetailed number of samples, forest sub types and nodal institutes are given in sampling plan with participating institute.

3.1 Soil sample for carbon estimation:
• Forest floor litter of an area of 0.5m x 0.5 m, at sampling point will be removed and a pit of 30 cm wide, 30 cm deep and 50 cm in length will be dug outdug out.
• Soil from three sides of the pit, will be scraped with the help of Kurpee from 0 to 30 cm depth and bulked Scrap uniform thickness of soil layerfrom 0 to 30 cm depth and bulked. Scrap uniform thickness of soil layerfrom top to bottom (0-30m cm)
• This soil will be mixed thoroughly and removed gravels. Quarter the bulked soil sample and select opposite quarter approximately of 500 gm. Here, coarse fragments can also be approximated.
• Keep in a polythene bag and tightly closed with thread.
• A label showing the sampling details should be put in side of polythene bag before closing the bag.
• Proper entry to be made in field note book
3.2 For bulk density estimation by Core sampler
3.3 Storage of the samplesg p
• If numbers of samples are large and not possible to analyze / process immediately after collection from field, then samples collected for soil organic y p gcarbon, should be placed in refrigerator or deep freezer.
• Taken out desired numbers of sample and prepare them for estimation.
4. Preparation of sample
4.1 Carbon estimation in the laboratory
O th l th b d d th l b h t i• Open the polythene bag and spread the samples on a brown paper sheet in the laboratory. Let the sample dry at room temperature in the laboratory.
• Avoid direct sun drying or oven drying• Avoid direct sun drying or oven drying.
• Marking of the sample (which was given on the label at the time of the collection of sample) should be written on the brown paper sheet to avoid thecollection of sample) should be written on the brown paper sheet to avoid the mixing of the samples.
• After drying the samples grind it and sieve it through 100 mesh sieve (2 mmAfter drying the samples, grind it and sieve it through 100 mesh sieve (2 mm sieve). This sieved sample will be used for soil organic carbon estimation.
4.2Analysis4.2Analysis
Soil organic carbon will be estimated by standard Walkley & Black method and

Vegetation characteristics of the sample site
Measure 22x22m either side of sample location (Quadrat of 31x31 m=0.1 ha)
Enumerate all tree species > 10 cm dia within the quadratwithin the quadrat
For shrubs 5x5 m qudartFor shrubs 5x5 m qudart
For herbs and grasses 1x1 m quadratFor herbs and grasses 1x1 m quadrat


