112
Financial Services August 2019 kpmg.co.za Uncharted The South African Insurance Industry Survey 2019

Financial Services
August 2019
kpmg.co.za
UnchartedThe South African Insurance Industry Survey 2019


ContentsGovernance and individual accountability 3
Insurance in Nigeria and Kenya: a financial performance comparison 9
The implications of new mobility models on insurance 13
IFRS 17 challenges in the South African market 17
Dynamic risk assessment 23
Kenyan insurance sector grapples with increasing regulatory requirements 29
Correlates with death and other morbid statistics 31
Data privacy 39
Cyber insurance – how Insuretechs can unlock the opportunity 43
Short-term insurance industry results 51
Short-term insurance tables 56
Long-term insurance industry results 77
Long-term insurance tables 80
Reinsurance insurance industry results 99
Reinsurance insurance tables 104

Mark DanckwertsPartner Head of Insurance: KPMG in South Africa Tel: +27 82 710 3261 Email: [email protected]

The South African Insurance Industry Survey 2019 | 1
Is it a bird; is it a plane?1 Oh no Father, it ’s a drone! Well in my day my boy, a drone was a bee. What’s it doing? Why Father it’s scanning that pine plantation for disease, delivering medicine to poor and far-flung communities and taking pictures of that driverless motor car to see how damaged it is.
But Father, what is a bee? A bee was an insect that would buzz around happily all day long, flying from flower to flower to collect pollen and nectar to make honey and while it did that it would drop bits of pollen from one plant onto other plants to fertil ise them. On sunny days there would be many bees working at the same time, and the air would be noisy with their droning. I think I shall buy a drone Father; and I shall drop pollen all over and fill the meadows and dales with beautiful flowers! And how will you do that you sil ly boy; you have no bitcoins!
The insurance industry is having a moment. Old rules are being set aside and new realities are being explored. My fear was that South African insurers would do nothing but many have done much. It is with great pride that we release another survey of the financial results of 37 of South Africa’s short-term insurance companies, 22 long-term insurers and 8 reinsurance companies. I hope that you will enjoy reading the survey and the articles written by the extraordinary people in our insurance practice.
1 It's a Bird... It's a Plane... It's Superman is the title of a 1966 Broadway musical composed by Charles Strouse
2 | The South African Insurance Industry Survey 2019
Finn ElliotAssociate Director Insurance Law Tel: +27 79 039 9367 Email: [email protected]
Mark DanckwertsPartner: Insurance Head of Market Conduct Practice Tel: +27 82 710 3261 Email: [email protected]

The South African Insurance Industry Survey 2019 | 3
Governance and individual accountabilityHiding behind the accountability veil
Conduct regulation was recently introduced into South Africa. It manifests itself most patently in the establishment of the conduct regulator, being the Financial Sector Conduct Authority (“FSCA”) and in the introduction of “a consolidated, comprehensive and consistent regulatory framework for the conduct of financial institutions”, in the form of the Conduct of Financial Institutions (“COFI”) Act (currently still a draft Bill).
The primary objective of the FSCA is the regulation and supervision of the “conduct of business” of all financial institutions. Conduct introduces a distinct shift in the manner and approach to the regulation and supervision of the financial services industry, by the FSCA. Key amongst these, is the potential introduction of an accountability regime, in one form or another.
Individual accountability
The National Treasury’s Explanatory Policy Paper accompanying the COFI Bill requires,
"…improvements in financial institutions’ culture, including ensuring appropriate governance frameworks and that decision makers are directly and personally held accountable for
weak governance and abusive practices by the institution, [for] ensuring that financial institutions better serve South Africans."
The 2018 Financial Markets Review recommended that “regulators consider the implementation of an accountability regime that is equivalent and proportional for all market participants…"
We know that governance and accountability is a key focus of the FSCA, and that it is taking it very seriously. The comments made thus far provide a strong indication of the direction that the FSCA may move in, and the extent to which it may go, in order to drive accountability within financial institutions.
Accountability has always been a feature of corporate governance, but this presents a clear regulatory enforcement mechanism to be able to hold senior management to account.
Essentially in terms of the concept of “individual accountability”, senior managers in a financial institution are held personally liable for regulatory breaches and conduct failures.
Enabling the regulator to link inappropriate customer outcomes to those individuals responsible forthe decisions that resulted in those inappropriate
outcomes will, in turn, ensure that important responsibilities within a financial institution are appropriately assigned to specific senior managers.
The focus on accountability is not just a South African concept; the concept of holding individuals within financial institutions personally accountable for abusive practices is becoming a regulatory focus area around the world. The UK, Australia, Hong Kong, Singapore and the US have all implemented forms of individual accountability and more countries are likely to follow suit over the coming years.
Why introduce “individual accountability”?
If we consider the UK example, there was significant criticism that the then existing regulatory framework was unable to hold individuals accountable for their personal responsibility and, as a consequence, there was concern that senior managers continued to shelter behind an accountability veil.
The inference is that senior managers were not seen to be adequately taking account for their responsibilities and that internal mechanisms within business, to hold senior managers to account, were lacking.
4 | The South African Insurance Industry Survey 2019
There is a strong interplay between culture and accountability. Accountability is one of the key indicators of a strong corporate culture. The threat of regulatory sanctions will hopefully engender an enhanced sense of accountability, which should in turn strengthen corporate culture ultimately driving down misconduct in the business.
The South African context
We don’t have certainty on whether “individual accountability” will be introduced into South Africa; in what form it may be introduced or when it might happen.
However, it would be amiss to ignore the regulatory tone and direction that the FSCA is taking in this regard.
Either way, senior management will receive increased scrutiny and attention from the FSCA for their roles and accountability within financial institutions.
At its core the accountability regime requires that all financial institutions ensure that the “universe” of conduct responsibilities is properly identified and individual accountability is assigned to senior managers for each responsibility.
What should you think about?
A key question is whether your business would respond to the introduction of individual accountability purely as a regulatory burden or because developing consequence management mechanisms to hold senior managers to account for their responsibilities for the fair treatment of customers is the correct approach and builds a culture of integrity.
– Do you consider it necessary to introduce or enhance your accountability mechanisms and consequence for senior management failures in Conduct?
– Are responsibilities properly delegated and accountabilities properly defined to senior management across your business?
– Have you developed a comprehensive responsibilities universe reflecting how all senior management are responsible and accountable and how this responsibility is shared across the business?

The South African Insurance Industry Survey 2019 | 5

6 | The South African Insurance Industry Survey 20196 | The South African Insurance Industry Survey 2019
Visibility of tax data is often not good, making it difficult to evaluate the accuracy and completeness of tax decisions made by the organisation.
Technology and more specifically Data Analytics can provide substantial benefits to tax functions by providing better visibility and insight into tax data. This allows tax functions to be in control of their data and the tax decisions made across the organisation. Having visibility and insights to millions of transactions, and a view of trends and potential risk indicators at your fingertips, will give tax functions more time to evaluate discrepancies and improve overall value add to the organisation. Imagine a world where the Tax department is in control of the full end-to-end tax process, while simultaneously reducing risks through sufficient controls and processes.
KPMG can put you in control of your tax data and compliance.
For more information please contact: Madelein van Zyl Partner, Insurance Tax Technology T: +27 82 718 8810 E: [email protected]
Tax Technology in the Insurance Industry
Teresa Fondse Manager, Insurance Tax Technology T: +27 82 719 5791 E: [email protected]

The South African Insurance Industry Survey 2019 | 7
Teresa Fondse Manager, Insurance Tax Technology T: +27 82 719 5791 E: [email protected]

8 | The South African Insurance Industry Survey 2019
Gerben DraaijerConsultant Actuary: Insurance Tel: +27 66 307 1017 Email: [email protected]
The South African Insurance Industry Survey 2019 | 9
Insurance in Nigeria and Kenya: a financial performance comparisonIn South Africa, the insurance industry is relatively mature, sophisticated and competitive. As South Africa continues to be a gateway to the rest of Africa, we thought it would be interesting to consider two of the other relatively large insurance markets in Africa.
This article covers some of the insights gained from working in a number of African countries and predominantly focuses on the results of a recent benchmarking study conducted by KPMG of nine short term insurers in Nigeria and six short term insurers in Kenya for 2018. The focus areas of the study were profitability, use of reinsurance, reserving ratios and volumes of business written.
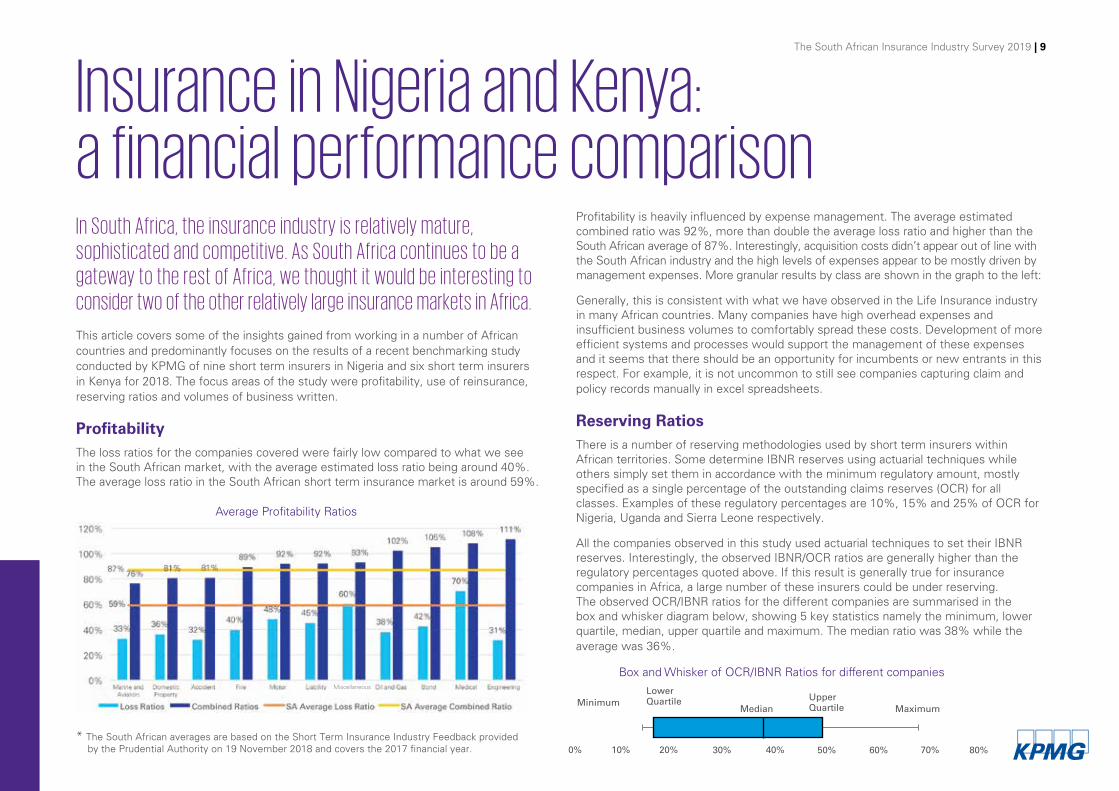
ProfitabilityThe loss ratios for the companies covered were fairly low compared to what we see in the South African market, with the average estimated loss ratio being around 40%. The average loss ratio in the South African short term insurance market is around 59%.
Profitability is heavily influenced by expense management. The average estimated combined ratio was 92%, more than double the average loss ratio and higher than the South African average of 87%. Interestingly, acquisition costs didn’t appear out of line with the South African industry and the high levels of expenses appear to be mostly driven by management expenses. More granular results by class are shown in the graph to the left:
Generally, this is consistent with what we have observed in the Life Insurance industry in many African countries. Many companies have high overhead expenses and insufficient business volumes to comfortably spread these costs. Development of more efficient systems and processes would support the management of these expenses and it seems that there should be an opportunity for incumbents or new entrants in this respect. For example, it is not uncommon to still see companies capturing claim and policy records manually in excel spreadsheets.
Reserving RatiosThere is a number of reserving methodologies used by short term insurers within African territories. Some determine IBNR reserves using actuarial techniques while others simply set them in accordance with the minimum regulatory amount, mostly specified as a single percentage of the outstanding claims reserves (OCR) for all classes. Examples of these regulatory percentages are 10%, 15% and 25% of OCR for Nigeria, Uganda and Sierra Leone respectively.
All the companies observed in this study used actuarial techniques to set their IBNR reserves. Interestingly, the observed IBNR/OCR ratios are generally higher than the regulatory percentages quoted above. If this result is generally true for insurance companies in Africa, a large number of these insurers could be under reserving. The observed OCR/IBNR ratios for the different companies are summarised in the box and whisker diagram below, showing 5 key statistics namely the minimum, lower quartile, median, upper quartile and maximum. The median ratio was 38% while the average was 36%.
Box and Whisker of OCR/IBNR Ratios for different companies
0% 10% 20% 30% 40% 50% 60% 70% 80%
MinimumLower Quartile Upper
QuartileMedian Maximum
Average Profitability Ratios
* The South African averages are based on the Short Term Insurance Industry Feedback provided by the Prudential Authority on 19 November 2018 and covers the 2017 financial year.
Miscellaneous
10 | The South African Insurance Industry Survey 2019
Use of Reinsurance
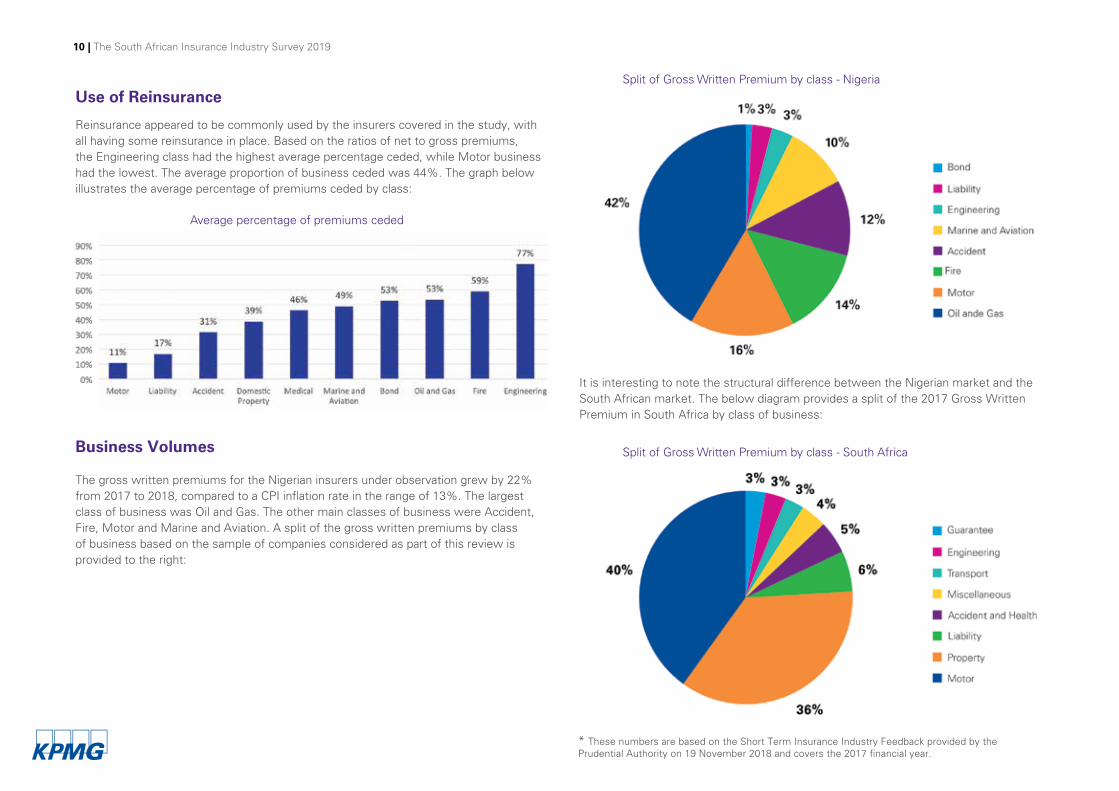
Reinsurance appeared to be commonly used by the insurers covered in the study, with all having some reinsurance in place. Based on the ratios of net to gross premiums, the Engineering class had the highest average percentage ceded, while Motor business had the lowest. The average proportion of business ceded was 44%. The graph below illustrates the average percentage of premiums ceded by class:
Business Volumes
The gross written premiums for the Nigerian insurers under observation grew by 22% from 2017 to 2018, compared to a CPI inflation rate in the range of 13%. The largest class of business was Oil and Gas. The other main classes of business were Accident, Fire, Motor and Marine and Aviation. A split of the gross written premiums by class of business based on the sample of companies considered as part of this review is provided to the right:
It is interesting to note the structural difference between the Nigerian market and the South African market. The below diagram provides a split of the 2017 Gross Written Premium in South Africa by class of business:
Average percentage of premiums ceded
Split of Gross Written Premium by class - Nigeria
* These numbers are based on the Short Term Insurance Industry Feedback provided by the Prudential Authority on 19 November 2018 and covers the 2017 financial year.
Split of Gross Written Premium by class - South Africa

The South African Insurance Industry Survey 2019 | 11
Insurance training Our tailor-made training courses are designed to meet the specific needs of your organisation – whether it's education on insurance regulations, market conduct, financial reporting and IFRS 17 or the latest industry developments. Our training courses can be conducted either at our premises or yours. We also offer annual training packages covering our entire suite of training courses, to which your staff are always welcome.
For more information please contact:
Kashmira NaranAssociate Director, InsuranceT: +27 82 710 7629E: [email protected]

12 | The South African Insurance Industry Survey 2019
Dex MachidaSenior Manager: Insuretech Management Consulting Tel: +27 60 997 7053 Email: [email protected]

The South African Insurance Industry Survey 2019 | 13
The implications of new mobility models on insuranceNew mobility models are changing the role of ownership New mobility models like ride sharing and ride hailing will impact personal car ownership. Ride hailing services like Uber and Taxify processed over 2 million rides between them in South Africa last year. The average SA consumer is estimated to save R14 000 annually by utilising Mobility services like Uber. Insurance plays a critical role in enabling both consumers and corporations to engage with the Mobility ecosystem. It is vital that insurers recognise the needs within the market and transform to cater for the shift from Asset to Access based Mobility.
Despite the expected decline in personal ownership, the need for personal mobility remains and will be satisfied by other service providers. It is incumbent on financial services companies to identify these segments and design appropriate products and services.
Fewer insurable cars and lower margins are expected from increased competition for insurers competing for a declining insurable pool. Also the declining use of current vehicles will negatively impact newer insurance models
like usage-based insurance. However, there is potential for developing alternative insurance models, especially those that leverage technology to determine risks at a granular and personal level.
Telematics continue to play an increasing role in measuring and pricing riskAlthough the use of telematics for individual driver behaviour is well-known, it is also possible to create specific profiles of segments with similar driving characteristics. Telematics can measure the length of time spent in different risk rated areas – hence be able to measure risk more accurately at a granular level. These risks are dynamically adjusted and reflected in pricing. Drivers will now be able to decrease their premiums by changing their driving behaviour – which leads to more accurate risk rating than generic actuarial calculations. A natural consequence is the ability to transparently calculate month-to-date premiums in real time; which provides additional incentive to modify driver behaviour.
Driver assisted vehicles will meet fewer accidentsDriver assisted technologies, similar to those being incorporated in autonomous vehicles are expected to reduce the number and severity of accidents – which may also drive down premiums. These cars are sensor rich and have detecting abilities that are superior to the average human and it is expected that there will be a significant reduction in accidents. Together with increased ride hailing trends and shared ownership, it is inevitable that premiums will decrease, presenting a challenge for insurers. This may be counterbalanced by insurance companies using technology to drive down costs of assessment, e.g. use of drones for assessing accident damage.
It follows then that with reduced personal car ownership, cars used for ride sharing and ride hailing will be on the road for a lot longer every day, creating the need for preventing and estimating the risk of accident, breakdowns and theft.

14 | The South African Insurance Industry Survey 2019
Insurance for autonomous vehicles is a grey area The first challenge is the pricing of insurance for automated vehicles, for which there is no established body of data upon which traditional actuarial models can rely. Model development may be an intensive area of research in its early days.
The moral debate of who is ultimately responsible for accidents and collateral damage is arguably the most difficult challenge – how does one apportion or attribute negligence to an autonomous vehicle, which effectively is the equivalent of a robot? Or is it shared between the owner, the operator and the manufacturer of the vehicle itself?
New models will need to be developed that move away from the traditional notion of personal liability. This is best described as a scenario where two identical autonomous vehicle crash into each other, due to a malfunction in one of them. A possible scenario would be a no-fault incident where each “driver” is responsible for their own damages. Coupled with a move to lower personal vehicle ownership, the future may be dominated by the fleet owners who account for the bulk of the liability rather than individual personal or vehicle cover.

The South African Insurance Industry Survey 2019 | 15
Powered EnterpriseKPMG Powered Enterprise is the outcome-driven transformation solution that prepares your business for the future.This is where deep insurance industry and process knowledge, global delivery capability, cloud technology and robotic process automation combine to drive sustainable change, rising performance and lasting value. KPMG’s continuing investment in cloud applications, target operating models, processes and tools can give you instant access to leading practices and predictable outcomes. At a time when disruption is changing everything, many insurers are struggling to transform. KPMG’s solution can help make it happen.
See Powered Enterprise at work – Transform the way you run your business
– Build agile functions that evolve as you grow
– Help your people to adopt and embrace change
– Exploit new technologies for value and performance
– Drive future success with the latest leading practice
All power to the enterpriseThis is not just about migrating finance or the supply chain into the cloud. From evidence-based HR to customer-centric business models, Powered Enterprise can unleash new levels of agility, insight, efficiency and performance. The value is multiplied when you join the dots across the business.
What's in the box?Powered Enterprise provides a formidable combination of leading practices and processes, proven technology solutions and a next-generation delivery framework. This is a truly integrated solution for insurers: every component has a role to play in extracting the maximum value from technology and helping to achieve the outcomes you need.
When all this comes together, backed by the business knowledge and experience of the KPMG insurance specialists, the results are impressive.
The Powered operating model
It’s not what you put into the cloud that matters, but what you get out of it.
– A jump start to your digital transformation
– Immediate access to leading practices and processes
– Validated solutions with proven real-world usability
– High-touch change management and employee experience
– Reduced implementation risks and enhanced ROI
– A solid platform for continuing evolution and progress
Powered Enterprise is the culmination of sustained investment and decades of experience in the solving of real-world challenges for insurance companies.
Sales and service
ProcurementSupply chain management
Human resources
Finance Information technology
Enterprise performance management
Target operating
model
Pre-configured cloud applications
KPI and integration
libraries
Configuration workbooks
Industry Insights
End user training modules
People, roles and responsibilities
Defined data models and
reports
Test scripts and
protocols
Service model and organizational
design
Process taxonomies
Functional processes with
embedded leading practices
Controls catalog with governance,
risk and compliance
For more information please contact:
Martin VipondPartner, Advisory
T: +27 83 454 1812E: [email protected]
Nicole MedefindtAssociate Director, Advisory
T: +27 82 718 8535E: [email protected]

16 | The South African Insurance Industry Survey 2019
Esther PieterseAssociate Director Technical Insurance Accounting Tel: +27 82 719 5806 Email: [email protected]

The South African Insurance Industry Survey 2019 | 17
IFRS 171
challenges in the South African market At the heart of any implementation project is the accounting solution. Although many implementation projects re-evaluate systems, processes and resource requirements, changes are often dictated by the accounting requirements.
In South Africa, insurers have experienced many accounting challenges. Some of these are locally specific, while others have global relevance.
We will be exploring these challenges ….
1. Cash-back – long or short-term insurance product?
Cash-back products are unique to South Africa. The big question for the short-term industry is whether these products could qualify as short duration contracts. It is an important consideration as it will impact the decision on the measurement model. If the contracts are short duration contracts, insurers may2 apply the simplified premium allocation approach which is more closely aligned to their current accounting model.
In considering whether the cash-back product is a short-duration contract, the IFRS 17 definition of contract boundary has to be evaluated:
We have applied the definition of contract boundary to the above example:
The insurer’s substantive obligation to provide services ends after 12 months when the insurer has the ability to reassess the risks of the policyholder. Consequently the contract boundary of the cash-back product (in the example) is 12 months and the insurer may apply the premium allocation approach.
ExampleAn insurer issued a motor policy in terms of which cash will be paid to the policyholder if the policyholder does not claim for three consecutive years. The policyholder will receive 10% of all premiums paid within this period (three years).
The insurer re-prices the insurance policy annually, on the policy's anniversary as if it was a new policy. The policyholder or the insurer may cancel the policy on each anniversary date.
Cash flows are within the boundary of an insurance contract if they arise from substantive rights and obligations that exist during the reporting period in which the entity can compel the policyholder to pay the premiums or in which the entity has a substantive obligation to provide the policyholder with services.
Sources1 IFRS 17 Insurance Contracts, effective for year-ends commencing on or after 1 January 20212 IFRS 17 par 53: Application of the premium allocation approach
An entity may simplify the measurement of a group of insurance contracts using the premium allocation approach if, and only if, at the inception of the group: (a) the entity reasonably expects that such simplification would produce a measurement of the liability for remaining coverage for the group that would not differ materially from the one that would be produced applying the requirements in paragraphs 32–52; or(b) the coverage period of each contract in the group (including coverage arising from all premiums within the contract boundary determined at that date applying paragraph 34) is one year or less. 3 IFRS 17 par 34
A substantive obligation to provide services ends when the entity has the practical ability to reassess the risks of the particular policyholder and, as a result, can set a price or level of benefits that fully reflects those risks3.

18 | The South African Insurance Industry Survey 2019
2. Back to cash accounting for short-term insurers?
Many short-term insurers may elect to apply the premium allocation approach and may believe that the impact of IFRS 17 would therefore be limited.
However, IFRS 17 requires that an insurer, when applying the premium allocation approach to measure the liability for remaining coverage includes premiums received 4. It should be noted that “received” in this case refers to “received in cash”.
This however does not apply to insurance revenue – the measurement requirements are different to that for the liability. Insurance revenue for the period is the amount of expected premium receipts, adjusted to reflect the time value of money and the effect of financial risk5. As revenue is recognised based on expected premium receipts, revenue could still be recognised even if the cash has not been received.
What impact would this have on an insurer’s accounting? We will illustrate this by way of an example.
What is the impact on the statement of financial position and statement of profit or loss for the year ended 28 February 2019?
The above example illustrates that in the measurement of the liability for remaining coverage, “cash accounting” is applied. The premium is only included in this liability once the cash has been received.
We have illustrated the impact when cash has been received below:
Once the cash has been received, the asset becomes
a liability for remaining coverage as the insurer has the obligation to provide future services.
Impact on insurers
As illustrated in the above example, there will no longer be any insurance receivables, although there may be an asset for remaining coverage before the cash has been received. This may create a significant challenge for existing systems and processes. The bookkeeping system should keep track of outstanding premiums, however these premiums receivable would not be recorded in the IFRS 17 measurement model.
Why does it make sense to include premiums only when the cash is received?
The premium allocation approach was included in IFRS 17 to be a proxy for the general measurement model. If IFRS 17 referred to premiums receivable, the premium allocation approach would no longer meet its objective of approximating the general model. The insurance contract liability under the premium allocation approach would be grossed up for the premiums receivable, unlike insurance contract liabilities under the general model which include all future cash flows at their carrying amount 6.
3. What is the issue with tax cash flows?
In South Africa the trustee principle is applied when taxing policyholder income that is accounted for in the applicable policyholder fund of a long-term insurance company. This is on the basis that insurers are deemed to hold and administer certain of their assets on behalf of various categories of policyholders while the balance of their assets represents shareholders’ equity.
Example
— Insurance contract with a contract boundary of 12 months, i.e. 1 January to 31 December 2019, was issued by new insurer.
— The insurer’s year-end is 28 February 2019.
— The annual premium due is CU 1 200. The premium net of commission of 20% was received on 3 March 2019.
— Assume no claims and bad debts as at the reporting date and this contract is the only contract in the group.
— The expected pattern of release of risk is not significantly different from the passage of time.
Statement of profit or loss for the 2 months ended 28 February 2019
CU
Insurance revenue (1 200 x 2/12) 200
Insurance service expenses (20% x 1 200 x 2/12)
(40)
Insurance service result 160
Statement of financial position as at 28 February 2018
CU
Insurance asset 160
Retained earnings (160)
Liability for remaining coverage as at 31 March 2019
CU
Insurance asset as at 28 Feb 2019 160
Cash received (1 200 * 80%) (960)
Insurance revenue for March 100
Insurance service expense for March (20)
Closing balance – liability (720)4 IFRS 17 par 555 IFRS 17 par B1266 ED/2019/4 Amendments to IFRS 17, issued June 2019, par BC 98.

The South African Insurance Industry Survey 2019 | 19
Policyholder tax is withheld in each policyholder fund in respect of certain types/categories of income and paid to the South African Revenue Service (SARS) by the long-term insurer on behalf of the policyholder. The long-term insurer is liable to pay the tax. SARS will not try to recover the tax from the policyholder. The long-term insurer on-charges the tax to the policyholder, although the amount on-charged may not be exactly equal the proportionate amount of tax paid by the insurer.
Currently the taxes (calculated per policyholder fund) are included in the tax expense of the insurer (in its IFRS financial statements). There has been no change in the tax law which could challenge the inclusion of the taxes in the insurer’s tax expense.
Insurers are arguing that the taxes paid on certain contracts, for example investment contracts with discretionary participation features (DPF), should be part of fulfilment cash flows as the tax is charged back to the policyholder.
The accounting challenge is that IFRS 17 differentiates between tax paid in a fiduciary capacity or not in a fiduciary capacity. If the insurer pays the tax in a fiduciary capacity, the tax is included in the fulfilment cash flows (when applying the general measurement model). If the insurer is not paying tax in a fiduciary capacity, the tax is not included in the fulfilment cash flows. The tax is then included in the tax line in the insurer’s financial statements.
The relevant paragraphs in IFRS 17 are as follows:
What does fiduciary mean?
The definition of "fiduciary" refers to a trustee relationship – “when a party knowingly accepts the fiduciary duty on behalf of another party, they are required to act in the best interest of the principal, the party whose assets they are managing”9.
The question is whether in a South African tax regime, the insurer is withholding the tax and paying it over to SARS on behalf of the policyholder.
We have explored the different views below.
Payments by the insurer in a fiduciary capacity: Included in fulfilment cash flows and never accounted for as IAS 12 income tax
Based on the fact that the trustee principle is applied when taxing a long-term insurance company, the expected tax expense should be included in the fulfilment cash flows when measuring the investment contracts with DPF and insurance contracts.
Current, deferred and future taxes “specifically chargeable to the policyholder” are generally accounted
for under IAS 1210 by most large life insurers. This view will challenge the accounting applied in current and prior years – i.e. to recognise the taxes in the tax line in the financial statements.
If argued that the tax cash flows are in essence payments made in a fiduciary capacity, they should be included in the fulfilment cash flows and as the insurance contract liability unwinds, the actual tax payable is an insurance service expense.
Some insurers reject this view on the basis that IFRS 17 should not change the previous view that the tax is within the scope of IAS 12 tax and paragraph B66(f) of IFRS 17 excludes taxes not paid in a fiduciary capacity.
Payments by insurer not made in a fiduciary capacity – not included as fulfilment cash flows, but as IAS 12 income taxes
This view argues that the insurer is legally the taxpayer. The tax amounts are not paid by the insurer in a fiduciary capacity to meet tax obligations incurred by the policyholder, but are tax obligations incurred by the insurer itself. If such amounts meet the definition of an income tax, then the tax paid should be recognised and presented in terms of IAS 12 as is currently done.
The impact of this view is that future taxes “specifically chargeable to the policyholder” are not taken into account to accurately measure the fulfilment cash flows (as explicit cash flows). As and when the insurance contract liability unwinds the actual tax is accounted for under IAS 12.
The following cash flows shall not be included when estimating the cash flows that will arise as the entity fulfils an existing insurance contract:
(f) income tax payments and receipts the insurer does not pay or receive in a fiduciary capacity. Such payments and receipts are recognised, measured and presented separately applying IAS 12 Income Taxes 8.
Cash flows within the boundary of an insurance contract are those that relate directly to the fulfilment of the contract, including cash flows for which the entity has discretion over the amount or timing. The cash flows within the boundary include:
(j) payments by the insurer in a fiduciary capacity to meet tax obligations incurred by the policyholder, and related receipts 7.
7 IFRS 17 par B658 IFRS 17 par B669 https://www.investopedia.com/terms/f/fiduciary.asp10 IAS 12 Income Taxes
20 | The South African Insurance Industry Survey 2019
Insurers in South Africa agree that the impact of this view is not desirable. If the tax is excluded from the fulfilment cash flows, then the insurance liabilities will be too low by the required allowance for tax expected to be paid over the term of the contract. Consequently the contractual service margin will be inflated by the same amount.
One of the previous staff papers of the International Accounting Standards Board (IASB), included the following:
“Some respondents suggested that the fulfilment cash flows should include the amounts that insurers pay in some jurisdictions as a proxy for investment returns being taxed in the hands of policyholders. The IASB decided to clarify that the cash flows excluded from the fulfilment cash flows are the income tax payments and receipts attributable to policyholders that do not arise directly as the insurer fulfils the contracts” 11.
Insurers are arguing that the taxation arises as they fulfil the insurance contracts. We will wait to see if the IASB acknowledge their concerns and relooks at the IFRS 17 paragraphs. Currently it may be difficult to support that long-term insurers are paying the tax in a fiduciary capacity...
11 18 February – 22February 2013 IASB Agenda Ref 2C – Staff Paper - Comparison of the IASB’s tentative decisions to the comment letter summary par 58

The South African Insurance Industry Survey 2019 | 21 21 | The South African Insurance Industry Survey 201921 | The South African Insurance Industry Survey 201921 | The South African Insurance Industry Survey 2019
IFRS 17Considerable accounting changes for insurers on the way
The new insurance contracts standard, IFRS 17, aims to increase transparency and to reduce diversity in the accounting for insurance contracts.
Responding to stakeholders' concerns and implementation challenges, the International Accounting Standards Board has proposed an effective date of 1 January 2022 for IFRS 17 –
a one-year deferral – and amendments in seven important areas of the standard.
The magnitude of evolving insurance accounting change should not be underestimated. Even with the extra year, many insurers need to step up the pace of their implementation.
There is much that needs to be done in what is still a relatively short time.
Our materials will help you understand the evolving proposals and assess the potential impact on your company.
For more information please contact:
Esther PieterseAssociate Director, Insurance Technical Accounting
T: +27 82 719 5806E: [email protected]
Nishen BikhaniPartner, InsuranceT: +27 60 720 4937
Lyndall GreenSenior Manager, Insurance
Tel: +27 82 710 4976E: [email protected]

22 | The South African Insurance Industry Survey 2019
Joana AbrahamsSenior Manager Actuary: Insurance Tel: +27 82 450 1344 Email: [email protected]

The South African Insurance Industry Survey 2019 | 23
Dynamic risk assessmentOver the last 40 years many significant business, financial or economic crises were not foreseen and prevented. This was evident in the global financial crisis where companies and governments failed to anticipate both the crisis and the impact it would have on the global economy, despite the use of extensive risk identification, evaluation and management methodologies.
Current risk management practices
Traditional risk management methodologies that focus on the likelihood and severity of individual risks do not consider the velocity with which risks can impact operations, interconnectedness of risks or emerging risks that could result in structural breaks. Improvements are required to current risk management frameworks to better capture the aspects of the world we live in today. We call it Dynamic Risk Assessment (“DRA”).
Dynamic Risk Assessment (DRA) – what should it include?
DRA is a new approach to the assessment or risk management that builds on current two-dimensional (risk probability and severity) practices. Based on many years
of research and development KPMG has developed a framework to better capture some of the aspects mentioned above. This is done by combining behavioural science, risk velocity (the speed with which the risk can materialise) and contagion or interconnectedness. Instead of focusing on risks in silos, this framework focuses on the network of key risks and the timeframe within which risks are likely to materialise. By being able to visualise how each of the key risks may influence or be influenced by other risks within the network, a deeper understanding can be gained on which risks have the greatest potential to amplify risk consequences across the network. This enables organisations to have better informed risk conversations and changes the focus from individual risks to prioritising risk clusters and also the opportunities and competitive advantage that understanding these present.
The DRA objectives
The objectives of the analysis of systemic risks are to: – assess and incorporate the potential impacts of
current and emerging structural breaks (game changers) on your existing risk profile; and
– access the collective corporate knowledge, experience and history of the most knowledgeable and experienced people within the organisation to identify potential pathways of contagion – a proxy for expected, future correlation – between the risks identified, including the risk implications of emerging structural breaks.
The key is to extract a consolidated view of key risks from within the organisation in an unbiased manner and the methodology needs to consider how risks are connected so as to create risk clusters. This is achieved through network theory.
How can DRA be of benefit to insurers?
The principle objectives of the application of network theory to your organisation’s risks are to:
– identify which risks the CEO and CRO should prioritise and focus on;
– identify emerging risks as a consequence of evolving structural breaks in the system;
– analyse and identify potential future relationships between the risks identified;
– analyse the systemic behaviours of individual risks;
– identify “centres of gravity”, or risk clusters, within your re-evaluated risk profile;
– identify root points of origin / vulnerability within your risk network;
– use the insights obtained from the above analyses to formulate a longer term fiduciary risk agenda of what “must go right” within the organisation, and which risks “cannot be allowed to go wrong”; and
– identify, map and test the controls around the key risks for reporting and monitoring purposes.

The individually most significant risk exhibits low levels of expected contagion
Likelihood and severity of this cluster exceeds those of this single risk
This individually insignificant risk has hidden systematic significance:
it triggers many other risks into existence, all of them more
significant than itself
High
Low HighLikelihood and occurrence of material financial statement error
Traditional risk map Inter-connected view
Pot
entia
l im
pact
24 | The South African Insurance Industry Survey 2019
Other benefits of the DRA process include being able to, in the context of key risks and how they may spread throughout the system, answer the questions:
– what are we missing?
– what are our weak links and potentially disastrous aggregate risks?
– what are our opportunities?
– what could be significant disruptive risks?
– what combination of risks have the potential to render us insolvent?
Regulatory considerations
With the introduction of the new insurance regulatory landscape in South Africa in July 2018, through the enactment of the Insurance Act of 2017 and subsequent supporting Standards, the Prudential Authority (“PA”) set clear minimum expectations for the insurance sector across the three pillars. In particular, the Regulators expect
insurers to introduce Own Risk and Solvency Assessment (“ORSA”) practices and to formalise their existing Enterprise-wide Risk Management (“ERM”) frameworks and governance structures in a way that aligns with local prudential standards (and international best practice).
The ORSA requires insurers to consider not only historical risks but also emerging risks and focus on all material foreseeable risks. The PA expects insurers to be adequately capitalised to be able to deal with a wide range of future scenarios. Such future adverse outcomes are tested through severe but plausible stress and scenarios tests and reverse stress testing.
Comparison of DRA with traditional risk assessment
A useful, stylised (actual risk descriptions have been removed) case study of a network depiction for a global entity illustrates the insights derived through the application of network theory.
The focus of the traditional risk map, which follows a siloed approach, is on the risks in the upper right-hand quadrant, whereas the focus enabled by DRA, with an understanding of how risks are interconnected is quite different, with individual insignificant risks triggering many others in the risk network.
Figure 1

The South African Insurance Industry Survey 2019 | 25
Four key insights are observable from Figure 1:
A “green” risk by virtue of its individual likelihood and severity in the diagram on the left conceals its systemic significance, which becomes apparent only when it appears in the centre of the entity’s risk network as a risk with significant expected contagion potentials. The consequences of the risks it triggers exceeds its individual severity. This potential amplification effect – expected contagion – is not observable from the traditional risk depiction methodology on the left;
A “centre of gravity” was determined mathematically to exist between three amber coloured risks, and the green coloured risk. In network lexicon the “centre of gravity” denotes a risk cluster, which has been circled in red in the diagram on the right. The four risks within the risk cluster exhibit more connections to each other than what they exhibit connections to other risks in the network, so that these risks should be monitored and managed together;
Alarmingly, the severity and likelihood of the risk cluster were found to exceed the likelihood and severity of the most significant, single risk identified in the diagram on the left. As often happens in practice, a number of individually less significant risks can combine to produce an adverse collective outcome of which the severity and likelihood surpasses the most significant individual risk portrayed in the diagram on the left;
Lastly, the individually most significant risk in likelihood and severity may exhibit comparatively low expected contagion. When the individually most significant and likely risk manifests, it is expected to do so in relative isolation – see the red risk on the top right in the right-hand diagram. In this instance, its individual likelihood and severity overestimates its expected contagion and systemic importance.
Conclusion
Capturing the combined wisdom of experts within your organisation using a framework based on existing science, provides a mechanism to enhance risk management frameworks where they currently fall short.
In addition from the above case study it can be observed that network theory is a useful supplementary examination of an organisation’s risk landscape: the traditional methodology may obscure the identification of the most significant risk (in this case the risk cluster); it may underestimate the systemic importance of an individually significant risk (the green dot above); and it may remain silent on a perspective that individually significant risks are, in some cases, expected to exhibit a low systemic significance (the red risk in Figure 1).
The DRA will serve as a powerful visualisation tool for material risks faced by the entity and its output can be used as a foundation for robust discussion and debate on appropriate selection of stress and scenarios tests for ORSA projections.
Based on many years of research, KPMG's mathematicians, data scientists, actuaries and behavioural psychologists have developed a comprehensive set of Dynamic Risk Assessment frameworks and tools.

26 | The South African Insurance Industry Survey 2019

The South African Insurance Industry Survey 2019 | 27
Dynamic Risk AssessmentDynamic approach to risk assessment – extracting the wisdom of experts within your business in an inter-connected world
The traditional, two dimensional approach to risk assessment, which considers likelihood and severity of risks falls short of requirements in the dynamic, interconnected world we find ourselves in. Through our patented Dynamic Risk Assessment framework, KPMG can support you in enhancing your risk management framework through intellectual property regarding behavioural science, risk velocity (the speed with which the risk can materialise) and contagion or interconnectedness. Instead of focusing on risks in silos, KPMG is helping clients gain a better understanding of the network of key risks and the timeframe within which risks are likely to materialise. By being able to visualise how each of the key risks may influence or be influenced by other risks within the network, a deeper understanding is gained on which risks have the greatest potential to amplify risk consequences across the network. This enables organisations to have better informed risk conversations and changes the focus from individual risks to prioritising risk clusters and also the opportunities and competitive advantage that understanding these presents!
For more information please contact:
Malcolm JewellPartner, Actuarial PracticeT: +27 82 683 5505E: [email protected]
Joana AbrahamsManager, Actuarial PracticeT: +27 82 450 1344E: [email protected]
Ruth NjawayaAssociate Director, Actuarial PracticeT: +27 66 480 6727E: [email protected]
Nishen BikhaniPartner, InsuranceT: +27 60 720 4937E: [email protected]
"A dynamic approach to risk"There are inherent limitations to a traditional risk management
approach, which focuses on evaluating likelihood and impact of independent risk events. KPMG helps organisations understand risk velocity (the speed with which risk can be realised), interconnectivity,
and the impact of individual risks on the broader risk network. Instead of focussing on single risk events, organisations gain a better
understanding of the network of risks, and which risks have the potential to amplify risk consequences across the network (i.e. risk
contagion) if not appropriately understood and addressed

28 | The South African Insurance Industry Survey 201928 | The South African Insurance Industry Survey 2019
Alexander MbaiPartner: Insurance Kenya Tel: +254 709 576 252 Email: [email protected]

The South African Insurance Industry Survey 2019 | 29
Kenyan insurance sector grapples with increasing regulatory requirementsThe global insurance industry is racing to comply with significant changes in the regulatory environment and accounting standards. IFRS 17: Insurance Contracts effective on 1 January 2022 is one such change. The sector, amongst the most highly regulated, is central to financial services providing risk coverage, wealth, investment and fund management opportunities to a wide public.
In Kenya, the sector operates under strict regulations on capital, commissions paid to intermediaries, ‘cash and carry’ rules and management expenses. We identify some of the challenges faced by the industry across Kenya:
• Risk based capital (RBC) - The Insurance (Capital Adequacy) Guidelines require insurers to maintain a Capital Adequacy Ratio of at least 200 percent of the minimum capital requirement by 2020. In Kenya, RBC is computed as a function of Insurance Risk, Market Risk, Credit Risk and Operational Risk.
Insurers are required to monitor their capital adequacy and solvency margins on a quarterly basis and file the results with the relevant authorities. The main objective here is to safeguard the insurer’s ability to continue as a going concern and to provide stakeholders adequate returns by pricing insurance and investment contracts commensurate with the level of risk. Non-compliance with the required capital ratios can lead to the imposition of sanctions by regulators, who specify assets that are admissible in the determination of the capital. As a result, insurers need to re-look at the quality of their assets to meet these. For instance, premium debtors are not admissible and attract a significant capital charge.
• Override commissions - In January 2019, the Kenyan Insurance Regulatory Authority (IRA), through a circular, re-cautioned insurers, brokers, medical insurance providers and insurance against the payment of commissions and/ or administrative fees above the limits prescribed by the Insurance Act. The payment of override commissions has been used in the sector to win and retain business. However, the practice can result in, amongst other things, unfair competition and affect insurance product prices across the industry. The regulator has indicated punitive measures against non-compliance which could include temporary or permanent withdrawal of business licenses.
• Application of cash and carry rules - The “cash and carry” principle requires that premiums be paid upfront/ at the point at which the cover is issued in order to ensure that insurer is able to settle claims appropriately. The practical expediency of the cash and carry principle continues to draw mixed reactions from the different players in the insurance industry as there are parties who still need credit to finance the policies. Further, strict application of the rule has been hampered by the low level of insurance penetration in the region despite the growth in population. Inability to apply this rule has resulted in significant premium debtors and the depletion of working and regulatory capital for the insurers.
• Excess expenditure - The Kenyan Insurance Act, 2015 states that “No insurer shall spend in any financial year as expenses of management an amount in excess of the prescribed limits, and in prescribing those limits regard shall be made to the size and age of the insurer and the provision generally made for management expenses in the premium rates of insurers”. A recent analysis of the available industry statistics indicates that expenses of management in insurance business are far greater than the prescribed limits. Attempts by the regulator to enforce the above rule have not borne much fruit due to the high inflation rate and increased standards of living, which have a direct correlation with the level of management expenses incurred by insurance companies.

30 | The South African Insurance Industry Survey 2019
The South African Insurance Industry Survey 2019 | 31
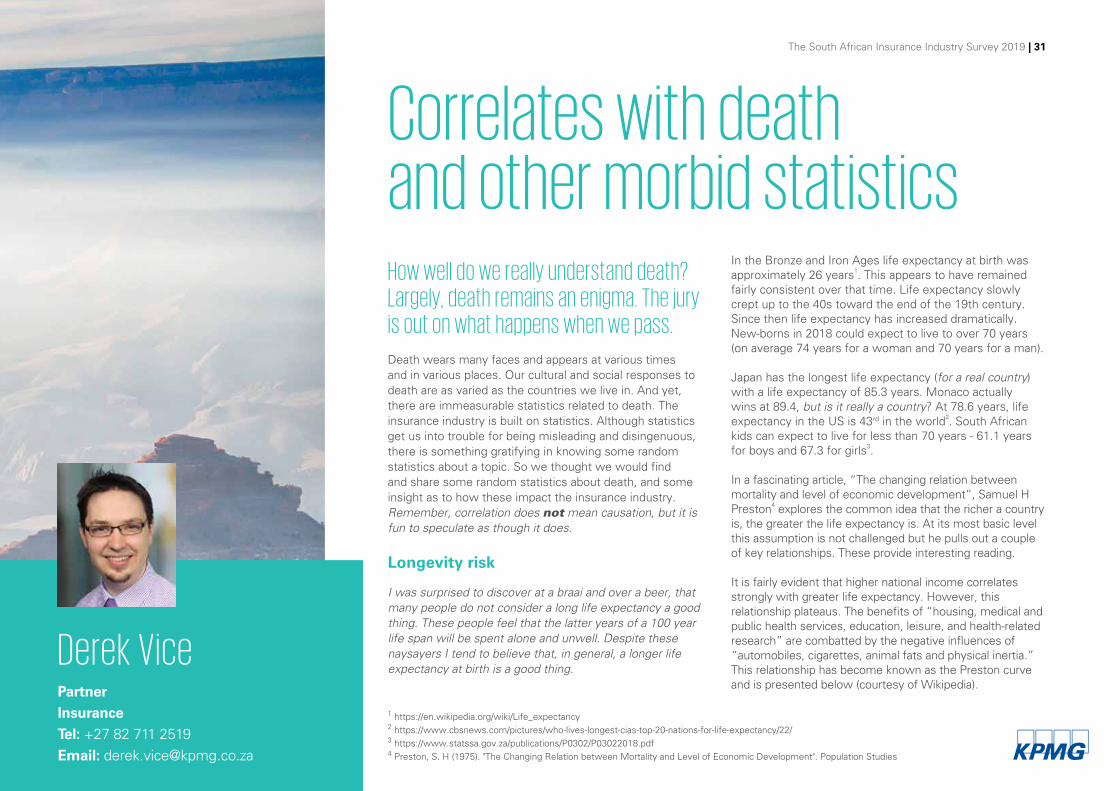
Correlates with death and other morbid statisticsHow well do we really understand death? Largely, death remains an enigma. The jury is out on what happens when we pass.
Death wears many faces and appears at various times and in various places. Our cultural and social responses to death are as varied as the countries we live in. And yet, there are immeasurable statistics related to death. The insurance industry is built on statistics. Although statistics get us into trouble for being misleading and disingenuous, there is something gratifying in knowing some random statistics about a topic. So we thought we would find and share some random statistics about death, and some insight as to how these impact the insurance industry. Remember, correlation does not mean causation, but it is fun to speculate as though it does.
Longevity risk
I was surprised to discover at a braai and over a beer, that many people do not consider a long life expectancy a good thing. These people feel that the latter years of a 100 year life span will be spent alone and unwell. Despite these naysayers I tend to believe that, in general, a longer life expectancy at birth is a good thing.
In the Bronze and Iron Ages life expectancy at birth was approximately 26 years1. This appears to have remained fairly consistent over that time. Life expectancy slowly crept up to the 40s toward the end of the 19th century. Since then life expectancy has increased dramatically. New-borns in 2018 could expect to live to over 70 years (on average 74 years for a woman and 70 years for a man). Japan has the longest life expectancy (for a real country) with a life expectancy of 85.3 years. Monaco actually wins at 89.4, but is it really a country? At 78.6 years, life expectancy in the US is 43rd in the world2. South African kids can expect to live for less than 70 years - 61.1 years for boys and 67.3 for girls3. In a fascinating article, “The changing relation between mortality and level of economic development”, Samuel H Preston4 explores the common idea that the richer a country is, the greater the life expectancy is. At its most basic level this assumption is not challenged but he pulls out a couple of key relationships. These provide interesting reading. It is fairly evident that higher national income correlates strongly with greater life expectancy. However, this relationship plateaus. The benefits of “housing, medical and public health services, education, leisure, and health-related research” are combatted by the negative influences of “automobiles, cigarettes, animal fats and physical inertia.” This relationship has become known as the Preston curve and is presented below (courtesy of Wikipedia).
Derek VicePartner Insurance Tel: +27 82 711 2519 Email: [email protected]
1 https://en.wikipedia.org/wiki/Life_expectancy2 https://www.cbsnews.com/pictures/who-lives-longest-cias-top-20-nations-for-life-expectancy/22/3 https://www.statssa.gov.za/publications/P0302/P03022018.pdf4 Preston, S. H (1975). "The Changing Relation between Mortality and Level of Economic Development". Population Studies

32 | The South African Insurance Industry Survey 2019
Preston states that “importantly the relationship between life expectancy and national income per head has shifted upwards during the 20th century.” This means that at a given national income level per head, the life expectancy at birth is higher now than it was a few years ago, i.e. you get more bang for your buck. Overall life expectancy has increased at all income levels. Assuming this trend continues, this is good news… unless you are writing longevity risk.
Factors outside a country’s current level of income account for the majority of the growth in life expectancy. This means that the benefits developed and derived in one country positively impact other countries. A significant growth in your own economy could have less impact on life expectancy than a major breakthrough in medical research elsewhere. On the face of it, this is logical – Jenner popularises vaccines; and we all benefit. This is true for both developed and less developed countries. A cure for cancer would benefit richer and poorer economies.
5 By Radeksz - Own work, Public Domain, https://commons.wikimedia.org/w/index.php?curid=89211466 By Radeksz - Own work, Public Domain, https://commons.wikimedia.org/w/index.php?curid=8921146
5 6

The South African Insurance Industry Survey 2019 | 33
Of course, it has been noted that higher levels of health might actually cause higher national income. Healthy, long living people are more productive and this results in higher GDP per capita.7 To caution against such confusing correlation with causation we have included the following important public announcement from Tyler Vigen:
100% of dead people died from something deadly
So what kills us? Contrary to popular belief you cannot die from extended separation from your electronic devices. The MO in FOMO8 is not statistically significant when it comes to cause of death. Failure to check your Whatsapp messages and check-in is not deadly. Cardiovascular diseases are deadly; so are cancer, respiratory diseases, snakes and cars. Almost a third of all deaths arise from cardiovascular diseases – 31.8% according to www.ourworldindata.org9. This includes heart attacks, strokes and high blood
pressure. A, not so close, second is cancer – 17.08%. Below are the top 11 worldwide causes of death in 201710:
A few interesting observations from this (and the extended list). You are more likely to kill yourself than be killed - almost twice as many people die from suicide (1.42%) as from homicide (0.72%). Despite what the news might lead you to believe, you are much more likely to die in a road accident (2.22%) than from terrorism (0.06% in 2016) or in a war (0.21% in 2016).
Dementia kills people – perhaps I was just ignorant but I suspect many other people also see dementia as a form of mental health issue – however “dementia is more accurately defined as fatal brain failure: a terminal disease, like cancer, that physically kills patients, not simply a mental ailment that accompanies older age.11”
Although people are good at killing each other (0.72% death from homicide) your friendly neighborhood mosquito is much more deadly. 1.11% of deaths are attributable to malaria and ultimately a mozzie bite.
Cause of death % of total deaths (2017, worldwide)
Cardiovascular disease 31.80%
Cancer 17.08%
Respiratory disease 7.00%
Lower respiratory infections 4.57%
Dementia 4.49%
Digestive diseases 4.25%
Neonatal deaths 3.19%
Diarrheal disease 2.81%
Diabetes mellitus 2.45%
Liver disease 2.36%
Road accidents 2.22%
7 Bloom, D. E; Canning, D. (2007). "Commentary: The Preston Curve 30 years on: still sparking fires”8 Fear Of Missing Out: urbandictionary.com9 “Causes of Death” by Hannah Ritchie and Max Roser (https://ourworldindata.org/causes-of-death)
10 Why eleven you ask, because I wanted road accidents to make the list.11 Redefining Dementia as a Terminal Illness by Catherine Elton, http://content.time.com/ time/health/article/0,8599,1930278,00.html
34 | The South African Insurance Industry Survey 2019
Road accidents
Approximately 1.3 million13 14 people die as a result of road accidents every year. Further, 20-50 million people are injured or disabled in these accidents annually15. That is a massive burden on any economy and a significant loss of human life. More concerning is that “road crashes are the leading cause of death among young people ages 15-29, and the second leading cause of death worldwide among young people ages 5-14.16 " These are individuals who have already received significant economic investment. They are also part of various established social structures in society.
Pedestrians are more at risk: “the largest share of deaths at the global level are pedestrians (with 39 percent of the share), closely followed by those in motor vehicles (36 percent); motorcyclists (18 percent); and cyclists (6 percent). This share has remained fairly consistent with time.17 "
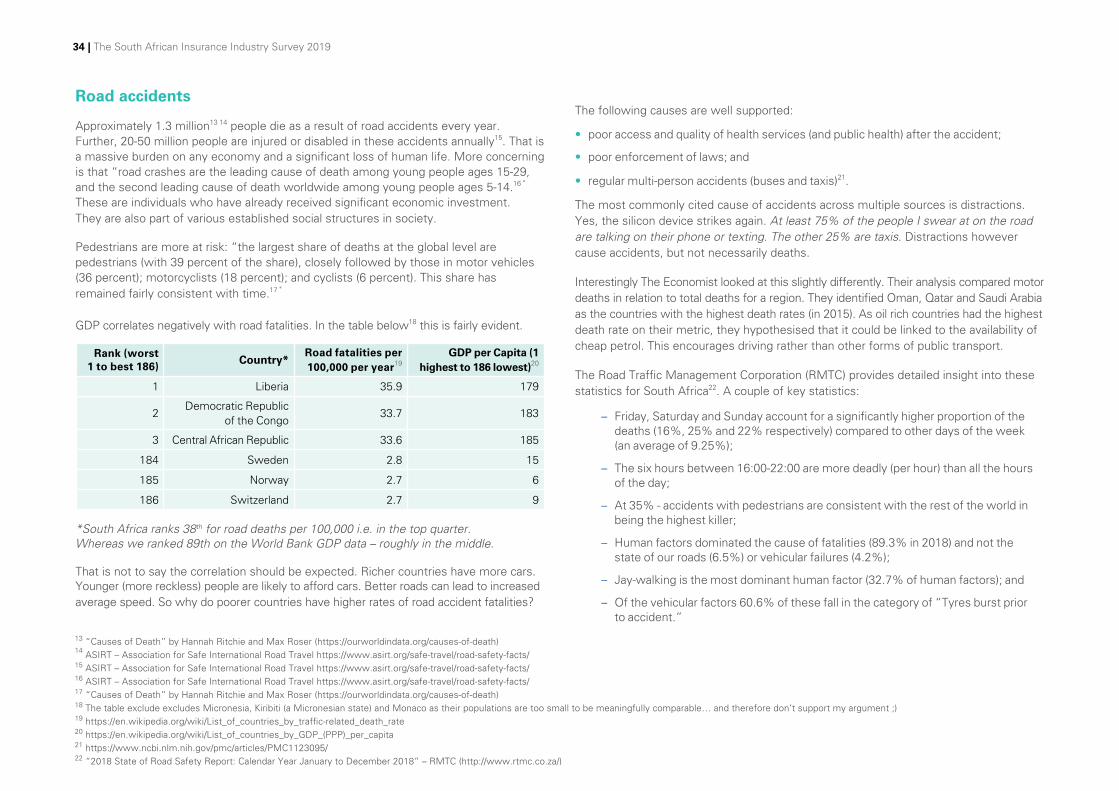
GDP correlates negatively with road fatalities. In the table below18 this is fairly evident.
*South Africa ranks 38th for road deaths per 100,000 i.e. in the top quarter. Whereas we ranked 89th on the World Bank GDP data – roughly in the middle.
That is not to say the correlation should be expected. Richer countries have more cars. Younger (more reckless) people are likely to afford cars. Better roads can lead to increased average speed. So why do poorer countries have higher rates of road accident fatalities?
The following causes are well supported:
• poor access and quality of health services (and public health) after the accident;
• poor enforcement of laws; and
• regular multi-person accidents (buses and taxis)21.
The most commonly cited cause of accidents across multiple sources is distractions. Yes, the silicon device strikes again. At least 75% of the people I swear at on the road are talking on their phone or texting. The other 25% are taxis. Distractions however cause accidents, but not necessarily deaths.
Interestingly The Economist looked at this slightly differently. Their analysis compared motor deaths in relation to total deaths for a region. They identified Oman, Qatar and Saudi Arabia as the countries with the highest death rates (in 2015). As oil rich countries had the highest death rate on their metric, they hypothesised that it could be linked to the availability of cheap petrol. This encourages driving rather than other forms of public transport.
The Road Traffic Management Corporation (RMTC) provides detailed insight into these statistics for South Africa22. A couple of key statistics:
– Friday, Saturday and Sunday account for a significantly higher proportion of the deaths (16%, 25% and 22% respectively) compared to other days of the week (an average of 9.25%);
– The six hours between 16:00-22:00 are more deadly (per hour) than all the hours of the day;
– At 35% - accidents with pedestrians are consistent with the rest of the world in being the highest killer;
– Human factors dominated the cause of fatalities (89.3% in 2018) and not the state of our roads (6.5%) or vehicular failures (4.2%);
– Jay-walking is the most dominant human factor (32.7% of human factors); and
– Of the vehicular factors 60.6% of these fall in the category of “Tyres burst prior to accident.”
13 “Causes of Death” by Hannah Ritchie and Max Roser (https://ourworldindata.org/causes-of-death)14 ASIRT – Association for Safe International Road Travel https://www.asirt.org/safe-travel/road-safety-facts/ 15 ASIRT – Association for Safe International Road Travel https://www.asirt.org/safe-travel/road-safety-facts/ 16 ASIRT – Association for Safe International Road Travel https://www.asirt.org/safe-travel/road-safety-facts/ 17 “Causes of Death” by Hannah Ritchie and Max Roser (https://ourworldindata.org/causes-of-death)18 The table exclude excludes Micronesia, Kiribiti (a Micronesian state) and Monaco as their populations are too small to be meaningfully comparable… and therefore don’t support my argument ;) 19 https://en.wikipedia.org/wiki/List_of_countries_by_traffic-related_death_rate20 https://en.wikipedia.org/wiki/List_of_countries_by_GDP_(PPP)_per_capita21 https://www.ncbi.nlm.nih.gov/pmc/articles/PMC1123095/22 “2018 State of Road Safety Report: Calendar Year January to December 2018” – RMTC (http://www.rtmc.co.za/)
Rank (worst 1 to best 186)
Country*Road fatalities per 100,000 per year19
GDP per Capita (1 highest to 186 lowest)20
1 Liberia 35.9 179
2 Democratic Republic
of the Congo33.7 183
3 Central African Republic 33.6 185
184 Sweden 2.8 15
185 Norway 2.7 6
186 Switzerland 2.7 9

The South African Insurance Industry Survey 2019 | 35
From an insurance perspective this has some potential implications and opportunities:
– Adjusting premium on travel times and days would potentially differentiate between major risk categories;
– Introducing some advanced form of tyre monitoring would assist in reducing deaths and accidents; and
– We need to think of some fair way of incentivising pedestrian caution.
Murder and other killers
When it comes to actual murderers, humans are tops by a long margin. In 2016, humans killed 546,000 other humans, whereas snakes (despite being responsible for original sin) only killed 75,000 people. That is still a lot compared to the 13,000 dog-related deaths (which includes deaths from rabies). Scorpions are more deadly than hippos, crocs, lions, elephants, wolves or sharks - scorpions killed 3,500 people whereas crocodiles killed approximately 1,000 and hippos only 500. With an estimated 40 deaths from jellyfish in 2016, they accounted for many times more deaths than sharks (at a miserly six deaths23). Jaws alone killed five people (and one dog) in 197524 so it seems sharks are changing their vicious ways.
Murder rates are measured as the number of deaths per 100,000 deaths. They are generally referred to as intentional homicide rates to distinguish between manslaughter, self-defense and war related deaths. Intentional homicide resulted in a world average of 6.2 deaths per 100,000 deaths. Included in the table below are a few of the stand out countries in terms of intentional homicide rates, either due to the rate per 100,000 individuals or the total count (number of deaths in the latest recorded year). For comparability, we have included the total population as well.
I think the statistics speak for themselves, although Japan is just mind-blowing – I simply could not believe this number so I checked another source. This source reported Japanese murder cases slightly higher in 2018 at 92025. As these are murder cases, the number could include self-defense and manslaughter (i.e. not all 920 are intentional homicide).
In this context, the state (as its own type of animal), through death penalty executions, is remarkably low. “Amnesty International recorded at least 690 executions in 20 countries in 2018, down by 31% from 2017 (at least 993 executions). This figure represents the lowest number of executions that Amnesty International has recorded in the past decade26.” That said these are conscious murders of individuals, rather than the accidental nature of other animal killings.
And what of euthanasia? A piece of 2016 research noted, “between 0.3% to 4.6% of all deaths are reported as euthanasia or physician-assisted suicide in jurisdictions where they are legal.” 4.6% puts euthanasia in the top ten causes of death in some of these jurisdictions. More than 70% of these deaths involved individuals with cancer. Their cited reasons included ongoing pain and a loss of dignity27. This is therefore potentially a reallocation between the top end of the list (out of cancer and into assisted suicide). On a gross basis though these numbers are still insignificant – approximately 6,000 per annum.
What does this mean for insurers? State deaths, animal related deaths and assisted suicide are perhaps not things that need to be included in your terms and conditions. A focus on managing road accidents is likely to produce more meaningful results for the industry and the country.
Country Rate Count Population (millions)
El Salvador 82.84 5 257 6
Honduras 56.52 5 150 9
Venezuela 56.33 17 778 32
South Africa 33.97 19 016 58
Brazil 29.53 61 283 208
Country Rate Count Population (millions)
Mexico 19.26 24 599 126
India 3.22 42 678 1 324
Hong Kong 0.38 28 7
Singapore 0.32 18 6
Japan 0.28 362 125
23 ISAF 2016 Worldwide Shark Attack Summary". Florida Museum of Natural History.24 https://www.quora.com/How-many-people-have-been-killed-in-all-the-shark-movies-from-sharks25 https://www.japantimes.co.jp/news/2018/01/18/national/crime-legal/japans-crime-rate-hits-record-low-number-thefts-plummets/#.XSuAM-ZlKuU26 https://www.amnesty.org/en/what-we-do/death-penalty/ : “China remains the world’s top executioner – but the true extent of the use of the death penalty in China is unknown as this data is classified as a state secret; the global figure of at least 690 recorded in 2018 excludes the thousands of executions believed to have been carried out in China.”27 “Attitudes and Practices of Euthanasia and Physician-Assisted Suicide in the United States, Canada, and Europe” Emanuel EJ, Onwuteaka-Philipsen BD, Urwin JW, Cohen J (https://www.ncbi.nlm.nih.gov/pubmed/27380345)

36 | The South African Insurance Industry Survey 2019
Pandemic/Epidemics
As Chandler once said, “So the Ebola virus… that’s gotta suck huh?28” No discussion of death is complete without reference to epidemics (and pandemics). Epidemics are generally more localised, whereas pandemics are global. What makes these notable is their ability to appear, kill massive proportions of the population and then fade into history. Take the Black Death (Yersinia pestis), which killed an estimated 50% of the population of Europe, Asia and North Africa. Estimates vary upward of 75 million people over a period of approximately 20 years from 1331 to 1352. The table below summarises some of the more notable pandemics29:
Some standout features of these events are the rapidness with which the earlier infections spread. This remains the major concern that a similar threat could evolve and within a limited period inflict significant casualties.
These are by no means the only serious epidemics in history. The reference list on Wikipedia lists at least 48 epidemics in the 21st century alone. Contrary to what Hollywood’s ongoing obsession with the apocalypse would lead you to believe, most of these have no fatalities or limited fatalities listed against them. The top five epidemics this century (excluding the ongoing HIV/AIDS pandemic) and the related total deaths include:
– 2009 Flu Pandemic: 14,286
– West African Ebola: Over 11,300
– Haiti Cholera Outbreak: 9,985
– DRC Measles: Over 4,500
– Zimbabwean Cholera: 4,293
These events tend to impact the vulnerable sections of society: the poor; the old; and the sickly. From an insurance perspective these populations are often not insured. However a flu virus, which significantly impacted the older portions of our population could have a significant impact on the industry.
Drawing the final curtain31 on this…
It is not surprising that many things correlate with death: the economy; the days of the week; the hours of the day; the age of Miss America. Death itself wears many faces, most microscopic, some human and a few animal. As an insurable risk the variability is massive and the change is notable. People are living longer, but dying of different things. Our technology has created new forms of death through vehicle accidents, electrocution, drugs, etc. but also allows for new means to manage and mitigate these and traditional risks. The ability of insurer’s to create interactive behavioural loops with these causes has become a focus area in the recent past. At its core though, death remains a fundamental aspect of human experience. The insurer’s ability to quietly and respectfully assist in this time of emotional trauma remains a fundamental need in the economy.
Disease YearsDeath count
(millions)% of the
populationRegions
Antonine Plague 165-180 5 30% Europe, West Asia,
North Africa
Plague of Justinian 541-542 25-50 40% Europe, West Asia,
Egypt
Black Death 1331-1352 75-200 50% Europe, West Asia, North Africa
Cocoliztli Epidemic 1545–1548 5–15 80% Mexico
Cocoliztli Epidemic 1576 2-2.5 50% Mexico
Influenza 1889-1890 1 <1% Worldwide
Spanish Flu 1918-1920 75 4% Worldwide
HIV/AIDS 1960-present 3530 <1% Worldwide
28 Friends, Episode 5, Season 229 https://en.wikipedia.org/wiki/List_of_epidemics30 HIV/AIDS still accounts for 1.71% of deaths – more than suicide, less than road accidents - “Causes of Death” by Hannah Ritchie and Max Roser (https://ourworldindata.org/causes-of-death)31 The euphemisms related to death are endless, a couple we came across in our research include: passed on; is no more; has ceased to be; has expired; has gone to meet his maker; is a stiff; he’s bereft of life; he now rests in peace; he’s pushing up the daisies; his metabolic processes are now history; he’s off the twig; he’s kicked the bucket; he’s shuffled off his mortal coil, run down the curtain and joined the choir invisible; he’s assumed room temperature; he’s gone belly up; he’s beyond the value and he bit the dust; he’s brown bread and bought the farm; he’s cashed in his chips, checked out, croaked and counting worms; and hundreds of others. http://montypython.50webs.com/scripts/Series_1/53.htm

The South African Insurance Industry Survey 2019 | 37 37 | The South African Insurance Industry Survey 2019 The South African Insurance Industry Survey 2019 | 37
Unravelling the regulatory conundrum – how we can help youThe volume, breadth and depth of regulation facing insurance firms is at an unprecedented level. This has imposed challenges and additional responsibilities in all areas of the financial services sector, all the way up to board level. We understand this regulatory burden, the expectations of regulators and how rules should be applied. We work with financial services in every sector, identifying relevant rules and their impact on your business. Our multi-disciplinary team and unrivalled experience means we understand the regulatory environment and are best placed to assist you with meeting your obligations. We are able to assist you with the following areas of legislation, amongst others:
• Insurance Act, Prudential requirements, Solvency Assessment and Management (SAM)
• Binder Regulations, Outsourcing compliance
• Protection of Personal Information, General Data Protection Regulations (GDPR), Data Management, Competition Law
• Retail Distribution Review (RDR)
• Market Conduct, Policyholder Protection, Conduct of Financial Institutions
• Financial Advisory and Intermediary Services Act (FAIS)
For more information please contact:
Derek VicePartner, InsuranceT: +27 82 711 2519E: [email protected]
Nikki PennelAssociate Director, Legal T: +27 82 719 5961E: [email protected]
Mark DanckwertsPartner, Insurance Practice LeaderT: +27 82 710 3261E: [email protected]
Benjamin VoslooSenior Manager, InsuranceT: +27 82 710 9640 E: [email protected]
Michelle DuboisSenior Manager, Regulatory Centre of ExcellenceT: +27 60 997 4512E: [email protected]
Finn ElliotAssociate Director, Regulatory Centre of ExcellenceT: +27 79 039 9367E: [email protected]

38 | The South African Insurance Industry Survey 2019
Nikki PennelAssociate Director Data Protection Law Tel: +27 82 719 5916 Email: [email protected]

The South African Insurance Industry Survey 2019 | 39
Data privacy Key regulatory challenges emerging from POPIA and the GDPR
Has anything really changed?
It has been almost six years since the Protection of Personal Information Act of 2013 (“POPIA”) was promulgated and a year since the European Union’s General Data Protection Regulations (“GDPR”) came into effect. While POPIA still awaits an effective date for the provisions which require compliance from the entities processing personal information, there remains a heightened global focus on privacy as a fundamental consumer right.
In South Africa, the Policy Holder Protection Rules (for both the long term and short term insurance industries) dovetail with the requirements of POPIA insofar as confidentiality, privacy, security and retention of data is concerned, with the provisions relating to data management coming into effect on 1 January 2020.
The South African Information Regulator has officially occupied office since 1 December 2016. Notwithstanding that the substantive provisions of POPIA are not yet effective, the Information Regulator has informally been handling various complaints
received from consumers and has been engaging with companies who have been the subject of material information security breaches. The Information Regulator has convened meetings with various government institutions, including the HAWKS, the National Prosecuting Authority, the National Credit Regulator and the Credit Bureau Association and other foreign data protection authorities, such as the United Kingdom’s Information Commissioner Office.
A level of uncertainty remains insofar as the extent to which companies should already be implementing the requirements of POPIA from a consumer relations perspective, with certain service providers to insurers refusing to take any tangible steps towards compliance until an effective date for POPIA is announced. This places insurers in an unenviable position of balancing the longstanding relationships they may have with their key service providers with the need to provide a customer-centric service offering to their clients.
The GDPR remains high on the agenda
Globally, the GDPR remains high on the agenda for insurers, but it appears that the approach to compliance remains primarily reactive and uncoordinated. Mark Thompson, KPMG’s Privacy Advisory Lead has remarked that “this often stems from the issue that
it is not owned at the board level, where the board form a clear articulation of the organisation’s privacy risk appetite, which is then translated into a risk-based remediation plan. This is surprising for a sector with risk management at its core.” (“Privacy and the GDPR – Have you got it right?” The London Journal, 2018).
In South Africa, most insurers have done something in the way of data protection, either from a POPIA perspective or in terms of global policy which compels the incorporation of the GDPR into their action plans. However, true compliance remains a challenge. In certain instances, privacy gap analyses or impact assessments, which were conducted some years ago in response to the promulgation of POPIA in 2013, are still being relied upon with little implementation having been completed other than changes to key policies and contracts and ensuring that cybersecurity risks are managed.
Compliance requirements which require human intervention or which require fundamental changes to data management processes, particularly relating to the insurer’s duty of transparency and obligation to provide access to personal information, remain problematic.
We set out below some of the key challenges that have emerged within the South African privacy / data protection landscape.

40 | The South African Insurance Industry Survey 2019
Key emerging challenges
Consent management
Consent is but one of the lawful justifications for processing of personal information. However, relying on consent as a justification for processing personal information potentially creates an additional administrative burden under both POPIA (and the GDPR). This is due to the specific requirement for consent under POPIA (and the GDPR) - that is, it cannot be implied and must be voluntary, specific and informed. In order to meet this requirement, any notice which an organisation uses to inform its data subjects of the nature and purpose of processing personal information must be sufficiently specific for data subjects to be in a position to provide such informed consent.
As data subjects may withdraw their consent at any time (subject to the provisions of section 11(2)(b) of POPIA), there is a need for insurers to put in place a process which enables them to manage consents and withdrawals of consent and respond accordingly.
Data subject requests
While data security remains top of mind in the context of data protection and privacy, the management of personal information insofar as access requests, deletion and portability are concerned is a significant
challenge for financial services firms.
On 14 December 2018, the South African Information Regulator published the relevant forms to be used when a data subject wishes to request a correction or deletion of personal information in terms of POPIA. Few South African companies, however, have established formal processes through which such requests may be received and actioned across the organisation and the systems it uses. At best, requests for personal information have been handled on an ad hoc basis, without a complete understanding of the personal information retained by the insurer (in its various forms) about that individual.
While subject access requests might not currently be a burning issue for South African insurers, it should be noted that after the GDPR came into effect, the insurance industry in the United Kingdom experienced a 20% increase in subject access requests within a period of a week. Once South African consumers are alerted to their rights of access to their own personal information, a similar increase can be expected.
Management of third party vendors
The use of third party service providers to process personal information, such a tracing agents, credit bureaux, forensic investigation services and other service providers, are potential areas of risk. POPIA requires that all responsible parties (organisations which determine the purpose and means of processing
personal information) ensure, through a written contract that its third party “operators” (persons who process person information for an on behalf of the responsible party), establish and maintain the relevant security measures referred to in POPIA.
Beyond the contractual requirement which POPIA imposes on responsible parties, the extent to which financial services companies should have insight into their third party “operators’” specific security measures and be involved in the monitoring of their compliance, will need to be considered in the context of the nature and volume of personal information being processed by the “operator” concerned. Additional monitoring processes will further add to the financial services firms’ administrative burden, but will be necessary in order to manage its risk exposure and protect the rights of its customers.
Reporting obligations under the Cybercrimes Bill
Related to information security and privacy, financial institutions will need to be aware of the obligations which are sought to be placed on them under the current version of the Cybercrimes Bill.
The Cybercrimes Bill seeks, amongst other things, to impose obligations on electronic communications service providers and financial institutions to report cybercrimes and provide technical and other assistance to the police in their investigations of cybercrime.

The South African Insurance Industry Survey 2019 | 41
Concluding remarksDespite the lengthy hiatus since the promulgation of POPIA, other (and perhaps more urgent) drivers compel a renewed focus on privacy and responsible data management in the insurance industry. According to a KPMG survey (as published in The London Journal 2018) of nearly 7000 individuals globally, nearly 75% of respondents have low levels of trust in insurance organisations that process their personal data, with just 7.7% indicating that they trust insurers completely. This is in stark contrast when compared to banks, with 40% of respondents indicating that they have high levels of trust in banks processing their personal data.
These statistics should raise alarms with senior executives across the insurance sector, as in the absence of trust, customers are likely to be increasingly resistant to share their personal information, potentially undermining future insurance business models and strategies.
The imminent changes to the South African consumer protection landscape and the enforcement market conduct will require organisations to develop a thorough understanding of their privacy and data security risks and controls to identify those areas where additional efforts are required to strengthen the effectiveness of their programmes. This is necessary, both for the sake of managing the legislative risk involved and cultivating customer trust in this industry.

42 | The South African Insurance Industry Survey 2019
David MilliganAssociate Director and CEO of Matchi, KPMG's FinTech subsidiary Tel: +27 60 997 7174 Email: [email protected]
Melanie MillerPartner Insurance information technology Tel: +27 82 170 0195 Email: [email protected]

The South African Insurance Industry Survey 2019 | 43
Cyber insurance – how Insuretechs can unlock the opportunityNot just digital, also physical – and intangible assetsCyber risk is not a wholly digital risk – it spills over into the physical world of tangible assets too, e.g. hacking into a fire protection sprinkler system could lead to flooding and damage to physical property. An integrated view of cyber activity is critical to fully address the range of risks that it can give rise to. Cyber insurance has historically been focused on digital assets, such as clients' personal or transactional data. The increase in cyber attacks has led insurers and their customers to rethink the knock-on effect on other insurance lines like personal (reputation), property (physical damage), intellectual property (competitor information), etc.
The unfolding of cyber insurance developments from a single focus on digital to encompassing other asset classes is a nascent one, with insurers struggling to use traditional methods to model the risks, especially since there is not much data. Those who do so successfully, will be well-positioned to share in this growing market.
Intangible assets comprise a growing proportion of valueBetween 1975 and 2015, the value of intangible assets as a proportion of total enterprise value (among S&P 500 companies) increased from 17% to 84%1. The increase in insurance cover for these assets has not followed suit – due, in part, to the inability of insurers to develop innovative products to insure them. Universal methods of brand valuation were absent for many years. Consider the brand value of Coca Cola which is a substantial portion of the value of the company, yet the actual product has been largely unchanged for decades. Companies with the largest intangibles are the “big tech” companies like Amazon and Microsoft where >95% of their value is in intangible assets2.
From protection to preventionCyber insurance is a relatively recent development in the insurance sector, having been around only since the 1990’s. Telecom and professional services companies used this to protect themselves in the event of accidental transfer of malware to clients or the loss of confidential client information. It took the form of a traditional insurance policy with very little specific information on the quantum of payments related to the risk event. The emergence of new cyber risks has created a much more complex landscape and insurers are no longer expected merely to offer cover after the events but also to assist in the prevention of such risks materialising. It is also expected that insurers will assist post the event to prevent further escalation of the consequences.
Companies are also increasingly crafting multi-pronged responses towards cyber threats. Previous findings suggested that companies may be complacent about cyber risk prevention in the presence of an insurance policy. However, the nature of the attendant reputational risks (which are difficult to insure against) has elevated the issue towards preparation for the inevitability of cyber risk events. This increased awareness has led to better preparation towards understanding and addressing cyber risks, beyond the tweaking of policy cover elements3.

44 | The South African Insurance Industry Survey 2019
US$100bn
2015 global revenue from cyber services (risk mitigation, risk transfer and post-incident solutions
The global Cyber insurance market is expanding quickly and is predicted to rise from US$2.5bn in 2015 to US$7.5bn by 2020, reaching US$20bn in premiums by 2025 (annual growth of 20-25%)
A huge opportunity for growth
Although still a relatively small market, the growth is fuelled by increased and varied cyber risks as well as the growing value of intangible assets. Penetration levels are still relatively low: <15% in the US but <1% in other regions of the world, so there is potential for significant growth3. This is both an opportunity and a challenge since insurers have to migrate from a mindset of providing cover to one of actively managing risks, including prevention and event based responses.
However, the growth rate of the cyber insurance industry is ten times that of the cybersecurity sector. Aon found that there was a 37% increase in US cyber premiums between 2016 and 2017, demonstrating that even in the most developed market, growth remains significant. Forecasts tend to paint an optimistic picture too, with Munich Re suggesting that a $4 billion global market in 2017 will become a $7-8 billion market in 20207.
70%
2%4
from risk mitigation services including hardware and software security solutions
insurance and reinsurance solutions
Companies are under insured - and vulnerableGlobal annual losses attributable to cyber-crime are estimated to be US$600bn and is expected to quadruple to more than US$2.1trn in 2019. The average insured loss from a cyber incident is now around US$2.3m,yet yearly global cyber premiums are estimated at US$2.5bn which is only 1% of total commercial premiums - and this is focused mostly on digital assets4.
In South Africa, cyber-crime now makes up 55% of losses in the banking industry alone5.
About half of all global CEOs (49%) say that a cyber attack is now a case of ‘when’, instead of ‘if’. Also, only 51% believe they are well-prepared for a cyber attack6.
It is estimated that 60% of FORTUNE 500 companies currently lack any insurance against cyber incidents – mainly due to the lack of adequate cyber insurance solutions1.
Intangible assets are largely uncovered, even though reputational damage post a cyber event (such as a data breach) is the single biggest cyber concern of corporate executives6.

The South African Insurance Industry Survey 2019 | 45
Cyber risk is not just about data breachesAlthough cyber risk has been associated with digital assets like data breaches, it extends far deeper across multiple other lines of risk. The bulk of the damage due to a cyber event may actually be the physical asset, especially if cyber techniques are being used to gain access to a physical asset. For example:
Home - hacking an alarm system to gain entry to steal possessions.
Property - hacking control systems for malicious purposes including sabotage: changing temperatures in competitor warehouses to destroy stock, setting off fire sprinkler systems to evacuate buildings.
Car - vehicle theft by controlling onboard computers to immobilise cars.
Aviation/shipping - stealing customers personal information through on-board internet access.
For these reasons, cyber risk is being recognised as an operational risk and monitored separately from general operational risks.
Cyber loss is both digital and physical
Business Interruption - unable to operate
or service clients
?
Liability - network issues from data loss to reduced access to network
services
Reputational Harm -
brand dilution
?
IP theft - hacking for information
Physical damage - data centres and
servers
Digital assets - personal data, financial data
Cyber loss can be in many
forms

46 | The South African Insurance Industry Survey 2019
Risk modelling a key competencyThe greatest challenge for insurers in developing cyber insurance products is the lack of data around cyber- security incidents. Historically, the superiority of risk models led directly to profitability and the ability to differentiate customers on the basis of risk levels. The unwillingness to report cyber events is understandable, given the potential for further reputational fallout which may exacerbate the loss.
A possible solution would be the establishment of anonymised databases for cyber events, which would allow for more rigorous risk modelling. As reporting and aggregation of cyber risk events improve, so will risk modelling capability.
Reputational damage is another risk that cannot be modelled. However, insured amounts could be heuristic in nature. In some cases, it could be the actual costs of mitigating fallout, e.g. costs of engaging PR companies, donations to appropriate NGOs, etc. Alternatively, this could cover the costs of cyber-related ransoms.
The South African Insurance Industry Survey 2019 | 47
Cyber insurance trendsNewer technologies and the digitisation of universal processes has led to increased vulnerability to cyber threats. Several trends are emerging8:
• The growing demand for cyber insurance coverage in sectors beyond healthcare, retail, and financial institutions, such as professional services.
• Shifts in the factors driving sales, especially as more third parties becoming involved in distribution channels.
• The importance of first-party coverage is changing as new causes of loss emerge, such as cyber extortion and funds transfer fraud.
• Growing interest in coverage for bodily injury and/or property damage arising from a cyber event.
• Even though large organisations remain targets, they accounted for less than 20% of cyber losses in 2016. Smaller organisations, including those with less than $1m in annual revenue, accounted for larger percentages of the losses.
The best solution for managing cyber risk is preventionManaging a cyber crisis is becoming an increasingly important part of the management toolset. Insurers now
need a wider range of capabilities, not all of which can be developed in house. The drive towards establishing partnerships with external parties with specific skills is a trend that is increasing. The main component in the management of cyber events are:
Understanding risk: assimilating technical know- how to gain a deeper understanding of the drivers and symptoms of risk events to identify and quantify risk factors to adequately price and structure cyber insurance products.
Preventing risk: increasing awareness and implementation of solutions that could prevent risks – these range from simple incentives to clients (premium discounts), e.g. downloading anti-virus software all the way to a fully governed programme of risk prevention encompassing : cyber risk assessment, advisory services, security software, hardware solutions, training of personnel and compliance. Encouragingly, Gartner is forecasting that the market for spending on global information security will to grow 8.7% to US$124 billion from over US$114 billion in 2018, an increase of 12.4% from the previous year9.
Fight cyber with cyberIt is clear that cyber risk will dominate the list of emerging risks as companies grapple with understanding and mitigating these. These risks can emanate from one person working alone with a computer in a foreign country or from a sophisticated global network of cyber criminals. Both can cripple an
entire organisation’s operations worldwide.
Most cyber insurance has been offered by the large traditional insurers. Some insurers are starting to recognise the opportunity and are also starting to focus on niches that they are comfortable with.
In addition, cyber risk is as applicable to small business as to larger ones – the difference is that the impact on a small business could be devastating yet it is estimated that only 15% of small businesses have cyber insurance. In South Africa, the SHA Cyber Security survey found that 42.5% of businesses do not have adequate anti-cyber-attack procedures in place. It found that around 60% of SMEs impacted, suffered a financial loss of between R50 000 and R1 million. It’s also been reported that up to 60% of SMEs never recover after a significant cyber breach10.
AIG was the largest writer by direct premiums of standalone cyber insurance in 2016 and added cyber coverage to its commercial casualty insurance in 2018, i.e. it moved away from issuing policies that do not specify whether cyber losses are covered.
Tech startups are starting to emerge in the provision of cyber insurance with new technologies and value propositions, partly due to the opportunity to exploit a niche as well as solutions to address cyber risks.
Companies and insurers alike need to tap into the rapidly increasing insuretech universe which offers an array of highly sophisticated tools exploiting multiple emerging technologies to prevent and mitigate cyber risks.

48 | The South African Insurance Industry Survey 2019
A. Data monitoring on cybersecurityA key preventative measure is the continuous monitoring of cyber attacks. Several insuretechs have developed solutions which analyse data or hone in on behaviours that are indicative of potential attacks.
We work with an InsureTech that offers a security rating platform that continuously analyses data oncybersecurity behaviours in order to help organisations manage third party risk, benchmark performance, and assess and negotiate cyber insurance premiums.
B. Cyber risk modellingThe actuarial models of risk-based premiums provide challenges to cyber events that are not well documented or transparent. Some startups have utilised cutting edge probability-based models to develop pricing models for cyber insurance.
We work with an InsureTech that offers an economic cyber risk modelling platform specifically for the insurance industry to understand the impact of cyber risk in the context of dollars and probabilities. For insurers, cyber offers potential growth but also lots of uncertainty. How likely is it that any given client will be hacked — and, if they are, how much damage could there be?
It is developing a system that can model these risks in financial and economic terms and has already won its first customers, including Brit Insurance, AM Best and Marsh.
C. Security readinessInsurers and their customers have to determine their cybersecurity posture, which is essentially the level of trust they have in their ability to address cyber risks.
Insuretech companies are developing quantitative measures of readiness to assist insurers in managing their portfolio of cyber risks for their customers.
We work with an InsureTech that offers a product specifically for insurance companies to assess the security risk posture of potential and existing clients, as well as determining policy premiums.
We work with an InsureTech that offers a cybersecurity preparedness score for enterprises to understand the risk of breaches and unplanned outages and to procure cybersecurity insurance.
D. Cyber insurance providersInevitably, innovators will recognise the niche in an industry and attempt to fill these with focused products and services. Cyber security is one such opportunity
and several startups are developing products that offer this type of product, competing directly with established insurers.
We work with an InsureTech that provides cyber insurance for the digital age that empowers clients to embrace technology. The company was founded with the intent of providing insurance products and services that enable companies to innovate despite the recurring threat of cyber risk.
They analyse, model and predict cyber risk, to create the best coverage for clients, and partner with brokers to deliver risk management programmes.
InsureTechs unlocking opportunity
Sources
1 Seizing The Cyber Insurance Opportunity – KPMG, 20172 Global Intangible Finance Tracker (GIFT™) 2018 — an annual review of the world’s intangible value October 20183 Cyber Insurance: Recent Advances, Good Practices and Challenges, ENISA, Nov 20164 Allianz Risk Barometer 2019 | AGCS - Allianz Global Corporate5 Sabric's Digital Banking Crime Statistics report, October 20186 Growing pains, 2018 Global CEO Outlook, KPMG7 Cyber, innovation and society, FinTech Futures, 23rd April 20198 Global Cyber Market Overview, Uncovering the hidden opportunities, AON, Jul 20179 Global information security spending to exceed $124bn in 2019, Forbes, 19 August 201810 Why Cyberinsurance should be first priority for SMEs, Business Report, 29 November 2018

The South African Insurance Industry Survey 2019 | 49

50 | The South African Insurance Industry Survey 2019
Benjamin VoslooSenior Manager Insurance Market Conduct, Binder Regulations and Outsourcing Tel: +27 82 710 9640 Email: [email protected]

The South African Insurance Industry Survey 2019 | 51
Short-term insurance industry resultsThe South African economy grew by 1.4% in the fourth quarter of 2018, contributing to an overall growth rate of 0.8% for the entire year
1
.
In 2018, South Africa entered recession, its second since the early 1990s. The 2018 recession spanned the first two quarters of the year, with the economy shrinking by 2.7% in the first quarter and contracting further by 0.5% in the second. Despite the recession, growth in the third (2.6%) and the fourth (1.4%) quarters was just enough to push overall growth for the year into positive territory. The real annual growth rate came in at 0.8% for the 2018 year. This is down from 1.4% in 2017 but up from 0.4% in 2016.
The finance, real estate and business services industries were strong supporters of overall growth in 2018. The agriculture, mining and construction industries did not contribute positively.
The table below summarises key metrics in the results of the 37 non-life insurer survey participants2:
The industry reported gross written premiums (“GWP”) of R108.6 billion in 2018, an increase of 8% when compared to the R100.4 billion written in 2017. The strong growth suggested in GWP did not carry though to profits. Profits after taxation (PAT) were down by 2.05% from 2017. This is in contrast with other key metrics such as claims incurred and the combined ratios which suggests improve profitability.
Profitability
Key fine factors to the lower profit levels:
• Reduced investment performance - investment income reduced by 11.54% in 2018 when compared to 2017. Similar to our analysis of the life industry results, the impact of market movements on investment income was significant.
– the JSE All Share Index (ALSI) was down 11% (SWIX 14%) in rand terms last year and even worse in dollars terms (24% down)5.
– interest rates were down in 2018 when compared to 2017.
– the 91 day Treasury Bills tender rates were down in 2018, when compared 2017.
– for the majority of 2018 the ZAR/USD exchange rates were better, when compared to 2017. However the Rand experienced significant weaknesses in the last quarter of 2018.
• The effective tax rate, for 2018, and when compared to profit before taxes, amounts to 27%, which higher than 2017 (23%).
2018 2017
Increase in gross written premium 8.14% 5.46%
Increase in net earned premiums 7.05% 3.06%
(Decrease)/Increase in investment income (11.54%) 29.96%
Claims incurred 55.53% 57.34%
Combined ratio 92.15% 93.35%
Operating ratio3 82.63% 81.83%
Management expense ratio4 27.36% 26.39%

52 | The South African Insurance Industry Survey 2019
• The management expense ratio suggests higher expenses in 2018 (27.36%), when compared to 2017 (26.39%).
• Recent experience seems to indicate a hardening in the reinsurance market on the back of worldwide lacklustre underwriting results for many reinsurers7.
It is well-known that South Africa remains vulnerable to weather disasters and drought. However, the 2018 calendar year was a good one in terms of claims experience for the industry. The improved claims experience is as a result of reduced claims frequency and severity. According to the Prudential Authority Annual Report 2018/20196, released in July 2019, the industry did not experience any catastrophic events during 2018. According to the Santam Analyst Presentation 2018 there have been fewer commercial fire claims during 2018. In contrast, it was noted that the Listeriosis outbreak had negatively impacted liability business.
This is opposed to the 2017 calendar year, which saw various large losses, which included catastrophe events such as the Knysna fires and the Gauteng and KwaZulu-Natal storms. According to Aon8, insurers no longer considered South Africa as a "low catastrophe risk" economy, with more than R5bn paid for losses incurred from natural disasters in 2017, the highest ever recorded. 2017 has been flagged as the costliest year on record for natural disasters, according to Aon Benfield's latest Weather, Climate and Catastrophe Insight Report.
The table below reflects the claims incurred ratio for the non-life sector for the most recent years.
In 2019, the industry experienced storms in several areas in Kwa-Zulu Natal and the Eastern Cape, restoring the new normal as far as it relates to large losses.
Market share analysis
The top ten short-term insurers remained relatively stable during the 2018 year, with few movements in the raking in terms of premium size. These insurers dominated the industry, underwriting 76.9% of the GWP in 2018. Santam remains at the top and has secured 24.3% (2017: 24.4%) of the market share. The charts below indicate the GWP share9 of the ten largest short-term insurance companies.
2018 2017 2016 2015
55.53% 57.34% 57.9% 57.1%

The South African Insurance Industry Survey 2019 | 53
There has been no change in the top three positions since 2017. Guardrisk increased its market share to 8% in 2018, when compared to 7% in 2017 and consequently moved into fourth place. This resulted in Outsurance moving into fifth place in 2018.
Guardrisk reflected premium growth of 18% to R8.2 billion, when compared to 2017 (R6.9 billion). In the Guardrisk Business Report 201810, it was noted that during 2017, Guardrisk acquired Marine Underwriting Managers and C&G Underwriting Managers, both leaders in their respective fields of marine underwriting; and construction, engineering and guarantee underwriting. One of the cornerstones of Guardrisk’s future growth plans is to add to its specialist underwriting capability, which these acquisitions have considerably strengthened.
Positions six and seven remained stable year-on-year, however Centriq moved into eighth place, from eleventh in 2017, removing M&F Risk Financing from tenth place.
The chart below indicates PAT: (profit after tax) compared to GWP for the ten largest short-term insurance companies.
54 | The South African Insurance Industry Survey 2019
According to the Prudential Authority Annual Report 2018/2019 the underwriting results (where the underwriting profit is expressed as a percentage of net earned premiums) stood at 10% for the primary insurers, cell captives, captives and reinsurers in the non-life insurance industry as at the end of December 2018.
Santam, Guardrisk, Bryte, Telesure and Absa achieved double digit growth in terms of PAT. OUTsurance managed to grow its PAT by 7%. The remaining top ten insurers experienced decreased profits.
Other developments
Corporate activities
Alexander Forbes sale of insurance business
The financial services group Alexander Forbes, which has a market capitalisation of about R8bn, announced in March 2019 its plan to sell its insurance businesses amid a shift in strategy towards an “advice-led and capital-light model”.
Momentum Metropolitan has entered into a binding agreement to acquire Alexander Forbes' Short-term Insurance business (AFI). The transaction will be implemented towards the end of 2019, subject to the approval of regulators. The base price proposed is R1.938bn and covers 100% of the shares of AFI, the IT which supports the business and trademarks of the business. Accounting for any other adjustments, the maximum final price could equate to R2.055bn11.
The sale of the short-term insurance business will bring much needed capital for Alexander Forbes to increase the size of its retirement administration business and revamp its IT systems. The short-term insurance business contributed 20% of Alexander Forbes’s annual revenue. In the 2019 financial year ended in March, it collected R1.8bn in gross written premiums, up 5%.
New entrants and partnerships
For the 2018/2019 period, the PA received five applications for licenses from existing and prospective financial institutions, of which one was approved, one was declined, and three are in progress.
According to Prudential Authority this will increase competitiveness and promote inclusivity. The Prudential Authority believes competition will positively affect pricing going forward.
Foot note and sources
1 http://www.statssa.gov.za/?p=119692 The net earned premiums of the companies featured in this publication approximate 82% of the industry’s net earned premiums and based on that, the survey results are a fair representation of the results of the overall industry3 (claims incurred + net commission incurred +management expenses – investment income)/net earned premium4 (Management and other expenses)/net earned premium5 https://www.biznews.com/asset-management/2019/01/02/2018-worst-year-in-decade-sa-stocks6 https://www.resbank.co.za/Lists/News%20and%20Publications/Attachments/9316/Prudential%20Authority%2 Annual%20Report%202018-2019.pdf 7 https://www.santam.co.za/media/2684698/santam-dec-2018-analyst-presentation-final.pdf8 https://www.fin24.com/Opinion/sifiso-skenjana-something-in-the-weather-the-rapidly-rising-cost-of-natural disasters-201905029 The gross written premiums for Absa include the premiums for Absa idirect. Premiums for Telesure include premiums written by the other Telesure Group short-term underwriters being Dial Direct, Budget, First for Women and Auto and General10 https://guardrisk.co.za/wp-content/themes/guardrisk/img/Guardrisk-business-report-2018.pdf11 https://www.businesslive.co.za/bd/companies/financial-services/2019-06-18-alexander-forbes-seeks-to-plug-the gap-after-exiting-insurance/ and https://www.fin24.com/Companies/Financial-Services/alexander-forbes-seeks buyer-for-its-insurance-businesses-20190326

The South African Insurance Industry Survey 2019 | 55

56 | The South African Insurance Industry Survey 2019
SHORT TERM INSURERS | Statement of Financial Position | R’000
Accounting year end Dec-18 Dec-17 Dec-18 Dec-17 Dec-18 Dec-17 Nov-18 Nov-17 Mar-18 Mar-17
Group/Company Absa idirect Limited Absa Insurance Company Limited
Absa Insurance Risk Management Services
Limited
AIG South Africa Limited
Alexander Forbes Insurance Company
Limited
Share capital and share premium 118,510 118,510 31,000 31,000 20,000 20,000 557,500 557,500 67,915 67,915
Retained earnings/(deficit) (118,510) 104,134 1,450,013 1,119,300 30,041 27,245 (9,177) 73,264 251,953 166,525
Reserves - - 5,262 6,058 - - - - - -
Total shareholders' funds - 222,644 1,486,275 1,156,358 50,041 47,245 548,323 630,764 319,868 234,440
Gross outstanding claims - 79,472 412,409 475,154 55,395 51,088 1,311,102 2,008,852 283,367 275,770
Gross unearned premium reserve - 26,962 740,134 690,462 - 182 731,917 649,690 26,389 27,575
Reinsurers' share of expected salvages and recoveries
- - - - - - - - - -
Owing to cell owners - - - - 63,566 61,443 - - - -
Deferred reinsurance commission revenue - - 6,555 5,274 - - 192,061 184,655 5,133 5,262
Deferred tax liability - - - - 2 2 - - - -
Other liabilities 26,033 48,949 339,329 179,781 20,379 13,625 1,274,746 1,342,145 106,872 109,795
Total liabilities 26,033 155,383 1,498,427 1,350,671 139,342 126,340 3,509,826 4,185,342 421,761 418,402
Total investments including investments in subsidiaries
- 302,568 2,194,343 1,720,491 73,789 84,366 767,205 651,474 257,673 331,416
Deferred tax asset, intangible assets and PPE - 8,220 48,983 26,592 - - 183,179 204,473 11,265 10,766
Reinsurers' share of outstanding claims - 30,396 62,402 264,886 55,395 51,088 1,233,476 1,849,616 242,304 215,486
Reinsurers' share of unearned premium reserve - 4,821 64,779 50,379 - 182 638,007 564,401 19,837 20,707
Gross expected salvages and recoveries - - - - - - - - - -
Deferred aquisition costs - - 119,888 123,072 - - 108,364 102,112 2,328 2,455
Cash and cash equivalents - 20,161 377,312 114,404 57,520 27,011 587,302 913,102 32,191 33,148
Other assets 26,033 11,861 116,995 207,205 2,679 10,938 540,616 530,928 176,031 38,864
Total assets 26,033 378,027 2,984,702 2,507,029 189,383 173,585 4,058,149 4,816,106 741,629 652,842
International solvency margin 0% 46% 62% 53% N/A N/A 229% 247% 75% 57%
Total assets/Total liabilities 100% 243% 199% 186% 136% 137% 116% 115% 176% 156%
Change in shareholders' funds (100%) 29% 6% (13%) 36%

The South African Insurance Industry Survey 2019 | 57
Accounting year end Dec-18 Dec-17 Jun-18 Jun-17 Jun-18 Jun-17 Dec-18 Dec-17 Jun-18 Jun-17
Group/Company Allianz Global Corporate and Specialty South
Africa Limited
Auto and General Insurance Company
(RF) Limited
Bidvest Insurance Limited
Bryte Insurance Company Limited
Budget Insurance Company (RF) Limited
Share capital and share premium 123,164 90,500 53,506 53,506 10,000 10,000 4,650 4,650 80,001 80,001
Retained earnings/(deficit) 52,068 31,612 765,802 650,754 303,208 302,865 1,245,424 1,489,850 524,042 371,525
Reserves - - - - 71,405 34,751 (23,436) 51,891 - -
Total shareholders' funds 175,232 122,112 819,308 704,260 384,613 347,616 1,226,638 1,546,391 604,043 451,526
Gross outstanding claims 1,318,629 993,245 392,257 394,865 108,640 148,890 2,336,084 2,288,759 258,593 206,443
Gross unearned premium reserve 410,185 367,675 140,055 133,800 323,758 327,454 671,167 622,025 44,685 41,488
Reinsurers' share of expected salvages and recoveries
- - 58,045 40,406 - - - - 31,905 26,896
Owing to cell owners - - - - - - - - - -
Deferred reinsurance commission revenue 154,297 127,775 - - - - 40,130 35,778 - -
Deferred tax liability - - - 3,098 28,988 19,886 - - - -
Other liabilities 239,435 185,898 331,711 181,453 13,959 14,120 1,388,162 992,785 94,459 84,456
Total liabilities 2,122,546 1,674,593 922,068 753,622 475,345 510,350 4,435,543 3,939,347 429,642 359,283
Total investments including investments in subsidiaries
- - 1,119,142 960,824 584,685 538,813 2,152,175 3,228,744 733,237 582,059
Deferred tax asset, intangible assets and PPE 4,576 4,978 1,561 - - - 166,023 276,035 689 285
Reinsurers' share of outstanding claims 1,288,374 961,830 69,064 59,643 22,671 45,466 1,370,251 1,323,101 30,643 22,346
Reinsurers' share of unearned premium reserve 410,405 367,636 - - 17,544 16,354 268,185 221,595 - -
Gross expected salvages and recoveries - - 105,391 84,363 22,091 - - - 67,144 55,972
Deferred aquisition costs 91,839 83,462 13,609 14,009 74,321 64,142 92,825 82,476 554 1,509
Cash and cash equivalents 228,277 161,939 158,420 29,810 98,773 115,736 643,738 318,237 89,054 54,437
Other assets 274,307 216,860 274,189 309,233 39,873 77,455 968,984 35,550 112,364 94,201
Total assets 2,297,778 1,796,705 1,741,376 1,457,882 859,958 857,966 5,662,181 5,485,738 1,033,685 810,809
International solvency margin (3110%) 20558% 52% 50% 104% 96% 37% 58% 71% 60%
Total assets/Total liabilities 108% 107% 189% 193% 181% 168% 128% 139% 241% 226%
Change in shareholders' funds 44% 16% 11% (21%) 34%
SHORT TERM INSURERS | Statement of Financial Position | R’000

58 | The South African Insurance Industry Survey 2019
Accounting year end Dec-18 Dec-17 Dec-18 Dec-17 Jun-18 Jun-17 Dec-18 Dec-17 Mar-18 Mar-17
Group/Company Centriq Insurance Company Limited
Chubb Insurance South Africa Limited
Clientele General Insurance Limited
Compass Insurance Company Limited
Corporate Guarantee (South Africa) Limited
Share capital and share premium 55,000 55,000 115,000 115,000 42,500 42,500 114,284 114,284 42,900 42,900
Retained earnings/(deficit) 230,328 190,751 110,528 92,744 176,542 144,576 135,758 100,446 27,637 25,741
Reserves - - 1,752 2,417 3,618 3,169 201 214 - -
Total shareholders' funds 285,328 245,751 227,280 210,161 222,660 190,245 250,243 214,944 70,537 68,641
Gross outstanding claims 768,881 716,650 520,308 673,510 6,465 5,754 486,897 584,836 9,771 7,767
Gross unearned premium reserve 3,485,703 2,102,927 186,581 214,708 3,358 3,627 96,764 106,119 523,948 480,590
Reinsurers' share of expected salvages and recoveries
- - - - - - - - - -
Owing to cell owners 1,322,647 1,143,776 - - - - - - - -
Deferred reinsurance commission revenue 51,617 36,652 41,730 46,726 - - 29,682 32,739 - -
Deferred tax liability - - 318 554 6,398 4,015 - - - -
Other liabilities 1,027,541 956,925 114,960 119,327 53,017 48,220 316,756 245,631 5,380 6,380
Total liabilities 6,656,389 4,956,930 863,897 1,054,825 69,238 61,616 930,099 969,325 539,099 494,737
Total investments including investments in subsidiaries
5,321,288 3,996,712 238,323 273,172 227,893 201,337 540,557 463,073 448,994 443,326
Deferred tax asset, intangible assets and PPE 30,870 31,363 2,981 3,004 16,161 16,083 10,757 8,141 2,576 932
Reinsurers' share of outstanding claims 323,372 266,242 405,404 554,116 - - 433,415 522,648 - -
Reinsurers' share of unearned premium reserve 200,348 120,036 137,697 155,487 - - 97,203 109,719 - -
Gross expected salvages and recoveries - - - - - - - - - -
Deferred aquisition costs 42,873 31,305 27,366 30,767 - - 27,098 30,081 - -
Cash and cash equivalents 384,630 316,595 143,798 121,704 46,278 31,302 42,680 19,654 87,925 56,584
Other assets 638,336 440,428 135,608 126,736 1,566 3,139 28,632 30,953 70,141 62,536
Total assets 6,941,717 5,202,681 1,091,177 1,264,986 291,898 251,861 1,180,342 1,184,269 609,636 563,378
International solvency margin 17% 33% 208% 168% 55% 54% 271% 263% 145% 83%
Total assets/Total liabilities 104% 105% 126% 120% 422% 409% 127% 122% 113% 114%
Change in shareholders' funds 16% 8% 17% 16% 3%
SHORT TERM INSURERS | Statement of Financial Position | R’000
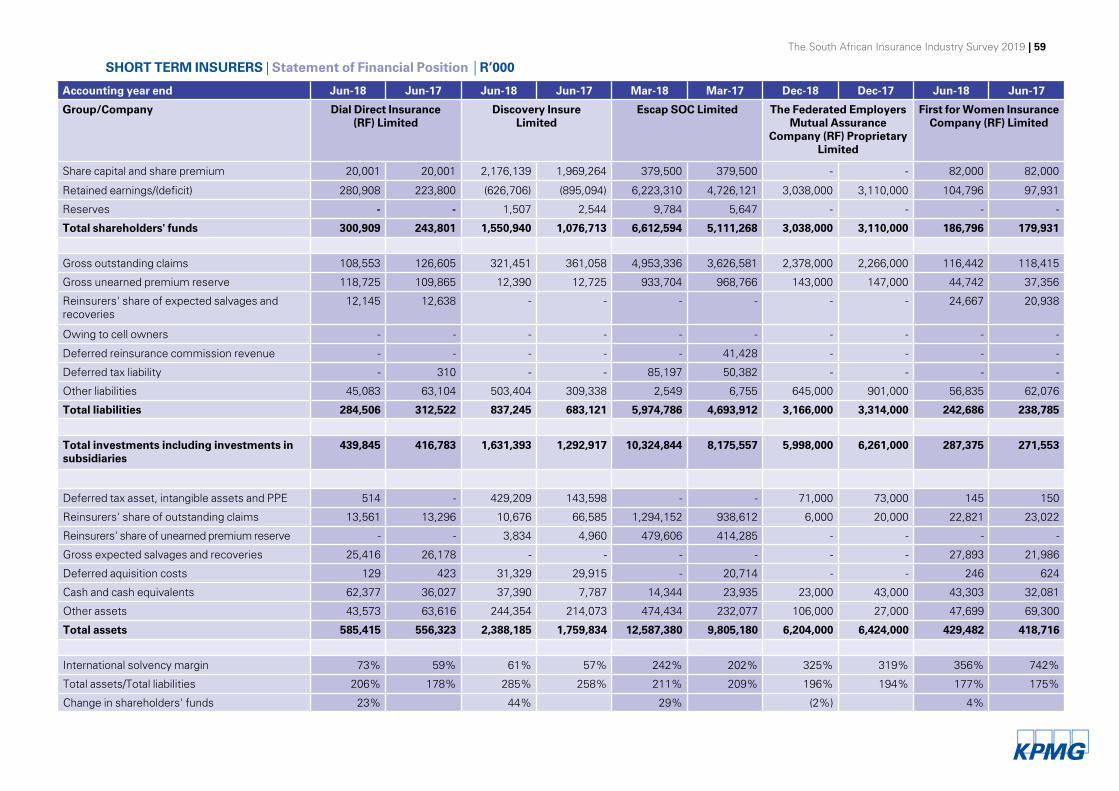
The South African Insurance Industry Survey 2019 | 59
Accounting year end Jun-18 Jun-17 Jun-18 Jun-17 Mar-18 Mar-17 Dec-18 Dec-17 Jun-18 Jun-17
Group/Company Dial Direct Insurance (RF) Limited
Discovery Insure Limited
Escap SOC Limited The Federated Employers Mutual Assurance
Company (RF) Proprietary Limited
First for Women Insurance Company (RF) Limited
Share capital and share premium 20,001 20,001 2,176,139 1,969,264 379,500 379,500 - - 82,000 82,000
Retained earnings/(deficit) 280,908 223,800 (626,706) (895,094) 6,223,310 4,726,121 3,038,000 3,110,000 104,796 97,931
Reserves - - 1,507 2,544 9,784 5,647 - - - -
Total shareholders' funds 300,909 243,801 1,550,940 1,076,713 6,612,594 5,111,268 3,038,000 3,110,000 186,796 179,931
Gross outstanding claims 108,553 126,605 321,451 361,058 4,953,336 3,626,581 2,378,000 2,266,000 116,442 118,415
Gross unearned premium reserve 118,725 109,865 12,390 12,725 933,704 968,766 143,000 147,000 44,742 37,356
Reinsurers' share of expected salvages and recoveries
12,145 12,638 - - - - - - 24,667 20,938
Owing to cell owners - - - - - - - - - -
Deferred reinsurance commission revenue - - - - - 41,428 - - - -
Deferred tax liability - 310 - - 85,197 50,382 - - - -
Other liabilities 45,083 63,104 503,404 309,338 2,549 6,755 645,000 901,000 56,835 62,076
Total liabilities 284,506 312,522 837,245 683,121 5,974,786 4,693,912 3,166,000 3,314,000 242,686 238,785
Total investments including investments in subsidiaries
439,845 416,783 1,631,393 1,292,917 10,324,844 8,175,557 5,998,000 6,261,000 287,375 271,553
Deferred tax asset, intangible assets and PPE 514 - 429,209 143,598 - - 71,000 73,000 145 150
Reinsurers' share of outstanding claims 13,561 13,296 10,676 66,585 1,294,152 938,612 6,000 20,000 22,821 23,022
Reinsurers' share of unearned premium reserve - - 3,834 4,960 479,606 414,285 - - - -
Gross expected salvages and recoveries 25,416 26,178 - - - - - - 27,893 21,986
Deferred aquisition costs 129 423 31,329 29,915 - 20,714 - - 246 624
Cash and cash equivalents 62,377 36,027 37,390 7,787 14,344 23,935 23,000 43,000 43,303 32,081
Other assets 43,573 63,616 244,354 214,073 474,434 232,077 106,000 27,000 47,699 69,300
Total assets 585,415 556,323 2,388,185 1,759,834 12,587,380 9,805,180 6,204,000 6,424,000 429,482 418,716
International solvency margin 73% 59% 61% 57% 242% 202% 325% 319% 356% 742%
Total assets/Total liabilities 206% 178% 285% 258% 211% 209% 196% 194% 177% 175%
Change in shareholders' funds 23% 44% 29% (2%) 4%
SHORT TERM INSURERS | Statement of Financial Position | R’000


The South African Insurance Industry Survey 2019 | 61
Accounting year end Jun-18 Jun-17 Jun-18 Jun-17 Sep-18 Sep-17 Jun-18 Jun-17 Jun-18 Jun-17
Group/Company Guardrisk Insurance Company Limited
The Hollard Insurance Company Limited
Indequity Specialised Insurance Limited
Legal Expenses Insurance Southern Africa Limited
Momentum Short Term Insurance Company
Limited
Share capital and share premium 224,414 224,414 1,642,601 1,642,601 14,470 11,470 16,634 16,634 798,613 654,050
Retained earnings/(deficit) 375,467 254,890 1,330,287 1,581,361 21,070 18,139 411,455 386,685 (287,147) (323,166)
Reserves - - 4,012 4,012 (2,265) (510) 9,925 8,653 - -
Total shareholders' funds 599,881 479,304 2,976,900 3,227,974 33,275 29,099 438,014 411,972 511,466 330,884
Gross outstanding claims 1,672,900 1,338,865 3,085,426 3,348,912 5,061 4,928 253,726 259,624 141,141 127,539
Gross unearned premium reserve 3,856,490 3,502,841 1,755,950 1,823,678 293 260 - - 19,336 12,823
Reinsurers' share of expected salvages and recoveries
- - - - - - - - - -
Owing to cell owners 4,991,574 4,742,411 - - - - - - - -
Deferred reinsurance commission revenue 120,698 113,940 - - - - - - - -
Deferred tax liability 14,520 16,376 223,310 166,581 183 154 12,286 11,353 - -
Other liabilities 1,390,475 1,172,145 2,736,781 2,595,625 3,316 6,300 76,271 77,000 76,148 56,968
Total liabilities 12,046,657 10,886,578 7,801,467 7,934,796 8,853 11,642 342,283 347,977 236,625 197,330
Total investments including investments in subsidiaries
8,790,531 7,343,293 3,221,672 3,029,237 8,697 6,569 520,768 483,772 590,296 408,006
Deferred tax asset, intangible assets and PPE 18,105 24,543 343,966 289,656 2,142 2,883 130,985 129,106 121,817 61,271
Reinsurers' share of outstanding claims 1,213,536 1,186,495 1,548,649 1,688,748 31 42 - - 1,469 3,809
Reinsurers' share of unearned premium reserve 635,781 589,301 1,203,812 1,304,701 - - - - 215 218
Gross expected salvages and recoveries - - - - 2,080 2,095 - - - -
Deferred aquisition costs 88,169 87,184 116,443 143,311 - - - - 220 182
Cash and cash equivalents 841,226 1,039,080 2,221,041 2,080,702 29,088 28,884 109,833 140,287 34,074 54,728
Other assets 1,059,190 1,095,986 2,122,784 2,626,415 90 268 18,711 6,784 - -
Total assets 12,646,538 11,365,882 10,778,367 11,162,770 42,128 40,741 780,297 759,949 748,091 528,214
International solvency margin 17% 15% 38% 39% 57% 56% 54% 52% 69% 53%
Total assets/Total liabilities 105% 104% 138% 141% 476% 350% 228% 218% 316% 268%
Change in shareholders' funds 25% (8%) 14% 6% 55%
SHORT TERM INSURERS | Statement of Financial Position | R’000
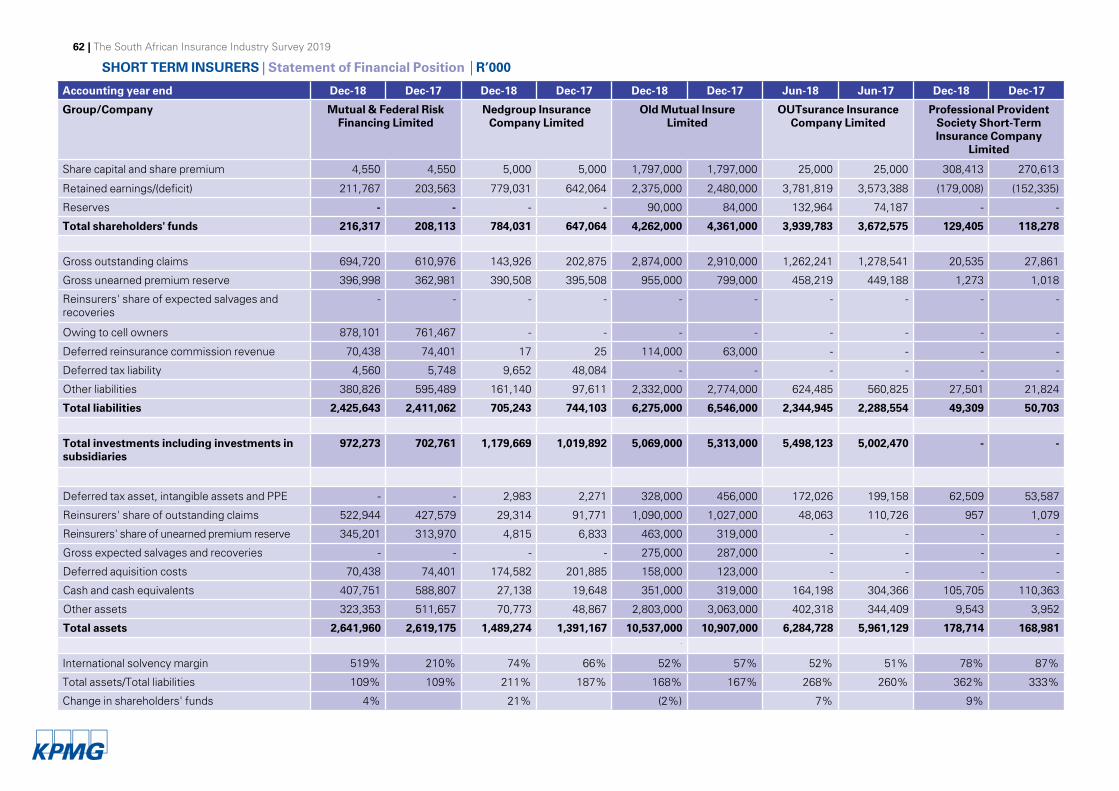
62 | The South African Insurance Industry Survey 2019
Accounting year end Dec-18 Dec-17 Dec-18 Dec-17 Dec-18 Dec-17 Jun-18 Jun-17 Dec-18 Dec-17
Group/Company Mutual & Federal Risk Financing Limited
Nedgroup Insurance Company Limited
Old Mutual Insure Limited
OUTsurance Insurance Company Limited
Professional Provident Society Short-Term Insurance Company
Limited
Share capital and share premium 4,550 4,550 5,000 5,000 1,797,000 1,797,000 25,000 25,000 308,413 270,613
Retained earnings/(deficit) 211,767 203,563 779,031 642,064 2,375,000 2,480,000 3,781,819 3,573,388 (179,008) (152,335)
Reserves - - - - 90,000 84,000 132,964 74,187 - -
Total shareholders' funds 216,317 208,113 784,031 647,064 4,262,000 4,361,000 3,939,783 3,672,575 129,405 118,278
Gross outstanding claims 694,720 610,976 143,926 202,875 2,874,000 2,910,000 1,262,241 1,278,541 20,535 27,861
Gross unearned premium reserve 396,998 362,981 390,508 395,508 955,000 799,000 458,219 449,188 1,273 1,018
Reinsurers' share of expected salvages and recoveries
- - - - - - - - - -
Owing to cell owners 878,101 761,467 - - - - - - - -
Deferred reinsurance commission revenue 70,438 74,401 17 25 114,000 63,000 - - - -
Deferred tax liability 4,560 5,748 9,652 48,084 - - - - - -
Other liabilities 380,826 595,489 161,140 97,611 2,332,000 2,774,000 624,485 560,825 27,501 21,824
Total liabilities 2,425,643 2,411,062 705,243 744,103 6,275,000 6,546,000 2,344,945 2,288,554 49,309 50,703
Total investments including investments in subsidiaries
972,273 702,761 1,179,669 1,019,892 5,069,000 5,313,000 5,498,123 5,002,470 - -
Deferred tax asset, intangible assets and PPE - - 2,983 2,271 328,000 456,000 172,026 199,158 62,509 53,587
Reinsurers' share of outstanding claims 522,944 427,579 29,314 91,771 1,090,000 1,027,000 48,063 110,726 957 1,079
Reinsurers' share of unearned premium reserve 345,201 313,970 4,815 6,833 463,000 319,000 - - - -
Gross expected salvages and recoveries - - - - 275,000 287,000 - - - -
Deferred aquisition costs 70,438 74,401 174,582 201,885 158,000 123,000 - - - -
Cash and cash equivalents 407,751 588,807 27,138 19,648 351,000 319,000 164,198 304,366 105,705 110,363
Other assets 323,353 511,657 70,773 48,867 2,803,000 3,063,000 402,318 344,409 9,543 3,952
Total assets 2,641,960 2,619,175 1,489,274 1,391,167 10,537,000 10,907,000 6,284,728 5,961,129 178,714 168,981 -
International solvency margin 519% 210% 74% 66% 52% 57% 52% 51% 78% 87%
Total assets/Total liabilities 109% 109% 211% 187% 168% 167% 268% 260% 362% 333%
Change in shareholders' funds 4% 21% (2%) 7% 9%
SHORT TERM INSURERS | Statement of Financial Position | R’000

The South African Insurance Industry Survey 2019 | 63
Accounting year end Jun-18 Jun-17 Jun-18 Jun-17 Mar-18 Mar-17 Dec-18 Dec-17 Mar-18 Mar-17
Group/Company Regent Insurance Company Limited
Renasa Insurance Company Limited
Safire Insurance Company Limited
Santam Limited Sasria SOC Limited
Share capital and share premium 200,503 200,503 149,550 56,550 10,053 10,053 103,000 103,000 - -
Retained earnings/(deficit) 43,918 18,359 18,518 800 142,462 123,416 7,763,000 6,980,000 6,097,080 5,284,277
Reserves 792,834 767,184 - - 43,686 36,778 - - 529,709 480,286
Total shareholders' funds 1,037,255 986,046 168,068 57,350 196,201 170,247 7,866,000 7,083,000 6,626,789 5,764,563
Gross outstanding claims 281,142 288,676 228,272 151,673 107,946 95,987 9,885,000 9,376,000 765,440 809,034
Gross unearned premium reserve 370,898 346,455 49,483 24,628 69,813 61,343 3,415,000 3,053,000 413,964 393,280
Reinsurers' share of expected salvages and recoveries
- - - - - - - - - -
Owing to cell owners - - - - 124,574 131,305 - - - -
Deferred reinsurance commission revenue - - - - - - 374,000 284,000 4,321 7,219
Deferred tax liability 41,829 24,815 - - 7,682 7,412 - 14,000 91,860 18,159
Other liabilities 158,157 172,436 180,920 133,920 59,214 63,056 7,081,000 6,174,000 114,011 104,861
Total liabilities 852,026 832,382 458,675 310,221 369,229 359,103 20,755,000 18,901,000 1,389,596 1,332,553
Total investments including investments in subsidiaries
1,629,314 1,089,256 109,277 6,111 304,718 279,726 15,685,000 13,208,000 5,769,451 4,031,555
Deferred tax asset, intangible assets and PPE 67,282 109,475 8,599 6,921 18,073 18,043 347,000 344,000 7,299 8,946
Reinsurers' share of outstanding claims 34,840 35,859 201,110 131,313 46,968 39,343 4,270,000 4,015,000 108 137
Reinsurers' share of unearned premium reserve 86 358 44,752 22,088 11,392 9,072 1,406,000 1,153,000 24,722 24,065
Gross expected salvages and recoveries - - - - - - - - - -
Deferred aquisition costs - - 8,304 4,483 13,075 11,291 564,000 490,000 59,498 53,269
Cash and cash equivalents 86,917 469,096 203,746 134,387 23,421 25,881 1,361,000 2,026,000 1,940,774 2,790,334
Other assets 70,842 114,384 50,955 62,268 147,783 145,994 4,988,000 4,748,000 214,533 188,810
Total assets 1,889,281 1,818,428 626,743 367,571 565,430 529,350 28,621,000 25,984,000 8,016,385 7,097,116
International solvency margin 75% 75% 117% 43% 74% 76% 37% 36% 359% 339%
Total assets/Total liabilities 222% 218% 137% 118% 153% 147% 138% 137% 577% 533%
Change in shareholders' funds 5% 193% 15% 11% 15%
SHORT TERM INSURERS | Statement of Financial Position | R’000

64 | The South African Insurance Industry Survey 2019
Accounting year end Dec-18 Dec-17 Sep-18 Sep-17
Group/Company Standard Insurance Limited
Unitrans Insurance Limited
Share capital and share premium 30,000 30,000 15,150 15,150
Retained earnings/(deficit) 1,595,908 1,398,854 420,673 370,384
Reserves 140 140 - -
Total shareholders' funds 1,626,048 1,428,994 435,823 385,534
Gross outstanding claims 497,991 588,955 51,942 135,520
Gross unearned premium reserve 63,486 44,190 153,804 148,045
Reinsurers' share of expected salvages and recoveries
- - - -
Owing to cell owners - - - -
Deferred reinsurance commission revenue - 97 2,709 2,606
Deferred tax liability - 7,221 8,913 8,390
Other liabilities 130,000 125,191 33,872 123,571
Total liabilities 691,477 765,654 251,240 418,132
Total investments including investments in subsidiaries
1,703,353 1,463,324 256,851 101,197
Deferred tax asset, intangible assets and PPE 12,675 1,903 - -
Reinsurers' share of outstanding claims 8,516 113,841 13,985 57,824
Reinsurers' share of unearned premium reserve - 606 69,018 64,368
Gross expected salvages and recoveries - - - -
Deferred aquisition costs 5,633 2,654 34,621 33,288
Cash and cash equivalents 312,912 206,190 274,240 494,054
Other assets 274,436 406,130 38,348 52,935
Total assets 2,317,525 2,194,648 687,063 803,666
International solvency margin 64% 62% 252% 220%
Total assets/Total liabilities 335% 287% 273% 192%
Change in shareholders' funds 14% 13%
SHORT TERM INSURERS | Statement of Financial Position | R’000

The good, the bad and the ugly of the 2016 financial results reported by the life insurance industry
We changed the survey format somewhat in the current year to improve the comparability of the information presented. In previous surveys we included separate columns for each individual insurer, even if they formed part of the same group. However, in the current year we used the consolidated financial information for the listed insurers that often have more than one life licence. This change allows for an easier reference to the results published by the groups, and a more useful analysis of the industry results. The reader should note that where consolidated financial statements were used, they also include the results of the groups’ other subsidiaries which may comprise short-term insurance, asset management and foreign subsidiaries.
Industry overviews in recent months produced by the financial press covering the life industry are riddled with words such as ‘woes, turmoil and losing traction”. The sentiment around the industry is not positive and naysayers point towards unexpected changes in CEOs, increasing lapse rates and poor investment results that clearly all is not well. The financial results for the life insurance
industry summarised in this survey does show this strain, but perhaps not to the same extent. The table below presents some of the salient aggregated IFRS metrics of the participants in the survey:

66 | The South African Insurance Industry Survey 2019
Accounting year end Dec-18 Dec-17 Dec-18 Dec-17 Dec-18 Dec-17 Nov-18 Nov-17 Mar-18 Mar-17
Group/Company Absa idirect Limited Absa Insurance Company Limited
Absa Insurance Risk Management Services
Limited
AIG South Africa Limited
Alexander Forbes Insurance Company
Limited
Gross premiums written 427,618 500,244 2,566,695 2,350,748 - (3,648) 2,010,681 2,014,110 1,695,208 1,633,203
Net premiums written 416,208 488,560 2,407,539 2,188,487 - - 239,411 255,591 426,694 413,054
Earned premiums 407,311 487,357 2,404,751 2,182,289 - - 230,790 272,493 427,009 412,695
Total net investment income 19,935 23,018 161,182 157,700 7,477 7,129 66,618 84,633 31,759 29,497
Reinsurance commission revenue 499 603 18,660 13,405 - - 522,063 628,245 343,262 294,267
Other income 3,273 4,185 33,925 29,669 19 19 12,911 - 65,838 66,091
Total income 431,018 515,163 2,618,518 2,383,063 7,496 7,148 832,382 985,371 867,868 802,550
Net claims incurred 325,049 354,358 1,393,522 1,444,594 4,589 4,782 258,553 305,146 273,580 278,870
Acquisition costs 60,028 80,215 387,541 358,285 - - 288,220 336,898 84,798 79,744
Cell owners' transactions - - - - - - - - - -
Management and other expenses 22,285 25,885 433,759 373,074 111 2,242 388,306 436,500 391,110 379,327
Total expenses 407,362 460,458 2,214,822 2,175,953 4,700 7,024 935,079 1,078,544 749,488 737,941
Net profit/(loss) before taxation 23,656 54,705 403,696 207,110 2,796 124 (102,697) (93,173) 118,380 64,609
Taxation 34,663 15,319 87,436 52,454 - - (20,256) (24,787) 32,952 17,642
Net profit/(loss) after taxation (11,007) 39,386 316,260 154,656 2,796 124 (82,441) (68,386) 85,428 46,967
Other comprehensive income/(expense) - - - - - - - - - -
Total comprehensive income/(loss) for the year (11,007) 39,386 316,260 154,656 2,796 124 (82,441) (68,386) 85,428 46,967
Transfer to/(from) retained earnings (211,637) - (206,453) - - - - - - -
Other comprehensive (income)/expense - - - - - - - - - -
Dividends - - 192,000 159,000 - - - - - -
Change in retained earnings (222,644) 39,386 330,713 (4,344) 2,796 124 (82,441) (68,386) 85,428 46,967
Net premium to gross premium 97% 98% 94% 93% N/A 0% 12% 13% 25% 25%
Claims incurred to earned premium 80% 73% 58% 66% N/A N/A 112% 112% 64% 68%
Management and other expenses to net earned premium
5% 5% 18% 17% N/A N/A 168% 160% 92% 92%
Combined ratio 100% 94% 91% 99% N/A N/A 179% 165% 95% 108%
Operating ratio 95% 90% 85% 92% N/A N/A 150% 134% 88% 100%
Return on equity N/A 18% 21% 13% 6% 0% (15%) (11%) 27% 20%
SHORT TERM INSURERS | Statement of Comprehensive Income| R’000

The South African Insurance Industry Survey 2019 | 67
SHORT TERM INSURERS | Statement of Comprehensive Income| R’000
Accounting year end Dec-18 Dec-17 Jun-18 Jun-17 Jun-18 Jun-17 Dec-18 Dec-17 Jun-18 Jun-17
Group/Company Allianz Global Corporate and Specialty South
Africa Limited
Auto and General Insurance Company
(RF) Limited
Bidvest Insurance Limited
Bryte Insurance Company Limited
Budget Insurance Company (RF) Limited
Gross premiums written 984,993 946,649 3,592,071 3,249,310 512,199 512,323 4,274,594 4,115,205 1,748,909 1,559,479
Net premiums written (5,635) 594 1,581,846 1,416,319 370,250 360,978 3,350,637 2,664,143 846,348 757,593
Earned premiums (5,930) (190) 1,575,591 1,420,672 375,136 390,420 3,348,086 2,742,276 843,151 732,465
Total net investment income 12,921 10,029 86,858 57,051 69,744 33,041 459,989 428,836 56,087 38,512
Reinsurance commission revenue 275,000 256,292 805,417 730,628 41,479 38,653 182,582 118,110 403,894 356,421
Other income 7,794 6,000 76,871 64,632 5,979 6,205 5,181 4,408 66,916 62,419
Total income 289,785 272,131 2,544,737 2,272,983 492,338 468,319 3,995,838 3,293,630 1,370,048 1,189,817
Net claims incurred 1,379 13,910 1,004,797 910,032 124,254 160,888 2,108,232 1,797,626 594,173 507,216
Acquisition costs 149,566 127,658 504,199 462,933 92,627 89,146 672,389 646,894 31,410 25,550
Cell owners' transactions - - - - - - - - - -
Management and other expenses 125,405 120,750 802,182 720,424 106,631 149,112 738,803 683,800 434,178 428,482
Total expenses 276,350 262,318 2,311,178 2,093,389 323,512 399,146 3,519,424 3,128,320 1,059,761 961,248
Net profit/(loss) before taxation 13,435 9,813 233,559 179,594 168,826 69,173 476,414 165,310 310,287 228,569
Taxation (7,021) 2,754 64,071 46,915 46,400 19,033 94,565 28,047 86,850 64,104
Net profit/(loss) after taxation 20,456 7,059 169,488 132,679 122,426 50,140 381,849 137,263 223,437 164,465
Other comprehensive income/(expense) - - - - - - - (78,649) - -
Total comprehensive income/(loss) for the year 20,456 7,059 169,488 132,679 122,426 50,140 381,849 58,614 223,437 164,465
Transfer to/(from) retained earnings - - - - (36,654) 82,483 66,727 - - -
Other comprehensive (income)/expense - - - - - - - 78,649 - -
Dividends - - 54,440 - 85,430 133,795 693,000 - 70,920 -
Change in retained earnings 20,456 7,059 115,048 132,679 342 (1,172) (244,424) 137,263 152,517 164,465
Net premium to gross premium (1%) 0% 44% 44% 72% 70% 78% 65% 48% 49%
Claims incurred to earned premium (23%) (7321%) 64% 64% 33% 41% 63% 66% 70% 69%
Management and other expenses to net earned premium
(2115%) (63553%) 51% 51% 28% 38% 22% 25% 51% 58%
Combined ratio (23%) (3172%) 96% 96% 75% 92% 100% 110% 78% 83%
Operating ratio 195% 2107% 90% 92% 57% 84% 86% 94% 71% 77%
Return on equity 12% 6% 21% 19% 32% 14% 31% 9% 37% 36%
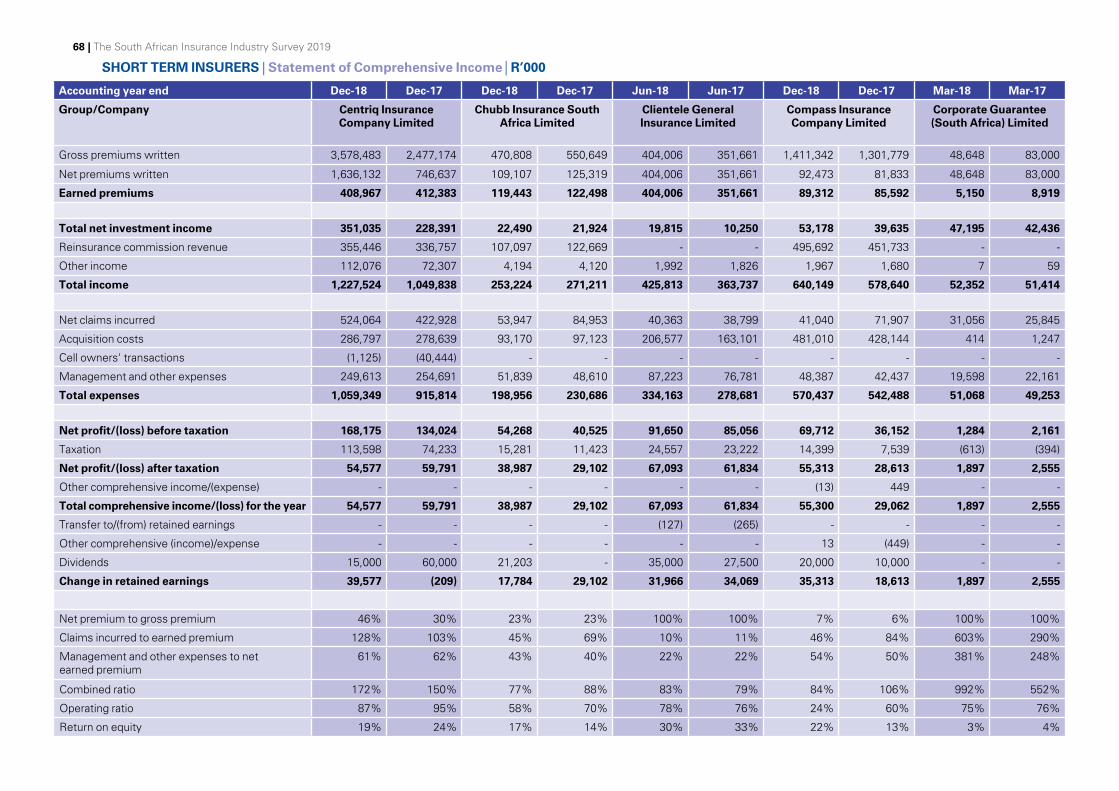
SHORT TERM INSURERS | Statement of Comprehensive Income| R’000
68 | The South African Insurance Industry Survey 2019
Accounting year end Dec-18 Dec-17 Dec-18 Dec-17 Jun-18 Jun-17 Dec-18 Dec-17 Mar-18 Mar-17
Group/Company Centriq Insurance Company Limited
Chubb Insurance South Africa Limited
Clientele General Insurance Limited
Compass Insurance Company Limited
Corporate Guarantee (South Africa) Limited
Gross premiums written 3,578,483 2,477,174 470,808 550,649 404,006 351,661 1,411,342 1,301,779 48,648 83,000
Net premiums written 1,636,132 746,637 109,107 125,319 404,006 351,661 92,473 81,833 48,648 83,000
Earned premiums 408,967 412,383 119,443 122,498 404,006 351,661 89,312 85,592 5,150 8,919
Total net investment income 351,035 228,391 22,490 21,924 19,815 10,250 53,178 39,635 47,195 42,436
Reinsurance commission revenue 355,446 336,757 107,097 122,669 - - 495,692 451,733 - -
Other income 112,076 72,307 4,194 4,120 1,992 1,826 1,967 1,680 7 59
Total income 1,227,524 1,049,838 253,224 271,211 425,813 363,737 640,149 578,640 52,352 51,414
Net claims incurred 524,064 422,928 53,947 84,953 40,363 38,799 41,040 71,907 31,056 25,845
Acquisition costs 286,797 278,639 93,170 97,123 206,577 163,101 481,010 428,144 414 1,247
Cell owners' transactions (1,125) (40,444) - - - - - - - -
Management and other expenses 249,613 254,691 51,839 48,610 87,223 76,781 48,387 42,437 19,598 22,161
Total expenses 1,059,349 915,814 198,956 230,686 334,163 278,681 570,437 542,488 51,068 49,253
Net profit/(loss) before taxation 168,175 134,024 54,268 40,525 91,650 85,056 69,712 36,152 1,284 2,161
Taxation 113,598 74,233 15,281 11,423 24,557 23,222 14,399 7,539 (613) (394)
Net profit/(loss) after taxation 54,577 59,791 38,987 29,102 67,093 61,834 55,313 28,613 1,897 2,555
Other comprehensive income/(expense) - - - - - - (13) 449 - -
Total comprehensive income/(loss) for the year 54,577 59,791 38,987 29,102 67,093 61,834 55,300 29,062 1,897 2,555
Transfer to/(from) retained earnings - - - - (127) (265) - - - -
Other comprehensive (income)/expense - - - - - - 13 (449) - -
Dividends 15,000 60,000 21,203 - 35,000 27,500 20,000 10,000 - -
Change in retained earnings 39,577 (209) 17,784 29,102 31,966 34,069 35,313 18,613 1,897 2,555
Net premium to gross premium 46% 30% 23% 23% 100% 100% 7% 6% 100% 100%
Claims incurred to earned premium 128% 103% 45% 69% 10% 11% 46% 84% 603% 290%
Management and other expenses to net earned premium
61% 62% 43% 40% 22% 22% 54% 50% 381% 248%
Combined ratio 172% 150% 77% 88% 83% 79% 84% 106% 992% 552%
Operating ratio 87% 95% 58% 70% 78% 76% 24% 60% 75% 76%
Return on equity 19% 24% 17% 14% 30% 33% 22% 13% 3% 4%

SHORT TERM INSURERS | Statement of Comprehensive Income| R’000
The South African Insurance Industry Survey 2019 | 69
Accounting year end Jun-18 Jun-17 Jun-18 Jun-17 Mar-18 Mar-17 Dec-18 Dec-17 Jun-18 Jun-17
Group/Company Dial Direct Insurance (RF) Limited
Discovery Insure Limited
Escap SOC Limited The Federated Employers Mutual Assurance
Company (RF) Proprietary Limited
First for Women Insurance Company (RF) Limited
Gross premiums written 899,430 907,119 2,693,053 2,089,224 3,340,874 2,978,536 957,000 986,000 935,796 857,803
Net premiums written 413,090 416,093 2,536,105 1,888,267 2,734,362 2,531,657 934,000 976,000 52,427 24,235
Earned premiums 404,230 403,689 2,521,034 1,875,346 2,834,745 2,641,361 607,000 636,000 45,041 16,106
Total net investment income 36,576 30,248 135,918 110,772 892,034 648,939 5,000 619,000 24,504 19,042
Reinsurance commission revenue 216,222 217,994 3,059 2,370 79,639 33,991 - - 253,957 234,183
Other income 38,510 29,090 32,725 32,046 2,244 3,741 - - 30,322 28,811
Total income 695,538 681,021 2,692,736 2,020,534 3,808,662 3,328,032 612,000 1,255,000 353,824 298,142
Net claims incurred 276,641 287,780 1,515,890 1,210,826 1,677,753 260,945 360,000 385,000 56,016 40,959
Acquisition costs 9,833 9,317 348,294 245,072 - 4,181 - - 19,086 12,590
Cell owners' transactions - - - - - - - - - -
Management and other expenses 275,637 310,315 794,658 610,553 63,083 102,113 324,000 307,000 204,609 147,186
Total expenses 562,111 607,412 2,658,843 2,066,451 1,740,836 367,239 684,000 692,000 279,711 200,735
Net profit/(loss) before taxation 133,427 73,609 33,893 (45,917) 2,067,826 2,960,793 (72,000) 563,000 74,113 97,407
Taxation 37,239 20,594 (234,494) - 570,637 819,377 - - 20,688 27,211
Net profit/(loss) after taxation 96,188 53,015 268,388 (45,917) 1,497,189 2,141,416 (72,000) 563,000 53,425 70,196
Other comprehensive income/(expense) - - - - 4,137 9,600 - - - -
Total comprehensive income/(loss) for the year 96,188 53,015 268,388 (45,917) 1,501,326 2,151,016 (72,000) 563,000 53,425 70,196
Transfer to/(from) retained earnings - - - - - - - - - -
Other comprehensive (income)/expense - - - - (4,137) (9,600) - - - -
Dividends 39,080 - - - - - - - 46,560 -
Change in retained earnings 57,108 53,015 268,388 (45,917) 1,497,189 2,141,416 (72,000) 563,000 6,865 70,196
Net premium to gross premium 46% 46% 94% 90% 82% 85% 98% 99% 6% 3%
Claims incurred to earned premium 68% 71% 60% 65% 59% 10% 59% 61% 124% 254%
Management and other expenses to net earned premium
68% 77% 32% 33% 2% 4% 53% 48% 454% 914%
Combined ratio 86% 96% 105% 110% 59% 13% 113% 109% 57% (208%)
Operating ratio 77% 89% 100% 104% 27% (12%) 112% 11% 3% (326%)
Return on equity 32% 22% 17% (4%) 23% 42% (2%) 18% 29% 39%


SHORT TERM INSURERS | Statement of Comprehensive Income| R’000
The South African Insurance Industry Survey 2019 | 71
Accounting year end Jun-18 Jun-17 Jun-18 Jun-17 Sep-18 Sep-17 Jun-18 Jun-17 Jun-18 Jun-17
Group/Company Guardrisk Insurance Company Limited
The Hollard Insurance Company Limited
Indequity Specialised Insurance Limited
Legal Expenses Insurance Southern Africa Limited
Momentum Short Term Insurance Company
Limited
Gross premiums written 8,200,592 6,949,397 10,259,310 10,475,094 59,148 53,956 812,547 794,391 747,327 629,847
Net premiums written 3,535,970 3,268,209 7,928,872 8,245,096 57,969 52,109 812,547 794,391 737,730 622,875
Earned premiums 3,213,072 2,960,435 7,885,604 8,189,034 57,936 52,121 812,547 794,391 737,351 622,532
Total net investment income 715,739 667,773 678,977 653,201 1,643 1,658 69,901 42,325 41,129 30,185
Reinsurance commission revenue 830,831 493,467 - - - - - - - -
Other income 116,476 120,885 154,132 157,762 290 59 12,096 6,815 - -
Total income 4,876,118 4,242,560 8,718,713 8,999,997 59,869 53,838 894,544 843,531 778,480 652,717
Net claims incurred 891,237 714,833 4,384,083 4,693,830 25,435 24,774 103,739 132,077 485,955 449,115
Acquisition costs 981,979 792,254 894,333 876,289 4,163 3,924 285,238 287,928 83,039 76,436
Cell owners' transactions 423,739 384,341 - - - - - - - -
Management and other expenses 2,407,739 2,226,315 2,791,018 2,644,448 17,465 15,254 351,106 326,035 233,871 194,660
Total expenses 4,704,694 4,117,743 8,069,434 8,214,567 47,063 43,952 740,083 746,040 802,865 720,211
Net profit/(loss) before taxation 171,424 124,817 649,279 785,430 12,806 9,886 154,461 97,491 (24,385) (67,494)
Taxation 50,847 39,078 304,850 139,986 3,549 2,734 29,731 21,516 (60,404) (9,449)
Net profit/(loss) after taxation 120,577 85,739 344,429 645,444 9,257 7,152 124,730 75,975 36,019 (58,045)
Other comprehensive income/(expense) - - - - (1,755) (304) 1,272 (215) - -
Total comprehensive income/(loss) for the year 120,577 85,739 344,429 645,444 7,502 6,848 126,002 75,760 36,019 (58,045)
Transfer to/(from) retained earnings - - - - - - - - - -
Other comprehensive (income)/expense - - - - 1,755 304 (1,272) 215 - -
Dividends - - 595,503 1,158,580 6,326 - 99,960 79,987 - -
Change in retained earnings 120,577 85,739 (251,074) (513,136) 2,931 7,152 24,770 (4,012) 36,019 (58,045)
Net premium to gross premium 43% 47% 77% 79% 98% 97% 100% 100% 99% 99%
Claims incurred to earned premium 28% 24% 56% 57% 44% 48% 13% 17% 66% 72%
Management and other expenses to net earned premium
75% 75% 35% 32% 30% 29% 43% 41% 32% 31%
Combined ratio 107% 109% 102% 100% 81% 84% 91% 94% 109% 116%
Operating ratio 85% 87% 94% 92% 78% 81% 82% 89% 103% 111%
Return on equity 20% 18% 12% 20% 28% 25% 28% 18% 7% (18%)

SHORT TERM INSURERS | Statement of Comprehensive Income| R’000
72 | The South African Insurance Industry Survey 2019
Accounting year end Dec-18 Dec-17 Dec-18 Dec-17 Dec-18 Dec-17 Jun-18 Jun-17 Dec-18 Dec-17
Group/Company Mutual & Federal Risk Financing Limited
Nedgroup Insurance Company Limited
Old Mutual Insure Limited
OUTsurance Insurance Company Limited
Professional Provident Society Short-Term Insurance Company
Limited
Gross premiums written 2,847,136 2,629,062 1,174,687 1,141,961 9,511,000 8,751,000 7,796,100 7,396,117 173,923 141,589
Net premiums written 41,711 99,017 1,065,707 977,673 8,191,000 7,631,000 7,635,022 7,259,781 166,647 135,987
Earned premiums 38,925 53,207 1,068,689 845,965 8,179,000 7,647,000 7,625,991 7,251,285 166,394 135,096
Total net investment income 16,913 16,899 93,878 84,403 10,000 686,000 404,401 398,780 6,389 5,854
Reinsurance commission revenue 457,283 417,771 10,573 19,016 236,000 159,000 6,706 2,458 1,690 1,010
Other income 36,203 46,540 35,374 37,233 - - - - 2,769 6,361
Total income 549,324 534,417 1,208,514 986,617 8,425,000 8,492,000 8,037,098 7,652,523 177,242 148,321
Net claims incurred 1,437 5,017 505,787 589,037 4,941,000 4,925,000 3,579,263 3,566,093 130,906 98,954
Acquisition costs 457,546 418,793 227,554 84,750 1,351,000 1,496,000 31,228 28,544 10,577 8,025
Cell owners' transactions - - - - - - - - - -
Management and other expenses 78,297 82,404 291,416 257,327 1,866,000 1,132,000 1,780,792 1,566,430 72,678 65,833
Total expenses 537,280 506,214 1,024,757 931,114 8,158,000 7,553,000 5,391,283 5,161,067 214,161 172,812
Net profit/(loss) before taxation 12,044 28,203 183,757 55,503 267,000 939,000 2,645,815 2,491,456 (36,919) (24,491)
Taxation 3,840 5,575 46,790 14,805 143,000 157,000 754,884 717,022 (10,246) (6,423)
Net profit/(loss) after taxation 8,204 22,628 136,967 40,698 124,000 782,000 1,890,931 1,774,434 (26,673) (18,068)
Other comprehensive income/(expense) - - - - (4,000) (4,000) 58,777 (6,700) - -
Total comprehensive income/(loss) for the year 8,204 22,628 136,967 40,698 120,000 778,000 1,949,708 1,767,734 (26,673) (18,068)
Transfer to/(from) retained earnings - - - - (4,000) (1,000) - - - -
Other comprehensive (income)/expense - - - - 4,000 4,000 (58,777) 6,700 - -
Dividends - - - - 225,000 1,225,000 1,682,500 1,395,000 - -
Change in retained earnings 8,204 22,628 136,967 40,698 (105,000) (444,000) 208,431 379,434 (26,673) (18,068)
Net premium to gross premium 1% 4% 91% 86% 86% 87% 98% 98% 96% 96%
Claims incurred to earned premium 4% 9% 47% 70% 60% 64% 47% 49% 79% 73%
Management and other expenses to net earned premium
201% 155% 27% 30% 23% 15% 23% 22% 44% 49%
Combined ratio 206% 166% 95% 108% 97% 97% 71% 71% 128% 127%
Operating ratio 162% 134% 86% 98% 97% 88% 65% 66% 124% 123%
Return on equity 4% 11% 17% 6% 3% 18% 48% 48% (21%) (15%)

SHORT TERM INSURERS | Statement of Comprehensive Income| R’000
The South African Insurance Industry Survey 2019 | 73
Accounting year end Jun-18 Jun-17 Jun-18 Jun-17 Mar-18 Mar-17 Dec-18 Dec-17 Mar-18 Mar-17
Group/Company Regent Insurance Company Limited
Renasa Insurance Company Limited
Safire Insurance Company Limited
Santam Limited Sasria SOC Limited
Gross premiums written 1,395,861 1,323,264 1,405,270 1,255,126 380,898 337,613 26,361,000 24,500,000 1,994,199 1,843,402
Net premiums written 1,380,467 1,308,862 143,434 132,931 264,646 223,714 21,041,000 19,692,000 1,845,397 1,698,156
Earned premiums 1,355,752 1,320,185 141,243 132,776 263,588 221,007 21,008,000 19,681,000 1,824,025 1,659,405
Total net investment income 131,423 531,451 6,929 7,168 20,545 18,379 1,293,000 1,569,000 833,654 436,997
Reinsurance commission revenue 1,876 2,102 270,430 231,746 21,264 22,285 1,336,000 1,200,000 61,963 28,453
Other income 34,708 20,616 25,118 21,701 18,836 17,658 64,000 - 1,116 568
Total income 1,523,759 1,874,354 443,720 393,391 324,233 279,329 23,701,000 22,450,000 2,720,758 2,125,423
Net claims incurred 564,101 577,231 112,978 101,366 152,106 125,298 12,629,000 13,008,000 662,891 766,681
Acquisition costs 333,425 303,057 215,156 193,920 72,190 63,771 4,792,000 4,354,000 271,091 236,850
Cell owners' transactions - - - - 2,495 2,821 - - - -
Management and other expenses 269,442 391,048 104,938 94,770 60,042 51,207 3,643,000 3,312,000 419,311 377,534
Total expenses 1,166,968 1,271,336 433,072 390,056 286,833 243,097 21,064,000 20,674,000 1,353,293 1,381,065
Net profit/(loss) before taxation 356,791 603,018 10,648 3,335 37,400 36,232 2,637,000 1,776,000 1,367,465 744,358
Taxation 105,756 52,760 3,096 1,053 10,328 10,106 700,000 302,000 342,260 201,095
Net profit/(loss) after taxation 251,035 550,258 7,552 2,282 27,072 26,126 1,937,000 1,474,000 1,025,205 543,263
Other comprehensive income/(expense) - - 10,166 - 6,908 6,064 - 6,000 - -
Total comprehensive income/(loss) for the year 251,035 550,258 17,718 2,282 33,980 32,190 1,937,000 1,480,000 1,025,205 543,263
Transfer to/(from) retained earnings 225,476 (49,170) - - - - 27,000 3,000 (49,423) (45,536)
Other comprehensive (income)/expense - - - - (6,908) (6,064) - (6,000) - -
Dividends - 647,134 - - 8,026 4,113 1,127,000 1,043,000 162,979 151,236
Change in retained earnings 25,559 (47,706) 17,718 2,282 19,046 22,013 783,000 428,000 812,803 346,491
Net premium to gross premium 99% 99% 10% 11% 69% 66% 80% 80% 93% 92%
Claims incurred to earned premium 42% 44% 80% 76% 58% 57% 60% 66% 36% 46%
Management and other expenses to net earned premium
20% 30% 74% 71% 23% 23% 17% 17% 23% 23%
Combined ratio 86% 96% 115% 119% 100% 99% 94% 99% 71% 82%
Operating ratio 76% 56% 110% 114% 92% 90% 88% 91% 25% 55%
Return on equity 24% 56% 4% 4% 14% 15% 25% 21% 15% 9%

SHORT TERM INSURERS | Statement of Comprehensive Income| R’000
74 | The South African Insurance Industry Survey 2019
Accounting year end Dec-18 Dec-17 Sep-18 Sep-17
Group/Company Standard Insurance Limited
Unitrans Insurance Limited
Gross premiums written 2,659,180 2,473,659 282,353 283,950
Net premiums written 2,553,408 2,314,086 172,705 175,157
Earned premiums 2,514,655 2,291,494 171,597 175,164
Total net investment income 137,786 152,001 34,960 36,190
Reinsurance commission revenue 6,419 13,075 3,031 6,907
Other income - - 4,697 3,005
Total income 2,658,860 2,456,570 214,285 221,266
Net claims incurred 1,223,714 1,193,869 95,632 113,831
Acquisition costs 450,246 386,782 36,370 38,521
Cell owners' transactions - - - -
Management and other expenses 313,660 279,725 12,769 10,959
Total expenses 1,987,620 1,860,376 144,771 163,311
Net profit/(loss) before taxation 671,240 596,194 69,514 57,955
Taxation 174,186 160,533 19,225 15,883
Net profit/(loss) after taxation 497,054 435,661 50,289 42,072
Other comprehensive income/(expense) - - - -
Total comprehensive income/(loss) for the year 497,054 435,661 50,289 42,072
Transfer to/(from) retained earnings - - - -
Other comprehensive (income)/expense - - - -
Dividends 300,000 339,000 - -
Change in retained earnings 197,054 96,661 50,289 42,072
Net premium to gross premium 96% 94% 61% 62%
Claims incurred to earned premium 49% 52% 56% 65%
Management and other expenses to net earned premium
12% 12% 7% 6%
Combined ratio 79% 81% 83% 89%
Operating ratio 73% 74% 62% 69%
Return on equity 31% 30% 12% 11%


76 | The South African Insurance Industry Survey 2019
Murray RaisbeckPartner Insurance Tel: +27 66 479 3187 Email: [email protected]
The South African Insurance Industry Survey 2019 | 77
Long-term insurance industry resultsBeing the executive of one of South Africa’s l ife insurance groups last year must surely have felt l ike pushing water uphil l .
The sector has been pushing against an extremely volatile, uncertain, complex and ambiguous political and economic environment in South Africa and globally. South African real GDP growth was low at less than 1% and equity markets declined with the JSE SWIX down 14% year on year. High unemployment rates, VAT hikes and fuel price rises made 2018 very tough for consumers and businesses. Added to that, the sector has also transitioned to a new twin peaks regulatory regime and adopted far reaching accounting change with the implementation of IFRS 9 and 15.
The impact of the challenging political and macro-economic environment is very evident in the results:
• Customers’ disposable income is under pressure and therefore has reduced their ability and propensity to save and invest. New business margins (VNB margin) have fallen at MMI (0.6% fall), Old Mutual (0.3% fall) and Sanlam (0.3% fall). Liberty has had a big focus on product and margin enhancement, and has managed to improve VNB margin by 0.4%. Discovery has registered a modest improvement in Life new business margins (0.2%) with a focus on pricing.
Where margin improvements have been made they have been hard earned.
• The pressure and stress on customers’ lives has been apparent in some of the trends in claims experience. In the first half of their financial year Discovery experienced higher than expected claims experience, mainly due to suicides in the 4th quarter of 2017 (which represented 16% of claims versus 7% in the prior year). Discovery’s claims experienced normalised in the second half of the year, which meant the full year was in line with expected claims. However, pressure returned in the first half of the 2019 year-end with a spike in large mortality claims. Overall claims experience was positive for Old Mutual, however, a higher number of disability claims meant that claims experience was R300m worse than expected in the Personal Finance segment. Similar to Discovery, Old Mutual Personal Finance saw claims levels normalise in the second half of the year. Although Sanlam had positive claims experience across most lines of business, the Corporate segment was not immune from industry wide volatility in mortality claims. Liberty also experienced an increase in mortality and morbidity in the SA Retail segment, as well as an increase in death claims in Corporate.
Value of new business
Discovery – total profit from new business at point of sale R2.826bn (R2.437bn)
Liberty – VNB R371m (2017: R233m)
MMI –VNB R301m (2017: R547m)
OM – VNB R2.17bn (2017: R2.28bn)
Sanlam – VN covered B R2.187bn (2017: R2.008bn)
VNB margin
Discovery Life – 5.4% (2017: 5.2%)
Liberty –New business margin 0.9% (2017: 0.5%)
MMI – 0.7% (2017: 1.3%)
OM – 3.2% (2017: 3.5%)
Sanlam – 2.8% (2017: 3.07%)
Life APE
Discovery – New Business API R16.14bn (2017: R14.66bn)
Liberty – insurance indexed new business – R8.051bn (2017: R8.018bn)
MMI – R5.840bn (2017: R5.733bn)
OM – Life APE sales R12.3bn (2017: R11.5bn)
Sanlam New Business Volumes – R223bn (2017: R221bn)

78 | The South African Insurance Industry Survey 2019
• Investment returns and fund related fees took a huge knock during 2018 as the JSE all-share index lost 11.37% in 2018 . This is where the impact of the macro-economic conditions has most impacted results across the sector. This was particularly the case for the Groups that had a 31 December 2018 year end. Old Mutual’s investment return was down by over R2bn compared to the prior year, and about R1.5bn down on normalised investment returns. Liberty’s Group Equity Value earnings were R1.5bn; which would have been c.R3bn without negative investment returns. And Sanlam had many notable successes this year (such as record experience profits) which were largely neutralised due to the negative investment return impact of over 5% on Return on Group Equity Value.
• Retail / Personal Finance related segments appear to have been more negatively impacted by these conditions than other segments across the Groups. Sanlam’s net return from Personal Finance was 5% down on the prior year; Old Mutual’s Results from Operations was down 32% on the prior year despite relatively positive and stable experience variances. Liberty bucked the trend slightly with a 31% improvement in SA Retail normalised earnings off the back of what was a very challenging previous year for them.
• Corporate segments have been more resilient than Retail. This has been seen at Old Mutual with 8% growth in Results From Operations, MMI with 2% growth in core headline earnings, and Sanlam with 4% growth in Net Result from Financial services from their respective Corporate segments. However, those were very hard earned returns.
The sector has not stood still against those pressures though. In order to maintain some uphill momentum we have seen:
• Intense levels of corporate activity with: Sanlam completing the acquisition of Saham Finances (R13bn) and initiating a BBBEE transaction valued at more than R10bn; Old Mutual successfully completing its Managed Separation with the listing of Old Mutual Limited and unbundling of the majority stake in Nedbank; Discovery’s continued build, structuring and launch of Discovery Bank; Liberty concluding the sale of its short term insurance technology platform in early 2019, and restructuring Liberty Two Degrees and converting it into a corporate REIT; and MMI updating its operating structure as part of its Reset and Grow strategy.
• Operating model transformation is evident across all of the major groups. Liberty has re-designed to reconnect the value chains in the business. MMI had a clearly stated objective of fixing the basics and addressing the cost base to drive improved growth, margins, and efficiency. Sanlam are maintaining their decentralised operating model by maintaining five autonomous clusters; however, they have a big focus of effectively incorporating Saham into the operating model and extracting the synergies from the acquisition over the next year. Most of the eight battlegrounds that Old Mutual have focussed their strategy on have an element of transformation embedded in them, with winning the war for talent, technology refresh, and cost efficiency being the main operating model areas for focus. Discovery is a bit of an exception to this, with relative stability in its business model and operating model strategy across its diversified portfolio of businesses.
EV - Non-economic experience
OM – R312m (2017: (R59m)
Sanlam – R2.114bn (2017: R1.558bn) – GEV operating experience variances
Liberty – R423m (2017: R330m) – EV operating experience variances
MMI – (R126m) (2017: R18m)
Discovery – R678m (R411m)
EV - Assumption and modelling changes
OM – R140m (2017: R542m)
Sanlam – R338m (2017: (R407m))
Liberty – R84m (2017: (R221m))
MMI – (R975m) (2017: R403m)
Discovery – R787m (2017: R858m)
EV - Economic experience
OM – R2.036bn (2017: 2.603bn)
Sanlam – (R2.965bn) (2017: R762bn)
Liberty – (R1.056bn) (2017: (R0.571bn))
MMI – R640m (2017: (2017: (R902m))
Discovery – (R373m) (2017: (R345m))
Embedded Value:
OM – R66.4bn (2017: R63.6bn)
Sanlam – R56.2bn (2017: R54.3bn)
Discovery – R65.624bn (2017: 57.294bn)
Liberty – normalised equity value R38.684bn (2017: R39.368bn)
MMI – R39.6bn (2017: R45.2bn)
Return on EV:
OM – 12.6% (2017: 14.1%)
Sanlam – (RoGEV on covered business) – 11% (2017: 18.8%)
Discovery – 16.9% (2017: 10.2%)
Liberty – normalised return on Group Equity Value – 3.8% (2017: 1.1%)
MMI – (1.1%) (2017: 4.7%)

The South African Insurance Industry Survey 2019 | 79
• South African life assurance remains a large proportion of each of these Group’s business, but with profits from legacy life assurance books of business running off, there is a large focus on replacing that with profitable new sources of earnings. Therefore we continue to see capital being allocated to diversifying sources of earnings. In addition, we are seeing a number of other growth initiatives across the sector. Some of the notable examples include:
– Sanlam’s overall strategy of investing returns generated by the mature South African business which contributes 72% of the Net Result from Financial Services into other high growth markets through partnerships;
– Discovery looking to continue to scale their Shared Value Insurance Model with the launch of Discovery for Business, entering into multiple new insurance partnerships and continuing to explore new adjacent markets. The funding of new initiatives has resulted in increased finance costs;
– Old Mutual’s "defense, growth and turnaround" in its key markets, for example, its Mass and Foundation Cluster continuing to expand its distribution network by opening 25 new branches in the year, as well as growth in its loan book; and
– Liberty perusing a number of growth initiatives with a notable focus on leveraging further opportunities with the Standard Bank Group across Africa.
• It comes as no surprise that right across the sector we are seeing strategies including:
– Increased customer centricity
– Technology transformation
– Capital optimisation post SAM implementation; and pre IFRS 17 adoption in 2022
– Improving BBBEE effectiveness
– Recruiting, developing and retaining the best talent
Competition is heating up:
Despite the challenges that the incumbent life assurance groups are facing it is still an attractive market for new entrants. FNB Life is one of the fastest growing life insurers in South Africa; Capitec (backed by Sanlam) sold over 500,000 funeral plans in its first nine months; and African Rainbow Life (also Sanlam backed) has recently launched as a new entrant with propositions for the lower to middle income market. The new entrants reflect the fact that the market remains under-protected, that the current propositions require enhancing (evident by high lapse rates across the sector), and that the cost of servicing clients is too high. The new entrants believe they can address those issues faster than the incumbents, or by partnering with the incumbents to help them increase their speed of execution.
There is a large amount of surplus capital in the five largest life assurance Groups.
It will be interesting to see how much of that is utilised in defending, growing, innovating and diversifying their current positions to counter the competition.
Other selected KPI’s:
Non-IFRS operating profit metrics:
Discovery – normalised profit from operations R8.266bn (2017: 7.048bn) – up 17% Liberty – normalised operating earnings R2.0bn (2017: R1.4bn) – up 42% MMI – diluted core headline earnings R2.809m (2017: R3.208m) – down 12% Old Mutual – results from operations R9.963bn (R10.367bn) – down 4% Sanlam – net result from financial services R8.890bn (2017: R8.549bn) – up 4%
IFRS profit before tax from continuing operations:
Discovery – R7.412bn (2017: R5.772bn) Liberty – R4.297bn (2017: R6,568bn) MMI – R4.461bn (2017: R4.518bn) OM – R8.5bn (2017: R7.1bn) Sanlam – R17.0bn (2017: 16.3bn)
Headline earnings
Discovery – R5.803bn (R4.404bn) Liberty – R2.645bn (2017: R3.252bn)MMI - R1.444bn (2017: R1.846bn) OM – R14.241bn (2017: R13.44bn)Sanlam – R9.162bn (2017: 9.757bn)
Adjusted / normalised / core headline earnings
Discovery – R5.401bn (2017: R4,656bn) Liberty – R2.256bn (2017: R2.719bn) MMI – R2.809bn (2017: R3.208bn) OM – R11.512bn (2017: 12.947bn) Sanlam – R9.056bn (2017: R9.835m)
Group Solvency:
Discovery Life – 1.7 times covered (no range provided)
Liberty – 1.87 times covered (upper end of target range)
MMI – 2.6 times covered (upper end of target range)
OM – 170% (2017: 161%) (target of 155% to 175%)
Sanlam – 215% (2017: 218%) (in line with target range of 170% to 210%)

LONG TERM INSURERS | Statement of Financial Position | R’000
80 | The South African Insurance Industry Survey 2019
Accounting year end Jun-18 Jun-17 Dec-18 Dec-17 Nov-18 Nov-17 Jun-18 Jun-17 Mar-18 Mar-17
Group/Company 1Life (RF) Insurance Limited
Absa Life Limited AIG Life South Africa Limited
AVBOB Mutual Assurance Society
Alexander Forbes Life Limited
FSB classification Traditional Traditional Traditional Traditional Traditional
Share capital and premium 398,000 398,000 24,000 24,000 10,000 10,000 - - 360,000 10,000
Retained earnings/(deficit) 976,331 812,213 1,585,993 1,377,069 252,174 228,526 6,183,372 6,180,916 401,541 456,487
Other reserves - - 4,306 6,070 - - - - - -
Non-controlling interests - - - - - - - - - -
Total shareholders' funds 1,374,331 1,210,213 1,614,299 1,407,139 262,174 238,526 6,183,372 6,180,916 761,541 466,487
Policyholder liabilities under insurance and reinsurance contracts and contracts with DPF's
237,723 292,632 1,593,171 1,794,747 60,829 66,637 9,772,427 7,739,794 567,125 436,518
Policyholder liabilities under investment contracts 317,485 489 27,362,753 27,941,155 - - - - 82,242,260 76,009,838
Preference share liability - - - - - - - - - -
Linked liability - - - - - - - - - -
Reinsurance contract liability 160,444 158,080 - 489 - - - - - -
Cell owners' interest - - 114,710 89,891 - - - - - -
Current tax payable 8,777 3,886 - - - - 4,708 3,491 19,750 15,962
Deferred tax liability/(asset) 342,202 312,136 90,790 91,564 - - 208,989 253,092 - -
Other liabilities 108,640 121,952 322,555 584,954 50,055 64,830 810,267 687,725 2,219,060 1,818,476
Total liabilities 1,175,271 889,175 29,483,979 30,502,800 110,884 131,467 10,796,391 8,684,102 85,048,195 78,280,794
Total investments 798,171 411,027 30,345,999 30,866,262 241,041 223,341 14,776,967 11,642,047 82,731,816 76,138,667
Assets arising from insurance contracts 1,424,570 1,314,121 - - - - - - 17,635 37,205
PPE; goodwill and intangible assets - - 27,141 60,769 - - 185,704 188,807 8,089 10,280
Reinsurers' share of policyholder liabilities 144,974 186,642 32,394 - - - 14,958 13,436 469,170 380,672
Deferred acquisition costs - - - 295,305 - - - - - -
Cash and cash equivalents 72,377 77,372 194,738 187,740 48,338 81,293 1,482,553 2,487,607 2,257,573 1,988,404
Other assets 109,510 110,226 322,122 270,057 43,102 53,998 473,972 443,023 325,131 191,730
Income/Deferred tax asset - - 175,884 229,806 40,577 11,361 45,609 90,098 322 323
Deposits held with cell option - - - - - - - - - -
Total assets 2,549,602 2,099,388 31,098,278 31,909,939 373,058 369,993 16,979,763 14,865,018 85,809,736 78,747,281
Total assets/Total liabilities 217% 236% 105% 105% 336% 281% 157% 171% 101% 101%
Increase in shareholders' funds 14% 15% 10% 0% 63%

LONG TERM INSURERS | Statement of Financial Position | R’000
The South African Insurance Industry Survey 2019 | 81
Accounting year end Jun-18 Jun-17 Dec-18 Dec-17 Dec-18 Dec-17 Jun-18 Jun-17 Jun-18 Jun-17
Group/Company Bidvest Life Limited Bryte Life Company Limited
Centriq Life Insurance Company Limited
Clientele Life Limited Guardrisk Life Limited
FSB classification Traditional Traditional Cell captive Traditional Cell captive
Share capital and premium 65,027 65,027 17,500 17,500 15,000 15,000 4,853 4,853 70,000 70,000
Retained earnings/(deficit) 78,251 92,098 4,635 827 15,366 8,219 781,972 706,285 133,037 109,272
Other reserves 12,407 9,199 - - - - 18,891 17,663 - -
Non-controlling interests - - - - - - - - - -
Total shareholders' funds 155,685 166,324 22,135 18,327 30,366 23,219 805,716 728,801 203,037 179,272
Policyholder liabilities under insurance and reinsurance contracts and contracts with DPF's
11,213 17,655 84,957 18,088 72,946 103,427 620,674 643,232 2,656,220 2,227,299
Policyholder liabilities under investment contracts 10,545 295,749 - - 1,898 1,898 2,464,295 1,159,676 117,017 578,318
Preference share liability - - 10,000 - - - - - - -
Linked liability - - - - - - - - - -
Reinsurance contract liability 38,465 1,382 - - 190,771 173,783 - - 1,058,954 904,329
Cell owners' interest - - - - 258,658 169,011 - - 2,924,745 3,026,360
Current tax payable - - 1,536 1,184 454 - 7,877 2,032 49,428 100,276
Deferred tax liability/(asset) - 1,717 - - 2 29 17,499 13,588 - -
Other liabilities 22,454 20,417 8,336 873 62,031 26,671 278,936 263,596 268,964 173,747
Total liabilities 82,677 336,920 104,829 20,145 586,760 474,819 3,389,281 2,082,124 7,075,328 7,010,329
Total investments 108,829 419,712 - - 285,722 213,224 3,514,373 2,310,708 4,576,001 4,724,055
Assets arising from insurance contracts 57,058 - - - - - - - 1,109,162 1,052,608
PPE; goodwill and intangible assets 13,504 7,665 - - - - 56,010 57,627 109 557
Reinsurers' share of policyholder liabilities 14,058 2,061 21,535 - 24,364 33,062 2,925 2,504 562,559 599,748
Deferred acquisition costs - - - - - - - - - -
Cash and cash equivalents 25,223 38,283 73,520 30,641 40,942 2,721 296,567 115,150 635,998 479,974
Other assets 13,886 29,478 31,909 7,831 75,327 75,169 296,410 298,181 380,827 328,307
Income/Deferred tax asset 5,806 6,044 - - - 79 28,712 26,755 13,709 4,352
Deposits held with cell option - - - - 190,771 173,783 - - - -
Total assets 238,364 503,243 126,964 38,472 617,126 498,038 4,194,997 2,810,925 7,278,365 7,189,601
Total assets/Total liabilities 288% 149% 121% 191% 105% 105% 124% 135% 103% 103%
Increase in shareholders' funds (6%) 21% 31% 11% 13%

LONG TERM INSURERS | Statement of Financial Position | R’000
82 | The South African Insurance Industry Survey 2019
Accounting year end Jun-18 Jun-17 Dec-18 Dec-17 Jun-18 Jun-17 Jun-18 Jun-17 Dec-18 Dec-17
Group/Company Hollard Life Assurance Company Limited
Liberty Group Limited Momentum Ability Limited
MMI Group Limited Nedgroup Life Assurance Company Limited
FSB classification Traditional Traditional Traditional Traditional Traditional
Share capital and premium 20,000 20,000 58,000 29,000 10,000 10,000 1,041,000 1,041,000 55,000 55,000
Retained earnings/(deficit) 1,477,874 1,458,587 18,380,000 17,984,000 11,952 13,467 7,180,000 8,512,000 1,056,460 1,086,937
Other reserves - - 582,000 399,000 - - 5,936,000 7,447,000 - -
Non-controlling interests - - 7,915,000 - - - - - - -
Total shareholders' funds 1,497,874 1,478,587 26,935,000 18,412,000 21,952 23,467 14,157,000 17,000,000 1,111,460 1,141,937
Policyholder liabilities under insurance and reinsurance contracts and contracts with DPF's
1,799,845 2,396,159 208,366,000 219,896,000 15,642 76,067 120,761,000 119,363,000 2,404,521 2,801,785
Policyholder liabilities under investment contracts 8,802,864 5,783,194 98,985,000 99,783,000 1,339,134 1,416,187 235,777,000 221,463,000 8,490,058 7,665,606
Preference share liability - - - - - - - - - -
Linked liability - - - - - - - - - -
Reinsurance contract liability 261,377 342,808 283,000 663,000 600,604 496,967 - - - -
Cell owners' interest - - - - 22,953 15,768 - - - -
Current tax payable - - 337,000 898,000 - 676 78,000 - 12,412 35,930
Deferred tax liability/(asset) 608,390 529,139 2,503,000 2,953,000 - 345 901,000 994,000 4,697 4,502
Other liabilities 1,389,336 1,038,731 45,432,000 37,273,000 8,534 2,907 20,445,000 22,402,000 168,025 147,259
Total liabilities 12,861,812 10,090,031 355,906,000 361,466,000 1,986,867 2,008,917 377,962,000 364,222,000 11,079,713 10,655,082
Total investments 11,081,276 8,961,459 324,070,000 331,393,000 1,056,077 1,080,824 364,073,000 350,100,000 11,648,710 11,343,425
Assets arising from insurance contracts - - 6,708,000 7,484,000 586,490 485,994 - - - -
PPE; goodwill and intangible assets 180,097 104,177 37,015,000 22,762,000 - - 4,448,000 4,790,000 389 2,444
Reinsurers' share of policyholder liabilities 190,574 375,374 1,642,000 1,408,000 196,342 254,824 1,872,000 1,714,000 166,482 134,269
Deferred acquisition costs - - 758,000 730,000 - - - - - -
Cash and cash equivalents 2,030,823 1,223,768 7,646,000 9,729,000 154,503 198,195 12,478,000 14,054,000 134,289 90,538
Other assets 800,957 854,379 4,965,000 6,372,000 11,857 12,547 9,248,000 10,266,000 241,303 226,343
Income/Deferred tax asset 75,959 49,461 37,000 - 3,550 - - 298,000 - -
Deposits held with cell option - - - - - - - - - -
Total assets 14,359,686 11,568,618 382,841,000 379,878,000 2,008,819 2,032,384 392,119,000 381,222,000 12,191,173 11,797,019
Total assets/Total liabilities 112% 115% 108% 105% 101% 101% 104% 105% 110% 111%
Increase in shareholders' funds 1% 46% (6%) (17%) (3%)

LONG TERM INSURERS | Statement of Financial Position | R’000
The South African Insurance Industry Survey 2019 | 83
Accounting year end Dec-18 Dec-17 Dec-18 Dec-17 Dec-18 Dec-17 Jun-18 Jun-17 Dec-18 Dec-17
Group/Company Nedgroup Structured Life Limited
Old Mutual Alternative Risk Transfer Limited
Old Mutual Life Assurance Company (South Africa)
Limited
OUTsurance Life Insurance Company
Limited
Professional Provident Society Insurance Company Limited
FSB classification Traditional Cell captive Traditional Traditional Traditional
Share capital and premium 26,351 26,351 12,425 12,425 6,423,000 6,423,000 435,002 435,002 10,000 10,000
Retained earnings/(deficit) 53,764 48,254 38,386 29,465 49,958,000 44,496,000 210,676 203,635 424,287 367,572
Other reserves - - 52 475 - - 13,196 (613) - -
Non-controlling interests - - - - - - - - - -
Total shareholders' funds 80,115 74,605 50,863 42,365 56,381,000 50,919,000 658,874 638,024 434,287 377,572
Policyholder liabilities under insurance and reinsurance contracts and contracts with DPF's
- - 1,152,269 1,069,328 300,083,000 313,764,000 347,157 233,022 29,674,516 30,038,652
Policyholder liabilities under investment contracts 11,544,749 10,468,009 2,828,874 2,332,841 261,250,000 255,470,000 - - 2,058,982 1,881,570
Preference share liability - - - - - - - - - -
Linked liability - - - - - - - - - -
Reinsurance contract liability - - - - - - - - - -
Cell owners' interest - - 251,147 203,788 - - - - - -
Current tax payable 1,540 649 - - 706,000 1,169,000 - 5,296 - -
Deferred tax liability/(asset) - - - - 1,545,000 5,511,000 43,885 42,842 57,384 373,349
Other liabilities 1,207 606 206,532 150,646 36,949,000 37,711,000 40,929 35,806 411,984 366,040
Total liabilities 11,547,496 10,469,264 4,438,822 3,756,603 600,533,000 613,625,000 431,971 316,966 32,202,866 32,659,611
Total investments 11,599,278 10,518,732 3,556,159 2,949,140 629,648,000 627,433,000 905,267 784,463 30,735,318 30,914,879
Assets arising from insurance contracts - - - - - - - - - -
PPE; goodwill and intangible assets - - - - 6,239,000 3,882,000 - - 429,650 350,566
Reinsurers' share of policyholder liabilities - - 497,873 417,600 524,000 300,000 86,403 97,995 73,885 93,308
Deferred acquisition costs - - - - 1,235,000 1,202,000 - - - -
Cash and cash equivalents 13,304 8,968 259,970 280,155 6,216,000 12,381,000 57,284 38,262 833,318 1,230,228
Other assets 15,029 16,169 174,859 147,232 12,994,000 19,325,000 19,489 13,052 439,301 395,485
Income/Deferred tax asset - - 824 4,841 58,000 21,000 22,402 21,218 125,681 52,717
Deposits held with cell option - - - - - - - - - -
Total assets 11,627,611 10,543,869 4,489,685 3,798,968 656,914,000 664,544,000 1,090,845 954,990 32,637,153 33,037,183
Total assets/Total liabilities 101% 101% 101% 101% 109% 108% 253% 301% 101% 101%
Increase in shareholders' funds 7% 20% 11% 3% 15%

LONG TERM INSURERS | Statement of Financial Position | R’000
84 | The South African Insurance Industry Survey 2019
Accounting year end Jun-18 Jun-17 Dec-18 Dec-17
Group/Company Regent Life Assurance Company Limited
Sanlam Limited
FSB classification Traditional Traditional
Share capital and premium 94,688 144,688 5,657,000 22,000
Retained earnings/(deficit) 502,047 439,133 57,288,000 52,125,000
Other reserves - 21 6,561,000 5,273,000
Non-controlling interests 120,745 147,047 12,111,000 6,017,000
Total shareholders' funds 717,480 730,889 81,617,000 63,437,000
Policyholder liabilities under insurance and reinsurance contracts and contracts with DPF's
47,191 33,914 226,398,000 197,536,000
Policyholder liabilities under investment contracts 212,996 250,627 355,337,000 345,573,000
Preference share liability - - - -
Linked liability - - - -
Reinsurance contract liability - - - -
Cell owners' interest - - 3,305,000 3,217,000
Current tax payable - 2,103 3,085,000 1,603,000
Deferred tax liability/(asset) 159,407 146,328 5,460,000 2,435,000
Other liabilities 201,067 202,415 140,399,000 119,782,000
Total liabilities 620,661 635,387 733,984,000 670,146,000
Total investments 872,596 778,460 700,729,000 657,950,000
Assets arising from insurance contracts - - 9,540,000 6,400,000
PPE; goodwill and intangible assets 16,023 21,520 24,664,000 6,514,000
Reinsurers' share of policyholder liabilities 138,732 133,348 1,971,000 1,063,000
Deferred acquisition costs - - 3,446,000 3,659,000
Cash and cash equivalents 230,014 379,532 28,151,000 21,960,000
Other assets 54,695 53,416 44,851,000 33,954,000
Income/Deferred tax asset 26,081 - 2,249,000 2,083,000
Deposits held with cell option - - - -
Total assets 1,338,141 1,366,276 815,601,000 733,583,000
Total assets/Total liabilities 216% 215% 111% 109%
Increase in shareholders' funds (2%) 29%

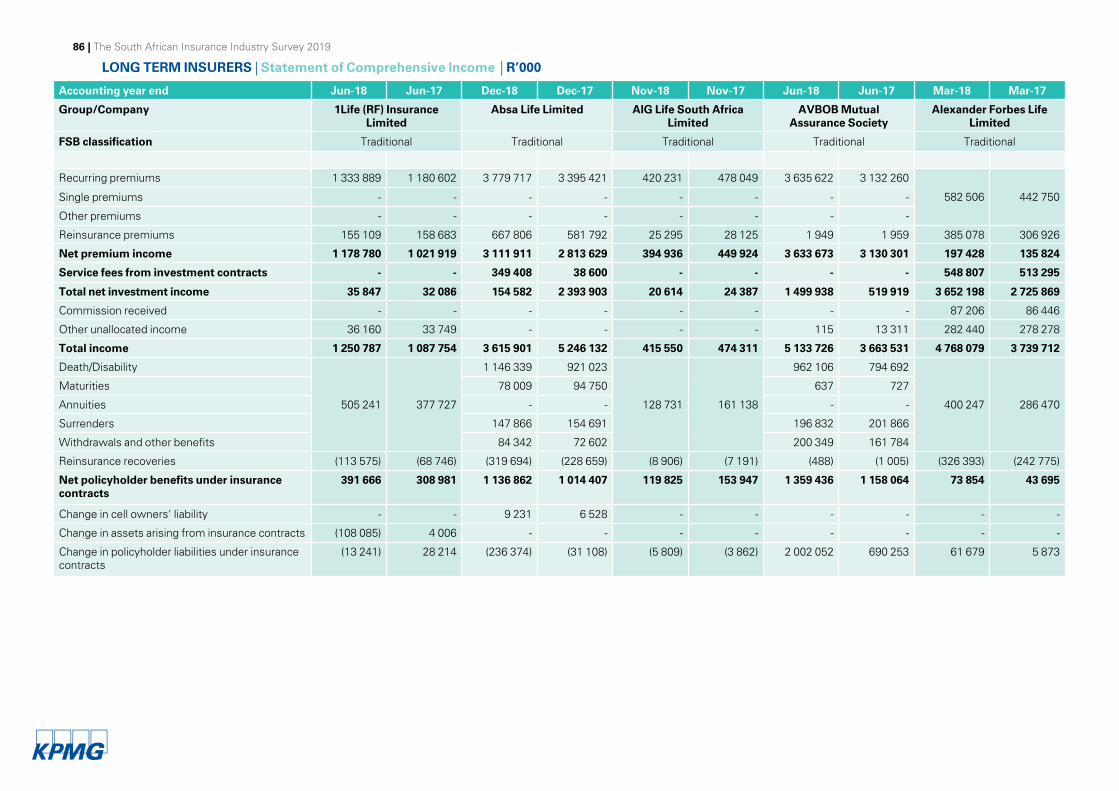
LONG TERM INSURERS | Statement of Comprehensive Income | R’000
86 | The South African Insurance Industry Survey 2019
Accounting year end Jun-18 Jun-17 Dec-18 Dec-17 Nov-18 Nov-17 Jun-18 Jun-17 Mar-18 Mar-17
Group/Company 1Life (RF) Insurance Limited
Absa Life Limited AIG Life South Africa Limited
AVBOB Mutual Assurance Society
Alexander Forbes Life Limited
FSB classification Traditional Traditional Traditional Traditional Traditional
Recurring premiums 1 333 889 1 180 602 3 779 717 3 395 421 420 231 478 049 3 635 622 3 132 260
582 506 442 750 Single premiums - - - - - - - -
Other premiums - - - - - - - -
Reinsurance premiums 155 109 158 683 667 806 581 792 25 295 28 125 1 949 1 959 385 078 306 926
Net premium income 1 178 780 1 021 919 3 111 911 2 813 629 394 936 449 924 3 633 673 3 130 301 197 428 135 824
Service fees from investment contracts - - 349 408 38 600 - - - - 548 807 513 295
Total net investment income 35 847 32 086 154 582 2 393 903 20 614 24 387 1 499 938 519 919 3 652 198 2 725 869
Commission received - - - - - - - - 87 206 86 446
Other unallocated income 36 160 33 749 - - - - 115 13 311 282 440 278 278
Total income 1 250 787 1 087 754 3 615 901 5 246 132 415 550 474 311 5 133 726 3 663 531 4 768 079 3 739 712
Death/Disability
505 241 377 727
1 146 339 921 023
128 731 161 138
962 106 794 692
400 247 286 470
Maturities 78 009 94 750 637 727
Annuities - - - -
Surrenders 147 866 154 691 196 832 201 866
Withdrawals and other benefits 84 342 72 602 200 349 161 784
Reinsurance recoveries (113 575) (68 746) (319 694) (228 659) (8 906) (7 191) (488) (1 005) (326 393) (242 775)
Net policyholder benefits under insurance contracts
391 666 308 981 1 136 862 1 014 407 119 825 153 947 1 359 436 1 158 064 73 854 43 695
Change in cell owners' liability - - 9 231 6 528 - - - - - -
Change in assets arising from insurance contracts (108 085) 4 006 - - - - - - - -
Change in policyholder liabilities under insurance contracts
(13 241) 28 214 (236 374) (31 108) (5 809) (3 862) 2 002 052 690 253 61 679 5 873

LONG TERM INSURERS | Statement of Comprehensive Income | R’000
The South African Insurance Industry Survey 2019 | 87
Accounting year end Jun-18 Jun-17 Dec-18 Dec-17 Dec-18 Dec-17 Jun-18 Jun-17 Jun-18 Jun-17
Group/Company Bidvest Life Limited Bryte Life Company Limited
Centriq Life Insurance Company Limited
Clientele Life Limited Guardrisk Life Limited
FSB classification Traditional Traditional Cell captive Traditional Cell captive
Recurring premiums 78 388 50 816 176 847 28 240
520 225 321 745 1 791 811 1 648 789
6 208 565 5 001 190
Single premiums - - - - 581 888 294 728
Other premiums - - - - - -
Reinsurance premiums 24 308 9 901 29 455 64 513 841 313 535 120 349 128 888 5 002 385 3 748 360
Net premium income 54 080 40 915 147 392 28 176 6 384 8 210 1 671 462 1 519 901 1 788 068 1 547 558
Service fees from investment contracts - - - - - - 12 418 11 219 - -
Total net investment income 16 819 5 624 3 360 1 366 21 566 17 528 300 583 184 392 392 094 400 283
Commission received 51 495 10 716 - - 26 979 17 527 - - 18 390 26 039
Other unallocated income 2 719 636 4 800 - 13 787 8 932 150 937 140 388 - -
Total income 125 113 57 891 155 552 29 542 68 716 52 197 2 135 400 1 855 900 2 198 552 1 973 880
Death/Disability
24 632 9 391 86 724 2 600 115 089 136 947
202 713 184 076
1 902 260 1 422 834
Maturities - -
Annuities - -
Surrenders 191 673 180 042
Withdrawals and other benefits 51 892 55 249
Reinsurance recoveries (8 714) (939) (13 024) - (112 624) (130 034) (101 705) (100 675) (1 883 964) (1 322 691)
Net policyholder benefits under insurance contracts
15 918 8 452 73 700 2 600 2 465 6 913 344 573 318 692 18 296 100 143
Change in cell owners' liability - - - - 16 059 14 267 - - 339 931 356 755
Change in assets arising from insurance contracts - - - - - - (421) 285 (56 554) (318 227)
Change in policyholder liabilities under insurance contracts
(36 929) (9 155) 45 334 17 090 - - (22 558) (36 130) 45 045 293 938

LONG TERM INSURERS | Statement of Comprehensive Income | R’000
88 | The South African Insurance Industry Survey 2019
Accounting year end Jun-18 Jun-17 Dec-18 Dec-17 Jun-18 Jun-17 Jun-18 Jun-17 Dec-18 Dec-17
Group/Company Hollard Life Assurance Company Limited
Liberty Group Limited Momentum Ability Limited
MMI Group Limited Nedgroup Life Assurance Company Limited
FSB classification Traditional Traditional Traditional Traditional Traditional
Recurring premiums 6 354 440 5 733 995
37 494 000 36 973 000
326 552 747 796
21 355 000 21 052 000 2 006 296 1 912 960 Single premiums - 611 3 320 3 011
Other premiums 143 395 125 345 - -
Reinsurance premiums 1 507 077 1 344 416 1 411 000 1 252 000 154 861 622 280 2 269 000 2 831 000 88 449 77 569
Net premium income 4 990 758 4 515 535 36 083 000 35 721 000 175 011 128 527 19 086 000 18 221 000 1 917 847 1 835 391
Service fees from investment contracts - - 1 417 000 1 436 000 2 484 5 391 2 254 000 2 350 000 - -
Total net investment income 497 420 611 088 3 040 000 32 185 000 20 402 60 774 31 591 000 15 453 000 533 921 668 148
Commission received - - - - - - - - - -
Other unallocated income 460 450 67 322 448 000 399 000 39 - 533 000 490 000 27 184 28 949
Total income 5 948 628 5 193 945 40 988 000 69 741 000 197 936 194 692 53 464 000 36 514 000 2 478 952 2 532 488
Death/Disability 2 670 830 2 285 756
37 407 000 36 878 000
55 362 200 717 8 597 000 8 396 000 568 555 681 459
Maturities 870 616 2 100 194 - - 4 422 000 4 420 000 449 534 628 806
Annuities 45 535 72 587 4 980 4 037 3 829 000 3 668 000 73 433 90 065
Surrenders 42 827 94 111 37 - 2 941 000 2 770 000 68 034 63 983
Withdrawals and other benefits 72 039 53 560 - - 3 876 000 2 012 000 - -
Reinsurance recoveries (992 854) (983 815) (1 211 000) (1 462 000) (60 307) (204 610) (1 927 000) (2 123 000) (61 450) (100 019)
Net policyholder benefits under insurance contracts
2 708 993 3 622 393 36 196 000 35 416 000 72 144 21 738 000 19 143 000 1 098 106 1 364 294
Change in cell owners' liability - - - - - - - - - -
Change in assets arising from insurance contracts - - 776 000 (170 000) (42 014) (241 713) - - - -
Change in policyholder liabilities under insurance contracts
(665 231) (2 300 634) (12 135 000) (6 957 000) 68 924 206 767 1 240 000 (1 946 000) (463 112) (730 037)
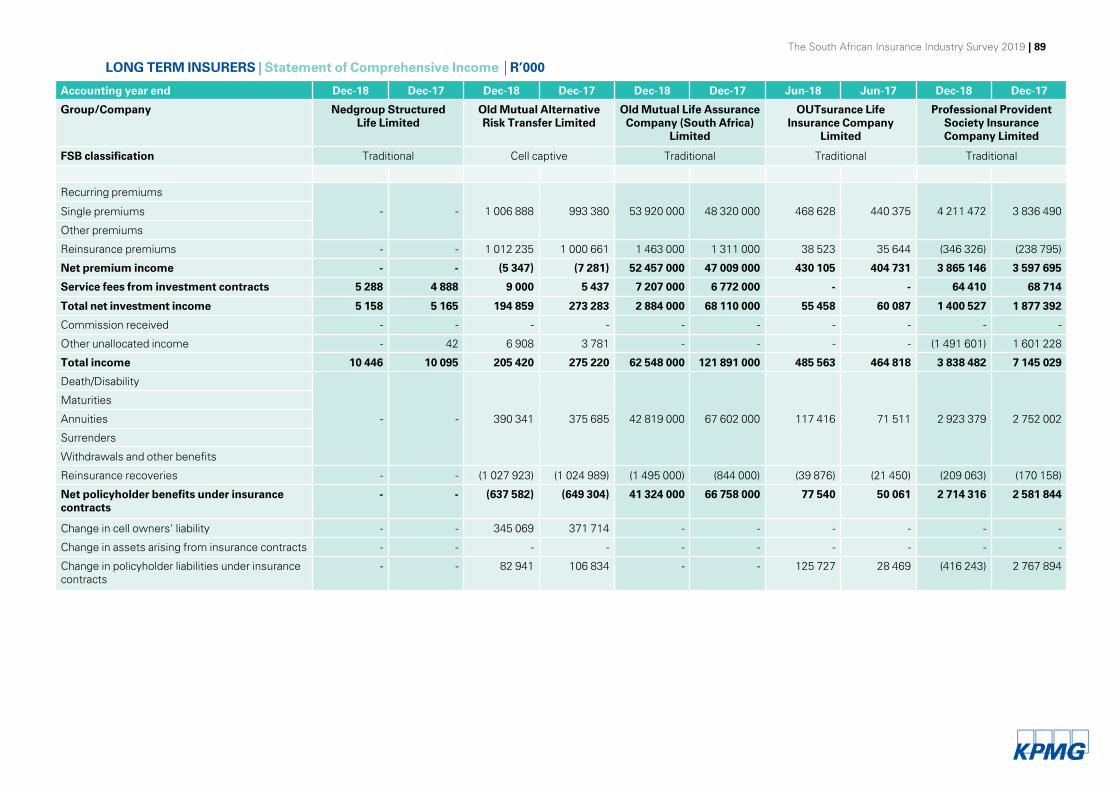
LONG TERM INSURERS | Statement of Comprehensive Income | R’000
The South African Insurance Industry Survey 2019 | 89
Accounting year end Dec-18 Dec-17 Dec-18 Dec-17 Dec-18 Dec-17 Jun-18 Jun-17 Dec-18 Dec-17
Group/Company Nedgroup Structured Life Limited
Old Mutual Alternative Risk Transfer Limited
Old Mutual Life Assurance Company (South Africa)
Limited
OUTsurance Life Insurance Company
Limited
Professional Provident Society Insurance Company Limited
FSB classification Traditional Cell captive Traditional Traditional Traditional
Recurring premiums
- - 1 006 888 993 380 53 920 000 48 320 000 468 628 440 375 4 211 472 3 836 490 Single premiums
Other premiums
Reinsurance premiums - - 1 012 235 1 000 661 1 463 000 1 311 000 38 523 35 644 (346 326) (238 795)
Net premium income - - (5 347) (7 281) 52 457 000 47 009 000 430 105 404 731 3 865 146 3 597 695
Service fees from investment contracts 5 288 4 888 9 000 5 437 7 207 000 6 772 000 - - 64 410 68 714
Total net investment income 5 158 5 165 194 859 273 283 2 884 000 68 110 000 55 458 60 087 1 400 527 1 877 392
Commission received - - - - - - - - - -
Other unallocated income - 42 6 908 3 781 - - - - (1 491 601) 1 601 228
Total income 10 446 10 095 205 420 275 220 62 548 000 121 891 000 485 563 464 818 3 838 482 7 145 029
Death/Disability
- - 390 341 375 685 42 819 000 67 602 000 117 416 71 511 2 923 379 2 752 002
Maturities
Annuities
Surrenders
Withdrawals and other benefits
Reinsurance recoveries - - (1 027 923) (1 024 989) (1 495 000) (844 000) (39 876) (21 450) (209 063) (170 158)
Net policyholder benefits under insurance contracts
- - (637 582) (649 304) 41 324 000 66 758 000 77 540 50 061 2 714 316 2 581 844
Change in cell owners' liability - - 345 069 371 714 - - - - - -
Change in assets arising from insurance contracts - - - - - - - - - -
Change in policyholder liabilities under insurance contracts
- - 82 941 106 834 - - 125 727 28 469 (416 243) 2 767 894

LONG TERM INSURERS | Statement of Comprehensive Income | R’000
90 | The South African Insurance Industry Survey 2019
Accounting year end Jun-18 Jun-17 Dec-18 Dec-17
Group/Company Regent Life Assurance Company Limited
Sanlam Life Insurance Limited
FSB classification Traditional Traditional
Recurring premiums
821 378 793 786 67 246 000 58 431 000 Single premiums
Other premiums
Reinsurance premiums 60 027 58 703 11 262 000 9 546 000
Net premium income 761 351 735 083 55 984 000 48 885 000
Service fees from investment contracts - - 6 374 000 5 494 000
Total net investment income 101 705 61 018 14 761 000 63 711 000
Commission received - - 2 166 000 1 685 000
Other unallocated income 50 093 57 613 (1 000) 5 000
Total income 913 149 853 714 79 284 000 119 780 000
Death/Disability 211 290 220 365
41 799 000 41 320 000
Maturities 30 688 27 409
Annuities - -
Surrenders 66 542 71 939
Withdrawals and other benefits 9 810 7 452
Reinsurance recoveries (51 376) (47 685) (6 705 000) (7 911 000)
Net policyholder benefits under insurance contracts
266 954 279 480 35 094 000 33 409 000
Change in cell owners' liability - - - -
Change in assets arising from insurance contracts - - - -
Change in policyholder liabilities under insurance contracts
7 893 (79 166) (2 571 000) 6 579 000


LONG TERM INSURERS | Statement of Comprehensive Income | R’000
92 | The South African Insurance Industry Survey 2019
Accounting year end Jun-18 Jun-17 Dec-18 Dec-17 Nov-18 Nov-17 Jun-18 Jun-17 Mar-18 Mar-17
Group/Company 1Life (RF) Insurance Limited
Absa Life Limited AIG Life South Africa Limited
AVBOB Mutual Assurance Society
Alexander Forbes Life Limited
FSB classification Traditional Traditional Traditional Traditional Traditional
Fair value adjustments on policyholder liabilities under investment contracts
- - (126 910) 1 942 547 - - - - 3 626 615 2 695 690
Acquisition costs 139 627 138 513 955 497 662 882 121 906 128 185 650 647 592 662 24 118 14 062
Administration, management & other expenses 612 267 515 778 515 727 499 184 146 782 154 063 975 396 842 236 927 740 857 924
Total expenses 1 022 234 995 492 2 254 033 4 094 440 382 704 432 333 4 987 531 3 283 215 4 714 006 3 617 244
Equity-accounted earnings - - - - - - - - - -
Profit/(Loss) before tax 228 553 92 262 1 361 868 1 151 692 32 846 41 978 146 195 380 316 54 073 122 468
Tax 64 435 31 864 487 945 312 018 9 198 12 797 144 065 (21 761) 34 019 45 503
Profit/(Loss) after tax 164 118 60 398 873 923 839 674 23 648 29 181 2 130 402 077 20 054 76 965
Other comprehensive income - - - - - - 326 (13) - -
Total comprehensive income/(loss) for the year
164 118 60 398 873 923 839 674 23 648 29 181 2 456 402 064 20 054 76 965
Other transfer to/(from) retained income - - - - - - - - - -
Other comprehensive income not charged against retained earnings
- - - - - - - - - -
Ordinary dividends - - 665 000 823 000 - 120 000 - - 75 000 50 000
Allocated to preference shareholders - - - - - - - - - -
Allocated to non-controlling interests - - - - - - - - - -
Change in retained earnings 164 118 60 398 208 923 16 674 23 648 (90 819) 2 456 402 064 (54 946) 26 965
Management expenses to net premium and service fees on investment contracts
52% 50% 15% 18% 37% 34% 27% 27% 124% 132%
Tax as a % of NIBT 28% 35% 36% 27% 28% 30% 99% (6%) 63% 37%
Comments Company Company Company Society Company
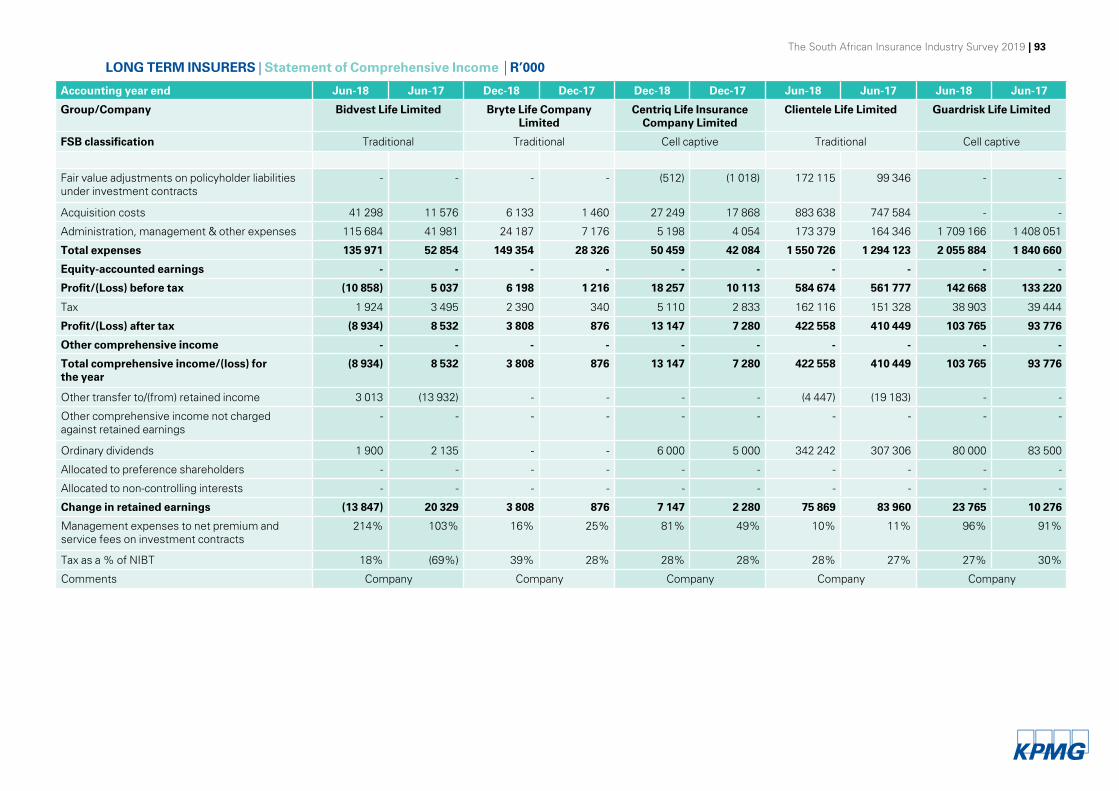
LONG TERM INSURERS | Statement of Comprehensive Income | R’000
The South African Insurance Industry Survey 2019 | 93
Accounting year end Jun-18 Jun-17 Dec-18 Dec-17 Dec-18 Dec-17 Jun-18 Jun-17 Jun-18 Jun-17
Group/Company Bidvest Life Limited Bryte Life Company Limited
Centriq Life Insurance Company Limited
Clientele Life Limited Guardrisk Life Limited
FSB classification Traditional Traditional Cell captive Traditional Cell captive
Fair value adjustments on policyholder liabilities under investment contracts
- - - - (512) (1 018) 172 115 99 346 - -
Acquisition costs 41 298 11 576 6 133 1 460 27 249 17 868 883 638 747 584 - -
Administration, management & other expenses 115 684 41 981 24 187 7 176 5 198 4 054 173 379 164 346 1 709 166 1 408 051
Total expenses 135 971 52 854 149 354 28 326 50 459 42 084 1 550 726 1 294 123 2 055 884 1 840 660
Equity-accounted earnings - - - - - - - - - -
Profit/(Loss) before tax (10 858) 5 037 6 198 1 216 18 257 10 113 584 674 561 777 142 668 133 220
Tax 1 924 3 495 2 390 340 5 110 2 833 162 116 151 328 38 903 39 444
Profit/(Loss) after tax (8 934) 8 532 3 808 876 13 147 7 280 422 558 410 449 103 765 93 776
Other comprehensive income - - - - - - - - - -
Total comprehensive income/(loss) for the year
(8 934) 8 532 3 808 876 13 147 7 280 422 558 410 449 103 765 93 776
Other transfer to/(from) retained income 3 013 (13 932) - - - - (4 447) (19 183) - -
Other comprehensive income not charged against retained earnings
- - - - - - - - - -
Ordinary dividends 1 900 2 135 - - 6 000 5 000 342 242 307 306 80 000 83 500
Allocated to preference shareholders - - - - - - - - - -
Allocated to non-controlling interests - - - - - - - - - -
Change in retained earnings (13 847) 20 329 3 808 876 7 147 2 280 75 869 83 960 23 765 10 276
Management expenses to net premium and service fees on investment contracts
214% 103% 16% 25% 81% 49% 10% 11% 96% 91%
Tax as a % of NIBT 18% (69%) 39% 28% 28% 28% 28% 27% 27% 30%
Comments Company Company Company Company Company

LONG TERM INSURERS | Statement of Comprehensive Income | R’000
94 | The South African Insurance Industry Survey 2019
Accounting year end Jun-18 Jun-17 Dec-18 Dec-17 Jun-18 Jun-17 Jun-18 Jun-17 Dec-18 Dec-17
Group/Company Hollard Life Assurance Company Limited
Liberty Group Limited Momentum Ability Limited
MMI Group Limited Nedgroup Life Assurance Company Limited
FSB classification Traditional Traditional Traditional Traditional Traditional
Fair value adjustments on policyholder liabilities under investment contracts
- - (1 283 000) 9 043 000 (14 368) 63 437 17 466 000 5 845 000 227 427 219 298
Acquisition costs 522 748 481 530 3 685 000 4 205 000 - - 3 068 000 3 175 000 294 987 369 916
Administration, management & other expenses 2 381 877 2 215 338 10 389 000 9 691 000 181 073 156 740 6 756 000 5 982 000 447 609 396 325
Total expenses 4 948 387 4 018 627 37 628 000 51 228 000 193 687 185 375 50 268 000 32 199 000 1 605 017 1 619 796
Equity-accounted earnings - - - - - - - - - -
Profit/(Loss) before tax 1 000 241 1 175 318 3 360 000 18 513 000 4 249 9 317 3 196 000 4 315 000 873 935 912 692
Tax 317 068 319 556 1 069 000 2 036 000 763 2 709 1 618 000 1 570 000 254 411 235 742
Profit/(Loss) after tax 683 173 855 762 2 291 000 16 477 000 3 486 6 608 1 578 000 2 745 000 619 524 676 950
Other comprehensive income - - 91 000 (85 000) - - (989 000) (11 000) - -
Total comprehensive income/(loss) for the year
683 173 855 762 2 382 000 16 392 000 3 486 6 608 589 000 2 734 000 619 524 676 950
Other transfer to/(from) retained income - - - (75 000) - - 172 000 (60 000) - -
Other comprehensive income not charged against retained earnings
- - - 31 000 - - 989 000 11 000 - -
Ordinary dividends 663 886 1 290 444 2 252 000 2 600 000 5 000 28 000 3 047 000 2 812 000 650 000 650 000
Allocated to preference shareholders - - - - - - 35 000 36 000 - -
Allocated to non-controlling interests - - - - - - - - - -
Change in retained earnings 19 287 (434 682) 130 000 13 748 000 (1 514) (21 392) (1 332 000) (163 000) (30 476) 26 950
Management expenses to net premium and service fees on investment contracts
48% 49% 28% 26% 102% 117% 32% 29% 23% 22%
Tax as a % of NIBT 32% 27% 32% 11% 18% 29% 51% 36% 29% 26%
Comments Company Group Company Company Company

LONG TERM INSURERS | Statement of Comprehensive Income | R’000
The South African Insurance Industry Survey 2019 | 95
Accounting year end Dec-18 Dec-17 Dec-18 Dec-17 Dec-18 Dec-17 Jun-18 Jun-17 Dec-18 Dec-17
Group/Company Nedgroup Structured Life Limited
Old Mutual Alternative Risk Transfer Limited
Old Mutual Life Assurance Company (South Africa)
Limited
OUTsurance Life Insurance Company
Limited
Professional Provident Society Insurance Company Limited
FSB classification Traditional Cell captive Traditional Traditional Traditional
Fair value adjustments on policyholder liabilities under investment contracts
- - 154 036 194 302 (5 669 000) 26 695 000 - - (46 871) 140 061
Acquisition costs - - 52 639 34 427 6 788 000 6 878 000 - - - -
Administration, management & other expenses 2 794 2 452 196 546 206 477 11 506 000 10 710 000 210 687 237 542 1 579 392 1 204 160
Total expenses 2 794 2 452 193 649 264 450 53 949 000 111 041 000 413 954 316 072 3 830 594 6 693 959
Equity-accounted earnings - - - - - - - - - -
Profit/(Loss) before tax 7 652 7 643 11 771 10 770 8 599 000 10 850 000 71 609 148 746 7 888 451 070
Tax 2 142 2 140 3 325 3 109 (1 421 000) 3 662 000 18 981 36 939 (48 827) 441 615
Profit/(Loss) after tax 5 510 5 503 8 446 7 661 10 020 000 7 188 000 52 628 111 807 56 715 9 455
Other comprehensive income - - 52 333 (108 000) (97 000) 13 809 (501) 3 714 1 936
Total comprehensive income/(loss) for the year
5 510 5 503 8 498 7 994 9 912 000 7 091 000 66 437 111 306 60 429 11 391
Other transfer to/(from) retained income - - 475 - 70 000 95 000 - - - -
Other comprehensive income not charged against retained earnings
- - (52) (333) 108 000 97 000 (13 809) 501 (3 714) (1 936)
Ordinary dividends - - - - 4 421 000 6 841 000 45 587 - - -
Allocated to preference shareholders - - - - - - - - - -
Allocated to non-controlling interests - - - - - - - - - -
Change in retained earnings 5 510 5 503 8 921 7 661 5 669 000 442 000 7 041 111 807 56 715 9 455
Management expenses to net premium and service fees on investment contracts
53% 50% 5380% (11197%) 19% 20% 49% 59% 41% 33%
Tax as a % of NIBT 28% 28% 28% 29% (17%) 34% 27% 25% (619%) 98%
Comments Company Company Company Company Company

LONG TERM INSURERS | Statement of Comprehensive Income | R’000
96 | The South African Insurance Industry Survey 2019
Accounting year end Jun-18 Jun-17 Dec-18 Dec-17
Group/Company Regent Life Assurance Company Limited
Sanlam Life Insurance Limited
FSB classification Traditional Traditional
Fair value adjustments on policyholder liabilities under investment contracts
24 400 6 221 (2 999 000) 32 588 000
Acquisition costs 212 184 199 394 10 139 000 8 832 000
Administration, management & other expenses 136 102 (238 305) 25 079 000 24 686 000
Total expenses 647 533 167 624 64 742 000 106 094 000
Equity-accounted earnings - (73) 2 424 000 2 646 000
Profit/(Loss) before tax 265 616 686 017 16 966 000 16 332 000
Tax 61 727 87 864 4 164 000 4 342 000
Profit/(Loss) after tax 203 889 598 153 12 802 000 11 990 000
Other comprehensive income - - 2 298 000 (1 810 000)
Total comprehensive income/(loss) for the year
203 889 598 153 15 100 000 10 180 000
Other transfer to/(from) retained income 326 (6 808) (765 000) (46 000)
Other comprehensive income not charged against retained earnings
- - (3 119 000) 136 000
Ordinary dividends 87 785 641 587 6 053 000 5 400 000
Allocated to preference shareholders - - - -
Allocated to non-controlling interests (53 516) (61 654) - -
Change in retained earnings 62 914 (111 896) 5 163 000 4 870 000
Management expenses to net premium and service fees on investment contracts
18% (32%) 40% 45%
Tax as a % of NIBT 23% 13% 25% 27%
Comments Company Group


98 | The South African Insurance Industry Survey 2019
Kashmira NaranAssociate Director: Insurance Tel: +27 82 710 7629 Email: [email protected]

The South African Insurance Industry Survey 2019 | 99
Reinsurance industry resultsThe results of the reinsurance industry need to be interpreted in the context of the results of the South Africa non-life insurance and life insurance industry results as set out in this publication.
In summary, the life insurance industry experienced low growth in new business and an increase in first year policy lapses on recurring premium business. From the perspective of the short-term insurance industry, direct insurers and bancassurers saw muted growth in premium. Specialist insurers such as Sasria and ECIC did not experience favourable results after a number of claims due to the #FeesMustFall protests and a slowdown in premiums as firms slowed expansion plans into African territories, respectively.
Financial indicators
Our performance analysis is based on locally registered professional reinsurers participating in this survey; reflecting approximately 90% of the reinsurance market share in terms of gross written premiums. We noted in KPMG’s survey of the 2017 results that the reinsurance industry is one that is observed to be competitive, a trend that continues to be observed into the 2018 financial year. We also noted that the level of competition was expected to increase now that foreign reinsurers may operate branches under the new
Insurance Act, effective from 1 July 2018. However, the impact of this has not been fully observed as reinsurers continue to work through their decision-making process in this regard.
What the immediate future holds for reinsurance operations
The severity of large losses decreased significantly in 2018 when compared to 2017. From a global perspective, published by S&P Global Ratings, “For the past several years, the global reinsurance sector has weathered unfavorable and continuously changing business conditions. The challenges have included a prolonged soft reinsurance pricing cycle, heightened competition, limited organic growth opportunities, a record influx of alternative capital, low interest rates, mergers and acquisitions, and large catastrophe losses. Against this backdrop, reinsurers are trying to pull whatever levers they can not only to remain relevant but also to sustain profitability.”1.
Growth
Despite subdued local and global economic growth, local reinsurers still achieved respectable growth levels. Gross written premiums (GWP) improved in the 2018 financial year when compared to the 2017 financial year, by 20% (2017: 16%). Due to poor performing financial markets, investment income growth was low at 2% (2017: 10%). Economic factors such as low GDP growth, increasing political instability and unemployment rates and South
Africa’s sovereign credit rating downgrade, contributed towards the constrained growth in investment income when compared to 2017.
Performance
Overall the reinsurance market has seen a hardening in premium rates stemming from the increase in the number and severity of losses experienced in 2017. This meant higher insurance premiums, lower coverage, increased underwriting criteria, lower and increased competition among insurance carriers. However, due to the lower number and severity of claims losses experienced during 2018, this trend is unlikely to continue into 2019.
The following weather related natural catastrophe events were experienced during 2018, with all events occurring during December 2018, except for the Knysna fires which occurred during October 2018. The impact of these losses on the 2018 financial results of reinsurers was not as substantial as that experienced in previous financial years:
– Sun City hailstorm – Wupperthal fires in the Western Cape – St Francis fires – Forever Resorts Badplaas floods – Knysna fires
1 https://www.spratings.com/documents/20184/1581657/ Global+Reinsurance+Highlights+2018/98dc8810-

100 | The South African Insurance Industry Survey 2019
Illustrated below is the share of the reinsurance market by GWP, as reported in the audited financial statements of the reinsurers participating in this survey, including a combined view of long-term and short-term results.
Munich Reinsurance Company of Africa Limited and Hannover Reinsurance Group remain the dominant players in the local reinsurance industry. Their combined market share accounts for 59% (2017: 58%) measured by GWP volumes. The market share distribution across reinsurers continues to remain relatively consistent between 2017 and 2018, with only marginal movements noted across industry players.
Other important key performance indicators of the industry based on the results of reinsurers participating in the 2018 KPMG survey are as follows:
Three of the eight reinsurers participating in this survey experienced an underwriting profit for 2018 with the remaining reinsurers having not recovered from the underwriting losses experienced in 2017.
The graph included below illustrates the improvement in the loss ratio across all reinsurers, which is a direct reflection of the performance of the life and non-life insurance industries and the lower severity of loss events experienced during 2018. The overall loss ratio for reinsurers participating in this survey decreased from 91% in 2017 to 80% in 2018.
Performance indicator 2018 2017
Management and other expenses to earned premium 13% 14%
Policyholder benefits and entitlements to earned premium 80% 91%
Net commission to earned premium 11% 8%
Underwriting loss R555 million R1 424 million

The South African Insurance Industry Survey 2019 | 101
Underwriting performance per reinsurer

102 | The South African Insurance Industry Survey 2019

The South African Insurance Industry Survey 2019 | 103
Munich Re
Munich Re continued to experience an underwriting loss for 2018, with the loss having improved from R367 million in 2017 to R191 million in 2018. The increase in GWP of 31% (2017: 23%) resulted primarily from key strategic alliances. The loss ratio and combined ratio showed improvement as a result of the less severe claims losses.
Hannover Re
Hannover Re is one of the two reinsurers that experienced an underwriting profit during 2018. GWP increased by 10% (2017: 4%) while net earned premiums increased by 62% (2017: 27%) due to a larger portion of unearned premiums written in prior years being earned in 2018.
Hannover Life
Hannover Life experienced GWP growth of 8% (2017: 4%) during 2018. The results have remained relatively flat with no significant movements noted in the results from 2017 to 2018.
As with Munich Re, the loss ratio and combined ratio also showed improvement as a result of the less severe claims losses.
African Re
African Re’s results mirror those of Hannover Re, Hannover Life and Munich Re. African Re achieved 11% (2017: 16%) growth in terms of GWP, with net
earned premiums increasing by 12% (2017: 14%). However, the underwriting loss decreased from R175 million in 2017 to R60 million in 2018 with the primary contributor being the lower severity of claims losses.
RGA
RGA increased its GWP and earned premiums by 14% (2017: 14%). The underwriting loss of R317 million experienced in the prior year has decreased to R159 million in the current year, largely attributable to lower exposure to claims losses, lower expenses and lower retrocession.
General Re
General Re is a composite reinsurer. As in prior years, the short-term operation is significantly smaller than its long-term operation with only 5% of total GWP pertaining to short-term operations. Overall GWP growth of 15% was experienced during 2018 (2017: 2%) with the rest of the financial ratios following that of the rest of the industry.
Investment performance
Reinsurers achieved an average return on investments (including cash and cash equivalents) of 5.8% (2017: 6.1%) compared to an average prime rate of 10.0% and the average 10-year government bond yield of 8.705%2.
Consistent with the past two years, Munich Re was the top performer in terms of investment returns with 7.8% (2017: 7.4%). RGA and Gen Re followed closely with 7.6% (2017: 7.4%) and 6.6% (2017: 6.8%) respectively.
All other companies surveyed have an average investment return of 3.7% (2017: 4.9%). Investment performance was reflective of the poor performance of investment markets in South Africa over the course of 2018.
Conclusion
Although a recovery in financial results has been noted since 2017, reinsurers will need to closely monitor their underwriting risk. Improved claims conditions could be seen as temporary in nature – with the number of natural catastrophe events becoming more frequent in recent years. Identifying business value and leveraging off the benefits of IFRS 17: Insurance Contracts, regulatory compliance and implementation, and driving innovation and technology into the business to manage underwriting risk – these are but some of a few of the challenges that reinsurers need to deal with to not only keep up with, but to surpass their peers. Obtaining business benefit by delving into uncharted territory is what is needed in changing times to distinguish oneself from the crowd.
2 https://www.spratings.com/documents/20184/1581657/ Global+Reinsurance+Highlights+2018/98dc8810-

REINSURERS | Statement of Financial Position | R’000
104 | The South African Insurance Industry Survey 2019
Accounting year end Dec-18 Dec-17 Dec-18 Dec-17 Mar-18 Mar-17 Dec-18 Dec-17
Group/Company African Reinsurance Corporation (South Africa)
Limited
General Reinsurance Africa Limited
GIC RE South Africa Limited Hannover Life Reassurance Africa Limited
Share capital and share premium 80,300 80,300 4,000 4,000 843,713 253,900 112,500 112,500
Retained earnings/(deficit) 604,911 633,785 1,886,991 1,555,789 (134,618 ) (59,788) 469,793 432,291
Reserves 51,702 51,702 (15,471) (27,308) 142 1,733 (16,542) (10,467)
Total shareholders' funds 736,913 765,787 1,875,520 1,532,481 709,237 195,845 565,751 534,324
Gross outstanding claims 1,465,121 1,488,963 1,747,811 1,490,927 983,586 478,388 422,756 249,987
Gross unearned premium reserve 199,174 213,864 226,464 208,155 835,958 332,165 13,085 12,231
Provision for profit commission - - - - - - 294,202 416,457
Policy holder liabilities under insurance contracts - - 2,488,069 2,414,278 - 16,895 3,447,866 3,051,643
Liabilities in respect of investment contracts - - - - - - - -
Deferred reinsurance commission revenue 41,518 39,894 - - 176,653 76,129 28,930 32,972
Deferred tax liabilities / (assets) 3,145 18,466 (15,719) (2,420) (5,425) (5,971) (10,806) 329
Funds withheld 1,729,481 1,661,660 862 433 1,290,984 619,411 37,055 1,086,288
Other liabilities 193,242 285,943 446,765 299,021 40,183 27,218 585,459 255,182
Total liabilities 3,631,681 3,708,790 4,894,252 4,410,394 3,321,939 1,544,235 4,818,547 5,105,089
Total investments 2,408,616 2,590,521 5,497,672 4,901,453 1,339,797 539,218 2,782,058 3,549,270
Funds withheld 8,432 7,844 - - - - 149,506 183,664
PPE and intangible assets 2,717 3,121 3,747 4,613 1,830 1,243 - -
Retrocessionaires' share of outstanding claims 1,104,296 1,069,950 229,576 178,962 821,256 405,830 219,731 101,522
Retrocessionaires' share of unearned premium reserve 135,154 150,675 28,101 26,922 627,885 287,805 - 104
Retrocessionaires' share of profit commissions - - - - - - 54,045 7,689
Retrocessionaires' share of liabilities under life insurance contracts - - - - - 3,059 1,032,846 915,792
Deferred aquisition cost 53,812 49,492 - - 197,309 79,740 177,889 187,837
Cash and cash equivalents 6,984 48,259 366,507 247,815 130,550 77,673 206,547 146,822
Other assets 648,583 554,715 644,169 583,110 912,549 345,512 761,676 546,713
Total assets 4,368,594 4,474,577 6,769,772 5,942,875 4,031,176 1,740,080 5,384,298 5,639,413
Return on equity (4%) 3% 18% 4% (11%) (14%) 7% 7%
Total assets / total liabilities 120% 121% 138% 135% 121% 113% 112% 110%
Change in shareholders' funds (4%) 22% 262% 6%

REINSURERS | Statement of Financial Position | R’000
The South African Insurance Industry Survey 2019 | 105
Accounting year end Dec-18 Dec-17 Dec-18 Dec-17 Dec-18 Dec-17 Dec-18 Dec-17
Group/Company Hannover Reinsurance Africa Limited
Munich Reinsurance Company of Africa Limited
RGA Reinsurance Company of South Africa Limited
Scor Africa Limited
Share capital and share premium 72,778 72,778 194,915 34,915 951,982 51,982 344,700 307,200
Retained earnings/(deficit) 498,711 500,777 2,842,291 2,678,677 218,058 113,876 (8,880) (56,107)
Reserves 312,456 190,964 147,622 163,641 20,437 28,562 3,229 3,190
Total shareholders' funds 883,945 764,519 3,184,828 2,877,233 1,190,477 194,420 339,049 254,283
Gross outstanding claims 1,719,291 1,695,112 6,656,999 6,056,749 1,006,107 989,434 1,105,402 1,445,310
Gross unearned premium reserve 546,300 796,045 1,891,811 1,155,328 - - 320,074 311,742
Provision for profit commission 566,400 466,081 13,586 274,661 - - - -
Policy holder liabilities under insurance contracts - - 2,211,418 2,014,413 1,826,154 1,453,065 143,842 174,075
Liabilities in respect of investment contracts - - - - - - - -
Deferred reinsurance commission revenue 106,408 108,223 460,770 273,290 - - 82,175 69,688
Deferred tax liabilities / (assets) (10,699) (14,423) 177,023 54,044 (728) (423) (28,774) (53,097)
Funds withheld 394,961 804,941 44,081 37,787 - 965,942 1,002,489 1,126,281
Other liabilities 662,055 460,434 2,795,602 2,205,726 65,681 49,074 545,233 475,346
Total liabilities 3,984,716 4,316,413 14,251,290 12,071,998 2,897,214 3,457,092 3,170,441 3,549,345
Total investments 1,582,862 1,652,212 5,207,385 4,437,997 2,010,441 1,866,288 1,284,624 1,325,239
Funds withheld 498,536 485,809 156,309 117,397 - - - -
PPE and intangible assets 14,714 20,397 2,057,035 1,614,005 16,313 13,120 4,526 421
Retrocessionaires' share of outstanding claims 965,038 978,345 3,998,972 3,530,149 - - 891,909 985,382
Retrocessionaires' share of unearned premium reserve 302,294 308,045 1,638,953 927,579 - - 212,936 208,812
Retrocessionaires' share of profit commissions 306,525 323,753 11,220 219,715 - - - -
Retrocessionaires' share of liabilities under life insurance contracts - - 26,372 22,559 1,262,372 965,942 95,003 86,628
Deferred aquisition cost 143,919 191,155 512,054 311,891 - - 133,108 94,834
Cash and cash equivalents 206,220 162,854 546,619 388,371 223,358 95,425 220,624 311,797
Other assets 848,553 958,362 3,281,199 3,379,568 575,207 710,737 666,760 790,515
Total assets 4,868,661 5,080,932 17,436,118 14,949,231 4,087,691 3,651,512 3,509,490 3,803,628
Return on equity 10% 4% 5% (1%) 9% (39%) 14% (36%)
Total assets / total liabilities 122% 118% 122% 124% 141% 106% 111% 107%
Change in shareholders' funds 16% 11% 512% 33%
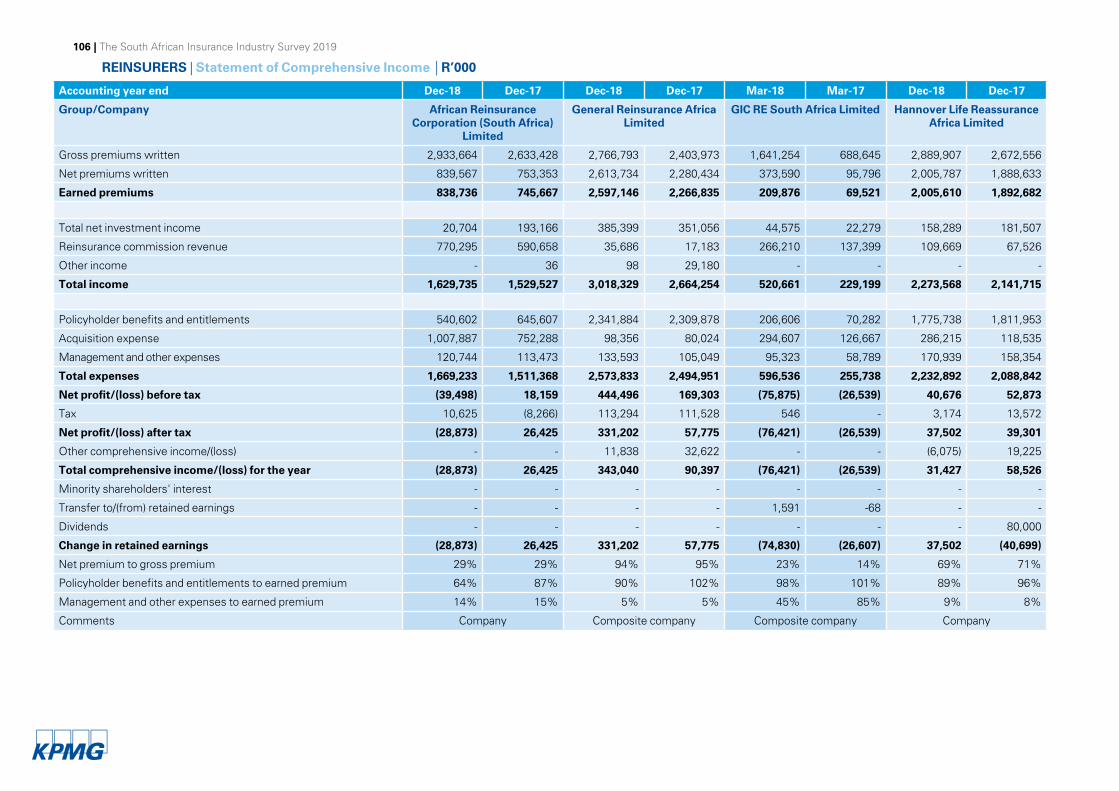
REINSURERS | Statement of Comprehensive Income | R’000
106 | The South African Insurance Industry Survey 2019
Accounting year end Dec-18 Dec-17 Dec-18 Dec-17 Mar-18 Mar-17 Dec-18 Dec-17
Group/Company African Reinsurance Corporation (South Africa)
Limited
General Reinsurance Africa Limited
GIC RE South Africa Limited Hannover Life Reassurance Africa Limited
Gross premiums written 2,933,664 2,633,428 2,766,793 2,403,973 1,641,254 688,645 2,889,907 2,672,556
Net premiums written 839,567 753,353 2,613,734 2,280,434 373,590 95,796 2,005,787 1,888,633
Earned premiums 838,736 745,667 2,597,146 2,266,835 209,876 69,521 2,005,610 1,892,682
Total net investment income 20,704 193,166 385,399 351,056 44,575 22,279 158,289 181,507
Reinsurance commission revenue 770,295 590,658 35,686 17,183 266,210 137,399 109,669 67,526
Other income - 36 98 29,180 - - - -
Total income 1,629,735 1,529,527 3,018,329 2,664,254 520,661 229,199 2,273,568 2,141,715
Policyholder benefits and entitlements 540,602 645,607 2,341,884 2,309,878 206,606 70,282 1,775,738 1,811,953
Acquisition expense 1,007,887 752,288 98,356 80,024 294,607 126,667 286,215 118,535
Management and other expenses 120,744 113,473 133,593 105,049 95,323 58,789 170,939 158,354
Total expenses 1,669,233 1,511,368 2,573,833 2,494,951 596,536 255,738 2,232,892 2,088,842
Net profit/(loss) before tax (39,498) 18,159 444,496 169,303 (75,875) (26,539) 40,676 52,873
Tax 10,625 (8,266) 113,294 111,528 546 - 3,174 13,572
Net profit/(loss) after tax (28,873) 26,425 331,202 57,775 (76,421) (26,539) 37,502 39,301
Other comprehensive income/(loss) - - 11,838 32,622 - - (6,075) 19,225
Total comprehensive income/(loss) for the year (28,873) 26,425 343,040 90,397 (76,421) (26,539) 31,427 58,526
Minority shareholders' interest - - - - - - - -
Transfer to/(from) retained earnings - - - - 1,591 -68 - -
Dividends - - - - - - - 80,000
Change in retained earnings (28,873) 26,425 331,202 57,775 (74,830) (26,607) 37,502 (40,699)
Net premium to gross premium 29% 29% 94% 95% 23% 14% 69% 71%
Policyholder benefits and entitlements to earned premium 64% 87% 90% 102% 98% 101% 89% 96%
Management and other expenses to earned premium 14% 15% 5% 5% 45% 85% 9% 8%
Comments Company Composite company Composite company Company

REINSURERS | Statement of Comprehensive Income | R’000
The South African Insurance Industry Survey 2019 | 107
Accounting year end Dec-18 Dec-17 Dec-18 Dec-17 Dec-18 Dec-17 Dec-18 Dec-17
Group/Company Hannover Reinsurance Africa Limited
Munich Reinsurance Company of Africa Limited
RGA Reinsurance Company of South Africa Limited
Scor Africa Limited
Gross premiums written 2,785,801 2,533,214 11,020,565 8,438,682 2,992,144 2,628,650 1,259,699 1,546,209
Net premiums written 903,338 721,086 4,614,375 3,948,090 846,924 679,684 446,713 615,047
Earned premiums 1,147,636 708,951 4,560,710 3,857,048 841,547 694,696 445,159 568,941
Total net investment income 114,568 87,351 450,376 356,730 169,444 145,715 42,958 25,078
Reinsurance commission revenue 700,872 657,524 1,824,187 1,307,114 132,711 121,156 200,360 178,975
Other income (13,000) (20,368) - - 106,802 103,241 (2,969) (4,614)
Total income 1,950,076 1,433,458 6,835,273 5,520,892 1,250,504 1,064,808 685,508 768,380
Policyholder benefits and entitlements 641,636 504,682 3,679,655 3,241,709 669,594 630,589 260,636 568,309
Acquisition expense 1,103,239 818,529 2,190,482 1,617,846 224,662 210,535 279,078 247,294
Management and other expenses 99,014 73,767 705,889 671,866 238,653 291,919 76,335 77,769
Total expenses 1,843,889 1,396,978 6,576,026 5,531,421 1,132,909 1,133,043 616,049 893,372
Net profit/(loss) before tax 106,187 36,480 259,247 (10,529) 117,595 (68,235) 69,459 (124,992)
Tax 18,251 4,898 110,208 5,367 13,413 7,382 22,233 (34,626)
Net profit/(loss) after tax 87,936 31,582 149,039 (15,896) 104,182 (75,617) 47,226 (90,366)
Other comprehensive income/(loss) 121,492 34,937 (1,444) (17,953) (10,346) 25,850 7,242 7,731
Total comprehensive income/(loss) for the year 209,428 66,519 147,595 (33,849) 93,836 (49,767) 54,468 (82,635)
Minority shareholders' interest - - - - - - - -
Transfer to/(from) retained earnings - - 14,575 (22,418) - - - -
Dividends 90,000 30,000 - - - - - -
Change in retained earnings (2,064) 1,582 163,614 (38,314) 104,182 (75,617) 47,226 (90,366)
Net premium to gross premium 32% 28% 42% 47% 28% 26% 35% 40%
Policyholder benefits and entitlements to earned premium 56% 71% 81% 84% 80% 91% 59% 100%
Management and other expenses to earned premium 9% 10% 15% 17% 28% 42% 17% 14%
Comments Company Composite company Company Composite company

This survey is made by KPMG Inc, a South African company and a member firm of the KPMG network of independent firms affiliated with KPMG International Cooperative (“KPMG International”), a Swiss entity.
© 2019 KPMG Inc, a South African company and a member firm of the KPMG network of independent member firms affiliated with KPMG International Cooperative (“KPMG International”), a Swiss entity. All rights reserved. Printed in South Africa. KPMG and the KPMG logo are registered trademarks of KPMG International Cooperative (“KPMG International”), a Swiss entity.
KPMG shall retain copyright and all other intellectual property rights in the content and material used and/or stated in this survey. MC18020.


