AD-AIl5 718 NAVAL POSTGRADUATE SCHOOL MONTEREY CA F/6 20/4 THEORETICAL MODELING OF FLUID INTERACTIONS PRODUCED BY SHIP BOW--ETC(U) MAR 82 T C COOPER UNCLASSIFIED NL *2flllllllllll EhE, hE~h llIhllllElllEE IEIIIIIEIIIEEE IIIIEIIIIIEEI IIIIIIIIIIIIII IIIIIIIIIIEII
Transcript
AD-AIl5 718 NAVAL POSTGRADUATE SCHOOL MONTEREY CA F/6 20/4THEORETICAL MODELING OF FLUID INTERACTIONS PRODUCED BY SHIP BOW--ETC(U)MAR 82 T C COOPER
Approved for public release; distribution unlimited
-M
82 06 18 046*
ECUavY CLAWI@ATON OFeP GI 01011 AN" 4110140114110
EUPO WI' UOIIDNTATUN P143u. PNY muinw jeamms ""0
Modli. ofTL Fluid WM S. TYPe OP SEP00? 6 Paolo0 covalwo
Theoretical MdlnofFudInteraction Mastrch 1982 iProduced by Ship Bow Thrusters Marc 1982u~ DN epe sM
T. AUWO11re)U. CONTRACT ON GEA=T rn1,iuuur@A;
Thomas Charles Cooper
a. 11911rms .usauaZAvmu "AMe" AND LONUI 'S *GA1NE1:9LsUM I. PtJ9C-T TASK
Naval Postgraduate SchoolMonterey, California 93940t
11. CN6LN e9cC NAMe AND A60111081 It. AIRPORT DAlE
Naval Postgraduate School Mrh18Monterey, California 93940 " NmUeaforP"95E
6 OiTesWU MMNCY NAMEN a ANUREUW 11.m 1. UmR fim LLIYV CLASS. (of ad* .mwj"
W. D*SYTS@TN STAYEM? W9 010 UMJ
Approved for public release, distribution unlimited.
1?. DI5TMOJ?5N STAIRUGU N 0 0eE 16M M 1110 0101141 Ms Of AN 0f m)
Is. SUPPL ChIRUTAN MOTUS
ItIAn analytical model of a jet injected normally from a flat
plate into a uniform crossing flow was modified to provide animproved method of predicting the interference effects arisingfrom the complex flow fields induced by ship bow-thrusters. Thismodel is an extension of previous work based upon a descriptionof the jet as a series of distributed vortices. The analysistakes into account the position of the effective source of the.>
jet and the blockage due to presence of the jet in the crossflow.Improvement in the predicted pressure distribution on the platewas obtained by adopting a new formula for determining theeffective jet source which more closely approximates the experi-mental results. Further improvement resulted from the incorpora-tion of a symmetric foil shape to simulate the presence of thejet and its highly turbulent wake. The accuracy of the model wasevaluated for representative jet-to-crosaflow velocity ratios.Good agreement with experimental results was achieved for largeportions of the interaction field with particular improvement inthe near-field and downstream regions.
Accession For
NTIS GRA&IDTIC TABUnannouncedJustificatic
By,Distribution/_
Availability Codes!Avail and/or
D 2 I Special
DD UlU. O14'3 2
Approved for public release; distribution unlimited.
Theoretical Modeling of Fluid InteractionsProduced by Ship Bow Thrusters
by
Thomas Charles CooperLieutenant Commander, United States NavyB.S.M.E., Ohio State University, 1970
Submitted in partial fulfillment of the
requirements for the degree of
MASTER OF SCIENCE IN MECHANICAL ENGINEERING
from the
NAVAL POSTGRADUATE SCHOOLMarch, 1982
Author: 2_ __4
Approved by:
Approvd by:Thesis Advisor
---m""-Dlf frk o t aia Enlerg
Dano cence and Eginerng
3
ABSTRACT
An analytical model of a jet injected normally from a
flat plate into a uniform crossing flow was modified to
provide an improved method of predicting the interference
effects arising from the complex flow fields induced by ship
bow-thrusters. This model is an extension of previous work
based upon a description of the jet as a series of distrib-
uted vortices. The analysis takes into account the position
of the effective source of the jet and the blockage due to
the presence of the jet in the crosaflow. Improvement in
the predicted pressure distribution on the plate was obtain-
ed by adopting a new formula for determining the effective
jet source which more closely approximates the experimental
results. Further improvement resulted from the incorpora-
tion of a symmetric foil shape to simulate the presence of
the jet and its highly turbulent wake. The accuracy of the
model was evaluated for representative jet-to-crossflow
velocity ratios. Good agreement with experimental results
was achieved for large portions of the interaction field
with particular improvement in the near-lield and down-
stream regions.
4
.. ;
TABLE a' CONTENTS
. IN T O D ! CT ION .. .. . . .. . .. ... .. .. . .... . ... . .. ... 9
II. BACKROUD ---- ----- ---- 16
III. IMPROVEMENT IN TE EXISTING MODEL --- 22
IV. CONCLUSIONS ------------ 30
V. RECOMMENDATIONS FOR FURTHER STUDY ----------------- 32
APPENDIX A - DERIVATION OF THE JOUKOWSKYTRANSFORMATION ---------------------------- 53
APPENDIX B - COMPUTER PROGRAM -------------------------- 56
APPENDIX C - COMPARISON OF PRESENT MODEL WITHEXPERIMENTAL RESULTS ---------- 61
LIST OF REFERENCES -------------------------------- 113
INITIAL DISTRIBUTION LIST ------------------------------ 115
5
- . '4 ' '
LIST OF FIGURES
1. gull low pressure areas at various speeds. --------- 35
. 2. Hull suction effects vs R. ------------------------- 36
3. -Ys/Yt vs. R for a "typical" hull. ------------------- 37
4. Center of action of the suction force --------------- 38
5. Comparison of experimental findings,VR-4. -------------------------------------- 39
6. Comparison of experimentalfindings. --------- aaaaaaaaaaaaaaaa40
7. Jet axis and conforming vortex loop system. ---------- 41
8. Comparison of pressure coefficient contours,experiment vs. source corrected conformingvortex model, VR-8. ---------------------------------- 42
9. Comparison of pressure coefficient contours,experiment vs. fully corrected conformingvortex model, VR-8. -------------------------------- 43
10. Comparison of pressure coefficient contours,experiment vs. fully corrected conformingvortex model, VR-4. ---------------------------------- 44
11. Fully corrected conforming vortex model withthe effective source Z =.6VW vs. experiment,VR-8. e 45
12. Plots of coefficients of pressure alongthe freestream axis used to determine thelength of the foil. Data from (5. - ---------- 46
13. The Joukowsky transformation. ------------------------ 47
14. Comparison of pressure coefficient contours,experiment vs. present analytical model, VR=4 ------- 48
15. Comparison of pressure coefficient contours,experiment vs. present analytical model, VR-8 ------- 49
16. Comparison of pressure coefficient contours,experiment vs. present analytical model, VR-10. 50
.L
17. Conforming vortex model with a half cylinderfor blockage correction vs. experiment, VR-S.-----51
is. Comparison of theoretical values of 52 /wihexperimnetal finidingis -.------ 5t------- 5
7
ACKNOWZDMMO
The author wishes to exctend his appreciation to
Professor Robert R. kInn for his advice, guidance, and
patience during the development of this analysis. Without
his valuable assistance, it would not have been completed.
gewgaw
I. INTRODUCTION
Since man first set sail, ships and boats have been
steered by stern-mounted rudders or rudder-like devices.
The bow has been left relatively uncontrolled. As the size
of ships increased, they became more difficult to maneuver
in close quarters, as when entering port. Tug boats were
often required to provide lateral thrust at both ends of the
ship. This was a satisfactory solution to the problem for
many years. It did not provide the degree of independence
desired by ship operators, however, and other methods were
considered. Although experimental lateral thrust units were
used in the mid-nineteenth century, the first practical unit
was not installed until 1955. This unit, a through-tunnel
type bow thruster installed in the "Princess of Vancouver"
proved highly successful (1]. Since then, bow thrusters
have steadily gained in popularity. The advantages of these
uaits include providing a greater degree of maneuverability,
increased safety, increased ability to operate in rough
weather at oil rigs and research sites, and reduced tug
charges.
In the past twenty-five years, ports have become increas-
ingly crowded, labor and fuel costs have greatly increased
tug boat charges, and ships have been built that are much
larger and less maneuverable. Thus lateral thrust units
9 4
have not only become economical, but they are standard
equipment for many new-construction ships.
As more bow thrusters came into use, it became apparent
that although they work well at zero or very low forward
speed, their effectiveness drops considerably as the ship's
speed is increased (2]. In view of the large number of
these units currently installed, there is suprisingly little
information available concerning thruster/hull interactions.
Soon after the first unit was installed in 1955, it was
learned that the operation of a tunnel-type thrust unit
causes a low pressure area to form on the ship's hull [21
(see Fig. 1). To find the net resultant thrust, this suc-
tion force must be integrated over the effected area and
subtracted from the thrust of the unit. When a thrust unit
is operated, water surrounding the jet is entrained, as in
an eductor, causing a low pressure area to be formed on the
ship's hull in a small area about the jet. In addition, if
a ship is moving forward, a plume is developed aft of the
thrust unit and a system of vortices is formed. These vor-
tices induce a velocity in the water at the ship's hull,
causing a pressure drop. Additionally, the jet itself acts
as an obstruction to the flow of water past the ship, caus-
ing the flow to change speed as it passes, thus causing
another pressure variation. These induced velocity and
blockage effects are so severe that a thrust unit's
10
#1
effectiveness can drop as much as fifty percent with a speed
increase of only three knots (1].
The effects of bow thruster jet/hull interactions upon
a ship motion can be better understood by considering the
equations of motion for a ship moving in a horizontal plane.
The general forms of the equations are [31:
MUI-vi) = X Surge equation
M('+uj) = Y Sway equation
I @ = N Yaw equation
The linearized forms of these equations are sufficient
for this analysis and, making the ship's center of gravity
the coordinate system reference point, they become
respectively:
-x u (u-u0 ) + (m-x.)i x (1)
-Yv v + (M-Y )' - (Yr-mUo)r - Y = Y (2)
-N v - N-y - N r + (IZ-N.)r = N (3)
where:
m = mass of the ship
u = velocity in the x-direction (initial value u0 )
v - velocity in the y-direction
= yaw angle
r - angular velocity =
I = mass moment of inertia
A.
X a excitation forces in the x-direction
Y - excitation forces in the y-direction
N a excitation torque
Dots indicate differentiation with respect to time.
The subscripts u, a, v, ,C, r, i, denote differenti-ation with respect to the subscript variable.
The left sides of these equations contain the velocity
and acceleration-dependent terms such as added mass, added
inertia, and hydrodynamic drag. The right sides implicitly
represent the total forces in the x and y directions and the
total moment about a vertical axis through the center of
gravity. Although these terms are used to represent various
excitation forces acting on a ship due to rudders, stabi-
lizers, propellors, etc., this analysis will deal solely
with the forces and moments caused by a through-tunnel
bow-mounted thrust unit.
In the y-direction, the force due to a bow thruster may
be written as:
Y = Y + Yt s
where:
Yt , -mjuJ, the ideal jet thrust
Y = the induced "suction'force on the hull
m = the mass flow rate of the jet
uj - the jet velocity (positive to starboard).
12
Inspection of Fig. 2 reveals that -Y./Yt is nearly linear
in the Iu /ujl ratio range of .1 to .3. Using this velocity
ratio range as an example, an approximation of the right
side of equations (2) and (3) can be made. This portion of
the curves is of interest because the largest decrease in
thruster performance takes place here. Since the slope and
intercept of this line are dependent on hull shape, an
average performance curve has been plotted in Fig. 3 to
represent a "typical" hull. A straight line having a slope
of 5.3 and an intercept of -0.65 is used to approximate the
curve in the Iu /uj I ratio (hereafter R) of .1 to .3.
Thus:
-Y /Yt= 5.3R - .65
Then since
Y t -in u.
Ys inju (5.3R -.65) (4)
and
Y -uitu(1.65 -5.3R) .1 4 R 1 .3 (5)
By substituting this equation into equation (2), the
motion in the y-direction is explicity coupled to the motion
in the x-direction through the dependency upon R.
The total turning moment N is the moment produced by
the force Y acting at a distance x from the center of gravity.
13
-.
This characteristic moment arm varies non-linearly as the
ship's speed changes and is given as:
xtYt + xsYs
c Y y
where:x t - the distance from the center of gravity
to the thrust unit
x - the distance from the center of gravity
to the center of action of the hull
suction force.
Chislett and Bjorheden [2] found that xs varies linearly
with ship's speed. The curve in Fig. 4, which is adapted
from their data, has a slope of -.7 and an intercept of 1.0.
Therefore:
x5 = xt(l - .7R) R - 1.2 (6)
When equations (4) and (5) are substituted for Ys, Yt and Y,
the location of the center of action of the combined force
system is given by:
X .(3.71R2 - 5.76R + 1. 6 5 )x .1 R _ .3 (7)(1.65 - 5.3R)
and
N - YXc
14
t$
Thus the yaw equation is coupled to the sway and surge
equations. Note that equation (7) is only valid for velocity
ratios between .1 and .3 for this particular fictitious hull.
Although this analysis has been greatly simplified, it
demonstrates the complication of the relationships between
turning moments and ship's speed when a lateral thrust unit
is used. It can be seen from Fig. 2 that model tests of
each ship type are necessary in order to accurately predict
the performance characteristics of a lateral thrust unit.
With a thorough understanding of the fluid mechanics of bow
thruster systems, thrust units could be designed to reduce
the hull suction effect and thus make them more usable under
a wider range of conditions. An accurate analytical method
for predicting jet/hull interactions would be useful in
supplying this information without lengthy and costly model
tests. Unfortunately, an accurate model that can be super-
posed with other effects is not available. It is the purpose
of this thesis to propose an analytical method for predicting
the jet/hull interactions of a through-tunnel type lateral
thrust unit.
15
I1. BACKGRC UD
As demonstrated in the preceeding section, the ship's
hull/thruster interactions, when a ship has way on, can
seriously degrade a bow-thruster's effectiveness. In order
for naval architects to design a bow thruster installation
so that it can be used effectively when the ship is moving,
a complete knowledge of these effects is required. Unfortu-
nately, only a few waterborne tests have been performed.
These experiments (Fig. 2), while clearly demonstrating the
overall effects on turning ability, do not provide informa-
tion on the actual pressure distribution on the hull. For
an incompressible flow, the jet path and the induced flow
are dependent mainly on the momentum flux ratio pjU /PU2
and are relatively independent of the Reynolds number (4].
Thus an air jet injected into a crossing air flow will induce
a reaction similar to that of the water jet of a thrust unit
at the same velocity ratio. There have been a number of
studies of air jets emitted from a flat plate into a crossing
air flow in connection with the design of VSTOL (Vertical and
Short Take Off and Landing) aircraft. Notable studies have
been made by Bradbury and Woods [4] and Fearn and Weston [5).
While the results of these experimental studies are use-
ful to the naval architect when making an initial design
intended to improve thruster efficiency, they provide no
16
method for evaluating the resultant configuration. Ingthy
and expensive model or shipboard tests are required for this
purpose. An accurate and versatile analytical model of the
flow interaction effects would provide a quick and inexpen-
sive means of evaluating new designs, thereby reducing the
required number of model tests. Some empirical and semi-
empirical models have been developed. While they can predict
the pressure distributions on a plate, they cannot be easily
superposed with other effects such as a secondary jet.
Because a fluid jet injected into a crossing stream is a
turbulent, three dimensional, highly non-linear problem,
empiricism to some degree has been used in all models to
date. In this study an effort has been made to eliminate or
at least reduce the empirical inputs to existing analytical
models while improving their accuracy.
A review of available models revealed that Wooler's formu-
lation [6] minimized empiricism, requiring only an experi-
mentally determined jet trajectory. Hence his model, as
modified by Waterman [71, was selected as a basis for further
investigation.
In order to visualize the interaction field and determine
the accuracy of an improved model, once formulated, accurate
experimental results were required. A review of available
studies revealed that the pressure contours* for a given
*
In this thesis, values of local pressures, P, are expres-sed in the form of pressure coefficients, Cp, where:
p-p
P "U17
velocity ratio vary considerably from one report to the next,
as illustrated in Fig. 5 and 6. This difference is especially
noticeable in the downstream region for values of IUj/U.1
(hereafter VR) of about 4, and is present to some degree at
all velocity ratios. Figure 5 seems to imply that the induced
flow may not be solely a function of velocity ratio since the
different studies were not made at the same freestream
velocities. However, considering studies made with the cross-
flow velocity nearly equal, as in Fig. 6, it is seen that the
discrecancies are more probably due to variations in the
equipment and test procedures used. This serves to point out
the uncertainty of the available experimental results. The
results of Fearn and Weston [5] agree well with those of
other researchers over a broad range of velocity ratios.
Additionally their report was the most complete of those
reviewed. It contains not only the usual plots of pressure
contours, but also raw data, time variation of pressure
information, and a comparison with other reports. For these
reasons, the results reported in (5] were selected as the
basis for determining the accuracy of the analytical model.
Before attempting to develop an improved model, a thor-
ough review of Wooler's and Waterman's work was made in
order to understand their approaches and verify their results.
A rederivation of these basic formulations will not be pre-
sented here as it can be found in references [61 and [7]. It
was noted that Waterman's adoption of a conforming vortex
18
model was a considerable improvement to Wooler's formulation.
In the conforming vortex model the vortices are constrained
to lie within the jet rather than being tangential to the jet
axis as in Woolerts model. By making this alteration, the
horseshoe vortices are made to conform to the curvature of
the jet described by the empirical trajectory equation (see
Fig. 7):
x- B(cosh(Z/Bd) - 11 (8)
Where:
x - the distance down-stream from the jet center.
d - the jet diameter.
z - height of the jet axis above the plate.
B = trajectory parameter = .19(VR) .
The interference velocity at an arbitrary point on the
plate is determined by applying the Biot-Savart Law. The
trailing vortices are approximated as straight line segments.
As these segments become small, the linear approximation can
be made to conform to the curvature of the jet. The total
interference component at a particular point due to the
entire jet results from the sununation of all the elemental
contributions.
A comparison of the results of both formulations reveals
that Wooler's work more closely agrees with the experimental
findings of Bradbury and Woods [41 than does atermants,
19
"aI
even though the trailing vortices in Wooler's model do not
follow the jet trajectory as in the actual case. This result
is, in part, due to the fact that in Wooler's formulation the
perturbation velocity at a particular point on the plate is
caused by vortices acting at different distances from the
plate. In Waterman's model the interference velocities
result from the trailing horseshoe vortex contributions act-
ing at a single radius. Thus the interference velocities
predicted by Waterman's conforming vortex model are generally
higher and hence produce lower coefficients of pressure than
those of Wooler. In addition to modifying Wooler's model,
and noting studies by Keffer and Baines (81 and Schmidt (91,
Waterman introduced the concept of an effective origin of the
vortex sheet at a distance, Ze, above the plate given by
the furmula:
z VR15"W (9)e 15
Applying this expression to the conforming vortex model,
Waterman produced the same, if not better far-field agreement
(Fig. 8). However, the model lacked accuracy in the near-
field.
Waterman further noted that the discrepancies observed in
the upstream region can be at least partially attributed to
the blockage of the freestream flow by the jet. It was noted
that the downstream area is dominated by separation, vortex
20
shedding, and turbulent entrainment. Waterman interpreted
the blockage effect as that of a circular cylinder in an
irrotational flow. Using potential flow theory to predict
the velocity perturbations in the uniform flow caused by a
doublet centered at the jet origin, Waterman, after some
numerical experimentation, arrived at an estimate for an
effective jet diameter given by .96 4-W. The results of
this model (Fig. 9) are significantly better than Wooler's
model in the upstream region and far field. This improve-
ment was accomplished at the expense of introducing two
additional empirical relationships, the position of the
effective source and the effective jet diameter.
21
... . . . . .. . .
III. IMPROVEMENT IN THE EXISTING MODEL
Evaluation of Waterman's "fully-corrected conforming vor-
tex model" (Figs. 9 and 10) revealed that the correlation of
the analytical model with the experimental data in the area
just forward of the jet is adequate at each of the velocity
ratios reported. However, his model is accurate in the far-
field only for the velocity ratio of 8.0 and in the near-
field to the sides of the jet for a velocity ratio of 4.0.
The correlation is poor in the area aft of the jet for all
velocity ratios. It was apparent that the near and mid-
field regions, especially aft of the jet, required the
greatest attention.
In order to gain a better understanding of the effects of
the empirical inputs to Waterman's model, it was run a num-
ber of times using various values of the constants in the
trajectory, effective source, and effective diameter
equations. It was learned that small changes in the trajec-
tory parameter, B in equation (8), cause little change in
the overall pressure distribution. The correlation with
experimental data was improved at some velocity ratios while
it diverged at others for a particular value of B. A value
of B - .19(VR) 2 , as before, resulted in the best overall
correlation of the pressure distribution on the plate.
Changing the effective diameter of the jet causes
22
major changes in the near-field pressure distribution, but
has little effect in the far-field. This was expected con-
sidering the short range of the disturbance caused by a
doublet in a uniform flow using inviscid relationships. The
model proved to be particularly sensitive in both the near
and far-field regions to changes in the position of the
effective source. Since the quality of the model depends
so greatly on the effective source correction, the equation
for it was investigated more closely. t
Equation (9), the empirical formula for the effective
source height, was formulated by Schmidt [91 who refers to
Jordinson (10] and Keffer and Baines [8] for the experimental
data used as a basis for his work. The Jordinson paper could
not be obtained for review. The data presented by Keffer
and Baines, however, does not fit the equation presented by
Schmidt. The eqiu tion, Ze/d = .88fW fits the Keffer and
Baines data much better as seen in Table r.
TABLE I
COMPARISON OF VALUES OF Z e/d
ExperimentalKeffer &
VR Schmidt Baines .8
4 .53 1.59 1.60
6 .97 1.95 1.93
8 1.51 2.30 2.26
23
...
However, Ze/d can vary from .54 l'to .8 Vf and still be
in the range of the heights given in Table I. Using an
effective source location of Z /d = .8 f in the Watermane
model significantly improves the correlation. But, if
Z e/d - .6V '-is used, the correlation is much better even
without the effective diameter correction. Thus, by estab-
lishing the effective source at .6 VrVW diameters above the
plate, the full jet diameter can be used in the model and
the diameter correction is eliminated. See Fig. 11 for an
example of the improved correlation resulting from this
change.
Concentrating on the area aft of the jet, it can be seen
by comparing Fig. 8 with Fig. 10 that this area is primarily
affected by the blockage near the plate due to the jet. In
making multiple runs of Waterman's model and varying the
parameters of the vortices within the plume, it was confirmed
that they have little effect on the near-field pressures.
The far-field to either side of the jet is dominated by the
vortices within the plume. Therefore, to improve the model's
accuracy in the near-field, the analysis centered on the jet
blockage effect. Wu and Wright [11] proposed that a
fictitious afterbody exists downstream of the jet. This
afterbody encompasses the highly turbulent, three.-dimensional
flow caused by vortex shedding and entrainment of fluid
within and downstream of the jet. Outside of this area, the
fluid streamlines are fairly smooth and close to those of an
inviscid flow. With this concept in mind, consideration was
24
Roo m-'" - " '
given to using an elongated shape such as an ellipse or a
symmetrical foil to approximate the blockage effect.
In order to establish a probable shape for the afterbody,
the coefficients of pressure along the corssflow axis from
the forward edge of the jet to seven diameters aft of the
jet were plotted using the data of [5] (Fig. 12). These
pressure contours resemble those in reference [121 and [13]
for a symmetrical foil in a uniform flow. Thus a symmetrical
foil was selected to approximate the jet and the afterbody
near the plate.
To determine a length for the foil, it was assumed that
the foil should end where the coefficient of pressure reaches
an undisturbed (zero) value. It was not expected that the
coefficient of pressure should necessarily rise above zero
aft of the jet due to severe dissipation in the near-wake
region and the interference effects of the vortices within
the plume. Indeed the coefficient of pressure leveled-off
at approximately -0.1 for all available data. Therefore,
-0.1 was selected as a first approximation of the value of
the coefficient of pressure used to determine the length of
the foil. The corresponding distances from the jet center
to the trailing edge were determined to be 6.2, 3.0, and 2.5
jet diameters for the velocity ratios of 3.9, 8.0, and 10.0,
respectively.
For simplicity, a standard Joukowsky foil was selected
since it can be easily approximated through mapping methods.
25
Referring to Fig. 13, the Joukowsky transformation,
Z= + L
is used to transform the foil in the z-plane to a cylinder
in the C-plane so that the foil can be treated as a doublet
in a uniform stream. The perturbation velocities due to the
presence of the foil are then:
u [( )2 ( + a)
and
2v (C I+ a)i
Where:
u = the surface perturbation velocity in the direction
of the cross-flow due to the presence of the jet
and afterbody as modeled by the foil.
v = the surface perturbation velocity perpendicular to
the cross-flow due to the presence of the jet and
afterbody as modeled by the foil.
z = 1/4 the distance from the forward focus of the
foil (corresponding to the point (-X,O) in the
c-plane) to the trailing edge.
a - the radius of the transformed circle. This term
is a function of r, the distance from the forwardfocus of the foil to the leading edge.
26
Appendix A contains a complete derivation of the above
transformation.
The thickness of the foil is a function of both r and Z.
As described above, the foil length is a function of the
velocity ratio so that the length Z is given by:
t 6 (10)
Initially it was assumed that the forward focus of the
foil should be at the center of the jet. This makes r equal
to one-half the jet diameter. When substituted for the
doublet in the fully corrected model, this method provided
significant improvement in the downstream area. The up-
stream correlation was poor, however, since the foil was too
thick and too blunt at the leading edge. It was necessary
to adjust the value of r to provide a thinner and more
streamlined body. Next a foil with its thickness equal to
one jet diameter was tested. Using the formula, maximum
thickness/d - 5.2(m/L - .7(m/L) ) [13], where m is a function
of r. It was found that if r/d = .12d/t, where t is given by
equation (10), the thickness is nearly equal to the jet
diameter for the entire range of velocity ratios. The foil
is then moved forward so that its leading edge coincides
with that of the jet. This configuration (App. B) produced
the results shown in Figs. 14, 15, and 16 in comparison with
experimental values [51 for velocity ratios of 4.0, 8.0, and
27
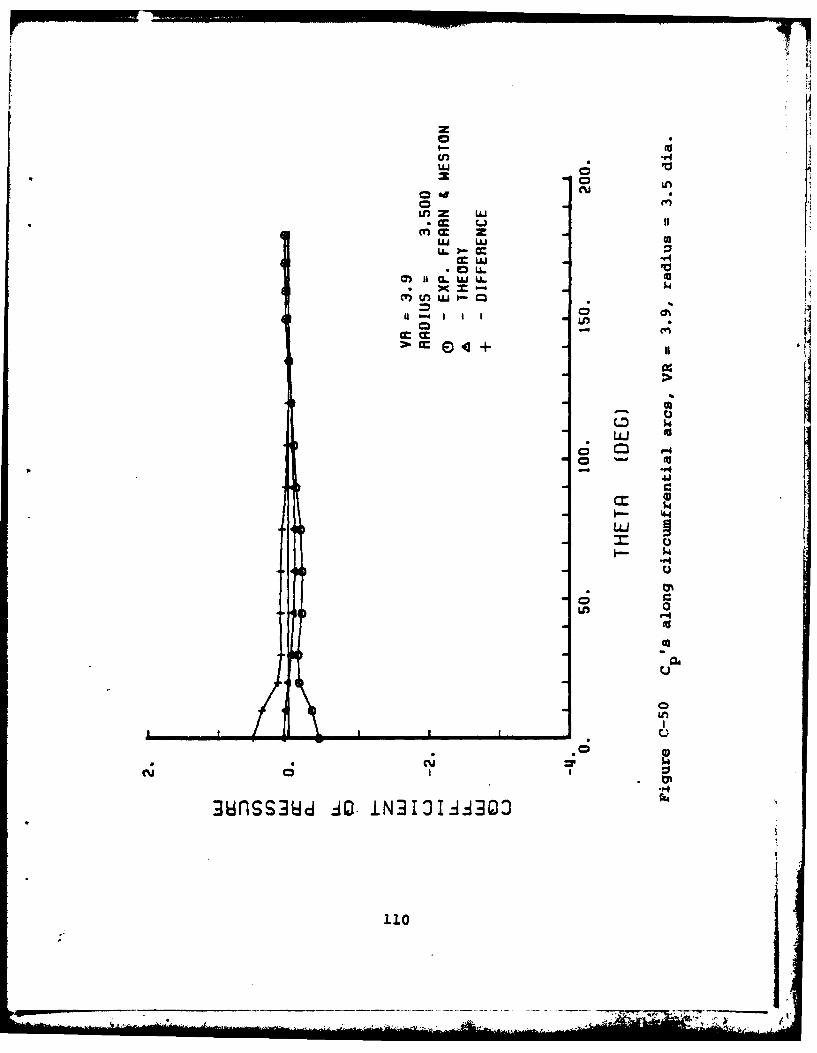
10.0 respectively. Radial and circumferential pressure
distributions for velocity ratios of 3.9 and 8.0 are plotted
against the experimental findings of Fearn and Weston (5]
in Figs. C-1 through C-52.
Attempts were made to use other fictitious shapes such
as ellipses and ovals as well as distributed source-sink
combinations. The foil shape, however, produced the best
results. So the simple relationships for the near-field
blockage effect given above were retained in the final
model.
Reviewing the results, it is seen that for a velocity
ratio of 8.0, the correlation between this model and the
experimental data is very close except in the area of
highly turbulent flow immediately aft (within two diameters)
of the jet. This is a region of uncertainty for all velocity
ratios due to the three-dimensional flow caused by entrain-
ment, vortex shedding, and other highly-viscous wake
phenomena. Since this area is small, it contributes little
to the overall thruster/hull interaction. For a velocity
ratio of 3.9, the correlation is excellent except for the
mid- and far-field regions aft of the jet centerline.
This was expected since it was determined earlier that
the blockage effect of the jet has little effect in the
far-field. It was observed that if r is such that it causes
the foil to have a circular shape at the leading edge the
correlation in the area forward of the jet is improved.
28
However, the agreement deteriorated in the areas to the
sides and aft of the jet. By varying r/d as a function of
the location of the point at which the velocity perturbations
are being calculated, the shape of the foil can be altered
so that it is nearly circular at the leading edge and becomes
thin aft of the jet centerline. This configuration worked
better, but it failed to significantly improve the overall
pressure distribution resulting from r/d - .12d/L. This
observation did lead to the idea of using a half-cylinder
shape for the jet blockage. That is, the fluid forward of
jet "sees" a cylinder but once past the jet centerline
the influence of the cylinder is rapidly diminished. The
results of this configuration are presented in Fig. 17 from
which it can be seen that while this is a significant
improvement over Waterman's model, it is not as accurate
as the full foil-shape model. It is concluded that further
improvement of the model must involve a more sophisticated
treatment of the vortices within the plume as well as the
blockage effect of the jet.
29
IV. CONCLUSIONS
As evidenced by Figs. 14, 15, 16, and C-1 through C-52
this analysis adequately predicts the pressure distribution
on a flat plate from which a jet is emitted into a crossflow.
Application of the model is limited, however, to velocity
ratios VR = 3.9 or greater. This is due to the method by
which the length of the fictitious afterbody is determined.
Above velocity ratios of about 4, this length decreases for
increasing VR, but plots of the coefficients of pressure
along the crossflow axis similar to Fig. 12 indicate that
the afterbody length should decrease also for values of VR
less than about 4. This is consistent with the observations
of Fearn and Weston. They reported that an anomaly in the
pressure distribution in the wake occurs at a velocity ratio
of 3.9. The implication is that the rate of pressure recovery
in the wake region is a minimum for a velocity ratio of about
3.9 (5].
No attempt has been made to accurately predict the pres-
sure distribution in the highly turbulent wake of the jet.
This area, having a width of about one jet diameter, extends
downstream from the jet along the crossflow axis. The pre-
dicted values of the plate pressures reported here cannot be
relied upon since most of this area is contained within the
fictitious afterbody.
30
Figure 18 shows the results of this analysis plotted as
the ratio of the induced side force to the jet thrust,
-Ys/Yt, versus the velocity ratio VR. These results are
compared with NPL pressure measurements on a flat plate and
the model tests of English [I] and Chislett and Bjorheden (2].
The slope of the predicted -Y /Y curve is approximately 5.5,s t
whereas that of the experimental data is about 5.3 for both
the flat plate and the model tests. While this analysis
predicts somewhat larger values for the overall (integrated)
interference effects, the small difference between these
slopes indicates that the nature of the relationship between
the interference effects and the velocity ratio predicted by
the analytical model is correct. Fearn and Weston did not
report overall interference effects so the correlation between
their work and the NPL experiments is not known. Since the
assumptions concerning the shape and size of the afterbody
were based on Fearn and Weston's data, the degree to which
this analysis is in error cannot be determined from Fig. 18
alone. Even with these deficiencies, it is felt that this
analytical model adequately predicts the pressure distribu-
tion on a flat plate and can be used as a first approximation
for design purposes.
31
V. RECaENDATIONS FOR FURTHER STUDY
In Chapter III it was noted that afterbody shapes other
than a symmetric foil have been tried without significant
improvement. This does not mean that this approach showed
no promise for possible improvement in the model, but only
that the actual shapes tested were not the best. It is felt
that this model can be improved by changing the shape used
for the jet and afterbody.
As reported earlier, the crossflow fluid particles near
the plate apparently see a cylindrical shape when approaching
the jet. As they pass the jet, some particles are entrained,
some join the turbulent flow within the wake, and, further
out, they pass as if the jet and wake together are a solid
object. Just downstream of the jet, along the crossflow
axis, there is an area of high entrainment. This causes a
high local pressure drop out to about one jet diameter for
VR - 8. Pressure recovery is rapid past this point. This
leads to the idea of using a shape such as:
This shape has a cylindrical leading edge, the maximum
thickness is just downstream of the jet center, and then it
32
Woon"--
narrows quickly to a relatively thin tail. The total length
is the same as that for the symmetric foil.
It is expected that this shape can be formed using the
Joukowsky transform of the existing model by varying r as a
function of the angular position of the particular point at
which the perturbation velocities are being calculated.
Although a functional relationship which will work over a
range of velocity ratios has not yet been found, it is pos-
sible that one exists. This idea might also be pursued
using panel (distributed singularity) methods.
Another area of uncertainty during the course of this
study was the empirical jet trajectory equation. Reports of
experiments to determine the jet axis provide a wide range
of possible trajectories. If the trajectory equation used
in this model is accepted as correct, the trajectory con-
stant B - .19VR2 still may not be accurate over a wide range
of velocity ratios. In particular, it is suspected that it
may be in error for velocity ratios near 4 where an anomaly
in the plate pressure distributions occurs. The cause of
this anomaly is not clear, but it is suspected that this is
the point where the jet momentum is so low compared to that
of the crosaflow that the jet reattaches to the plate within
a few jet diameters. If so, the jet trajectory would be
quite different than that which is currently modeled.
Finally, the entrainment of the crossflow fluid into the
jet is implicity accounted-for in the formulation of the
33V-2- - ..
horseshoe vortices. However, the pressure drop associated
with the jet entraining the surrounding fluid is not explic-
itly determined. This model predicts a zero pressure distri-
bution at very high velocity ratios (zero ship speed).
Further improvement of this model in accounting for entrain-
mnt is needed if it is to be used to predict the performance
of bow-thrusters in ships with no way on.
34
-o°-~
*am lin
keelVery low speed
Medium speed
4-.
High Speed Reduced pressurearea
Figure 1. Hull low pressure areas at various speeds.
35
NPLflat platelil
Chislette A
.3 BJorheden [21
.7
~m
.4 -
.3
.2 .3 .4 .5 .6 .7 .8
Figure 2. Hull suction effects vs. R.
36
* * p p
.- o
.Linear approximation
.7 - "Typical"./ hull
I .4
.3
.2
0 .2 .3 .4 .5 .5 .7 .8
u./u,
Figure 3. -¥s/Yt vs. R for a "typical" hull.
37
.3
.1.
U../Uj
Figure 4. Center of action of the suction force. [2]
38
* 0
* -'
30 E~
4 I
U 4-I I - - /
~I '4-4
C;.
.4.4
39
\l i i
C.2
00
*0 0
* gq ger r4
.. *.4;ra
urn a40
Figure 7. Jet axis and conforming vortex loop system. (7]
41
003b.
ti)
00
004
. 0 4
Q)0
*04
424
0
~~0 0
~44.4 I:
400
0 0
0 0
0 0
0 4
434
:1 1
0. 004)
UW 0e44
4
'44 -A4
W)0
0 0
to P-4
U>
ON
.-4
44
a.0U. 0
4-I
In In. 41
3 9 ~39
4
X41
14404
45-
VNId
-34
0 f
CPx-1 X/D
466
5~ 6
04.1
40
41
0
00
04~
rd
471
LIS 41
000
0 0
4-40
44t
484
m0
0@0
P.4 >W4P
44
0
W>1
0 4.1-I
$4 .4
'-4
49
ilk
Lbil
a L'
0
00
U44
U>1
0 )do 5-a
0so
-ia
I Am
0 -
44
$.4
.2'11
U>
414
.4
0
%W 0c ~0
rud
51
/NPL/ tat plate
*8Presnt /
.4 /
.3/.
.3 /U4
2 52
APPENDIX A
DERIVATION OF THE JOUKOWSKY TRANSFORMATION
The Joukowsky transformation, Z = + /c, is used to
transform a foil in the z-plane to a cylinder in the -plane
so that the foil can be treated as a doublet in a uniform
flow. The terms used in this transformation are:
Z - the complex position vector of a point in the
Z-plane Z = x + iy
c - The complex position vector of a point in the
-plane. c = + in
z - A positive real constant equal to 1/4 the distance
between the foci of the foil.
a - The diameter of the cylinder in the C'-plane.
m - The distance between the n and , axes. This is a
function of r.
r - The distance from the forward focus to the leading
edge of the foil. That is r = Ic - 20. where -c is
the abscissa of the leading edge.
C '-plane - The linearly transformed C-plane used to give
the foil thickness. C' = El + in'
From the Joukowsky transformation and Fig. 13 it is seen
that:
C= .5(Z Z 2 - 4p2) (Al)
53
.a, -- - -- . . . .. . . .. . . - . -n
M .5 Ox 1) (A2)
-(-m) + (A3)
The complex potential of a cylinder in a uniform stream
is given by:
w(cl) = U(' + a/c') (A4)
The complex velocity is then found as follows:
dw dw d ' dCM e + U - iv = =z 3 'C 3 - 2f
dwdw d'/ dZ (AS)- a ' a /aX(
then substituting
dw U W (2 a2)
.and since ' - a= -
SU. + )(A6)
54
I'
Then
2 +
2(rl + a)
U~r (A8) '
55
-J
Tq
APPENDIX B
COM4PUTER PROGRAM4
C X Xc X THIS PP.1GRAm SIM'lLATcS XC X FLUI D JET INJJECTmD INTOl XC X A UNIFORW4 CIOSSFLOW AND X
CX FURTHER DE1F:RMINES THC xCX PRES SUPr- 1) VSTR IBIIT r1 , fN X
C X THF SURqFACE rROM WHICH XC X THE JET IS FJECTF1 xc X x(1 XXXXXX XXXXXX XXXXXXXXXXXXXXXXC .
C CEFINITICN OF TER'4SCC NRAO - NUM~'BER OF Q AD! L 00SI TV)NS -!? SUPFICEC (INPUT)
C NA Mr, - N1.14BER, OF !4NG1iI %~Q POSITIONSONSURACc ~~(INPUT) O UFC
C NPGI 1NT - NUJMBER O1F aRBITRARY POIN1TS 3N SUqcACFC (NRaO*NANG)cC Ili - JET VELOCITY (TINPUT)CC UT4 - MAIN STREAM VFLqCITY (IN01IT)CC - ACTUAL fl.1?AFTF0 OF JET rnpicirF (T'PUT)Cr R. - NfJN-MT4 .NSIr~fAI PA')IAL POS!"rTrO (IF St-i;FijCmC POINTS (DI 4EN IONrD AT LEAST NR fi)) (INPUT)
c THETA - ANGU1LAP P05 ITIOj Mr SUPFACI OnrITS(:)rMFpISI0JND AT Lc4ST 14411G)
Xp - X-DOSITION OF SIJRF' CE OflpJTSC (~It"ENSIONED Ar LE:AST 1POINT)
C YR - y-OOStTTON OF SURFACE POINTSC (fl!M4ENStnNE) 4T LEAST NPI)INT)r.C x - HORIZONTAL COOR"1NATE OF JFT AXI'SC -VRIA cOD9T FJT AIC Z- FTCLC0RIAmOFJTASCC ZINC - NON-O'ENSIONAL INC.REm4FNTAL STE0 SIZE FOP. ZCC OELTAZ - Z-POSITION OF EFFECTIVEfVIRTAL SO31JQC=rC HKSAV - C1I'4ULATVE VORTICITY %LING TIF Jr-TCC xt - NATUPAL CCORO[NATE TANGr-NT Tr, JETCC ZETA - NATU.RAL COOp.DINATE NOQ AAL T1 Jr-!CC FT A - NATURAL COOPOINATO PER~PENDICULAR. Tr XTc AND ZETAC
C AL 0'4 A - &"'F 4ETWREN X-IXIS Nfl xt-NxTs
56
C PAIREA - INCRSMFNTAL PLATE AR~EACC TOTFCQ - TOTAL RESULTANT FOOCE ON PLATm-CC XRAR - X-POSITION OF RESULTANT FO Cl:
C YT -.N()MALYZED [NniJCE0 FORCECC ELL. - 1/4 THF OISTAN1CF OFTWEF! THI FOrCIC OF THIE FOIL USEI FnR THE BLOCKAGE EFFECTCC RANl - THF DISTANCE FROM4 THE FORW4RO FOCUS OF THFc FOIL TO THF LEVfING r.OGIC ZC 9 - THE CIMPLFX VELICf TY INtIIC~fl 11,1 THE UNIFORMC FLOW OUE To THF P'RESENC-C 0F THF FOIlL
C,IMPLICIT REAL'9 (A-MHfl-Z)01I1E NS I N 1J(5O,'i0) ,V(5O,'%0hW(50,5O) ,R150),THETA(50),
X VFL (4511 9CP( 509 50)OIt4Er%STCiN XP(450) YD(450),Z0(4S0)COMPLEX ZEO*16,ZSI*16ZC*6lSTP*bZ*.6,
DATA i16+Z4*169iH4*69 Z*16
READ(5960) NPADREArl(596O) NANG
6C FOIR'AT(T4)NPOINT -aNRAD*NMN
C ZcEP.o mi)T STnRAGF MATRICESO 30 1 a 1,N4P.Af03) 2 0 J - ,NAN(GU(I,J) -0.0V(I.J) a 0.0
20C*IJNT=IN.030 CONTINUc
RFAO)(5,401 jJ.(IMi,f.WRITE-(6t50) UJtUMte)
C 'JEL 0CI TY IAT?OlyR *(,JJ/IM)OrPAD(5973) ZINC
70 FnPMAT (F.5 )C SET CONSTANTS US0D IN FCIL 3LtDCKAGE CALCJLATOM~S
al. 21.0RHA *0.5
84 =*C SET 911L DARAMETERS
FLL 6.0IVRRA .12r-LL
ALAM =.5*(2.*ELLIRAD)JeOSQRtT((2.*ELL+RAOJ)**2-*4. 0*ELL**2))E4 - 0.5*(ALAM - ELL)
SF - ZcTA2**2SG, a ZFT+AB**2SH - FTPI. **ZSI = FTMI**2OA a T)sQPT(SA *Sc +. SH I
y= nSCRT(SA + SE + ST)Or ) OSQPT( SS + SF +. SH)DE = fSQRT(SB + SF +. ST)OF =OSCRT(SD +. SG +. ST)
58
rIG a nSQR T(SC + SG + SIIOH a DSCPT(So + SG + $141OK0 a OSCRT(SC + SG + Ski)CONI a (ETOL/DA - TMI/!)F)/(SA+SFCON2 - (FTDL/r)C -ET4I/flFl/(sg Sr-)CO hI 3 a( X1'13 A R2 /1)F - X IB AQ I G)f(SG +SI)
C C3N4 - (XIBAP2/04 - +1A1O[/S SH)
Ut aZETAI*CON.U2 a UTA2*CON24V3 : ~TA8*C01N3
WI XICNF*CONIW2 XI'!,Of*CfY42W3 a!T! ETI *.fN3W4 F TOL*C0N4+
200 FOP'4AT(' ',23XF6.2,2XF8.,2,3X,F6.2,4XpF-6.2)210 CINTINUF220 CriNT !N'IE230 FOrRMAT( .11,2X, I ESULTANT FORCr- r.f: 1 IX r 17.2v IX,
X'ACTS AT X = ,F6,2)240 rFF.AT ,'O'92X, Y/T = 6,62,tX,#FlR tiJmpij 4,F6.31
250 FlPMAT(3F20,41270 STnP
;?lj o
60
ui w
Wf LiU -
0z M w 0 L i0 j L-4
R~ N. 64= U
_ G)
0 cc.U.
C*2 *~, ~c __ 10
o ~ LU =
xus 3 c rQ iN I 'IJQ
61J
z
LLLI
0z u
or C0 z uia
w U.
0 L 0
Lo
cc 4
(A
3unsS3UdC! ADI3OIA0
62~
zU
in U;
0z U)
=, W0LU UJ
02 LU 4
OUJ LU
LU Z
+ M
V)
$4
- ON-
0*1.4
02
* 0
63I-
UU
0 0)
U. U,-
.j z
OuJLO
CC)
64-
Ai - '
LIMi
U->-0 1
0 U-
oz uj1*LJ z
=U cc* ~ELL 0
*~u~ -~V *
* II )CM
~C r-4O
C 0
IF4
- (A
C;
656-
0 z u0Z 0o
0 x4
wcc
00
OWU 0U4-
cou~~~ *4
0ws3c ADi3OIA0
66 LLL
...( .. . S
LU
LL L U
CC U.1
oc*i z
ww CCE) A
o O~L>
(I-$-
'-4
0
0
Up
67
z
(7 L. 0
CD U,
zj
0m C.2>- E) -4 c
ow u~ * nco
~ U~t-t-L
04
I -
3unss~u Aoi33IA0
68'
CD
z 000
0 0
z 0
.~ CC u
LA-0
CL W- LL.
,ei iw iiJ
U.1
C
-)
'-4cu "-
0
z; ILI
36ns~uj D igIOIA300Q
69
CON
LL0J
z u X
C.LJ LL 4
0- 1 0
.CLr4
0 O..W~t.ti
L&J10 Cill- I I0
Lu4
~Y, 54
.4
700
Lf))x .
Lo
0 z LLJ -. C L)
0~~ U.I* NIM )(J Li-9.
ciD L 1.- 0 LLI
U.1 z
0 0G
-J4p-I
- 0cc *.4
0
0j
3unsSUJ ADiN313AA303
710
w, z
LU U
zi
(0 0o to
o~to
u 0
3uSSU zO iNi [130(1~rat
72~
(D
1
0
OZ Ll
0~
~LU0 cc
LU Z -%
V)
-
-r4
0
'-4
cv a
3unS6 AD II A30
73
I-I
fl- U'
o 4J
~LU U
Lu z I
94
04
9.4
3unSSUJ JOiN3IJJJ30
74U
CON
00
z - I=
La 0;
0
b--4
u00
0z I~i _ A
3usSUc AD iNIOAA
75W 4
AgC)
C~
w 0icc o
nI
Al4
cm 0
(..D
LU 4
onr-4 0
r4
$-4
Lcu"
3unSSUJ JOiN3IOAA34
76.
ULJ
Ln 0rz ui r
.
UnLJ I- t
III
0110Ua;
U7 0
V-1w
4
3unss~~~ui joi3-IJO
77,*
CjC
U,,Qz 0
z r-4Lu LUJ
LL
U-I
* t
0 U,
LU
I- a.4
3unsSUJ J iN3OIAA03 P
782
0
U, U
LlU
a: 0
0~ to 'U-t
.OLL.
~ 0
0 Li~- I
Im1,3unS3HJJO N31OAA30 ."
79)
z
L&J 0 EU
0 U0 o u J
t I I CL2I
U, $
Occ r.. I.U.
0 L0
It
C4.
3unS3HJ D i313IA30 rA
80u
imam
=z
OZ LL.L
C u C L UL-0
MLL)
LLJ It
w 04
00
0 D0-
3unsS8J ADiN313AA30
81n
LLJ
U. =u uz
LU LU
ccI
.4
0 - r-
LU 4
04
N
824.
0 z u 0
U. m
X =LL. I.-
~~U7crw
0 ULWa+
* .4-I~nUJ~0 *
00
3H~nS3U8AO i3I3IA30
LU o
c , Zl LkAI.
LU LU
~L4J41
$4 0
ImIn 9:
0Ar I.
o ~to
36nss~~~yj Aoi3OIA0
I-IU,
0 U0
oG
ez OfA.~U-1
1- 1 I
>i 04+
tn
1i~ $4o z
ouSSU AOi-IOAA
850
Cu0
L U
Oil LLULL
0 In-
E)i
LU e
(1
044
4
ai
Ln 00
04
C4
fl9SS3Ud .A iN]IJIAA3OO
86
-A- -- ----
u-1
C* U-
ItI
oLA z'LU LU
OU-~ * >
~~CD
IP-4CT) U04
II Icz
3unsSLU JOZ3OIA0
87 ~
U7'
CczLL - =
LL,U9-
a! (Z L LL.4X = - C
m W Ui *. J
LU z
~~LO.OLL M
3unS3U AOJI LUOAA0
L.-, W.-
CCm
LL0)
0 U0
.1j U, 0
U
E) 4 +LL
* II )-4
cc IIll-I 0-I
wM
- 0
3unSS3Ud~~ ADi3OIA
89.
w4Ul
cn'
0 U.
CLU.1 U.
0n 0. . L
it -I I I.U z
O ~cc >
E)) A
14)
r-
.4
cu rn
0
o to
3wflS3Yd AD iN3IOIAA300
90
4J4
U.1.
41
zt 0 0
LU z~ >1cc
S A + n0;
LU 0
UnsS3HJ JO iN13(A0
91
4)
0z 0o V
= 0i
.LI z
i~lC i rI
r-4
0
ru -4
3unsSUcJ O A31I A0
92-
LU Ln r
I-
z H
00
OZ OA
0Cc i
3unsSLHJ LUi3OIA0
93x
L-))0 w
U4,
0 U
OL w LU .w C4
LUO
C3)
c- Ucc
-4
94-
-7
CD 0
4
zj zcLA
LU"
CVI
"33o 4J-
3uS38J iNL3JAOLU I
95 4 1L
AD-AL15 718 NAVAL POSTGRADUATE SCHOOL MONTEREY CA F/G 20/4THEORETICAL MODELING OF FLUID INTERACTIONS PRODUCED By SHIP BOWETC(U)MA R 82 T C COOPER
UNCLASSIFIED
26I.."..000
IAJ 4
uj. - 4
0 U.
I.e I IIoi z 10= cc
E) +I0~ 2LO
c~Iw "U
.1134
Itl
- P4
969
U.S l
LUJ
z i
L4 L.)4u z C3
=. O LLA
41 c ) W I 0 L
LU z
0
04
'U
awSSU ADi3OIA0
97U
0 z u0CC w 0
M 0 4
0 U
OZ LU
0CZ >
- S
C~i WI-4 P4
- 04
CU
gunsS3U8~ ADI33IA0
980
CDp
ui0
0000
0 = u0
w U, w~
WWU.
ty; uLj L C
U.S z I~eCC >?
E) 4 +
3wnSS3UJ AD INIOAA
99U
14
0 z -4
0 U0
11X C4
LU z -
0-4
0
100 1
Nita"
U.1
z wCO
U. - =
UUw 1.2
3 CC
N)
10
w
0 cc
U.U
0 11C'4uU
LL)
* V4o '4
0
--to
42
10.2
00
f-z LU
0 LL.
* 1C4
- U
$4
44
r-4
iJ.J
103
=1 71
U.
4"~ ~ N L0iU
~LIJ
-P4
00
0 U0
104
uI,CC
w 0i
0) t LAJ LA r4X00 qs
H' LU
zip~9. 1
LU 44
U4
~I.LJ
00
1051
CC
CC Wuj Cu
= -j0D U.)
~LU .14
U7 0
r 4
C4.
1060
z L C
=Z LU0* 0 U-P
(D Z1 tLL LLU ( LU
~LL)O~IILU+
00
a%.r
3unsS368~W NOi3OIA
107U
0=
U! E
ui 0
cn uxi0-0
.4
0 - 0
-r-4to
uJczo
3uns~u~iAD I3IOIA3o
1085
LI
UY
0 z u0
0ZJ LUI
*LL.
n~ a_ .. L L.R
0 =
LU C
E) 44
C3 14
M
109%
LU * V
nJn
onzu
m 11 O. LULL. w
0
CC C
__
Lu J 0o '-4
3wnss~~~wI- AD 53OI41
1100
C%
CC 0
U- =0j
0 t . J U.
LD Umu~LLJ~-0
U.,
II
3unSS3UJ~u JOI3OA300
-- --- -
zC
0 .
u, iUJLU.
X =. LULA - 0
54
04 -
14
4
1124
77 4.4-
LIST OF REFERENCES
1. English, J. W., "The Design and Performance of LateralThrust Units for Ships, Hydrodynamic Considerations",R.I.N.A. Quarterly Transactions, Vol. 105, 1963
2. Chislett, M. S. and Bjorheden, 0., "Influence of ShipSpeed on the Effectiveness of a Lateral-Thrust Unit"Hydro-og Aerodynamisk Hydro-og AerodynamiskLaboratorium Report No. Hy-8, 1966
3. Principles of Naval Architecture, S.N.A.M.E., 1967
4. Bradbury, L. J. S. and Wood, M. N., "The Static PressureDistribution Around a Circular Jet Exhausting Normallyfrom a Plane Wall into an Airstream", C.P. No. 822,British A.R.C., 1965
5. Fearn, R. L. and Weston, R. P., "Induced PressureDistribution of a Jet in a Crossflow" NASA Technical
* Note NASA TN D-7916, 1975
6. Wooler, P. T., "On Flow Past a Circular Jet Exhaustingat Right Angles from a Flat Plate or Wing", Journal ofthe Royal Aeronautical Scoiety, Vol. 71, No.-75,T- 97
7. Waterman, B. W., "Analysis of Jet-Crossflow Inter-actions with Application to Ship Bow Thrusters",Unpublished thesis, Naval Postgraduate School, 1980
8. Keffer, J. F. and Baines, W. D., "The Round Turbulent Jetin a Crosswind, Journal of Fluid Mechanics, Vol. 15, 1963
9. Schmidt, H., "Anderung einer Parallelstromung entlangeiner ebenen Platte durch einen quer gerichtetenFreistrahl", Zeitschrift fur Flugwissenschaften undWeltraum forschung, Sept/Oct 1979
10. Jordinson, R., "Flow in a Jet Directed Normal to theWind", R&M No.3074, Brit. A.R.C., 1958
11. Wu, J. C. and Wright, M. A., "A Blockage-SinkRepresentation of Jet Interference Effects for
* Noncircular Jet Orifices" Analysis of a Jet in aSubsonic Crosswind, NASA SP-218, 1969
113
INITIAL DISTRIBUTION LIST
No. Copies
1. Defense Technical Information Center 2Cameron StationAlexandria, Virginia 22314
2. Library, Code 0142 2Naval Postgraduate SchoolMonterey, California 93940
3. Department Chairman, Code 69 Mx 1Department of Mechanical EngineeringNaval Postgraduate SchoolMonterey, California 93940
4. Professor R. H. Nunn, Code 69 Nn 5Department of Mechanical EngineeringNaval Postgraduate SchoolMonterey, California 93940
5. LCDR Bradford B. Waterman 1
468 Oak StreetEast Bridgewater, Massachusetts 02333
6. LCDR Thomas C. Cooper 11535 Green Valley RoadOrangeburg, South Carolina 29115