Uncovering neutrinos from cosmic ray factories: The Multi Point Source method Yolanda Sestayo a,⇑ , Elisa Resconi b a Departament d’Astronomia i Meteorologia, Universitat de Barcelona (IEEC-UB), Martı ´ i Franquès 1, E-08028 Barcelona, Spain b Technische Universität München, Excellence Cluster Universe, Boltzmannstr. 2, D-85748 Garching, Germany article info Article history: Received 5 November 2012 Received in revised form 30 December 2012 Accepted 2 January 2013 Available online 11 January 2013 Keywords: Neutrinos Galactic cosmic rays Spatial correlations abstract We present a novel method for the search of high energy extraterrestrial neutrinos in extended regions. The method is based on the study of the spatial correlations between the events recorded by neutrino telescopes. Extended regions radiating neutrinos may exist in the Galaxy due to the hierarchical cluster- ing of massive stars, the progenitors of all the Galactic accelerators known so far. The neutrino emission associated to such extended regions might be faint and complex due to both the escape of cosmic rays and the intricate distribution of gas in the environment of the accelerators. We have simulated extended neutrino emission over an area of 10 10 , where the intensity fluctuations across the region are mod- elled as a Gaussian random field with a given correlation structure. We tested our proposed method over realizations of this intensity field plus a uniform random field representative of the spatial distribution of the atmospheric neutrino background. Our results indicate that the method proposed here can detect sig- nificant event patterns that would be missed by standard search methods, mostly focused in the detec- tion of individual hot spots. Ó 2013 Elsevier B.V. All rights reserved. 1. Introduction The search for the sources of cosmic rays is one of the most standing issues in high-energy astrophysics. Major advances in the field during the last years have been realized by the consider- able number of instruments dedicated to Galactic cosmic ray stud- ies [1–6]. The on-going measurements of the cosmic radiation from the Galaxy [7–9] are helping to construct a comprehensive picture about the sources of cosmic rays, the mechanisms of propagation, and the interaction of cosmic rays with the gas and radiation fields of the Galaxy [10]. Currently, gamma-ray astronomy has a leading role in the exploration of the sky at the very high energies. Mea- surements of the spatial and spectral distributions of the diffuse Galactic gamma-rays provide information about the propagation and interaction of Galactic cosmic rays [11–13], whereas localized excesses of gamma-ray emission with respect to models of cosmic ray propagation can be interpreted as the result of cosmic ray interactions in regions of enhanced matter density (which are be- low the spatial resolution of current cosmic ray propagation mod- els), or due to the presence of Galactic accelerators injecting high energy particles which interact close to their sources of origin [14–17]. The GeV gamma-ray diffuse emission is being measured by the Fermi satellite [7], showing that gamma-rays are produced throughout the Galactic disk by the interactions of cosmic rays with the gas and radiation from the interstellar medium, after their diffusion in the Galactic magnetic fields. The Galactic TeV diffuse emission is within reach of ground Cherenkov telescopes like H.E.S.S. [18] and Milagro [19], instruments which also have pro- vided the first evidence of particle acceleration up to TeV energies from a number of individual sources [20]. Further progress is expected in the upcoming future with neutrino detectors such as IceCube [21]. In the energy range 300 GeV < E < 10 PeV, the IceCube experiment at the South Pole uses the Earth as a filter to observe neutrinos from the whole north- ern sky. Its large field of view and dynamic range offer a unique opportunity to unveil the sites of both production and interaction of the high energy cosmic rays from the Galaxy. As in the case of ha- dronic gamma-rays, neutrino emission implies the efficient acceler- ation of cosmic rays in Galactic sources, as well as their interaction with matter and radiation. Surveys of atomic and molecular gas [22,23], combined with infrared and optical data, have provided large-scale maps of the Milky Way’s stellar and gas distribution with unprecedented spatial resolution [24], despite the uncertain- ties in the distance estimations. From these observations we know that the progenitors of all the Galactic accelerators known so far, massive stars, are not located at random within the Galactic disk, but rather showing a hierarchical structure. All present-day star formation appears to take place in giant molecular clouds. Massive open star clusters do not form in isola- tion, but tend to be clustered themselves in the so-called clusters complexes [25], associated with giant molecular clouds following 0927-6505/$ - see front matter Ó 2013 Elsevier B.V. All rights reserved. http://dx.doi.org/10.1016/j.astropartphys.2013.01.001 ⇑ Corresponding author. E-mail address: [email protected](Y. Sestayo). Astroparticle Physics 44 (2013) 15–23 Contents lists available at SciVerse ScienceDirect Astroparticle Physics journal homepage: www.elsevier.com/locate/astropart
Transcript
Astroparticle Physics 44 (2013) 15–23
Contents lists available at SciVerse ScienceDirect
a Departament d’Astronomia i Meteorologia, Universitat de Barcelona (IEEC-UB), Martı́ i Franquès 1, E-08028 Barcelona, Spainb Technische Universität München, Excellence Cluster Universe, Boltzmannstr. 2, D-85748 Garching, Germany
a r t i c l e i n f o
Article history:Received 5 November 2012Received in revised form 30 December 2012Accepted 2 January 2013Available online 11 January 2013
We present a novel method for the search of high energy extraterrestrial neutrinos in extended regions.The method is based on the study of the spatial correlations between the events recorded by neutrinotelescopes. Extended regions radiating neutrinos may exist in the Galaxy due to the hierarchical cluster-ing of massive stars, the progenitors of all the Galactic accelerators known so far. The neutrino emissionassociated to such extended regions might be faint and complex due to both the escape of cosmic raysand the intricate distribution of gas in the environment of the accelerators. We have simulated extendedneutrino emission over an area of 10� � 10�, where the intensity fluctuations across the region are mod-elled as a Gaussian random field with a given correlation structure. We tested our proposed method overrealizations of this intensity field plus a uniform random field representative of the spatial distribution ofthe atmospheric neutrino background. Our results indicate that the method proposed here can detect sig-nificant event patterns that would be missed by standard search methods, mostly focused in the detec-tion of individual hot spots.
� 2013 Elsevier B.V. All rights reserved.
1. Introduction with the gas and radiation from the interstellar medium, after their
The search for the sources of cosmic rays is one of the moststanding issues in high-energy astrophysics. Major advances inthe field during the last years have been realized by the consider-able number of instruments dedicated to Galactic cosmic ray stud-ies [1–6]. The on-going measurements of the cosmic radiation fromthe Galaxy [7–9] are helping to construct a comprehensive pictureabout the sources of cosmic rays, the mechanisms of propagation,and the interaction of cosmic rays with the gas and radiation fieldsof the Galaxy [10]. Currently, gamma-ray astronomy has a leadingrole in the exploration of the sky at the very high energies. Mea-surements of the spatial and spectral distributions of the diffuseGalactic gamma-rays provide information about the propagationand interaction of Galactic cosmic rays [11–13], whereas localizedexcesses of gamma-ray emission with respect to models of cosmicray propagation can be interpreted as the result of cosmic rayinteractions in regions of enhanced matter density (which are be-low the spatial resolution of current cosmic ray propagation mod-els), or due to the presence of Galactic accelerators injecting highenergy particles which interact close to their sources of origin[14–17]. The GeV gamma-ray diffuse emission is being measuredby the Fermi satellite [7], showing that gamma-rays are producedthroughout the Galactic disk by the interactions of cosmic rays
diffusion in the Galactic magnetic fields. The Galactic TeV diffuseemission is within reach of ground Cherenkov telescopes likeH.E.S.S. [18] and Milagro [19], instruments which also have pro-vided the first evidence of particle acceleration up to TeV energiesfrom a number of individual sources [20].
Further progress is expected in the upcoming future withneutrino detectors such as IceCube [21]. In the energy range300 GeV < E < 10 PeV, the IceCube experiment at the South Poleuses the Earth as a filter to observe neutrinos from the whole north-ern sky. Its large field of view and dynamic range offer a uniqueopportunity to unveil the sites of both production and interactionof the high energy cosmic rays from the Galaxy. As in the case of ha-dronic gamma-rays, neutrino emission implies the efficient acceler-ation of cosmic rays in Galactic sources, as well as their interactionwith matter and radiation. Surveys of atomic and molecular gas[22,23], combined with infrared and optical data, have providedlarge-scale maps of the Milky Way’s stellar and gas distributionwith unprecedented spatial resolution [24], despite the uncertain-ties in the distance estimations. From these observations we knowthat the progenitors of all the Galactic accelerators known so far,massive stars, are not located at random within the Galactic disk,but rather showing a hierarchical structure.
All present-day star formation appears to take place in giantmolecular clouds. Massive open star clusters do not form in isola-tion, but tend to be clustered themselves in the so-called clusterscomplexes [25], associated with giant molecular clouds following
16 Y. Sestayo, E. Resconi / Astroparticle Physics 44 (2013) 15–23
the spiral arms of the Milky Way disk [26–28]. De la Fuente Marcosand De la Fuente Marcos [26] found statistical evidence of the exis-tence of at least five dynamical families of young and massive openclusters in the solar neighborhood (distance <2.5 kpc), which mayextend up to 10 degrees in Galactic longitude. The relevant sce-nario for high energy astronomy is one in which we can find groupsof stellar open clusters in an evolutionary stage in which the com-bined winds of massive stars and supernova explosions dominatethe energetics of the region. This establishes the existence of po-tential Galactic cosmic ray factories in regions of massive star for-mation [29] which may well extend several degrees in the sky,possibly affecting the spatial distribution of neutrino events re-corded with neutrino telescopes.
In this paper we focus on the potential of neutrino telescopessuch as IceCube to detect a significant neutrino event pattern asso-ciated with these active regions of the Galaxy. This could point tothe location and distribution of Galactic cosmic ray and neutrinosources during the first years of the IceCube experiment, when sen-sitivity might be still too limited for the detection of individualsteady point-sources.
A possible neutrino emission in these regions may show anintricate, and likely faint, intensity pattern, due to the complexstructure of the matter in regions harboring massive stars. Onone hand we have the clustering of potential accelerators, wherehigh energy cosmic rays are originated, and on the other handthe available target for cosmic ray interactions, consisting of thegas left from the parent molecular cloud, which has not been usedfor star formation nor evacuated from the region by the radiationand winds from the stars and supernova explosions.
Both observations and theory about the spatial structure of themolecular and atomic gas in a large range of environments haveshown that it presents some degree of spatial correlation, usuallycharacterized in terms of the power spectra [30,31]. The causesof the observed spatial correlations are manifold, but large scaleturbulence and some local effects like the radiation pressure andwinds from the massive stars and supernova explosions are themost important [32–35]. These effects produce spatial fluctuationsin the gas density, which in turn, may contribute to the fluctua-tions of a possible neutrino signal inside an area populated withcosmic ray sources.
We offer here an alternative to the search of these potentialGalactic cosmic ray factories, in a situation in which little knowl-edge about the high energy processes taking place is available.We introduce here the use of analysis of the spatial correlations be-tween neutrino events for the discovery of Galactic cosmic raysites. We will study the advantages and potential of correlationanalysis with respect to standard searches for neutrino sources.The method presented here and the standard search methods aretested on simulated event patterns, in which the physical originof the possible neutrino signal is translated into statistical proper-ties of the neutrino intensity field.
Modelling the exact characteristics of a possible neutrino inten-sity field in a particular region of the Galaxy is out of the scope ofthis paper, and the examples considered aim to illustrate the per-formance of search methods. Within the region under study, we as-sume that the fluctuations in the intensity of the neutrino signalvary spatially according to a Gaussian random field with a givencorrelation structure. The last source of neutrinos we consider isthe isotropic foreground of atmospheric neutrinos, the statisticsof which is consistent with a uniform Poisson distribution.
The paper is organized as follows. In Section 2 we describe thesimulations of the event pattern. In Section 3 we present our pro-posed method for the analysis of extended regions. Section 4shows the performance of both our correlation method and stan-dard search methods from the results obtained with the simulatedevent patterns. Section 4 has the discussion.
2. Simulations of the event pattern
An event pattern consists of a set of event locationsr ¼ ðri; rj; . . . ; rNÞ within a region (R), at which N events have beenrecorded. In the simplest case, the data set comprises only theevent locations. However, in some cases we may have additionalinformation related to the events which might have a bearing withthe nature of the analysis. For instance, the arrival time of theevents, for analysis of variable sources [36], or the energy of theevents for a higher signal to noise discrimination power [37]. Thesecases correspond to what is known as marked point pattern.Although this information can be incorporated in any analysis, inthis paper we have not considered marks in the event pattern,and we focused only on the spatial distribution of events.
2.1. Simulations of the astrophysical neutrino signal
A spatial event pattern can be thought of as the realization of aspatial process. In many astrophysical scenarios, such physical pro-cesses depend on random components, and they are usually mod-elled in terms of random fields [39].
We adopted a Gaussian random field with a given correlationstructure for the intensity fluctuations of a possible neutrino signalinside a region that is much larger than the angular resolution ofthe experiment.
If the field is Gaussian, we can determine it completely given itsmean and correlation function (or power spectrum), which facili-tates the simulations. The starting point of the simulations ofGaussian random fields is the convolution of the power spectrumof the field with a white noise (i.e., correlation free) random signal[40]:
IðrÞ ¼Z
d3keik�rffiffiffiffiffiffiffiffiffiffiPðkÞ
qWðkÞ; ð1Þ
which gives the intensity of the field at each point r from the powerspectrum PðkÞ, related to the spatial correlation function CðrÞ by theFourier transform: PðkÞ ¼ F�1CðrÞ. WðkÞ is the white noise, whichgives the random amplitude and phase to the field.
If the angular extent of R is large, a spherical harmonic decom-position of the field would be needed. In this case, the field wouldhave the spectral representation:
IðrÞ ¼X1l¼0
Xl
m¼�l
al;mYl;mðrÞ; ð2Þ
where Yl;m is a basis of spherical harmonics, and the coefficients al;m
are complex uncorrelated random variables that depend only on thecovariance or power spectrum of the field Pl.
In our examples, R is small enough as to assume Euclideanspace. We generated the Gaussian random fields through Fourierphase randomization by discretizing Eq. (1) with a Cartesian meshdefined over R. For simplicity, we assumed that R is a square regionof length L = 10�, and used a mesh of 512�512 nodes, giving a 0.02�
sampling interval of R, much smaller than the angular resolution ofneutrino telescopes.
The sampling of R is done in Fourier space directly assuming apower spectrum for the intensity field. The Fourier domain is com-monly used in the simulations of random fields because the ran-dom variables at different points are statistically independent,whereas in the spatial domain they have long-range correlationsthat are difficult to sample.
For simplicity, we assumed an isotropic, homogeneous randomfield; that is, the correlation between two points r1 and r2 dependson the lengths ¼ jsjof the vector s ¼ r1 � r2, but not on its direction.We adopted a power-law power spectrum PðjkjÞ ¼ ðaþ jkj2Þ�b,which has an associated covariance function described also by a
R. A. (deg)300 301 302 303 304 305 306 307 308 309 310
dec
(deg
)
30
31
32
33
34
35
36
37
38
39
40
-120-100-80-60-40-20020406080
Fig. 1. Realization of a Gaussian random field with power spectrumPðjkjÞ ¼ ð1þ jkj2Þ�2 over the 10� � 10� region used in our examples. In this specificrealization units are arbitrary, the intensity of the field is normalized with respectto a reference value. In the following examples the signal will be normalized to agiven number of events.
Y. Sestayo, E. Resconi / Astroparticle Physics 44 (2013) 15–23 17
power-law plus an exponential decay, with a; b as the parametersthat regulate the decay rate of the long range correlations with dis-tance: CðsÞ / sb�1e�as.
Fig. 1 shows a realization of an isotropic, homogeneous Gauss-ian random field with the power spectrum described above witha ¼ 1; b ¼ 2. In Fig. 1 the color scale has arbitrary units, but the ob-tained spatial distribution was used for the representation of theastrophysical neutrino signal, where the intensity will be normal-ized to a certain number of signal events in the final data sampleof neutrino telescopes. The test region over which we inject thesignal is defined in the range in equatorial coordinates30� < dec < 40�, 300� < R:A: < 310�.
The instrumentation introduces an additional correlation in theintensity pattern due to the errors in the reconstruction of theevent directions. Therefore, for the analysis of the event patternin section we convolved the signal field of Fig. 1 with the PointSpread Function (PSF) typical of neutrino telescopes. The effect ofthe PSF is to smear the signal over some area, according to itsshape. We assume the PSF has a Gaussian profile with r ¼ 1, whichcorresponds to a median of 0:7�, similar to what is expected for theIceCube neutrino detector [41].
2.2. Simulation of the background of atmospheric neutrinos
A simulated sample consisting only of atmospheric neutrinoevents was constructed injecting uniform random events on asphere. In reality, atmospheric neutrinos reach the detector witha zenith dependent component [42], but within a declination bandof � 10� scales like in the examples we consider here, the spatialdistribution of atmospheric neutrino events in the final sample isuniform random, where the intensity at each point follows a Pois-son process.
A total of 50,000 background events were injected randomlythrough the northern sky, a number which could be representativeof the total atmospheric neutrino events with E > 500 GeV ex-pected for the IceCube detector in its final configuration. This pro-duces and expectation of 207 background events in the 10� � 10�
region within the declination band 30� < d < 40� that we have con-sidered in our examples.
3. Analysis of the spatial correlations: the Multi Point Sourcemethod (MPS)
Methods to account for the spatial correlations in the data areextensively used in astronomy [43], starting from the work of Pee-
bles and co-workers to study the large-scale matter distribution inthe Universe through the two-point correlation function of galaxies[44]. In high energy astrophysics, the searches for correlations inthe data have been applied mainly to detect anisotropies in thespatial distribution of cosmic-rays [45,46] and neutrinos [47].
The most commonly used estimators for the two-point correla-tion function in astronomy are based on pair counting (see Ker-scher et al. [48] for a comparison of different estimators).Following the notation of Szapudi and Szalay [49], the number ofevent pairs within a distance r is defined as
PDDðrÞ ¼Xx2D
Xy2D
Wrðx; yÞ ðx – yÞ ð3Þ
PRRðrÞ ¼Xx2R
Xy2R
Wrðx; yÞ ðx – yÞ ð4Þ
where the summations run over event coordinates in the data sam-ple D, and in a sample R of randomly distributed events. Wrðx; yÞ ¼ 1only if a certain pair selection criteria are satisfied in the real (ran-dom) sample, and is equal to 0 otherwise. After the normalization ofthe number of pair counts:
DDðrÞ ¼X
PDDðrÞNðN-1Þ ð5Þ
RRðrÞ ¼X
PRRðrÞNRðNR � 1Þ ð6Þ
with N and NR being the total number of events in the real and ran-dom sample, the so-call natural estimator of the two-point correla-tion function, gn, is:
gnðrÞ ¼DDRR� 1 ð7Þ
which represents the excess probability, with respect to a randomdistribution, of finding an event at a distance r of another event.
In this section, we introduce this formalism for the detection ofhigh energy neutrinos from an extended region. The classical two-point correlation function method, briefly described above, wasadapted to our specific case and optimized for discovery. The aimof our method is to determine whether the observed spatial prop-erties of neutrino events inside the area under investigation arecompatible with those expected from a distribution of back-ground-only events (atmospheric neutrino events), or if an extra-terrestrial component has to be invoked in order to explain theobservations, and at which level the background-only hypothesisis rejected.
Due to the differences our approach poses to the natural defini-tion of the two-point correlation function, we defined our test sta-tistics as a clustering function, and in what follows we will refer toour proposed method as the Multi Point Source (MPS). Here we de-scribe how the MPS method is defined.
Let R be the region under study, in which a total number ofNinside events have been registered in the final data sample at thelocations (r1; r2; . . . ; rNinside
), defined by the coordinates ri ¼ ðhi;/iÞon the sky. MPS makes a two-point sampling of R with circular binsof variable area A = pH2 centered at the locations of each of theevents inside the region, ri. In the sampling of the region, the angu-lar distance, Hij, from an event i located inside R to an event j (atany location) is measured for each of the Ninside events present inR (i = 1; . . . ;Ninside; j = 1; . . . ;Ntotal). The number of pairs ij is mea-sured as a function of the angular separation and the histogramof event pairs as a function of the angular distance H is constructedfrom these measurements.
The analysis then makes use of a scale dependent cumulativeclustering function, UðHÞ, defined as the excess, with respect tothe null hypothesis, in the number of event pairs within a certainangular distance H:
18 Y. Sestayo, E. Resconi / Astroparticle Physics 44 (2013) 15–23
UðHÞ ¼RH
0 DDðHÞdHRH0 RRðHÞdH
ð8Þ
where DDðHÞ ¼P
ijDDij;RRðHÞ ¼P
ijRRij, and the sum runs over allnon-repeated pairs in the real data sample and in the backgroundcase, respectively. In our case, DDijðRRijÞ ¼ 1 only if either the eventi or the event j, or both, are within the region under study, and it isequal to zero otherwise. That is, MPS does not correlate events withspecific locations, but rather it considers each event inside the re-gion as a point source in order to determine its degree of correlationwith the rest of the events. This feature is precisely what names themethod as ‘‘Multi Point Source’’. With this definition we measureboth the intensity of the process that generated the observed neu-trino event pattern as well as its correlation structure.
The ultimate result of the analysis in neutrino telescopes is thep-value of the observation, that is, the probability that the ob-served event pattern is just a realization of the atmospheric neu-trino background field. A discovery is claimed when thisprobability is below 2:8� 10�7, which corresponds to a 5r detec-tion. To obtain the p-value of an observation, we must thereforeknow the distribution of our test statistics under the back-ground-only hypothesis. In the MPS method, the test statistics isa function of the angular scale H. For each H examined, we mustconstruct the probability distribution of UðHÞ. The number ofbackground events in a given area A ¼ pH2 is produced by a Pois-son process; as a consequence, the number of pairs of backgroundevents within a distance H follows a Gamma distribution. How-ever, with the definition of event pairs in MPS, the parameters of
dec
(deg
)
30
31
32
33
34
35
36
37
38
39
40
0.5
1
1.5
2
2.5
3
3.5
4
4.5
(p_value)10
-log(p_value)
10-log
(a) Significance map of event densities at 0.5º scales
R.A. (deg)
dec
(deg
)
30
31
32
33
34
35
36
37
38
39
40
0
1
2
3
4
5
6
7
8
(c) Significance map of event densities at 1.5º scales
the Gamma distribution are difficult to estimate from observables,and we obtained the distributions with Monte Carlo simulations.
4. Analysis of the event pattern
In this section, we present our results about the ability of both astandard search method and the MPS method to find a significantneutrino events pattern over extended regions. The tests were per-formed over simulated skymaps, in which a region R of 10� � 10�
exhibits neutrino emission with some correlation structure (Sec-tion 2.1).
Standard search methods deal with the identification of hotspots, defined as a spatial concentration of events. The search forhot spots is done by mapping the sky using different techniques;the ones commonly used in neutrino astronomy are based oneither ‘‘classical’’ binned methods, or likelihood-based methodswith different degrees of sophistication in the modelling of thedata [37,38]. Regardless of the method used in the analysis, thesearches have been usually optimized for the discovery of point-like emission, and hence correlations of events beyond the singlepoint-source scale do not enter in the analysis. The explorationof the sky, seeking for sources of high energy neutrinos, is doneby superimposing a grid over the event distribution. Classical bin-ned methods count the number of events within a circular fixed-area bin centered at each of the nodes in the grid, resulting in esti-mates of the intensity of the processes that generate the observedevent pattern at each sample point. The grid step is much smallerthan the angular resolution achieved in the analysis, and the bin
(p_value)10
-log(p_value)
10-log
dec
(deg
)
30
31
32
33
34
35
36
37
38
39
40
1
2
3
4
5
(b) Significance map of event densities at 1º scales
dec
(deg
)
30
31
32
33
34
35
36
37
38
39
40
0
0.5
1
1.5
2
2.5
3
(d) Significance map of event densities at 2º scales
Fig. 4. Results from the binned scan over signal + background samples.
Y. Sestayo, E. Resconi / Astroparticle Physics 44 (2013) 15–23 19
size is usually optimized to have the best signal to noise ratio forpoint-sources. Likelihood methods use the same type of scan anal-ysis, but they give a probabilistic assignment of an event to a com-ponent (signal or background) according to its distance to the pointat which the intensity is being estimated. At each grid point, thelikelihood of a mixture model of signal plus background is com-
pared to a pure background hypothesis, and the region under studyis imaged as a probability density map.
The performance of both classical and likelihood methods aresimilar in terms of discovery, as long as they use the same eventinformation [37]. Given that the event density maps obtained froma binned analysis offer a clear visual inspection of the spatial event
0.20.40.60.811.21.41.61.822.2
(p_value)10
-log
(a) Significance map of event densities at 1ºscales in sample 1
Fig. 5. Results from the binned scan over background-only samples.
20 Y. Sestayo, E. Resconi / Astroparticle Physics 44 (2013) 15–23
pattern, as well as a more straightforward comparison with the re-sults from MPS, we used a classical binned method as the standardscan analysis of our simulated skymaps.
The scan of the test region of 10� � 10� was done in steps of0:25� � 0:25�. At each point, the local event density was measuredand compared to the one expected under the background hypoth-esis, where by local we mean within a fixed-area bin around thesample points.
Both the MPS and the binned scan of R were applied to back-ground + signal samples and the corresponding significances werecalculated with the p-value of the outcomes of each method. Theprobability distributions were computed after the analysis of nrandom background-only samples with both the MPS methodand with a binned scan of R. Each of these simulated data setsyields n event patterns with a different number NðnÞinside of back-ground events inside R. The average clustering function in thebackground case and its dispersion at different angular scales is ob-tained after applying MPS over n ¼ 104 background-only data sets.The obtained probability distributions were fitted to a Gamma dis-tribution. The binned scan was applied to the same background-only datasets and the distribution of the number of events withinthe search bin for each of the nodes in the grid was fitted to a Pois-son distribution.
In the next sections, we present our results under two differentscenarios: a situation of high signal to noise ratio (S/N), and a sit-uation in which the S/N is very low. The case of a high S/N under-lines the differences in the information extracted from the sameevent pattern with the two different methods used in this paper.The study of a low-signal case illustrates how the MPS and a stan-
dard scan of R deal with the background dominated samples char-acteristic of neutrino telescopes.
4.1. High S/N case
In this example a total of 100 signal events were injected ran-domly following the distribution of Fig. 1 convolved with a Gauss-ian with r ¼ 1, representative of the PSF of current neutrinotelescopes. On top of the signal, background events were randomlygenerated as explained in Section 2.2.
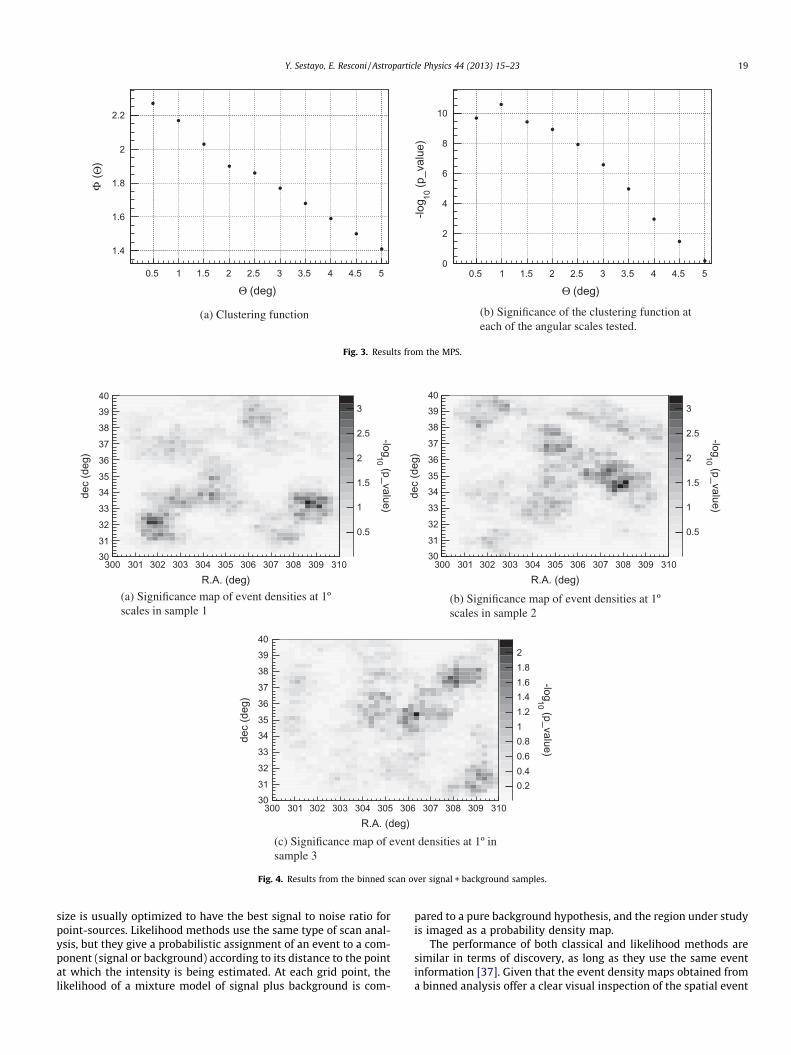
Fig. 2 shows a realization of the signal + background field im-aged as a significance event density map from the results of thebinned scan of R with circular bins of radius 0:5�;1�;1:5�;2�. In thissimulated data set, a total of Ninside ¼ 294 signal + backgroundevents have fallen within R, yielding a 6r excess of events insidethe entire R, clearly representing a high S/N case.
The appearance of the resulting images is a combination of di-verse effects: the spatial structure of the signal intensity field,the smearing of this signal because of the instrumental error inthe event locations, and the size of the search bin area. The signif-icances obtained then reflect the balance between the clustering ofthe signal at the scales of the search bin radius, and the scales atwhich random accumulation of background events is more proba-ble. A discovery (i.e. a p-value < 2:8� 10�7) is achieved when sam-pling the region with bins of 1:5� radius (Fig. 2(c)), but thesignificance drops considerably when observing at different angu-lar scales, and any information regarding the spatial structure ofthe signal within the region under examination is lost. However,this information is recovered when we study the spatial correla-
Y. Sestayo, E. Resconi / Astroparticle Physics 44 (2013) 15–23 21
tions between events with MPS. The results of the analysis of theregion with MPS are shown in Fig. 3. Fig. 3(a) shows the clusteringfunction of the events up to 5� scales, and Fig. 3(b) shows the sig-nificances obtained at each angular scale. The measured spatialcorrelations between events below 5� follow a power-law withexponential decay, consistent with the signal field that was usedin the simulations, and the discovery of the simulated astrophysi-cal neutrino signal goes up to angular scales of � 2:5�. Therefore,MPS results have the potential to discover a more complicatedstructure of a possible astrophysical neutrino signal than whatwas observed with the standard scan of the region.
4.2. Low S/N cases
In this example a total of 40 signal events were injected in theregion. With a background expectation of 207 events within R, thissituation corresponds to a background dominated sample. Thiscase exemplifies a more realistic situation, since a total of 40 signalevents present at the final sample of neutrino telescopes from a re-gion of 10� � 10� constitutes a more realistic situation given thecurrent effective areas of neutrino detectors and sources withmoderate neutrino fluxes [41].
We illustrate here three simulated examples of such situation.Fig. 4 shows the result of a 1� binned scan for three realizationsof the background field plus 40 signal events following the spatialdistribution of Fig. 1. The three cases are compatible with back-ground fluctuations, reaching a 3r level at most. Fig. 5 shows thesame scan, but in which signal events have been removed. The
dec
(deg
)
3031
32
33
3435
36
37
38
3940
0.5
1
1.5
2
2.5
3
3.5
(p_value)10
-log
(a) Significance map of event densities at 0.5ºscales in the combined sample
(degΘ0.5 1 1.5 2 2.5
(p_v
alue
)10
-log
0
1
2
3
4
5
6
(c) Significance of the clusterof the angular scales tested in
comparison of Figs. 4 and 5 manifests the random appearance ofevents even in the signal + background maps, where the most sig-nificant spots occurred always at random locations, as expected inbackground-only skymaps, but with a slightly higher significancedue to the additional presence of signal events in the region. Ifwe combine the three simulated samples (Figs. 6(a), 6)(b), corre-sponding to a larger period of data taking in the real situation,the S/N is still too low to produce a significant detection fromthe binned scan, and the minimum p-value achieved only reaches3r at 0:5� scales (Fig. 6)(a). If, in addition, we correct from the trialsassociated to the scan of an extended region, this significance isfurther reduced. However, although the significance of these indi-vidual spots is not enough for a detection, their distribution is notcommon of a random distribution of background events. This isillustrated when we use MPS to quantify the departures of thewhole event pattern within R from a distribution of backgroundevents. With MPS, the minimum p-value of the observed event pat-tern reaches 4:3r observation (Fig. 6)(c). The trial factors fromscanning several clustering scales with MPS are very small, andthe MPS post-trial significance remains practically unchanged,from the pre-trial p-value of 10�5:5 to a post-trial p-value of10�5:3, yielding also a 4:3r final result.
Therefore, in the typical situations of neutrino telescopes of lowS/N, the only hint of a possible neutrino signal would be the accu-mulation of relatively weak spots within the region which is be-lieved to be a factory of cosmic rays. As long as the S/N is low,these most significant spots do not necessarily have to appear atthe same location in the analysis of the same region in different
(b) Significance map of event densities at 1ºscales in the combined sample
)3 3.5 4 4.5 5
ing function at each the combined sample.
rom MPS over the combined sample.
22 Y. Sestayo, E. Resconi / Astroparticle Physics 44 (2013) 15–23
epochs, since they have an important background component,which fluctuates randomly within the region. The signal wouldbe missed by standard scan analysis, but could be detected by cor-relation analysis like MPS. Eventually, after some years of integra-tion time, the S/N would be high enough to overcome thebackground fluctuations, providing an image of the neutrino emis-sion in the region. But before this situation is achieved, we expectto find a distribution of neutrino events which departures signifi-cantly from the average distribution of background events, pro-vided there is some clustering of neutrino sources within theregion under examination.
5. Discussion
The discovery of high energy neutrino emission from a particu-lar region of the Galaxy would suggest a local injection of high en-ergy protons or heavier nuclei; as well as their interaction not veryfar away from their sources of origin, before they lose their energyby diffusion in Galactic magnetic fields [50,51]. Whereas the dis-covery of individual point sources of high energy neutrinos seemschallenging because of the limited sensitivity of neutrino detectors,the agglomeration of neutrino sources inside the same region ofthe sky could be detected as a significant departure from the distri-bution of atmospheric neutrino events. Such clustering of neutrinosources would be a natural consequence of the distribution of stel-lar matter in the Galaxy. Massive and young stellar populations,the birth sites of Galactic core-collapse supernova, are associatedto the spiral arms of the Milky Way, following a hierarchicalscheme where stars are grouped in clusters, and the stellar clustersthemselves form part of open cluster complexes.
Under the assumption that the explosion of a supernova is themost plausible energy source for cosmic ray acceleration in theGalaxy, we propose in this paper to search for neutrino emissionin the regions where massive stars die, that is, where the cosmicray acceleration process takes place in the supernova remnantshocks that form around the explosion site. Given the distributionof massive star clusters in the Galaxy, we can find such potentialcosmic ray factories at angular scales which could even reacharound � 10� or more, depending if we also want to considerclustering of potential accelerators due to projection effects. Thistype of search therefore implies the analysis of extended regions,much larger than the detector’s angular resolution. We emphasizethe usefulness of a search method which accommodates differentdegrees of complexity in the spatial distribution of astrophysicalneutrino events, and try to not restrict ourselves only to the caseof point-like emission. In this paper, we propose a method tosearch for neutrino emission from extended regions which takesinto account all these considerations, and that we convenientlynamed the Multi Point Source (MPS). Comparing to a singlesource search, the MPS would give a better result only if theemission deviates significantly from spherical symmetry, whereasit would be comparable to a standard binned search in the oppo-site case.
In situations in which the search for extraterrestrial neutrinosgoes beyond the single and spherically symmetric source ap-proach, we have shown that correlation analysis like MPS are ableto discover a significant neutrino event pattern inside the regionunder investigation with a higher significance than standardsearches, which scan the region looking for single sources.
In simulated examples of a high signal to noise ratio, where alsoa standard scan of the region results in a discovery, the MPS is pro-ven to be worth performing in order to extract information of theneutrino event pattern at different angular scales, where no signif-icant information is extracted from the scan. Even more interest-ing, given the current status of neutrino astronomy, is the case of
a very low S/N, where we have shown that even when the standardscan of a particular patch of the sky do not yield any hint of anastrophysical signal, MPS indicates the existence of astrophysicalneutrino signal inside the region under study.
The conclusions of this paper about the potential of the searchmethod we propose to discover neutrino emission with respect tostandard search strategies are independent on the spatial correlationfunction that we adopted for the simulations. The examples usedhere are hypothetical, and not attempt to describe the neutrinoemission from any particular region of the Galaxy, but to illustratethe usefulness of our method for detecting a significant event pat-tern even in strongly background dominated samples.
Acknowledgments
The authors are thankful to Aday Robaina for useful discussionsabout the two-point correlation function. Yolanda Sestayoacknowledges the financial support from J.M. Paredes throughICREA Academia.
References
[1] W.B. Atwood, A.A. Abdo, M. Ackermann, et al., ApJ 697 (2009) 1071.[2] J.A. Hinton, New Astronomy Review 48 (2004) 331.[3] MAGIC Collaboration, in: Nuclear Physics B Proceedings Supplements, vol. 175,
2008, p. 395.[4] T.C. Weekes, The VERITAS Collaboration 2010, <arXiv:1001.5305[astro-ph]>.[5] MILAGRO Collaboration, in: Nuclear Physics B Proceedings Supplements, vol.
151, 2006, p. 101.[6] P. Picozza, R. Sparvoli, O. Adriani et al., in: Particle Physics at the Year of
Astronomy, 2011, p. 200.[7] A.A. Abdo, M. Ackermann, M. Ajello, et al., Physical Review Letters 103 (2009)
251101.[8] A.A. Abdo, M. Ackermann, M. Ajello, et al., Physical Review Letters 102 (2009)
181101.[9] O. Adriani, G.C. Barbarino, G.A. Bazilevskaya, et al., Nature 458 (2009) 607.
[11] A.A. Abdo, M. Ackermann, M. Ajello, et al., ApJ 710 (2010) 133.[12] M. Ackermann, M. Ajello, A. Allafort, et al., A&A 538 (2012) A71.[13] M. Ackermann, M. Ajello, W.B. Atwood, et al., ApJ 750 (2012) 3.[14] A. Abramowski, F. Acero, F. Aharonian, et al., A&A 537 (2012) A114.[15] A.A. Abdo, B. Allen, D. Berley, et al., ApJ 658 (2007) L33.[16] V.A. Acciari, E. Aliu, T. Arlen, et al., ApJ 703 (2009) L6.[17] M. Ackermann, M. Ajello, A. Allafort, et al., Science 334 (2011) 1103.[18] F. Aharonian, A.G. Akhperjanian, A.R. Bazer-Bachi, et al., Nature 439 (2006)
695.[19] A.A. Abdo, B. Allen, T. Aune, et al., ApJ 688 (2008) 1078.[20] S.P. Wakely, D. Horan, in: International Cosmic Ray Conference, vol. 3, 2008, p.
1341.[21] E. Resconi, For the IceCube Collaboration, Nuclear Instruments and Methods in
Physics Research A 602 (2009) 7.[22] P.M.W. Kalberla, W.B. Burton, D. Hartmann, et al., A&A 440 (2005) 775.[23] T.M. Dame, D. Hartmann, P. Thaddeus, ApJ 547 (2001) 792.[24] E. Churchwell, B.L. Babler, M.R. Meade, et al., PASP 121 (2009) 213.[25] B.G. Elmegreen, 2011, <arXiv:1101.3111[astro-ph]>.[26] R. de la Fuente Marcos, C. de la Fuente Marcos, ApJ 672 (2008) 342.[27] N. Schneider, S. Bontemps, R. Simon, et al., A&A 458 (2006) 855.[28] Y.N. Efremov, Soviet Astronomy Letters 4 (1978) 66.[29] J.C. Higdon, R.E. Lingenfelter, ApJ 628 (2005) 738.[30] J. Stutzki, F. Bensch, A. Heithausen, V. Ossenkopf, M. Zielinsky, A&A 336 (1998)
697.[31] E. Falgarone, P. Hily-Blant, F. Levrier, Ap&SS 292 (2004) 89.[32] B.G. Elmegreen, J. Scalo, ARA&A 42 (2004) 211.[33] N. Schneider, S. Bontemps, R. Simon, et al., A&A 529 (2011) A1.[34] A. Khalil, G. Joncas, F. Nekka, ApJ 601 (2004) 352.[35] A. Lazarian, D. Pogosyan, ApJ 537 (2000) 720.[36] J. Braun, M. Baker, J. Dumm, et al., Astroparticle Physics 33 (2010) 175.[37] J. Braun, J. Dumm, F. de Palma, et al., Astroparticle Physics 29 (2008) 299.[38] J.A. Aguilar, J.J. Hernández-Rey, Astroparticle Physics 29 (2008) 117.[39] V.J. Martı́nez, E. Saar, Statistics of the Galaxy Distribution, Chapman Hall/CRC,
Boca Raton, 2002, ISBN 1584880848.[40] J. Salmon, ApJ 460 (1996) 59.[41] R. Abbasi, Y. Abdou, T. Abu-Zayyad, et al., ApJ 732 (2011) 18.[42] R. Abbasi, Y. Abdou, T. Abu-Zayyad, et al., Physics Review D 83 (2011) 012001.[43] A.R. Robaina, E.F. Bell, R.E. Skelton, et al., ApJ 704 (2009) 324.[44] P.J.E. Peebles, Research supported by the National Science Foundation,
Princeton University Press, Princeton, N.J., 1980, p. 435.
Y. Sestayo, E. Resconi / Astroparticle Physics 44 (2013) 15–23 23
[45] High Resolution Fly’s Eye (HIRES) Collaboration, in: Nuclear Physics BProceedings Supplements, vol. 136, 2004, p. 46.
[46] C.B. Finley, S. Westerhoff, Astroparticle Physics 21 (2004) 359.[47] R. Abbasi, M. Ackermann, J. Adams, et al., Physics Review D 79 (2009) 062001.
[48] M. Kerscher, I. Szapudi, A.S. Szalay, ApJ 535 (2000) L13.[49] S. Szapudi, A.S. Szalay, ApJ 494 (1998) L41.[50] D.F. Torres, H. Li, Y. Chen, et al., MNRAS 417 (2011) 3072.[51] M. Ahlers, P. Mertsch, S. Sarkar, Physics Review D 80 (2009) 123017.