Supplementary Figure 1 | Schematics of benzophenone chemistry for hydrogel bonding. Under UV irradiation, surface absorbed benzophenone is excited into a singlet state which is followed by conversion into a triplet state through intersystem crossing. The triplet-state benzophenone consecutively changes into benzophenone ketyl radical by abstracting a hydrogen from surrounding unreactive C-H bonds in elastomer polymer. Then benzophenone ketyl radical mediates the grafting of stretchy polymer networks of the hydrogel onto the reactive sites on the elastomer surface, generating benzopinacol as a final reaction product.
Transcript
Supplementary Figure 1 | Schematics of benzophenone chemistry for hydrogel bonding.
Under UV irradiation, surface absorbed benzophenone is excited into a singlet state which is
followed by conversion into a triplet state through intersystem crossing. The triplet-state
benzophenone consecutively changes into benzophenone ketyl radical by abstracting a hydrogen
from surrounding unreactive C-H bonds in elastomer polymer. Then benzophenone ketyl radical
mediates the grafting of stretchy polymer networks of the hydrogel onto the reactive sites on the
elastomer surface, generating benzopinacol as a final reaction product.
Supplementary Figure 2 | The effect of elastomer surface treatment on interfacial toughness
and failure modes of tough hydrogels bonded on elastomers. (a) The 90-degree peeling test is
used to measure (ASTM D 2861) the interfacial toughness of PAAm-alginate hydrogels bonded
on PDMS substrates treated with different concentrations of benzophenone solutions. Photos of
the peeling tests show two different modes of interfacial failure (i.e., adhesive failure of the
interface and cohesive failure of the hydrogel). (b) The measured peeling forces per width of the
hydrogel sheets adhered on PDMS for various concentrations of benzophenone used in the surface
treatment. (c) Summary of the measured interfacial toughness of hydrogel-PDMS hybrids for
various concentrations of benzophenone used in elastomer surface treatment. Values in c represent
mean and the error bars represent standard deviation of the measured interfacial toughness for each
concentration (n = 3-5).
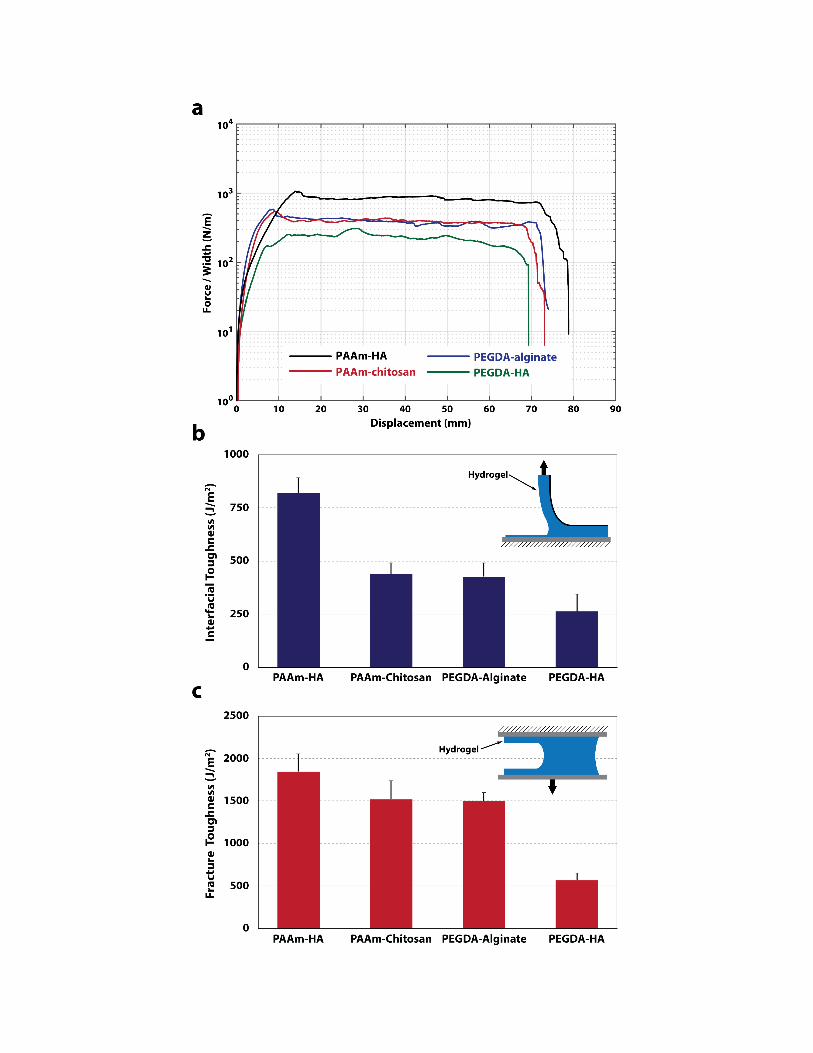
Supplementary Figure 3 | Interfacial toughness and fracture toughness of various as-
prepared tough hydrogels. (a) Typical curves of peeling force per hydrogel width vs.
displacement for various tough hydrogels bonded on PDMS substrates. (b) The measured
interfacial toughness for various as-prepared tough hydrogels bonded on PDMS substrates based
on 90-angle peeling test. (c) The measured fracture toughness for various as-prepared tough
hydrogels based on the pure-shear test23,43. Values in b,c represent mean and the error bars
represent standard deviation of measured interfacial toughness or fracture toughness for each tough
hydrogel (n = 3-5).
Supplementary Figure 4 | Typical curves of 90-degree peeling test for fully-swollen hydrogel
bonded on various elastomers. The curves of peeling force per width of hydrogel sheet vs.
displacement for various types of hydrogel-elastomer hybrids at fully-swollen state. Note that
curves labeled as PDMS, polyurethane, latex, VHB™ and Ecoflex® are based on fully-swollen
PAAm-alginate hydrogel bonded on these elastomers; while the curve labeled as Common is based
on fully-swollen PAAm hydrogel bonded on PDMS.
Supplementary Figure 5 | The 90-degree peeling test of hydrogels bonded on untreated
elastomer substrates. (a) Photos of the peeling process of as-prepared PAAm-alginate tough
hydrogel and PAAm common hydrogel physically-attached on PDMS substrates without
benzophenone treatment on PDMS surfaces. The failure occurs at the hydrogel-elastomer
interfaces. (b) Typical curves of peeling force per hydrogel width vs. displacement for as-prepared
PAAm-alginate tough hydrogel and PAAm common hydrogel physically-attached on PDMS
substrates. (c) The measured interfacial toughness for as-prepared PAAm-alginate tough hydrogel
and PAAm common hydrogel physically-attached on PDMS substrates. Values in c represent
mean and the error bars represent standard deviation of measured interfacial toughness for each
tough hydrogel (n = 3-5).
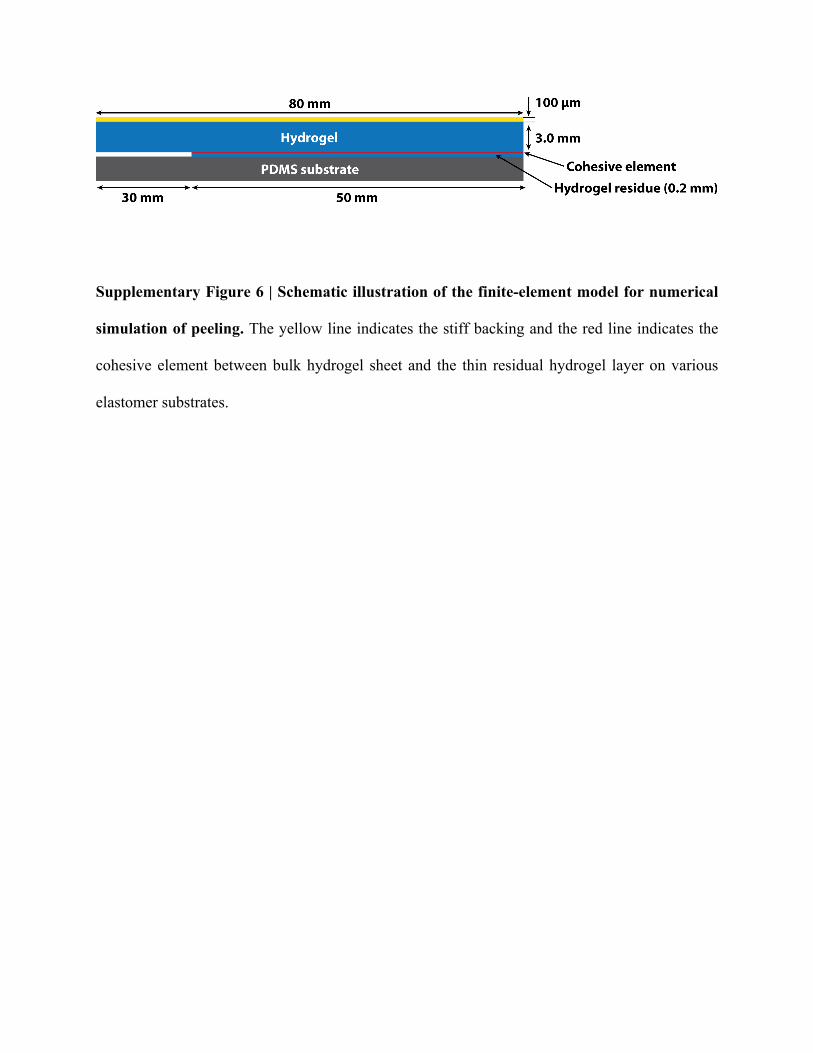
Supplementary Figure 6 | Schematic illustration of the finite-element model for numerical
simulation of peeling. The yellow line indicates the stiff backing and the red line indicates the
cohesive element between bulk hydrogel sheet and the thin residual hydrogel layer on various
elastomer substrates.
Supplementary Figure 7 | Experimental data and fitting with the Mullins effect model for
PAAm-alginate hydrogel1.
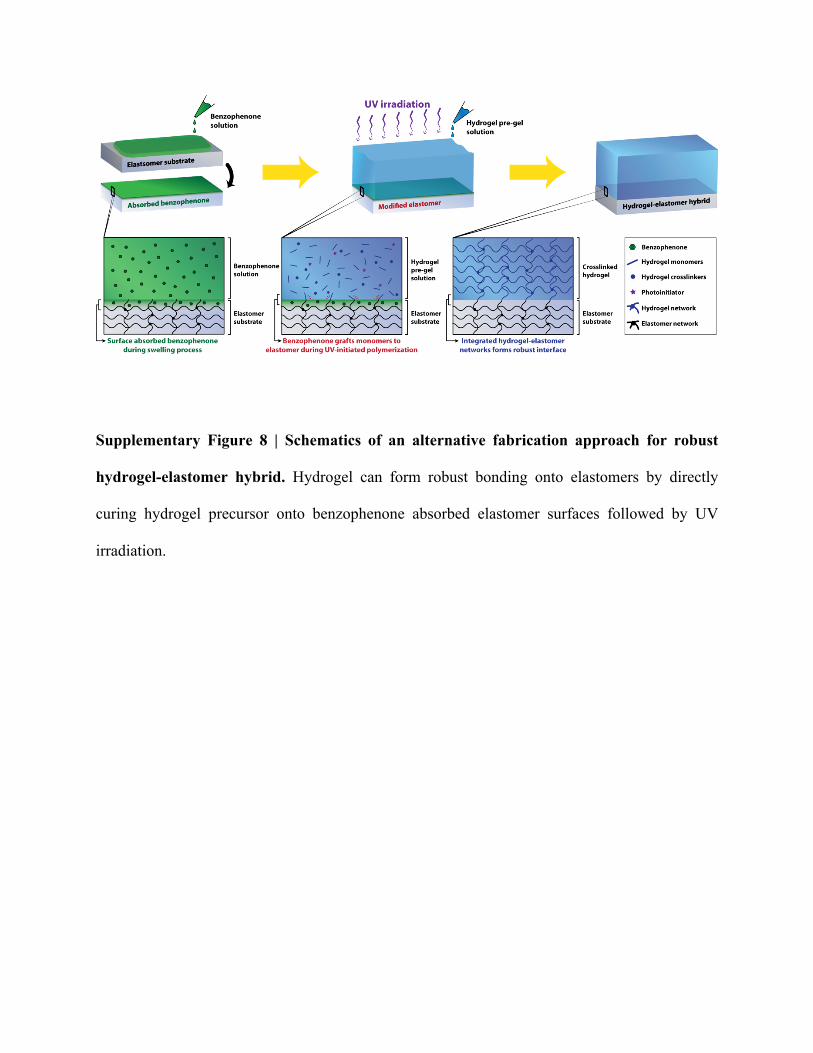
Supplementary Figure 8 | Schematics of an alternative fabrication approach for robust
hydrogel-elastomer hybrid. Hydrogel can form robust bonding onto elastomers by directly
curing hydrogel precursor onto benzophenone absorbed elastomer surfaces followed by UV
irradiation.
Supplementary Figure 9 | The effect of anti-dehydration elastomeric coatings on mechanical
property of bulk hydrogels. Uniaxial tension is used to test PAAm-alginate hydrogels with and
without the Ecoflex® anti-dehydration coatings. The stress-stretch curves of the two samples under
large deformation show no significant difference, owing to the much lower thickness (100 µm)
than the hydrogel, low modulus (~ 30kPa) and high stretchability (~ 7 times) of Ecoflex®.
Supplementary Figure 10 | The electrical property of conductive hydrogel on elastomer
under deformation. (a) The electrical property of ionically conductive PAAm-alginate tough
hydrogels adhered on Ecoflex® is measured using four-point method. (b) The electrical resistance
of the conductive hydrogel on Ecoflex® substrate remains almost the same after 100 cycles of
stretch to 3.5 times. In addition, the relation between resistance and stretch follows R/R0 = 𝜆2,
where R0 is the resistance before deformation and R is the resistance after stretch of 𝜆 from the
initial state.
Supplementary Reference
1 Sun, J.-Y. et al. Highly stretchable and tough hydrogels. Nature 489, 133-136 (2012).


![Toxicological Studies on Benzophenone-Type UV Filters: … · 2020-07-03 · BH Benzhydrol BP Benzophenone BP-d10 Benzophenone-d10 [B] + Base peak ion CDFBS Charcoal dextran-treated](https://static.documents.pub/doc/80x56/5fa674776daa1d425832f9d7/toxicological-studies-on-benzophenone-type-uv-filters-2020-07-03-bh-benzhydrol.jpg)


